Abstract
There is an urgent need to seek new molecular biomarkers helpful in diagnosing and treating breast cancer. In this elaboration, we performed a molecular analysis of mutations and expression of genes within the PI3K/Akt/mTOR pathway in patients with ductal breast cancer of various malignancy levels. We recognized significant correlations between the expression levels of the studied genes. We also performed a bioinformatics analysis of the data available on the international database TCGA and compared them with our own research. Studies on mutations and expression of genes were conducted using High-Resolution Melt PCR (HRM-PCR), Allele-Specific-quantitative PCR (ASP-qPCR), Real-Time PCR molecular methods in a group of women with ductal breast cancer. Bioinformatics analysis was carried out using web source Ualcan and bc-GenExMiner. In the studied group of women, it was observed that the prevalence of mutations in the studied PIK3CA and AKT1 genes was 29.63%. It was stated that the average expression level of the PIK3CA, PIK3R1, PTEN genes in the group of breast cancer patients is lower in comparison to the control group, while the average expression level of the AKT1 and mTOR genes in the studied group was higher in comparison to the control group. It was also indicated that in the group of patients with mutations in the area of the PIK3CA and AKT1 genes, the PIK3CA gene expression level is statistically significantly lower than in the group without mutations. According to our knowledge, we demonstrate, for the first time, that there is a very strong positive correlation between the levels of AKT1 and mTOR gene expression in the case of patients with mutations and without mutations.
1. Introduction
The PI3K/Akt/mTOR pathway plays an important role in the regulation of the cells’ cycle; it impacts the development and differentiation of cells [1,2,3,4,5,6,7]. The PI3K/Akt/mTOR signaling pathway plays an important role in the processes of tumorigenesis. Gene mutations within the PI3K/Akt/mTOR pathway are identified in numerous types of malignancies, among others, lung cancer, brain cancer, colorectal cancer, ovarian cancer, breast cancer and uterus cancer [3,8,9,10,11,12,13,14,15].
Currently, numerous studies have been conducted, with the purpose to obtain profound knowledge on the function of the PI3K/Akt/mTOR pathway and its role in cancer cells. This will allow for the introduction of new treatment plans with the application of PI3K, Akt and mTOR kinase inhibitors, which constitute the main elements of the pathway. Multiple inhibitors of the PI3K/Akt/mTOR pathway are in preclinical or clinical trials. There are promising data indicating that rapalogs or inhibitors of PI3K/Akt are active in breast cancers [6,16,17,18,19,20]. In cancer treatment, various therapeutic procedures are used, including polytherapies. In the treatment of breast cancer, PI3K, mTOR Act kinase inhibitors are also used with increasing frequency; therefore, we compared the level of gene expression associated with the PI3K/Akt/mTOR pathway with and without mutations in breast cancer patients.
The association concerning the presence of mutations and changes in the expression of genes within the PI3K/Akt/mTOR pathway, as well as their impact on breast cancer prognosis, have been evaluated by many studies. However, the results of these studies are still inconclusive, i.e., some studies showed favorable impacts, some studies showed adverse impacts and other papers did not show any prognostic significance [4,21,22,23,24,25,26,27,28,29,30,31,32,33].
In order to extend the knowledge, we assessed the prevalence of the E542K, E545K, H1047R mutations within the PIK3CA gene and the E17K mutation within the AKT1 gene, and the expression of the PIK3CA, PIK3R1, PTEN, AKT1, mTOR genes in a cohort of patients with breast cancer. We evaluated the relation between the studied features and patients’ age, and the histological malignancy level of tumors, lymph node metastasis, ER, PR, HER2 status and Ki-67 index were determined. Moreover, we performed a bioinformatics analysis of the data available on the international database TCGA and compared them with our own research.
2. Results
2.1. Results of the Mutation Analysis of Selected Genes
Using PCR-based techniques described in the Methods Section, we identified gene mutations related to the PI3K/Akt/mTOR pathway in 29.63% (16/54) of breast cancer patients.
The PIK3CA gene mutations in exon 9 were in 5.56% (3/54) of the studied cohort-1.85% and 3.7% were distinguished as E542K (c.1624G>A) and E545K (c.1633G>A) substitutions, respectively. Moreover, substitution H1047R (c.3140A>G) in exon 20 of PIK3CA gene was observed in 18.52% (10/54) of patients. While the E17K (c.49G>A) substitution in exon 4 of the AKT1 gene was observed in 7.4% (4/54) of patients (Table 1). In one patient, both the E545K mutation in the PIK3CA gene and the E17K mutation in the AKT1 gene were observed simultaneously.

Table 1.
Prevalence of mutations in all patients participating in the study.
The results of our study indicated that, in the group of female patients in whom mutations in the PIK3CA and AKT1 genes were observed, the Ki-67 index was significantly lower than in the group of female patients without mutations (p = 0.020). Moreover, the frequency of detected mutations does not depend on the patients’ age, lymph node metastasis, ER, PR or HER2 status and Bloom Richardson Scale (Table 2, Table S1).
Table 2.
Prevalence of mutations depending on clinical parameters.
2.2. Results of the Expression Analysis of Selected Genes
2.2.1. The Expression Level of Studied Genes—Comparison between Our Results and Those Contained in the TCGA Database
The expression level of five genes: PIK3CA (1. exon 20–21, 2. exon 9–10) PIK3R1, PTEN, AKT1, mTOR, was obtained using the real-time PCR technique in 54 breast cancer patients. It was indicated that the average expression level of the PIK3CA, PIK3R1, PTEN genes in the studied group was lower in comparison to the control group; while the average expression level of the AKT1 and mTOR genes was higher in the studied group in comparison to the control group (Figure 1F). Data contained in the TCGA database show the results of studies on the expression of genes tested using the sequencing method. The analysis of the data contained in TCGA confirmed a lower level of PIK3CA, PIK3R1 and PTEN gene expression in breast cancer tissues compared to normal tissues and a higher level of the AKT1 gene. The expression level of the mTOR gene between the neoplastic and normal tissue did not differ (Figure 1A–E). Accurate statistical significance located in the Table S2.
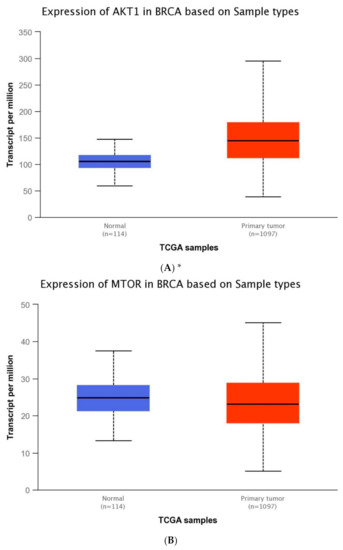
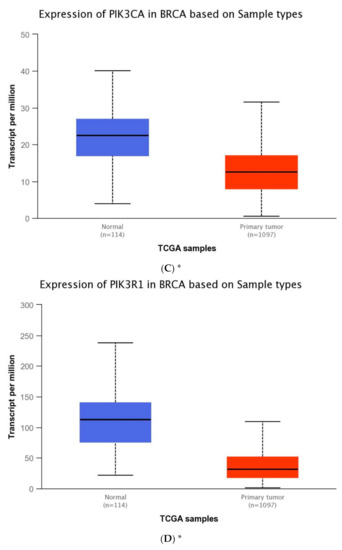
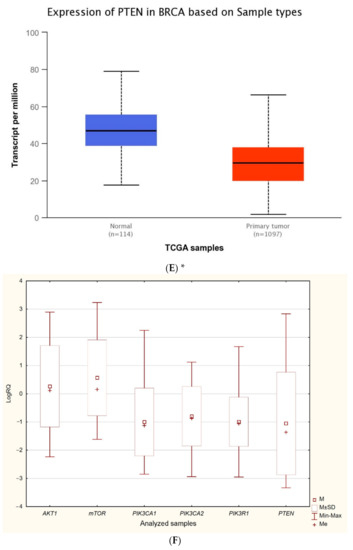
Figure 1.
Differences between the expression level of the genes within the PI3K/Akt/mTOR pathway in normal tissues and breast cancer in the TCGA samples: AKT1 (A), MTOR (B), PIK3CA (C), PIK3R1 (D), PTEN (E) (web source the Ualcan) and in analyzed samples (F) * p < 0.05.
2.2.2. The Expression Level of Studied Genes Depending on the Presence of Mutations
We demonstrated that, in the group of patients harboring the studied mutations in the PIK3CA and AKT1 genes, the level of the PIK3CA gene expression was significantly lower than in the group of patients without mutations (PIK3CA 1. p = 0.006, 2. p = 0.034). While the expression level of the PTEN, PIK3R1, AKT1 and mTOR genes does not depend on the presence of mutations (Figure 2, Table 3, Table S3).
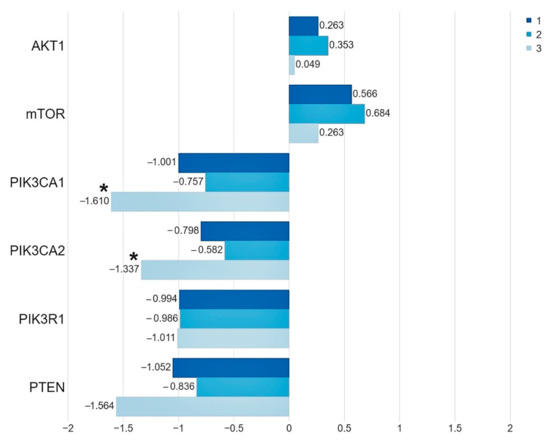
Figure 2.
The mean expression level (expressed in logRQ) of the studied genes related to the PI3K/Akt/mTOR pathway in the: (1) entire studied group; (2) in the group of patients without mutations; (3) in the group of patients with mutations * p < 0.05.
Table 3.
The expression level of studied genes depending on the presence of mutations.
An analysis of the differences between the expression levels of the studied genes showed statistically significant differences between the AKT1, mTOR gene expression levels and the PIK3CA, PIK3R1, PTEN gene expression levels in the group of patients without mutations and with mutations (Figure 3).
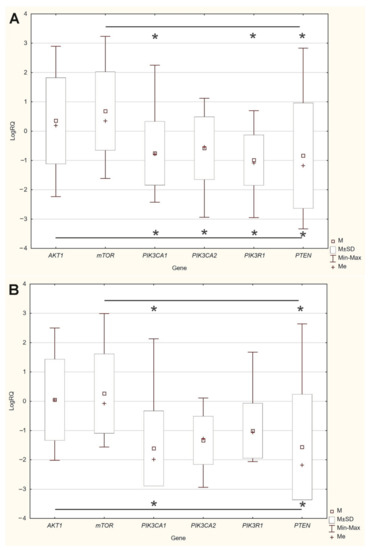
Figure 3.
Differences between the expression level of the studied genes: (A) in the group of patients without mutations; (B) in the group of patients with mutations * p < 0.05.
2.2.3. The Expression Level of the Studied Genes Depending on Clinical Parameters—Comparison between Our Results and Those Contained in the TCGA Database
The results of our study indicated that the expression levels of the AKT1 (p = 0.0377) and PTEN (p = 0.0111) genes do depend on the HER2 status. The expression level of the PIK3CA, PIK3R1 and mTOR genes does not depend on the HER2 status. It was also found that the expression levels of the AKT1 (p = 0.0317), mTOR (0.0154) and PTEN (p = 0.0202) genes do depend on the Bloom Richardson Scale. Moreover, it was stated that the expression level of the PIK3CA, PIK3R1, PTEN, AKT1, mTOR genes does not depend on the patients’ age, lymph node metastases, ER, PR status and Ki-67 index (Table 4, Figure 4, Tables S4–S9).
Table 4.
The expression level of the studied genes in depending on clinical parameters in analyzed samples and TCGA samples (web source the bc-GenExMiner).
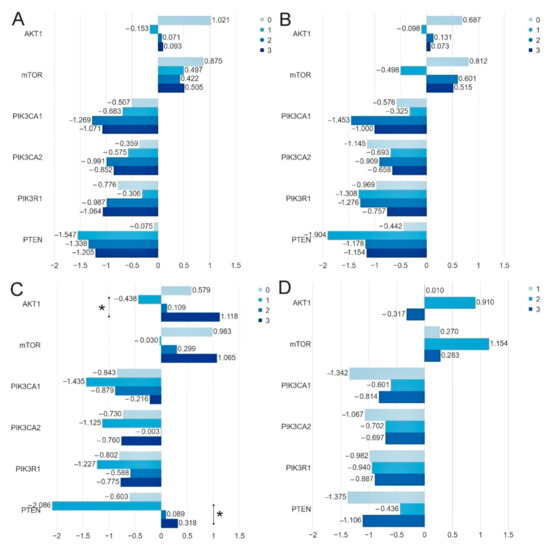
Figure 4.
Comparison of the mean expression level (expressed in logRQ) of the studied genes depending on the: (A) ER-0 (−), 1 (1+), 2 (2+), 3 (3+); (B) PR-0 (−), 1 (1+), 2 (2+), 3 (3+); (C) HER2-0 (−), 1 (1+), 2 (2+), 3 (3+) status and (D) Ki-67 index-1 (≤10%), 2 (>10%-≤ 50%), 3 (>50%-≤90%) in the entire study group * p < 0.05.
Using the bc-GenExMiner web source, we analyzed the expression of the studied genes depending on the clinical parameters (age, ER, PR, HER2 and node status). Analysis of data in the TCGA database showed statistically significant differences between the expression of selected genes and with the following clinical parameters: ER status-AKT1 (p = 0.0004), PIK3CA (p = 0.0285), PIK3R1 (p = 0.0039) and PTEN (<0.0001); PR status-PIK3R1(<0.0001), PTEN(<0.0001); HER2 status-AKT1 (p = 0.0002), PTEN (p = 0.0227) nodes status-PIK3R1 (p = 0.0228) (Table 4, Figures S1–S5). Differences between our results and those contained in the TCGA database may result from a relatively small group of patients participating in our study. Differences may also result from the dissimilarity of the surveyed group (the population comes from Poland). Therefore, there is a need to confirm them in an independent cohort of patients.
The conducted analysis the data available on international database TCGA using the Kaplan–Meier Plotter (web source the Ualcan) showed that no clear relation between expression level of the studied genes and breast cancer patients survival-AKT1 (p = 0.44), MTOR (p = 0.79), PIK3CA (p = 0.14), PIK3R1 (p = 0.48), PTEN (p = 0.25) (Figure S6).
2.2.4. The Correlation between the Expression Levels of Studied Genes—Comparison between Our Results and Those Contained in the TCGA Database
The results of the correlation analysis showed a statistically significant correlation between all genes except for PIK3CA (2) and mTOR. Using the bc-GenExMiner web source, we conducted a correlation analysis of the data available on the TCGA database between the studied genes. The analysis confirmed the existence of statistically significant correlations between all the studied genes except for AKT1 and PIK3R1 (Figure 5, Tables S10 and S11, Figures S7–S16).
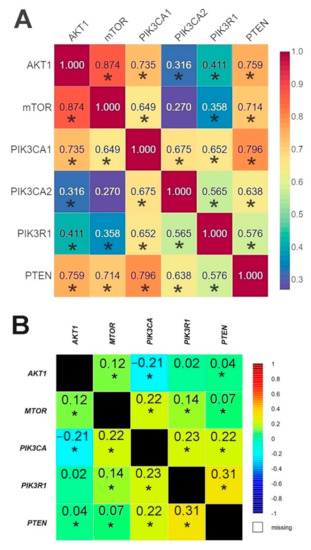
Figure 5.
Comparison of the correlation between the expression level of the studied genes in the analyzed patients using Spearman’s rank correlation coefficient (A) and patients from TCGA database using Pearson’s correlation coefficient (B) (web source the bc-GenExMiner) * p < 0.05.
The r-Spearman analysis showed a high correlation between the expression of the AKT1 and mTOR genes in the group of patients without mutations, and in the group of patients with mutations (Figure 6, Tables S12–S13).
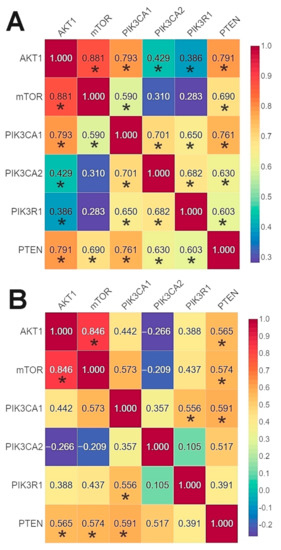
Figure 6.
Correlation between the expression level of the studied genes using Spearman’s rank correlation coefficient: (A) in the group of patients without mutations; (B) in the group of patients with mutations * p < 0.05.
The first group of genes which indicated a strong relation with one another included the AKT1 and mTOR genes–a strong dependency between these genes was observed in all analyzed cases. The second group included the PIK3CA, PIK3R1 and PTEN genes where the relation between the studied genes was weaker than in the first group (Figure 7).
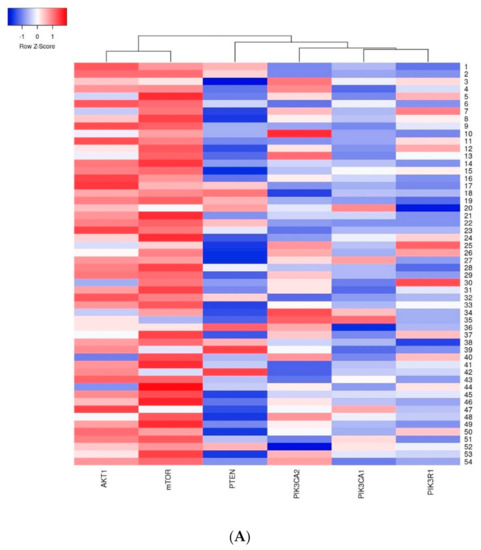
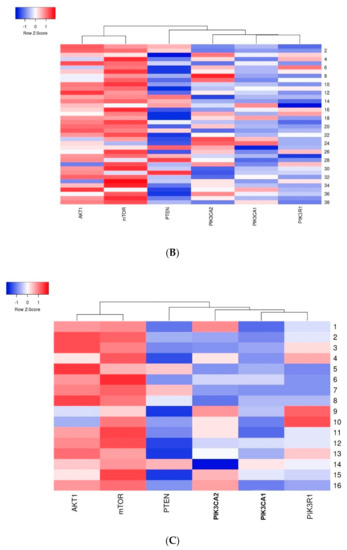
Figure 7.
Heatmap presenting a clustering analysis of the expression level of the studied genes (clustering method: average linkage; Euclidean distance measurement method): (A) in the entire studied group; (B) in the group of patients without mutations; (C) in the group of patients with mutations.
3. Discussion
The conducted study allowed us to compare the clinical and molecular features, such as age, lymph node metastasis, ER, PR, HER2 status, Ki-67 index and the histopathological malignancy level with the mutations and expressions of genes related to the PI3K/Akt/mTOR pathway in breast cancer. Moreover, performed a bioinformatics analysis allowed us to compare the data available on the international database TCGA with our own research. PIK3CA and AKT1 gene mutations are observed in numerous types of cancers, including breast cancer. The most frequent mutations in the PIK3CA gene occur in exon 9 and exon 20 (approx. 17–40%) [12,13,14,34,35,36,37,38]. Meanwhile, the most frequent mutation in the AKT1 gene (E17K substitution) is observed in approx. 4% of breast cancer patients [4,13,38,39,40,41]. The prevalence of PIK3CA (E542K, E545K, H1047R) and AKT1 (E17K) mutations among our patients are compliant with the results obtained by authors conducting similar studies and they refer to 24% and 7.4%, respectively. Moreover, their prevalence does not depend on the patients’ age, lymph node metastasis and the level of histopathological malignancy of tumors. Additionally, in the literature, no clear relationship between PIK3CA mutations and lymph node metastasis or histopathological diagnosis was observed [25,36,42,43,44]. In most of the analyzed publications, a significant relationship between the prevalence of mutations and the expression of the ER and PR receptors was observed [4,45]. In our cohort, the detected mutations do not depend on the expression level of those receptors. In recent years, numerous papers dedicated to the expression of genes and proteins related to the PI3K/Akt/mTOR pathway in breast cancer have been created. Moreover, the relation between their expression and gene mutation was described [1,33,46,47,48,49,50,51,52,53,54]. Additionally, the results of our study indicated that in the group of female patients in whom mutations in PIK3CA (E542K, E545K, H1047R) and AKT1 (E17K) genes were observed, the expression level of the PIK3CA gene was significantly lower than in the group of female patients without mutations. Moreover, the existence of a very high correlation between the expression levels of the AKT1 and mTOR genes was also in that study for the first time. Palimaru et al. demonstrated that both PIK3CA and PTEN gene expressions were significantly increased in breast carcinoma tissue compared to normal breast tissue (p = 2 × 10⁻¹¹) and (p < 0.001), respectively. PIK3CA mutations were present in 68 out of 175 patients (39%) but were not associated with PIK3CA expression (p = 0.59). Additionally, the expressions of PIK3CA and PTEN mRNA, and PIK3CA mutations in breast carcinomas were not associated with the presence of lymph node metastases [51]. Cizkova et al. presented the results of the analysis of the PIK3CA, PIK3R1 and AKT1 mRNA expression levels, which were assessed in the whole series of 458 samples. PIK3R1 underexpression was found in 283 (61.8%) cases, indicating a relevant tumor alteration occurring in the majority of tumor samples. PIK3CA was deregulated in only a minority of tumor samples: overexpressed in 18 (3.9%) and underexpressed in 40 (8.7%) cases. AKT1 overexpression was present in 116 (25.3%) of the 458 available samples. In the authors’ own studies–similarly to the studies conducted by Cizkova et al.–PIK3R1 underexpression (46; 85.19% cases) and AKT1 overexpression (29; 53.7% cases) was observed [52]. Kim JY et al. demonstrated that nine out of ten PIK3CA mutations occurred at known hotspots: E545, H1047, and G1049, without a relationship between the gene mutation and expression. Moreover, they did not find a correlation between the genetic mutation and expression of the PIK3CB, PIK3CD, PIK3CG, PTEN genes [33]. In a publication by Mutee et al., a significantly higher number of breast cancer tissues were found to express the mTOR protein in various grades of intensity as compared to normal breast tissues. However, there were no significant relationships between clinicopathological variables (age group, clinical stage and receptor status) and mTOR protein expression (n = 78 breast cancer tissues and n = 53 of normal breast tissues) [46]. Additionally, Cheng et al. demonstrated that among the 71 cases of breast cancer tissues, 54.9% were mTOR-positive and exhibited a significantly higher expression than the 32 cases of normal tissues (21.9%) [54]. We analyzed the data present on the PI3K/Akt/mTOR pathway in breast cancer available on international databases—The Cancer Genome Atlas—and compared them with our own research. The analysis of the data contained in TCGA confirmed the lower level of PIK3CA, PIK3R1 and PTEN gene expression in breast cancer tissues compared to normal tissues and a higher level of AKT1 gene. Additionally confirmed was a statistically significant difference between the expression of the AKT1, PTEN genes and HER2 status. Moreover, the correlation analysis confirmed a statistically significant correlation between the majority of the studied genes. Differences between our results and those contained in the TCGA database may result from a relatively small group of patients participating in our study. Therefore, there is a need to confirm them in an independent cohort of patients. The publication by the TCGA program entitled “The Comprehensive molecular portraits of human breast tumours” analysed primary breast cancers among others in terms of mutations and mRNA-expression. The results of these studies indicate the importance of mutations in the PIK3CA gene in various types of breast cancer [55]. Studies conducted in recent years also point to the significance of the mutation of genes related to the PI3K/Akt/mTOR pathway and the level of expression of other genes, such as CALM1, SLC4A8, NRK, CCNE1 [33,56].
4. Materials and Methods
4.1. Characteristics of the Studied Group
The studied material was obtained from tumor tissue perpetuated in paraffin blocks. The control population consisted of 11 female patients with mastopathy (age median ± SD:54 ± 13.53 range: 46–82). The cohort comprised 54 female patients with diagnosed ductal breast cancer (age median ± SD:58 ± 12.67, range: 37–92). In the analyzed population, the histological malignancy level of tumors, lymph node metastasis, ER, PR, HER2 status and Ki-67 index was determined. Specific characteristics of the studied group were presented in Table 5. The study was approved by the Bioethics Commission of the Medical University of Lublin–resolution no. KE-0254/135/2014.
Table 5.
Characteristics of the studied group.
4.2. Analysis of the Mutations of Selected Genes within the PI3K/Akt Pathway
DNA was extracted using the QIAamp DNA FFPE Tissue Kit (Qiagen, Hilden, Germany) according to the manufacturer’s instruction.
The estimation of the PIK3CA gene mutations (substitutions E542K, E545K, H1047R) was conducted using two methods based on a quantitative real-time PCR (qPCR). The High-Resolution Melt PCR (HRM-PCR) technique was used as a screening method with DNA intercalating dye and two pairs of primers flanking the mutated site of the PIK3CA gene. One pair of primers was flanking the mutations located in exon 9 (substitutions E542K and E545K) and the second pair of primers was flanking a mutation located in exon 20 (substitution H1047R). The reaction was performed according to the protocol described previously [57]. A comparison of the amplification and melting curves in the positive and negative controls allowed us to distinguish the mutant (mt) and wild-type (wt) samples–Figure 8A. To confirm the results of the HRM-PCR screening tests and identifications of diagnosed mutations in the PIK3CA gene, a reaction of the allele-specific and quality PCR was carried out. In addition, the design of the technique and result analysis was previously described [57] and shown in Figure 8B.
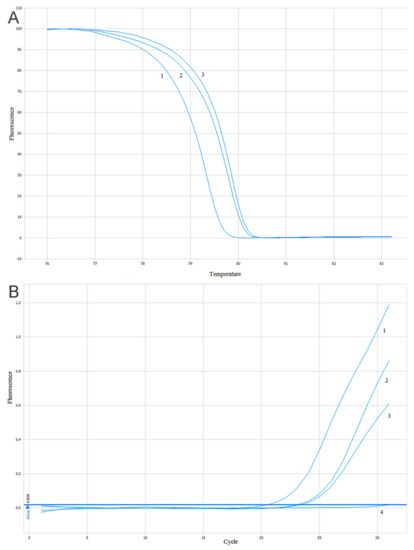
Figure 8.
Sample analysis of the results of the High-Resolution Melt PCR (HRM-PCR) and Allele-Specific-quantitative PCR ASP-qPCR reactions: (A) analysis of the melting curves of the HRM-PCR reaction products for the PIK3CA gene. 1. Negative control. 2. Studied sample. 3. Positive control; (B) analysis of the ASP-qPCR reaction product amplification for the PIK3CA gene. 1. Negative control. 2. Studied sample. 3. Positive control. 4. Negative DNA control [57].
The positive control of the analysis was the HRM and ASP reactions with DNA from the PIK3CA gene mutation-positive cell-lines (SW48 cell-line: substitution E542K; MCF10A cell-line: substitution E545K and H1047R) that were provided by Horizon Discovery (Horizon Discovery, Cambridge, UK ). The negative control was determined with DNA isolated from peripheral blood leukocytes of healthy individuals.
Mutation in the AKT1 gene (E17K substitution) was assessed using hydrolyzing molecular probes TaqMan™ Mutation Detection Assays (Hs00000986_mu, Hs00001010_rf) (Applied Biosystems, Foster City, CA, USA ). The reaction was performed on 96-well reaction plates in a 7300 Real-Time PCR System device (Applied Biosystems, Foster City, CA, USA) in steps recommended by Applied Biosystems. The amplification protocol included the following steps 95 °C for 10 min and 92 °C for 15 s, 58 °C for 1 min. for five cycles, followed by 92 °C for 15 s, 60 °C for 60 s for 40 cycles [58].
4.3. Analysis of the Expression Level of Selected Genes within the PI3K/Akt/mTOR Pathway
RNA was extracted using the commercial MagMAX™-96 for Microarrays Total RNA Isolation Kit (Thermo Fisher Scientific, Waltham, MA, USA) in accordance with the manufacturer’s instruction and assessed using the NanoDrop ND-1000 spectrophotometer (Thermo Fisher Scientific, Waltham, MA, USA).
To perform the analysis of the expression level of selected genes, the reverse transcription reaction was conducted to obtain cDNA on the mRNA matrix using the High Capacity cDNA Reverse Transcription Kit (Applied Biosystems, Foster City, CA, USA) reagents in accordance with the manufacturer’s instruction.
To mark the expression level, a comparison of the gene expression level in the studied samples (n = 54) with the gene expression level in the control sample (calibrator, n = 11) was performed using the TaqMan Gene Expression Assays probe and starts with the complementary sequence to the sequence of two neighboring exons of the studied genes-PIK3CA–first Hs00907957_m1 (exon 20–21), second Hs00907965_m1 (exon 9–10), PIK3R1-Hs00933163_m1, AKT1-Hs00178289_m1, PTEN-Hs02621230_s1, mTOR-Hs00234522_m1, GAPDH-Hs99999905_m1. (Applied Biosystems, Foster City, CA, USA).
The cDNA, was amplified by real-time gene expression analysis (qPCR) using the manufacturer’s SDS software (Applied Biosystems, Foster City, CA, USA). Triplicate qPCR reactions were conducted for each sample. A blind trial was always performed without a DNA target in order to exclude reagent contamination by foreign DNA. The reagents were mixed according to manufacturer protocol to reach 25 μL of reaction mixture, including 11.25 of cDNA.
The reaction was performed in 96-well plates using a 7900HT Real-Time Fast System device (Applied Biosystems, Foster City, CA, USA) in the following stages: initial denaturation: 95 °C, 10 min, and 40 cycles, each composed of two temperatures: 95 °C, 15 s, and 60 °C, 1 min.). The number of PCR cycles after which the level of fluorescence exceeded the defined threshold cycle (CT) RQ Study Software (Applied Biosystems, Foster City, CA, USA) was used to calculate the number of examined DNA molecules present in the mixture at the onset of the reaction. The CT value for each sample of the endogenous control gene was used to normalize the level of the interesting gene expression. The relative level of gene expression was calculated according to the formula. Calculations of the CT differences between the target gene and the reference gene are presented below: for the examined breast cancer: ΔCT breast cancer sample = CT target gene from breast cancer sample—CT reference gene, breast cancer sample and for mastopathy (control sample): ΔCT calibrator = CT target gene from control sample CT reference gene, control sample. Normalizing the ΔCT of the breast cancer sample to the ΔCT of the calibrator ΔΔCT = ΔCT breast cancer sample–ΔCT calibrator. The relative expression (RQ) of patients’ genes was calculated by the following formula: RQ = 2–ΔΔCT. Finally, the RQs were analyzed after their logarithmic conversion into the logarithm of RQ (LogRQ). Thus, the obtained results were legible as follows: LogRQ = 0: no difference between gene expression in the calibrated samples and the studied group. LogRQ < 0: decreased gene expression in the studied group, whereas LogRQ > 0: increased gene expression in the studied group compared to the calibrated sample [59,60,61].
4.4. Analysis of the Data Present on the PI3K/Akt/mTOR Pathway in Breast Cancer Available on International Database TCGA
For in-depth analysis of the data contained in The Cancer Genome Atlas (TCGA) data, used publicly available online sources Ualcan—http://ualcan.path.uab.edu/ (accessed on 19 February 2021) and The Breast Cancer Gene-Expression Miner v4.5 (bc-GenExMiner v4.5, http://bcgenex.centregauducheau.fr/BC-GEM (accessed on 19 February 2021)) [62,63,64].
4.5. Statistical Analysis
U Mann–Whitney test, χ2 Pearson test, Kruskal–Wallis test and r-Spearman correlation coefficient were performed using STATISTICA vs. 17. The results were considered statistically significant at p < 0.05. Heatmaps of gene expression were made using the Heatmapper program [65].
5. Conclusions
In summary, the results of our study and data available on the international database TCGA indicated that the PI3K/Akt/mTOR pathway plays an important role in breast cancer. We demonstrated that in the group of female patients in whom mutations in the PIK3CA and AKT1 genes were observed, the level of PIK3CA gene expression was statistically significantly lower than in the group of female patients without mutations. Moreover, the presence of mutations does depend on the Ki-67 index; however, it does not depend on the patients’ age, lymph node metastasis, ER, PR or HER2 status and histopathological malignancy level. According to our knowledge, we demonstrated, for the first time, that there is a very strong positive correlation between the levels of AKT1 and mTOR gene expression in the case of patients with mutations and without mutations. There is a need to confirm our research in an independent cohort of patients. Currently, studies are being conducted on the presence of mutations and changes in the expression of the PIK3CA, AKT and mTOR genes in breast cancer; however, the results of these studies are still inconclusive and require further experiments. The presence of mutations and changes in the expression of genes related to the PI3K/Akt/mTOR pathway can constitute a useful diagnostic biomarker and may contribute to the development of new, effective and targeted breast cancer treatment methods.
Supplementary Materials
Supplementary Materials can be found at https://www.mdpi.com/1422-0067/22/4/2061/s1
Author Contributions
Conceptualization, P.K., A.B.-K.; methodology, P.K., M.N., A.B.-K., P.A.K., A.K., T.K.; formal analysis, P.K., A.B.-K. and M.N.; investigation, P.K., A.B.-K. and M.N.; data curation, P.K., A.B.-K., J.K. and B.M.-C.; writing—original draft preparation, P.K., A.B.-K, M.N., J.K., J.B., E.K. and A.M.-K.; writing—review and editing, P.K., M.N., A.B.-K., J.K., B.J.P. and D.Z.; visualization, P.K., A.B.-K., J.B. and M.N.; supervision, P.K., A.B.-K., M.N.; project administration, P.K., A.B.-K.; funding acquisition, A.B.-K., P.K. All authors have read and agreed to the published version of the manuscript.
Funding
This research was funded by the Statutory Funds of the Medical University of Lublin No. DS43 (A.B.-K.) and MNmb15 (P.K.), provided by the Polish Ministry of Science and Higher Education.
Institutional Review Board Statement
The study was conducted according to the guidelines of the Declaration of Helsinki, and approved by the Institutional Review Board (or Ethics Committee) of Bioethics Commission of the Medical University of Lublin, Poland (protocol code KE-0254/135/2014, date of approval 2014).
Informed Consent Statement
Informed consent was not required because in our studies the research material was obtained from archival paraffin blocks.
Data Availability Statement
The data that support the findings of this study are available from the corresponding author upon reasonable request.
Acknowledgments
The research was performed using the equipment purchased within the project 669 “The equipment of innovative laboratories doing research on new medicines used in the therapy of 670civilization and neoplastic diseases” within the Operational Program Development of Eastern Po-671land 2007–2013, Priority Axis I Modern Economy, Operations I.3 Innovation Promotion
Conflicts of Interest
The authors declare no conflict of interest.
References
- Stemke-Hale, K.; Gonzalez-Angulo, A.M.; Lluch, A.; Neve, R.M.; Kuo, W.L.; Davies, M.; Carey, M.; Hu, Z.; Guan, Y.; Sahin, A.; et al. An integrative genomic and proteomic analysis of PIK3CA, PTEN, and AKT mutations in breast cancer. Cancer Res. 2008, 68, 6084–6091. [Google Scholar] [CrossRef]
- Yap, T.A.; Garrett, M.D.; Walton, M.I.; Raynaud, F.; de Bono, J.S.; Workman, P. Targeting the PI3K-AKT-mTOR pathway: Progress, pitfalls, and promises. Curr. Opin Pharm. 2008, 8, 393–412. [Google Scholar] [CrossRef]
- McAuliffe, P.F.; Meric-Bernstam, F.; Mills, G.B.; Gonzalez-Angulo, A.M. Deciphering the Role of PI3K/Akt/mTOR Pathway in Breast Cancer Biology and Pathogenesis. Clin. Breast Cancer 2010, 10, S59–S65. [Google Scholar] [CrossRef]
- Deng, L.; Zhu, X.; Sun, Y.; Wang, J.; Zhong, X.; Li, J.; Hu, M.; Zheng, H. Prevalence and Prognostic Role of PIK3CA/AKT1 Mutations in Chinese Breast Cancer Patients. Cancer Res. Treat. 2019, 51, 128–140. [Google Scholar] [CrossRef] [PubMed]
- Lim, H.J.; Crowe, P.; Yang, J.L. Current clinical regulation of PI3K/PTEN/Akt/mTOR signalling in treatment of human cancer. J. Cancer Res. Clin. Oncol. 2015, 141, 671–689. [Google Scholar] [CrossRef]
- Kenna, M.M.; McGarrigle, S.; Pidgeon, G.P. The next generation of PI3K-Akt-mTOR pathway inhibitors in breast cancer cohorts. Biochim. Biophys. Acta Rev. Cancer 2018, 1870, 185–197. [Google Scholar] [CrossRef]
- Cocco, S.; Leone, A.; Piezzo, M.; Caputo, R.; Di Lauro, V.; Di Rella, F.; Fusco, G.; Capozzi, M.; Gioia, G.D.; Budillon, A.; et al. Targeting Autophagy in Breast Cancer. Int. J. Mol. Sci. 2020, 21, 7836. [Google Scholar] [CrossRef] [PubMed]
- Klarenbeek, S.; van Miltenburg, M.H.; Jonkers, J. Genetically engineered mouse models of PI3K signaling in breast cancer. Mol. Oncol. 2013, 7, 146–164. [Google Scholar] [CrossRef]
- Cathomas, G. PIK3CA in Colorectal Cancer. Front. Oncol. 2014, 4, 35. [Google Scholar] [CrossRef] [PubMed]
- Li, J.; Su, W.; Zhang, S.; Hu, Y.; Liu, J.; Zhang, X.; Bai, J.; Yuan, W.; Hu, L.; Cheng, T.; et al. Epidermal growth factor receptor and AKT1 gene copy numbers by multi-gene fluorescence in situ hybridization impact on prognosis in breast cancer. Cancer Sci. 2015, 106, 642–649. [Google Scholar] [CrossRef]
- Bregar, A.J.; Growdon, W.B. Emerging strategies for targeting PI3K in gynecologic cancer. Gynecol. Oncol. 2016, 140, 333–344. [Google Scholar] [CrossRef]
- Lambert, A.; Salleron, J.; Lion, M.; Rouyer, M.; Lozano, N.; Leroux, A.; Merlin, J.L.; Harlé, A. Comparison of Three Real-Time PCR Assays for the Detection of PIK3CA Somatic Mutations in Formalin-Fixed Paraffin Embedded Tissues of Patients with Breast Carcinomas. Pathol. Oncol. Res. 2019, 25, 1117–1123. [Google Scholar] [CrossRef] [PubMed]
- Li, G.; Guo, X.; Chen, M.; Tang, L.; Jiang, H.; Day, J.X.; Xie, Y.; Peng, L.; Xu, X.; Li, J.; et al. Prevalence and spectrum of AKT1, PIK3CA, PTEN and TP53 somatic mutations in Chinese breast cancer patients. PLoS ONE 2018, 13, e0203495. [Google Scholar] [CrossRef] [PubMed]
- Seo, Y.; Park, Y.H.; Ahn, J.S.; Im, Y.H.; Nam, S.J.; Cho, S.Y.; Cho, E.Y. PIK3CA Mutations and Neoadjuvant Therapy Outcome in Patients with Human Epidermal Growth Factor Receptor 2-Positive Breast Cancer: A Sequential Analysis. J. Breast Cancer 2018, 21, 382–390. [Google Scholar] [CrossRef]
- Myers, M.B.; McKim, K.L.; Banda, M.; George, N.I.; Parsons, B.L. Low-Frequency Mutational Heterogeneity of Invasive Ductal Carcinoma Subtypes: Information to Direct Precision Oncology. Int. J. Mol. Sci. 2019, 20, 1011. [Google Scholar] [CrossRef] [PubMed]
- Gustin, J.P.; Cosgrove, D.P.; Park, B.H. The PIK3CA gene as a mutated target for cancer therapy. Curr Cancer Drug Targets. 2008, 8, 733–740. [Google Scholar] [CrossRef]
- O’Regan, R.; Hawk, N.N. mTOR inhibition in breast cancer: Unraveling the complex mechanisms of mTOR signal transduction and its clinical implications in therapy. Expert Opin. Targets 2011, 15, 859–872. [Google Scholar] [CrossRef]
- Paplomata, E.; O’Regan, R. The PI3K/AKT/mTOR pathway in breast cancer: Targets, trials and biomarkers. Adv. Med. Oncol. 2014, 6, 154–166. [Google Scholar] [CrossRef]
- Mabuchi, S.; Kuroda, H.; Takahashi, R.; Sasano, T. The PI3K/AKT/mTOR pathway as a therapeutic target in ovarian cancer. Gynecol. Oncol. 2015, 137, 173–179. [Google Scholar] [CrossRef]
- Barchiesi, G.; Mazzotta, M.; Krasniqi, E.; Pizzuti, L.; Marinelli, D.; Capomolla, E.; Sergi, D.; Amodio, A.; Natoli, C.; Gamucci, T.; et al. Neoadjuvant Endocrine Therapy in Breast Cancer: Current Knowledge and Future Perspectives. Int. J. Mol. Sci. 2020, 21, 3528. [Google Scholar] [CrossRef]
- Sabine, V.S.; Crozier, C.; Brookes, C.L.; Drake, C.; Piper, T.; van de Velde, C.J.; Hasenburg, A.; Kieback, D.G.; Markopoulos, C.; Dirix, L.; et al. Mutational analysis of PI3K/AKT signaling pathway in tamoxifen exemestane adjuvant multinational pathology study. J. Clin. Oncol. 2014, 32, 2951–2958. [Google Scholar] [CrossRef] [PubMed]
- Takeshita, T.; Yamamoto, Y.; Yamamoto-Ibusuki, M.; Inao, T.; Sueta, A.; Fujiwara, S.; Omoto, Y.; Iwase, H. Prognostic role of PIK3CA mutations of cell-free DNA in early-stage triple negative breast cancer. Cancer Sci. 2015, 106, 1582–1589. [Google Scholar] [CrossRef] [PubMed]
- Baselga, J.; Cortes, J.; Im, S.-A.; Clark, E.; Ross, G.; Kiermaier, A.; Swain, S.M. Biomarker analyses in CLEOPATRA: A phase III, placebo-controlled study of pertuzumab in human epidermal growth factor receptor 2-positive, first-line metastatic breast cancer. J. Clin. Oncol. 2014, 32, 3753–3761. [Google Scholar] [CrossRef]
- Xu, B.; Guan, Z.; Shen, Z.; Tong, Z.; Jiang, Z.; Yang, J.; DeSilvio, M.; Russo, M.; Leigh, M.; Ellis, C. Association of phosphatase and tensin homolog low and phosphatidylinositol 3-kinase catalytic subunit alpha gene mutations on outcome in human epidermal growth factor receptor 2-positive metastatic breast cancer patients treated with first-line lapatinib plus paclitaxel or paclitaxel alone. Breast Cancer Res. 2014, 16, 405. [Google Scholar] [CrossRef]
- Deng, L.; Chen, J.; Zhong, X.R.; Luo, T.; Wang, Y.P.; Huang, H.F.; Yin, L.J.; Qiu, Y.; Bu, H.; Lv, Q.; et al. Correlation between activation of PI3K/AKT/mTOR pathway and prognosis of breast cancer in Chinese women. PLoS ONE 2015, 10, e0120511. [Google Scholar] [CrossRef]
- Jacot, W.; Mollevi, C.; Fina, F.; Lopez-Crapez, E.; Martin, P.M.; Colombo, P.E.; Bibeau, F.; Romieu, G.; Lamy, P.J. High EGFR protein expression and exon 9 PIK3CA mutations are independent prognostic factors in triple negative breast cancers. BMC Cancer 2015, 15, 986. [Google Scholar] [CrossRef] [PubMed]
- Leo, F.; Bartels, S.; Magel, L.; Framke, T.; Busche, G.; Jonigk, D.; Christgen, M.; Lehmann, U.; Kreipe, H. Prognostic factors in the myoepithelial-like spindle cell type of metaplastic breast cancer. Virchows Arch. 2016, 469, 191–201. [Google Scholar] [CrossRef] [PubMed]
- Loibl, S.; von Minckwitz, G.; Schneeweiss, A.; Paepke, S.; Lehmann, A.; Rezai, M.; Zahm, D.M.; Sinn, P.; Khandan, F.; Eidtmann, H.; et al. PIK3CA mutations are associated with lower rates of pathologic complete response to anti-human epidermal growth factor receptor 2 (her2) therapy in primary HER2-overexpressing breast cancer. J. Clin. Oncol. 2014, 32, 3212–3220. [Google Scholar] [CrossRef]
- Majewski, I.J.; Nuciforo, P.; Mittempergher, L.; Bosma, A.J.; Eidtmann, H.; Holmes, E.; Sotiriou, C.; Fumagalli, D.; Jimenez, J.; Aura, C.; et al. PIK3CA mutations are associated with decreased benefit to neoadjuvant human epidermal growth factor receptor 2-targeted therapies in breast cancer. J. Clin. Oncol. 2015, 33, 1334–1339. [Google Scholar] [CrossRef]
- Papaxoinis, G.; Kotoula, V.; Alexopoulou, Z.; Kalogeras, K.T.; Zagouri, F.; Timotheadou, E.; Gogas, H.; Pentheroudakis, G.; Christodoulou, C.; Koutras, A.; et al. Significance of PIK3CA mutations in patients with early breast cancer treated with adjuvant chemotherapy: A Hellenic Cooperative Oncology Group (HeCOG) Study. PLoS ONE 2015, 10, e0140293. [Google Scholar] [CrossRef]
- Yuan, H.; Chen, J.; Liu, Y.; Ouyang, T.; Li, J.; Wang, T.; Fan, Z.; Fan, T.; Lin, B.; Xie, Y. Association of PIK3CA mutation status before and after neoadjuvant chemotherapy with response to chemotherapy in women with breast cancer. Clin. Cancer Res. 2015, 21, 4365–4372. [Google Scholar] [CrossRef]
- Engels, C.C.; Kiderlen, M.; Bastiaannet, E.; van Eijk, R.; Mooyaart, A.; Smit, V.T.; de Craen, A.J.M.; Kuppen, P.J.K.; Kroep, J.R.; de Velde, C.J.H.; et al. The clinical value of HER-2 overexpression and PIK3CA mutations in the older breast cancer population: A FOCUS study analysis. Breast Cancer Res. Treat. 2016, 156, 361–370. [Google Scholar] [CrossRef]
- Kim, J.Y.; Lee, E.; Park, K.; Park, W.Y.; Jung, H.H.; Ahn, J.S.; Im, Y.H.; Park, Y.H. Clinical implications of genomic profiles in metastatic breast cancer with a focus on TP53 and PIK3CA, the most frequently mutated genes. Oncotarget 2017, 8, 27997–28007. [Google Scholar] [CrossRef]
- Ligresti, G.; Militello, L.; Steelman, L.S.; Cavallaro, A.; Basile, F.; Nicoletti, F.; Stivala, F.; McCubrey, J.A.; Libra, M. PIK3CA mutations in human solid tumors: Role in sensitivity to various therapeutic approaches. Cell Cycle 2009, 8, 1352–1358. [Google Scholar] [CrossRef]
- O’Brien, C.; Wallin, J.J.; Sampath, D.; GuhaThakurta, D.; Savage, H.; Punnoose, E.A.; Guan, J.; Berry, L.; Prior, W.W.; Amler, L.C.; et al. Predictive biomarkers of sensitivity to the phosphatidylinositol 3′ kinase inhibitor GDC-0941 in breast cancer preclinical models. Clin. Cancer Res. 2010, 16, 3670–3683. [Google Scholar] [CrossRef]
- Cizkova, M.; Susini, A.; Vacher, S.; Cizeron-Clairac, G.; Andrieu, C.; Driouch, K.; Fourme, E.; Lidereau, R.; Bièche, I. PIK3CA mutation impact on survival in breast cancer patients and in ERα, PR and ERBB2-based subgroups. Breast Cancer Res. 2012, 14, R28. [Google Scholar] [CrossRef] [PubMed]
- Dumont, A.G.; Dumont, S.N.; Trent, J.C. The favorable impact of PIK3CA mutations on survival: An analysis of 2587 patients with breast cancer. Chin. J. Cancer 2012, 31, 327–334. [Google Scholar] [CrossRef] [PubMed]
- Toomey, S.; Eustace, A.J.; Fay, J.; Sheehan, K.M.; Carr, A.; Milewska, M.; Madden, S.F.; Teiserskiene, A.; Kay, E.W.; O’Donovan, N.; et al. Impact of somatic PI3K pathway and ERBB family mutations on pathological complete response (pCR) in HER2-positive breast cancer patients who received neoadjuvant HER2-targeted therapies. Breast Cancer Res. 2017, 19, 87. [Google Scholar] [CrossRef] [PubMed]
- Brugge, J.; Hung, M.C.; Mills, G.B. A new mutational AKTivation in the PI3K pathway. Cancer Cell. 2007, 12, 104–107. [Google Scholar] [CrossRef]
- Flatley, E.; Ang, D.; Warrick, A.; Beadling, C.; Corless, C.L.; Troxell, M.L. PIK3CA-AKT pathway mutations in micropapillary breast carcinoma. Hum. Pathol. 2013, 44, 1320–1327. [Google Scholar] [CrossRef]
- Mukohara, T. PI3K mutations in breast cancer: Prognostic and therapeutic implications. Breast Cancer 2015, 7, 111–123. [Google Scholar] [CrossRef] [PubMed]
- Michelucci, A.; Di Cristofano, C.; Lami, A.; Collecchi, P.; Caligo, A.; Decarli, N.; Leopizzi, M.; Aretini, P.; Bertacca, G.; Porta, R.P.; et al. PIK3CA in breast carcinoma: A mutational analysis of sporadic and hereditary cases. Diagn Mol. Pathol. 2009, 18, 200–205. [Google Scholar] [CrossRef]
- Weisman, P.S.; Ng, C.K.; Brogi, E.; Eisenberg, R.E.; Won, H.H.; Piscuoglio, S.; De Filippo, M.R.; Ioris, R.; Akram, M.; Norton, L.; et al. Genetic alterations of triple negative breast cancer by targeted next-generation sequencing and correlation with tumor morphology. Mod. Pathol. 2016, 29, 476–488. [Google Scholar] [CrossRef]
- Jouali, F.; Marchoudi, N.; Talbi, S.; Bilal, B.; El Khasmi, M.; Rhaissi, H.; Fekkak, J. Detection of PIK3/AKT pathway in Moroccan population with triple negative breast cancer. BMC Cancer 2018, 18, 900. [Google Scholar] [CrossRef]
- Ishida, N.; Baba, M.; Hatanaka, Y.; Hagio, K.; Okada, H.; Hatanaka, K.C.; Togashi, K.; Matsuno, Y.; Yamashita, H. PIK3CA mutation, reduced AKT serine 473 phosphorylation, and increased ERα serine 167 phosphorylation are positive prognostic indicators in postmenopausal estrogen receptor-positive early breast cancer. Oncotarget 2018, 9, 17711–17724. [Google Scholar] [CrossRef]
- Mutee, A.; Kaur, G.; Moad, A.; Tan, M.; Muhammad, T. Immunohistochemical expression of mTOR protein in breast carcinoma tissues. Internet J. Lab. Med. 2009, 4, 1–11. [Google Scholar]
- Aleskandarany, M.A.; Rakha, E.A.; Ahmed, M.A.; Powe, D.G.; Paish, E.C.; Macmillan, R.D.; Ellis, I.O.; Green, A.R. PIK3CA expression in invasive breast cancer: A biomarker of poor prognosis. Breast Cancer Res. Treat. 2010, 122, 45–53. [Google Scholar] [CrossRef] [PubMed]
- Loi, S.; Haibe-Kains, B.; Majjaj, S.; Lallemand, F.; Durbecq, V.; Larsimont, D.; Gonzalez-Angulo, A.M.; Pusztai, L.; Symmans, W.F.; Bardelli, A.; et al. PIK3CA mutations associated with gene signature of low mTORC1 signaling and better outcomes in estrogen receptor-positive breast cancer. Proc. Natl. Acad. Sci. USA 2010, 107, 10208–10213. [Google Scholar] [CrossRef] [PubMed]
- Yang, J.; Ren, Y.; Wang, L.; Li, B.; Chen, Y.; Zhao, W.; Xu, W.; Li, T.; Dai, F. PTEN mutation spectrum in breast cancers and breast hyperplasia. J. Cancer Res. Clin. Oncol. 2010, 136, 1303–1311. [Google Scholar] [CrossRef]
- Razis, E.; Bobos, M.; Kotoula, V.; Eleftheraki, A.G.; Kalofonos, H.P.; Pavlakis, K.; Papakostas, P.; Aravantinos, G.; Rigakos, G.; Efstratiou, I.; et al. Evaluation of the association of PIK3CA mutations and PTEN loss with efficacy of trastuzumab therapy in metastatic breast cancer. Breast Cancer Res. Treat. 2011, 128, 447–456. [Google Scholar] [CrossRef] [PubMed]
- Palimaru, I.; Brügmann, A.; Wium-Andersen, M.K.; Nexo, E.; Sorensen, B.S. Expression of PIK3CA, PTEN mRNA and PIK3CA mutations in primary breast cancer: Association with lymph node metastases. Springerplus 2013, 2, 464. [Google Scholar] [CrossRef]
- Cizkova, M.; Vacher, S.; Meseure, D.; Trassard, M.; Susini, A.; Mlcuchova, D.; Callens, C.; Rouleau, E.; Spyratos, F.; Lidereau, R.; et al. PIK3R1 underexpression is an independent prognostic marker in breast cancer. BMC Cancer 2013, 13, 545. [Google Scholar] [CrossRef]
- Firoozinia, M.; Zareian Jahromi, M.; Moghadamtousi, S.Z.; Nikzad, S.; Abdul Kadir, H. PIK3CA gene amplification and PI3K p110alpha protein expression in breast carcinoma. Int. J. Med. Sci. 2014, 11, 620–625. [Google Scholar] [CrossRef] [PubMed]
- Cheng, X.F.; Liu, Q.; Zhang, X.F.; Zhao, H.D.; Wang, W.; Chu, A.J. Expression of mTOR and its inhibitory effect on cell proliferation and apoptosis of breast cancer cells. J. Biol. Regul. Homeost Agents 2015, 29, 869–873. [Google Scholar]
- The Cancer Genome Atlas Network. Comprehensive molecular portraits of human breast tumours. Nature 2012, 490, 61–70. [Google Scholar] [CrossRef]
- Zhao, Z.M.; Yost, S.E.; Hutchinson, K.E.; Li, S.M.; Yuan, Y.C.; Noorbakhsh, J.; Liu, Z.; Warden, C.; Johnson, R.M.; Wu, X.; et al. CCNE1 amplification is associated with poor prognosis in patients with triple negative breast cancer. BMC Cancer 2019, 19, 96. [Google Scholar] [CrossRef]
- Nicoś, M.; Krawczyk, P.; Powrózek, T.; Szudy, P.; Jarosz, B.; Sawicki, M.; Szumiło, J.; Trojanowski, T.; Milanowski, J. PIK3CA Mutations Detected in Patients with Central Nervous System Metastases of Non-small Cell Lung Cancer. Anticancer Res. 2016, 36, 2243–2249. [Google Scholar] [PubMed]
- Nicoś, M.; Krawczyk, P.; Jarosz, B.; Sawicki, M.; Trojanowski, T.; Milanowski, J. Prevalence of NRAS, PTEN and AKT1 gene mutations in the central nervous system metastases of non-small cell lung cancer. Brain Tumor Pathol. 2017, 34, 36–41. [Google Scholar] [CrossRef]
- Livak, K.J.; Schmittgen, T.D. Analysis of relative gene expression data using real-time quantitative PCR and the 2(-Delta Delta C(T)) Method. Methods 2001, 25, 402–408. [Google Scholar] [CrossRef] [PubMed]
- Wong, M.L.; Medrano, J.F. Real-time PCR for mRNA quantitation. Biotechniques 2005, 39, 75–85. [Google Scholar] [CrossRef]
- Kocki, J.; Ułamek-Kozioł, M.; Bogucka-Kocka, A.; Januszewski, S.; Jabłoński, M.; Gil-Kulik, P.; Brzozowska, J.; Petniak, A.; Furmaga-Jabłońska, W.; Bogucki, J.; et al. Dysregulation of Amyloid-β Protein Precursor, β-Secretase, Presenilin 1 and 2 Genes in the Rat Selectively Vulnerable CA1 Subfield of Hippocampus Following Transient Global Brain Ischemia. J. Alzheimers Dis. 2015, 47, 1047–1056. [Google Scholar] [CrossRef]
- Chandrashekar, D.S.; Bashel, B.; Balasubramanya, S.A.H.; Creighton, C.J.; Ponce-Rodriguez, I.; Chakravarthi, B.V.; Varambally, S. UALCAN: A portal for facilitating tumor subgroup gene expression and survival analyses. Neoplasia 2017, 19, 649–658. [Google Scholar] [CrossRef]
- Jezequel, P.; Campone, M.; Gouraud, W.; Guérin-Charbonnel, C.; Leux, C.; Ricolleau, G.; Campion, L. bc-GenExMiner: An easy-to-use online platform for gene prognostic analyses in breast cancer. Breast Cancer Res. Treat. 2012, 131, 765–775. [Google Scholar] [CrossRef] [PubMed]
- Jezequel, P.; Frenel, J.S.; Campion, L.; Guérin-Charbonnel, C.; Gouraud, W.; Ricolleau, G.; Campone, M. bc-GenExMiner 3.0: New mining module computes breast cancer gene expression correlation analyses. Database 2013, 2013, bas060. [Google Scholar] [CrossRef] [PubMed]
- Babicki, S.; Arndt, D.; Marcu, A.; Liang, Y.; Grant, J.R.; Maciejewski, A.; Wishart, D.S. Heatmapper: Web-enabled heat mapping for all. Nucleic Acids Res. 2016, 8, W147–W153. [Google Scholar] [CrossRef] [PubMed]


Publisher’s Note: MDPI stays neutral with regard to jurisdictional claims in published maps and institutional affiliations. |
© 2021 by the authors. Licensee MDPI, Basel, Switzerland. This article is an open access article distributed under the terms and conditions of the Creative Commons Attribution (CC BY) license (http://creativecommons.org/licenses/by/4.0/).