Dissecting Response to Cancer Immunotherapy by Applying Bayesian Network Analysis to Flow Cytometry Data
Abstract
1. Introduction
2. Results
2.1. Basic Computational Pipeline, and Baseline Immune FACS Panels Analyses
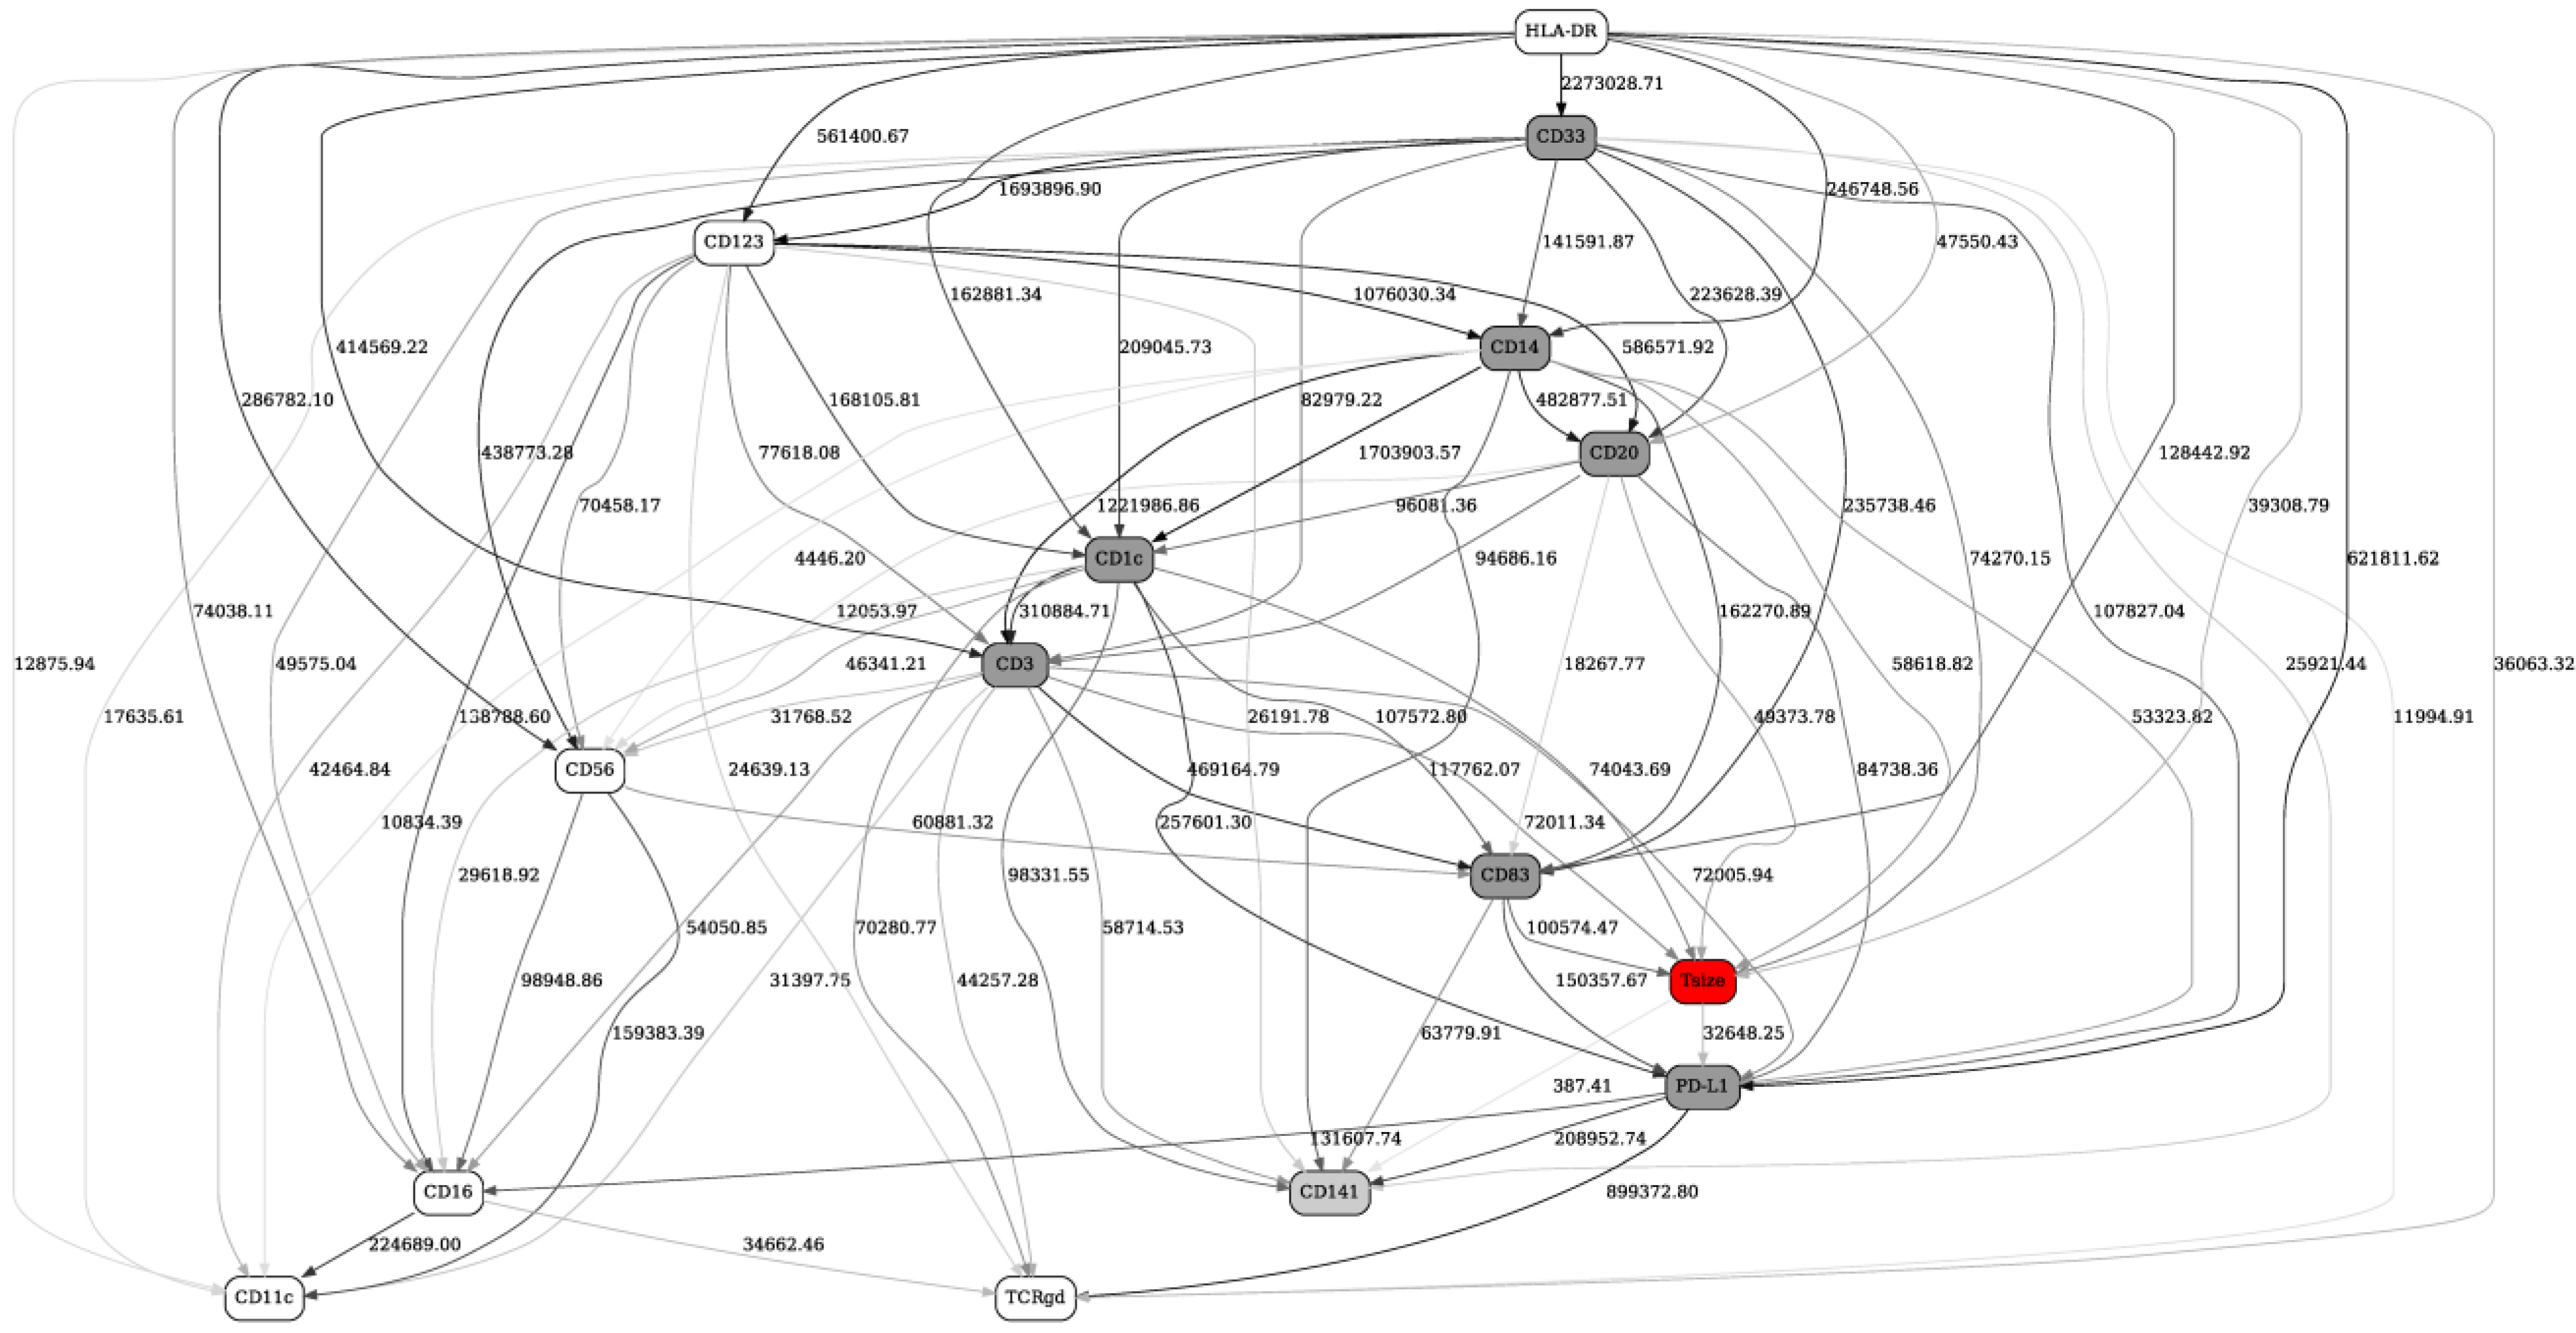
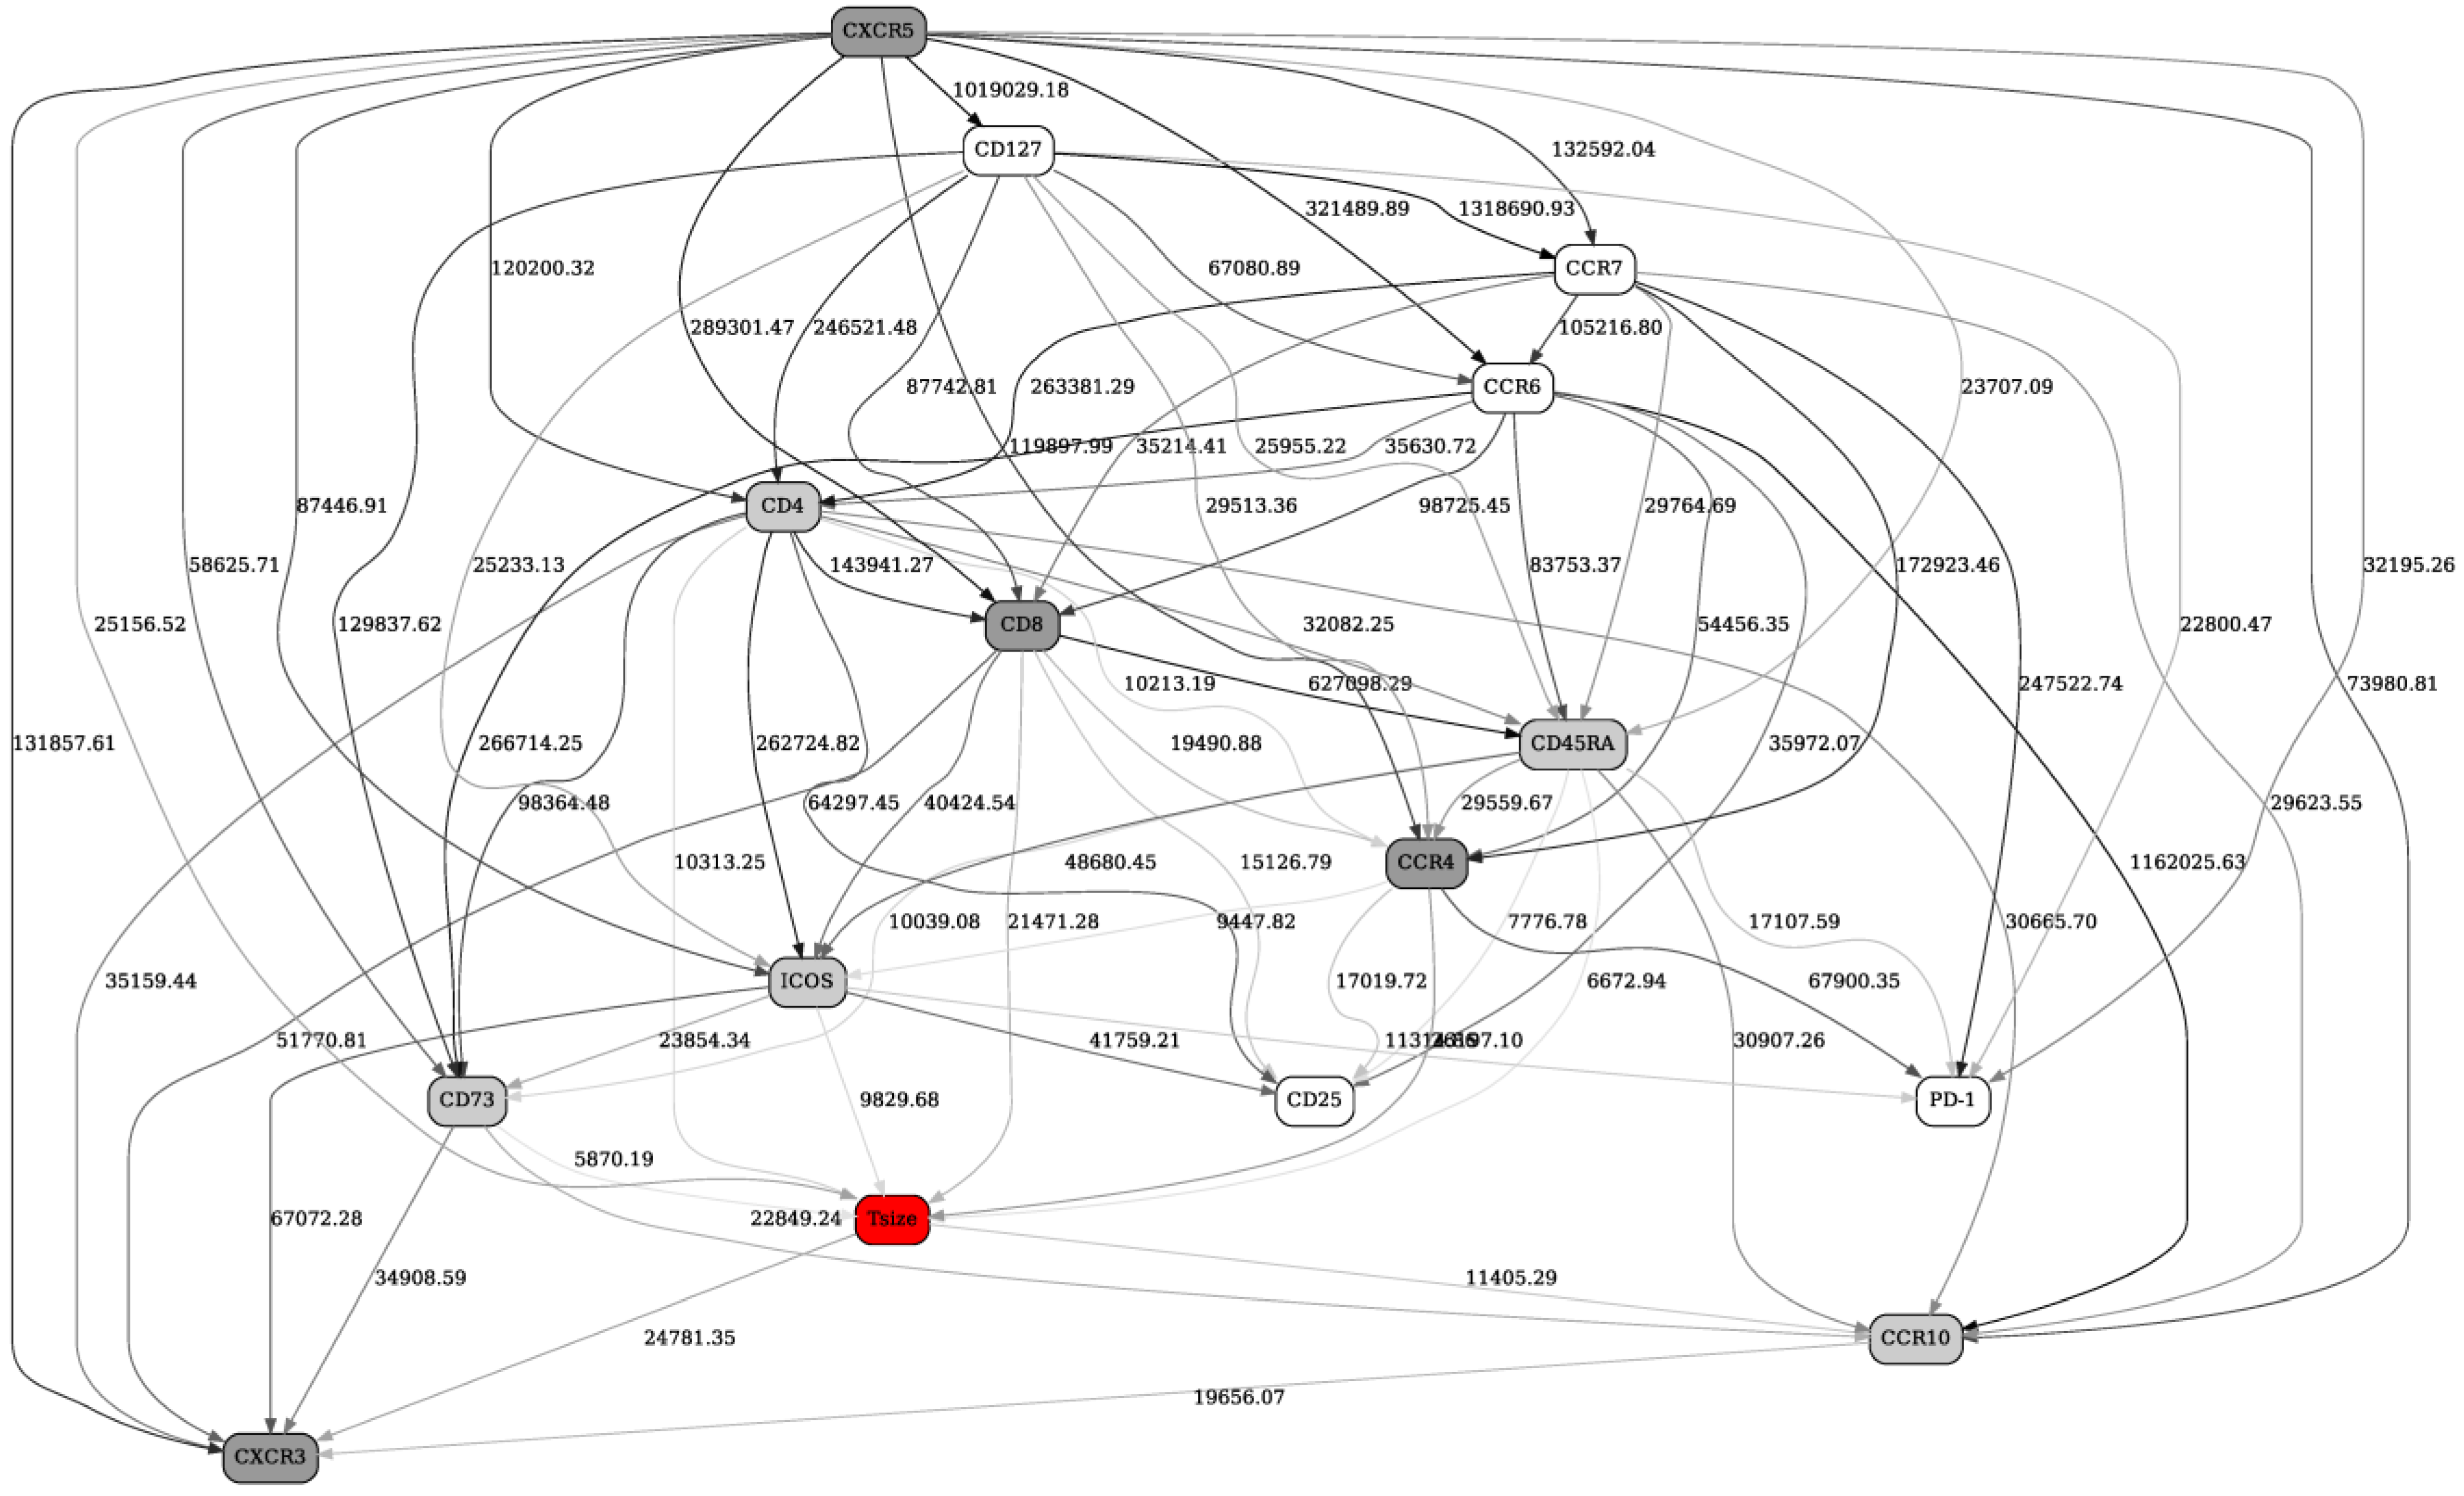
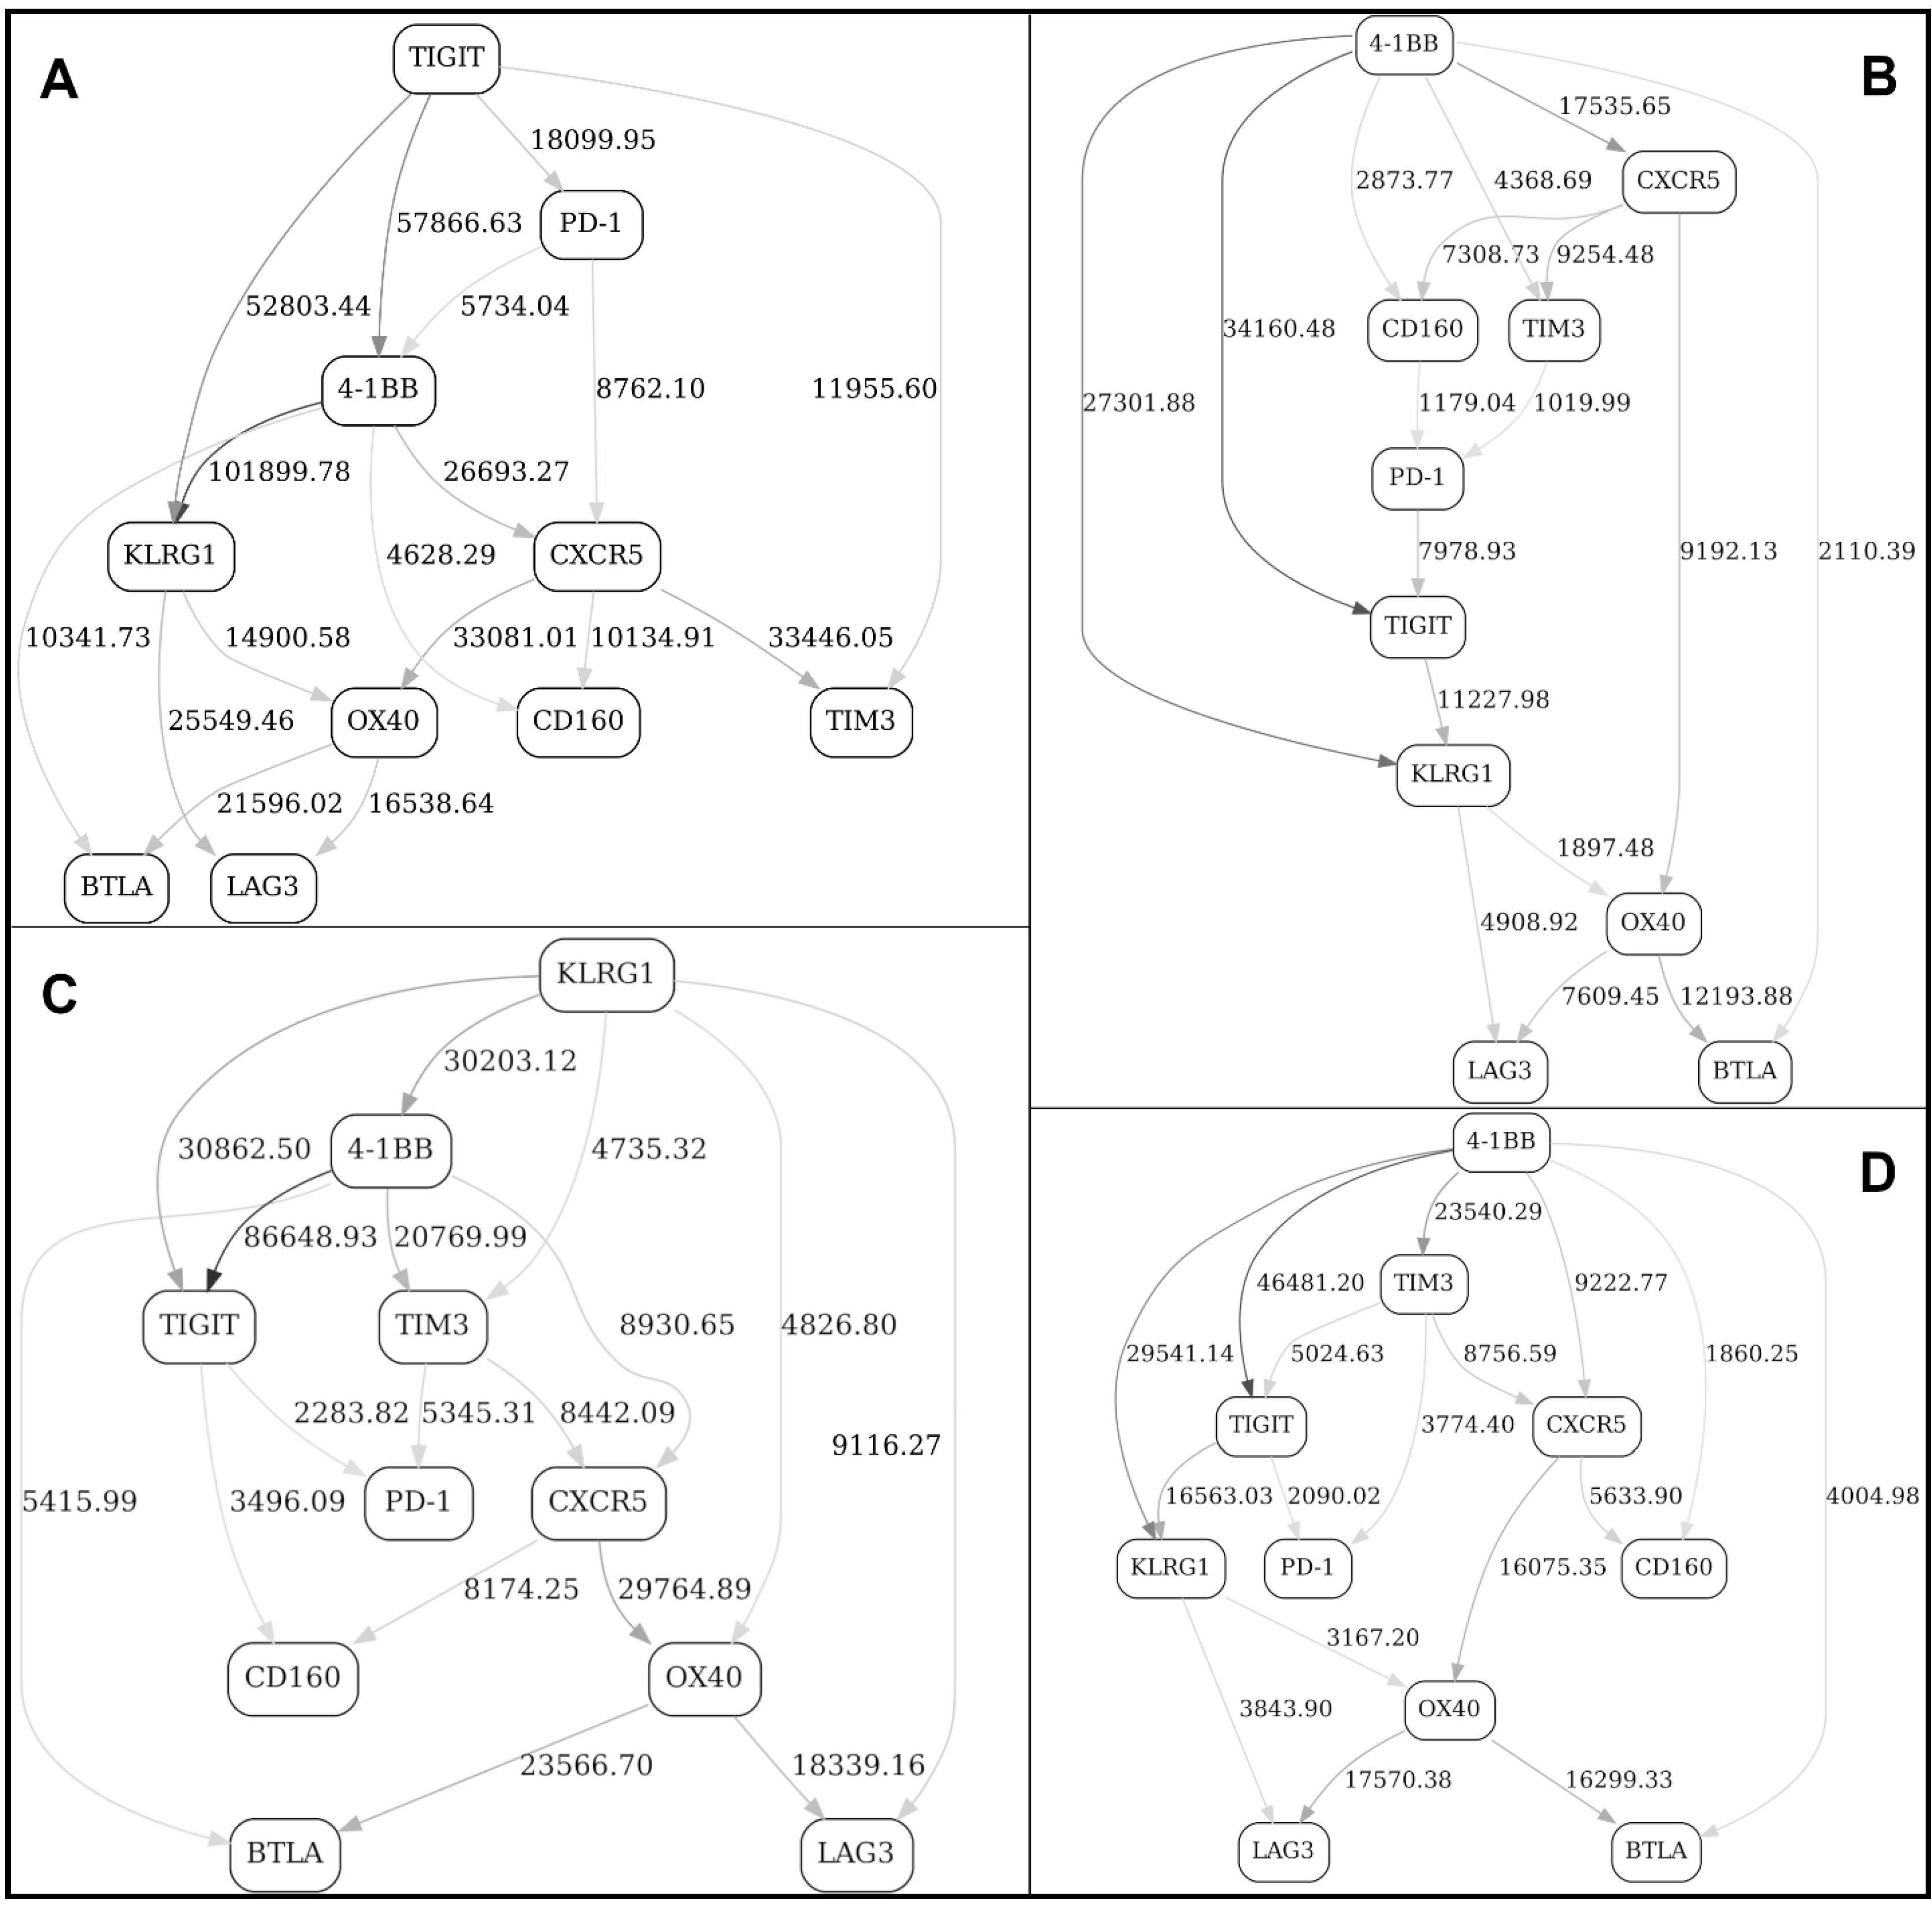
2.2. Separation into Major Immune Cell Types, and “Contrast” (before/after Immunotherapy, Responders/Nonresponders) Analyses in Checkpoint and Adaptive Networks
2.3. Validation of the BNs Using Statistical Criteria, and Comparison of the BN Results with Other Multivariate Analysis Methods
3. Discussion
4. Materials and Methods
4.1. Flow Cytometry
- Checkpoint panel: CD4, CD8, CD45RA, KLGR1, CCR7, CXCR5, 4-1BB, BTLA4, LAG3, OX40, CD160, TIGIT, PD1, TIM3;
- Innate panel: CD3, CD14, CD16, CD20, CD33, CD56, CD11c, CD141, CD1c, CD123, CD83, HLA-DR, TCRgδ, PD-L1;
- Adaptive panel: CD4, CD8, CCR10, CCR6, CD73, ICOS, CXCR3, CXCR5, CD45RA, CCR4, CCR7, CD25, CD127, PD1.
4.2. Bayesian Networks Modeling
Supplementary Materials
Author Contributions
Funding
Institutional Review Board Statement
Informed Consent Statement
Data Availability Statement
Acknowledgments
Conflicts of Interest
References
- Mair, F.; Hartmann, F.J.; Mrdjen, D.; Tosevski, V.; Krieg, C.; Becher, B. The end of gating? An introduction to automated analysis of high dimensional cytometry data. Eur. J. Immunol. 2016, 46, 34–43. [Google Scholar] [CrossRef]
- Saeys, Y.; Van Gassen, S.; Lambrecht, B.N. Computational flow cytometry: Helping to make sense of high-dimensional immunology data. Nat. Rev. Immunol. 2016, 16, 449–462. [Google Scholar] [CrossRef]
- Gu, Y.; Zhang, A.C.; Han, Y.; Li, J.; Chen, C.; Lo, Y.H. Machine Learning Based Real-Time Image-Guided Cell Sorting and Classification. Cytometry A 2019, 95, 499–509. [Google Scholar] [CrossRef]
- Montante, S.; Brinkman, R.R. Flow cytometry data analysis: Recent tools and algorithms. Int. J. Lab. Hematol. 2019, 41 (Suppl. 1), 56–62. [Google Scholar] [CrossRef]
- Mazza, E.M.C.; Brummelman, J.; Alvisi, G.; Roberto, A.; De Paoli, F.; Zanon, V.; Colombo, F.; Roederer, M.; Lugli, E. Background fluorescence and spreading error are major contributors of variability in high-dimensional flow cytometry data visualization by t-distributed stochastic neighboring embedding. Cytometry A 2018, 93, 785–792. [Google Scholar] [CrossRef]
- Isozaki, A.; Mikami, H.; Tezuka, H.; Matsumura, H.; Huang, K.; Akamine, M.; Hiramatsu, K.; Iino, T.; Ito, T.; Karakawa, H.; et al. Intelligent image-activated cell sorting 2.0. Lab. Chip. 2020, 20, 2263–2273. [Google Scholar] [CrossRef] [PubMed]
- Pischel, D.; Buchbinder, J.H.; Sundmacher, K.; Lavrik, I.N.; Flassig, R.J. A guide to automated apoptosis detection: How to make sense of imaging flow cytometry data. PLoS ONE 2018, 13, e0197208. [Google Scholar] [CrossRef]
- Qiu, P.; Simonds, E.F.; Bendall, S.C.; Gibbs, K.D., Jr.; Bruggner, R.V.; Linderman, M.D.; Sachs, K.; Nolan, G.P.; Plevritis, S.K. Extracting a cellular hierarchy from high-dimensional cytometry data with SPADE. Nat. Biotechnol. 2011, 29, 886–891. [Google Scholar] [CrossRef]
- Nowicka, M.; Krieg, C.; Weber, L.M.; Hartmann, F.J.; Guglietta, S.; Becher, B.; Levesque, M.P.; Robinson, M.D. CyTOF workflow: Differential discovery in high-throughput high-dimensional cytometry datasets. F1000Research 2017, 6, 748. [Google Scholar] [CrossRef]
- Kimball, A.K.; Oko, L.M.; Bullock, B.L.; Nemenoff, R.A.; van Dyk, L.F.; Clambey, E.T. A Beginner’s Guide to Analyzing and Visualizing Mass Cytometry Data. J. Immunol. 2018, 200, 3–22. [Google Scholar] [CrossRef]
- Palit, S.; Heuser, C.; de Almeida, G.P.; Theis, F.J.; Zielinski, C.E. Meeting the Challenges of High-Dimensional Single-Cell Data Analysis in Immunology. Front. Immunol. 2019, 10, 1515. [Google Scholar] [CrossRef] [PubMed]
- Mair, F.; Tyznik, A.J. High-Dimensional Immunophenotyping with Fluorescence-Based Cytometry: A Practical Guidebook. Methods Mol Biol. 2019, 2032, 1–29. [Google Scholar] [CrossRef]
- Cossarizza, A.; Chang, H.D.; Radbruch, A.; Akdis, M.; Andrä, I.; Annunziato, F.; Bacher, P.; Barnaba, V.; Battistini, L.; Bauer, W.M.; et al. Guidelines for the use of flow cytometry and cell sorting in immunological studies (second edition). Eur. J. Immunol. 2019, 49, 1457–1973. [Google Scholar] [CrossRef] [PubMed]
- Keyes, T.J.; Domizi, P.; Lo, Y.C.; Nolan, G.P.; Davis, K.L. A Cancer Biologist’s Primer on Machine Learning Applications in High-Dimensional Cytometry. Cytometry A 2020, 97, 782–799. [Google Scholar] [CrossRef] [PubMed]
- Torang, A.; Gupta, P.; Klinke, D.J. An elastic-net logistic regression approach to generate classifiers and gene signatures for types of immune cells and T helper cell subsets. BMC Bioinform. 2019, 20, 433. [Google Scholar] [CrossRef]
- Leiserson, M.D.M.; Syrgkanis, V.; Gilson, A.; Dudik, M.; Gillett, S.; Chayes, J.; Borgs, C.; Bajorin, D.F.; Rosenberg, J.E.; Funt, S.; et al. A multifactorial model of T cell expansion and durable clinical benefit in response to a PD-L1 inhibitor. PLoS ONE 2018, 13, e0208422. [Google Scholar] [CrossRef] [PubMed]
- Krieg, C.; Nowicka, M.; Guglietta, S.; Schindler, S.; Hartmann, F.J.; Weber, L.M.; Dummer, R.; Robinson, M.D.; Levesque, M.P.; Becher, B. High-dimensional single-cell analysis predicts response to anti-PD-1 immunotherapy. Nat. Med. 2018, 24, 144–153, Erratum in 24, 1773–1775. [Google Scholar] [CrossRef]
- Auslander, N.; Zhang, G.; Lee, J.S.; Frederick, D.T.; Miao, B.; Moll, T.; Tian, T.; Wei, Z.; Madan, S.; Sullivan, R.J.; et al. Robust prediction of response to immune checkpoint blockade therapy in metastatic melanoma. Nat. Med. 2018, 24, 1545–1549. [Google Scholar] [CrossRef]
- Maucourant, C.; Filipovic, I.; Ponzetta, A.; Aleman, S.; Cornillet, M.; Hertwig, L.; Strunz, B.; Lentini, A.; Reinius, B.; Brownlie, D.; et al. Natural killer cell immunotypes related to COVID-19 disease severity. Sci. Immunol. 2020, 5, eabd6832. [Google Scholar] [CrossRef]
- Sachs, K.; Perez, O.; Pe’er, D.; Lauffenburger, D.A.; Nolan, G.P. Causal protein-signaling networks derived from multiparameter single-cell data. Science 2005, 308, 523–529. [Google Scholar] [CrossRef]
- Pe’er, D. Bayesian network analysis of signaling networks: A primer. Sci. STKE 2005, 2005, l4. [Google Scholar] [CrossRef] [PubMed]
- Werhli, A.V. Comparing the reconstruction of regulatory pathways with distinct Bayesian networks inference methods. BMC Genom. 2012, 13 (Suppl. 5), S2. [Google Scholar] [CrossRef] [PubMed]
- Grzegorczyk, M. An introduction to Gaussian Bayesian networks. Methods Mol. Biol. 2010, 662, 121–147. [Google Scholar] [CrossRef] [PubMed]
- Koch, M.; Broom, B.M.; Subramanian, D. Learning robust cell signaling models from high throughput proteomic data. Int. J. Bioinform. Res. Appl. 2009, 5, 241–253. [Google Scholar] [CrossRef]
- Ferlay, J.; Colombet, M.; Soerjomataram, I.; Mathers, C.; Parkin, D.M.; Piñeros, M.; Znaor, A.; Bray, F. Estimating the global cancer incidence and mortality in 2018: GLOBOCAN sources and methods. Int. J. Cancer 2019, 144, 1941–1953. [Google Scholar] [CrossRef]
- Chuang, J.; Chao, J.; Hendifar, A.; Klempner, S.J.; Gong, J. Checkpoint inhibition in advanced gastroesophageal cancer: Clinical trial data, molecular subtyping, predictive biomarkers, and the potential of combination therapies. Transl. Gastroenterol. Hepatol. 2019, 4, 63. [Google Scholar] [CrossRef]
- Becton, Dickinson and Company. FlowJo™ Software; Becton, Dickinson and Company: Ashland, OR, USA, 2019. [Google Scholar]
- Han, X.; Wang, Y.; Sun, J.; Tan, T.; Cai, X.; Lin, P.; Tan, Y.; Zheng, B.; Wang, B.; Wang, J.; et al. Role of CXCR3 signaling in response to anti-PD-1 therapy. EBioMedicine 2019, 48, 169–177. [Google Scholar] [CrossRef]
- Wang, X.; Chai, Z.; Li, Y.; Long, F.; Hao, Y.; Pan, G.; Liu, M.; Li, B. Identification of Potential Biomarkers for Anti-PD-1 Therapy in Melanoma by Weighted Correlation Network Analysis. Genes 2020, 11, 435. [Google Scholar] [CrossRef]
- Pedregosa, F.; Varoquaux, G.; Gramfort, A.; Michel, V.; Thirion, B.; Grisel, O.; Blondel, M.; Prettenhofer, P.; Weiss, R.; Dubourg, V.; et al. Scikit-learn: Machine Learning in Python. J. Mach. Learn. Res. 2011, 12, 2825–2830. [Google Scholar]
- Rubner, Y.; Tomasi, C.; Guibas, L.J. A metric for distributions with applications to image databases. In Proceedings of the IEEE Sixth International Conference on Computer Vision, Bombay, India, 7 January 1998; pp. 59–66. [Google Scholar]
- Rizzo, M.L.; Szekely, G.J. Energy distance. WIREs Comput. Stat. 2016, 8, 27–38. [Google Scholar] [CrossRef]
- Orlova, D.Y.; Zimmerman, N.; Meehan, S.; Meehan, C.; Waters, J.; Ghosn, E.E.B.; Filatenkov, A.; Kolyagin, G.A.; Gernez, Y.; Tsuda, S.; et al. Earth Mover’s Distance (EMD): A True Metric for Comparing Biomarker Expression Levels in Cell Populations. PLoS ONE 2016, 11, e0151859. [Google Scholar] [CrossRef] [PubMed]
- Lundberg, S.M.; Erion, G.; Chen, H.; DeGrave, A.; Prutkin, J.M.; Nair, B.; Katz, R.; Himmelfarb, J.; Bansal, N.; Lee, S.I. From local explanations to global understanding with explainable AI for trees. Nat. Mach. Intell. 2020, 2, 56–67. [Google Scholar] [CrossRef] [PubMed]
- Galli, E.; Friebel, E.; Ingelfinger, F.; Unger, S.; Núñez, N.G.; Becher, B. The end of omics? High dimensional single cell analysis in precision medicine. Eur. J. Immunol. 2019, 49, 212–220. [Google Scholar] [CrossRef] [PubMed]
- Park, L.M.; Lannigan, J.; Jaimes, M.C. OMIP-069: Forty-Color Full Spectrum Flow Cytometry Panel for Deep Immunophenotyping of Major Cell Subsets in Human Peripheral Blood. Cytometry A 2020, 97, 1044–1051. [Google Scholar] [CrossRef]
- Gogoshin, G.; Boerwinkle, E.; Rodin, A.S. New algorithm and software (BNOmics) for inferring and visualizing Bayesian networks from heterogeneous “big” biological and genetic data. J. Comput. Biol. 2017, 23, 1–17. [Google Scholar] [CrossRef] [PubMed]
- Andrews, B.; Ramsey, J.; Cooper, G.F. Scoring Bayesian Networks of Mixed Variables. Int. J. Data Sci. Anal. 2018, 6, 3–18. [Google Scholar] [CrossRef] [PubMed]
- Wang, X.; Branciamore, S.; Gogoshin, G.; Ding, S.; Rodin, A.S. New Analysis Framework Incorporating Mixed Mutual Information and Scalable Bayesian Networks for Multimodal High Dimensional Genomic and Epigenomic Cancer Data. Front. Genet. 2020, 11, 648. [Google Scholar] [CrossRef] [PubMed]
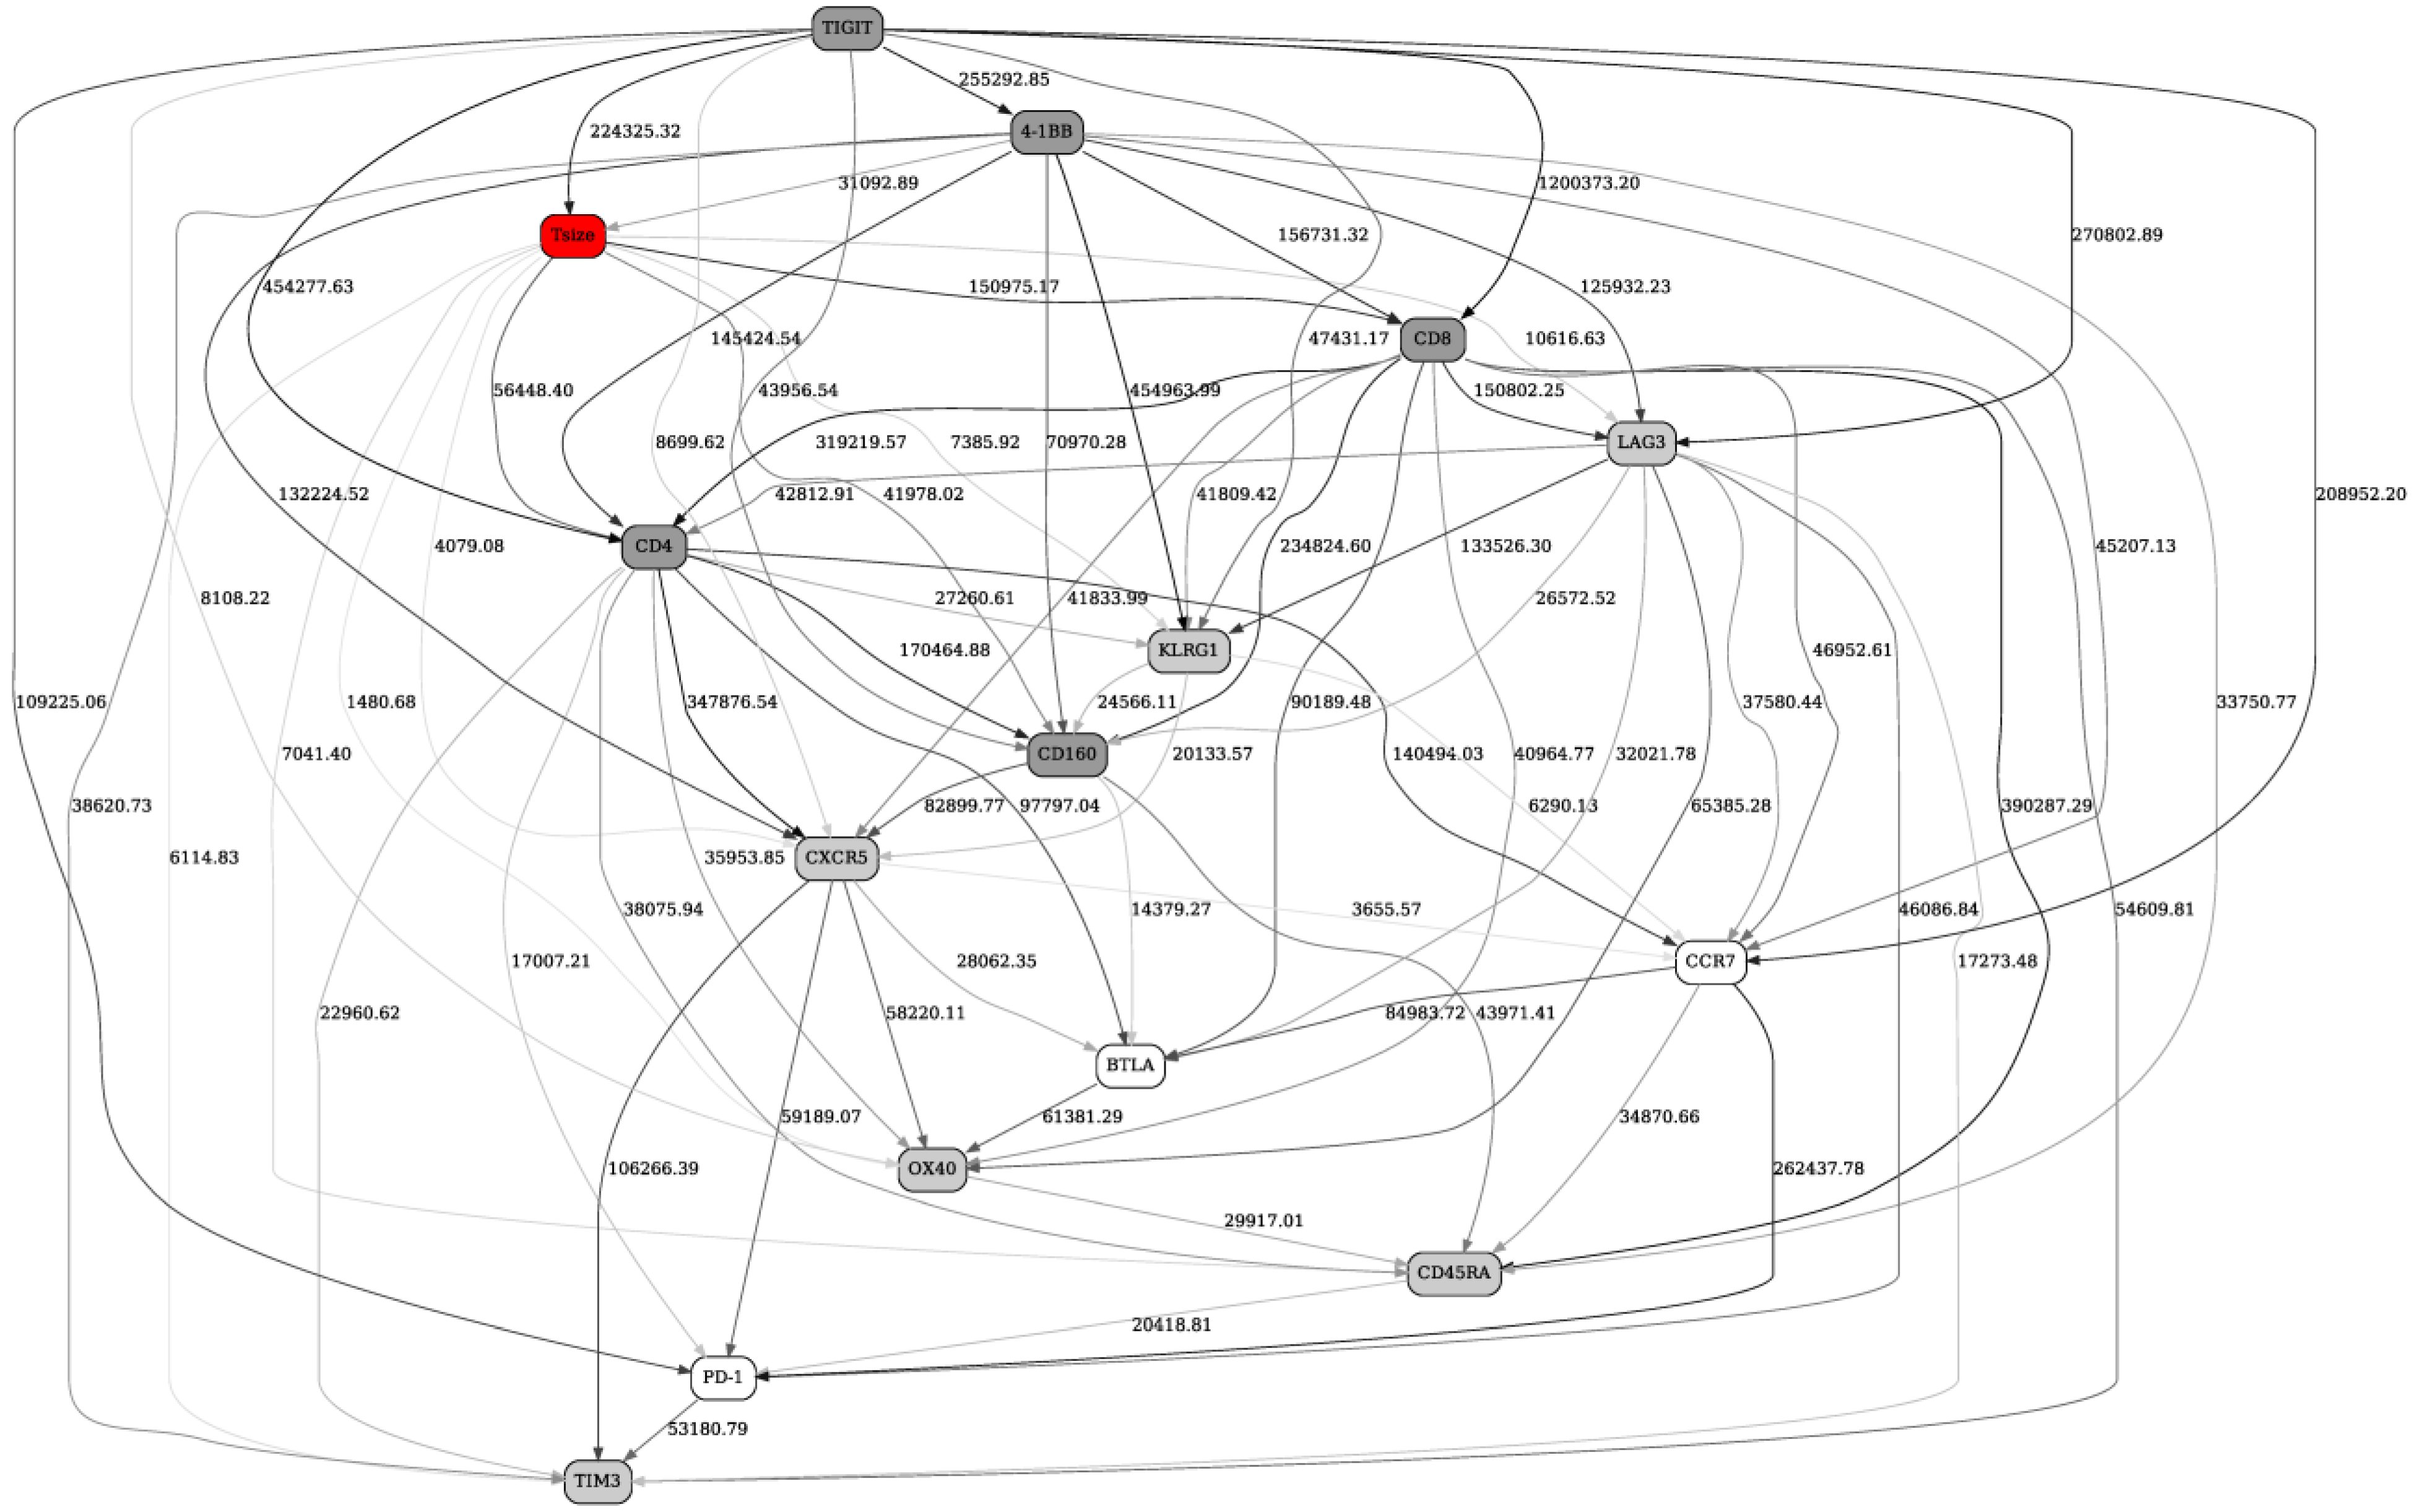




| Immune Marker Configuration (TIGIT, CD4, CD8, CD160, 4-1BB) | Configuration Frequency | Probability of Response |
|---|---|---|
| (0 1 2 2 2) | 0.0256 | 0.430 |
| (2 1 2 2 2) | 0.0252 | 0.407 |
| (2 2 1 2 2) | 0.0328 | 0.371 |
| (2 2 2 1 2) | 0.0443 | 0.365 |
| (1 1 2 2 2) | 0.0268 | 0.357 |
| (2 2 2 1 1) | 0.0256 | 0.338 |
| (2 2 2 2 2) | 0.0346 | 0.265 |
| (1 2 2 2 2) | 0.0336 | 0.191 |
| (0 2 2 2 2) | 0.0341 | 0.180 |
| (0 0 1 0 0) | 0.0193 | 0.038 |
| (0 0 0 1 0) | 0.0307 | 0.008 |
| (0 0 0 0 0) | 0.0644 | 0.008 |
| (0 0 0 0 1) | 0.0193 | 0.007 |
| (1 0 0 1 0) | 0.0199 | 0.006 |
| (1 0 0 0 0) | 0.0338 | 0.006 |
| Immune Marker Configuration (HLA-DR, PD-L1, CD3, CD20, CD83, CD1c, CD14, CD33) | Configuration Frequency | Probability of Response |
|---|---|---|
| (2 1 0 1 2 1 2 2) | 0.0182 | 0.648 |
| (2 2 2 1 2 2 1 0) | 0.0096 | 0.639 |
| (2 1 1 1 2 1 2 2) | 0.0308 | 0.604 |
| (2 2 2 1 2 2 1 1) | 0.0098 | 0.586 |
| (2 1 1 2 2 1 2 2) | 0.0163 | 0.369 |
| (2 2 2 2 2 2 2 2) | 0.0269 | 0.357 |
| (1 2 2 2 1 2 1 0) | 0.0081 | 0.249 |
| (1 2 2 2 1 2 1 1) | 0.0176 | 0.246 |
| (2 1 2 1 2 1 0 2) | 0.0086 | 0.202 |
| (2 2 2 2 2 1 2 2) | 0.0430 | 0.141 |
| (2 2 2 2 2 1 1 2) | 0.0090 | 0.138 |
| (1 2 2 2 1 2 0 0) | 0.0080 | 0.138 |
| (1 2 2 2 1 2 0 1) | 0.0078 | 0.133 |
| (0 0 0 0 0 0 1 0) | 0.0147 | 0.063 |
| (0 0 0 0 0 0 1 1) | 0.0074 | 0.037 |
| (0 0 0 0 0 0 0 1) | 0.0086 | 0.026 |
| (0 0 0 0 1 0 0 0) | 0.0158 | 0.015 |
| (0 0 0 0 0 0 0 0) | 0.0603 | 0.014 |
| (0 0 0 0 0 0 2 1) | 0.0085 | 0.013 |
| (1 0 0 0 0 0 0 0) | 0.0187 | 0.007 |
| Immune Marker Configuration (CXCR3, CCR4, CD8, CXCR5) | Configuration Frequency | Probability of Response |
|---|---|---|
| (2 1 2 2) | 0.0352 | 0.406 |
| (2 2 2 2) | 0.1520 | 0.377 |
| (2 2 1 2) | 0.0401 | 0.347 |
| (1 2 2 2) | 0.0384 | 0.226 |
| (1 1 1 1) | 0.0404 | 0.089 |
| (0 0 1 0) | 0.0351 | 0.039 |
| (0 1 0 0) | 0.0377 | 0.018 |
| (0 0 0 1) | 0.0412 | 0.008 |
| (0 0 0 0) | 0.1240 | 0.008 |
| (1 0 0 0) | 0.0289 | 0.005 |
| Variable | Logistic Regression Classification Accuracy(Responders vs. Nonresponders) | Point-Biserial Correlation with Response Status |
|---|---|---|
| CXCR3 | 68.34% | 0.32 |
| CCR10 | 67.80% | −0.12 |
| CD73 | 67.50% | 0.12 |
| CCR6 | 67.72% | 0.05 |
| CD25 | 67.82% | −0.15 |
| ICOS | 67.80% | 0.06 |
| CXCR5 | 67.67% | 0.10 |
| PD-1 | 69.12% | −0.21 |
| CD127 | 67.80% | 0.26 |
| CCR4 | 67.96% | −0.18 |
| Response | 100.00% | 1.00 |
| Feature | Earth Mover’s Distance | Energy Distance |
|---|---|---|
| CXCR3 | 55.660 | 5.569 |
| CCR10 | 11.506 | 1.262 |
| CD73 | 9.819 | 1.238 |
| CCR6 | 1.741 | 0.435 |
| CD25 | 22.011 | 2.028 |
| ICOS | 6.788 | 0.916 |
| CXCR5 | 10.083 | 1.169 |
| PD-1 | 4.999 | 1.066 |
| CD127 | 15.686 | 2.607 |
| CCR4 | 6.479 | 1.218 |
| Model | Classification Accuracy | Coefficients, in order of: {(’CXCR3’, ’CCR10’, ’CD73’, ’CCR6’, ’CD25’, ’ICOS’, ’CXCR5’, ’PD-1’, ’CD127’, ’CCR4’)} - (Intercept) |
|---|---|---|
| L2, lbfgs logistic regression | 79.8128% | {(1.3640, −1.0545, 0.3220, 0.1558, −0.2632, −0.2438, −0.6944, −0.5492, 0.4632, −0.2202)} (−1.0805) |
| L2, liblinear logistic regression | 79.8107% | {(1.3641, −1.0547, 0.3220, 0.1558, −0.2632, −0.2438, −0.6943, −0.5492, 0.4633, −0.2202)} (−1.0806) |
| L1, liblinear logistic regression | 79.8102% | {(1.3636, −1.0542, 0.3219, 0.1557, −0.2631, −0.2437, −0.6939, −0.5591, 0.4632, −0.2201)} (−1.0803) |
Publisher’s Note: MDPI stays neutral with regard to jurisdictional claims in published maps and institutional affiliations. |
© 2021 by the authors. Licensee MDPI, Basel, Switzerland. This article is an open access article distributed under the terms and conditions of the Creative Commons Attribution (CC BY) license (http://creativecommons.org/licenses/by/4.0/).
Share and Cite
Rodin, A.S.; Gogoshin, G.; Hilliard, S.; Wang, L.; Egelston, C.; Rockne, R.C.; Chao, J.; Lee, P.P. Dissecting Response to Cancer Immunotherapy by Applying Bayesian Network Analysis to Flow Cytometry Data. Int. J. Mol. Sci. 2021, 22, 2316. https://doi.org/10.3390/ijms22052316
Rodin AS, Gogoshin G, Hilliard S, Wang L, Egelston C, Rockne RC, Chao J, Lee PP. Dissecting Response to Cancer Immunotherapy by Applying Bayesian Network Analysis to Flow Cytometry Data. International Journal of Molecular Sciences. 2021; 22(5):2316. https://doi.org/10.3390/ijms22052316
Chicago/Turabian StyleRodin, Andrei S., Grigoriy Gogoshin, Seth Hilliard, Lei Wang, Colt Egelston, Russell C. Rockne, Joseph Chao, and Peter P. Lee. 2021. "Dissecting Response to Cancer Immunotherapy by Applying Bayesian Network Analysis to Flow Cytometry Data" International Journal of Molecular Sciences 22, no. 5: 2316. https://doi.org/10.3390/ijms22052316
APA StyleRodin, A. S., Gogoshin, G., Hilliard, S., Wang, L., Egelston, C., Rockne, R. C., Chao, J., & Lee, P. P. (2021). Dissecting Response to Cancer Immunotherapy by Applying Bayesian Network Analysis to Flow Cytometry Data. International Journal of Molecular Sciences, 22(5), 2316. https://doi.org/10.3390/ijms22052316


