
ADAM10 Plasma and CSF Levels Are Increased in Mild Alzheimer’s Disease


Abstract
:1. Introduction
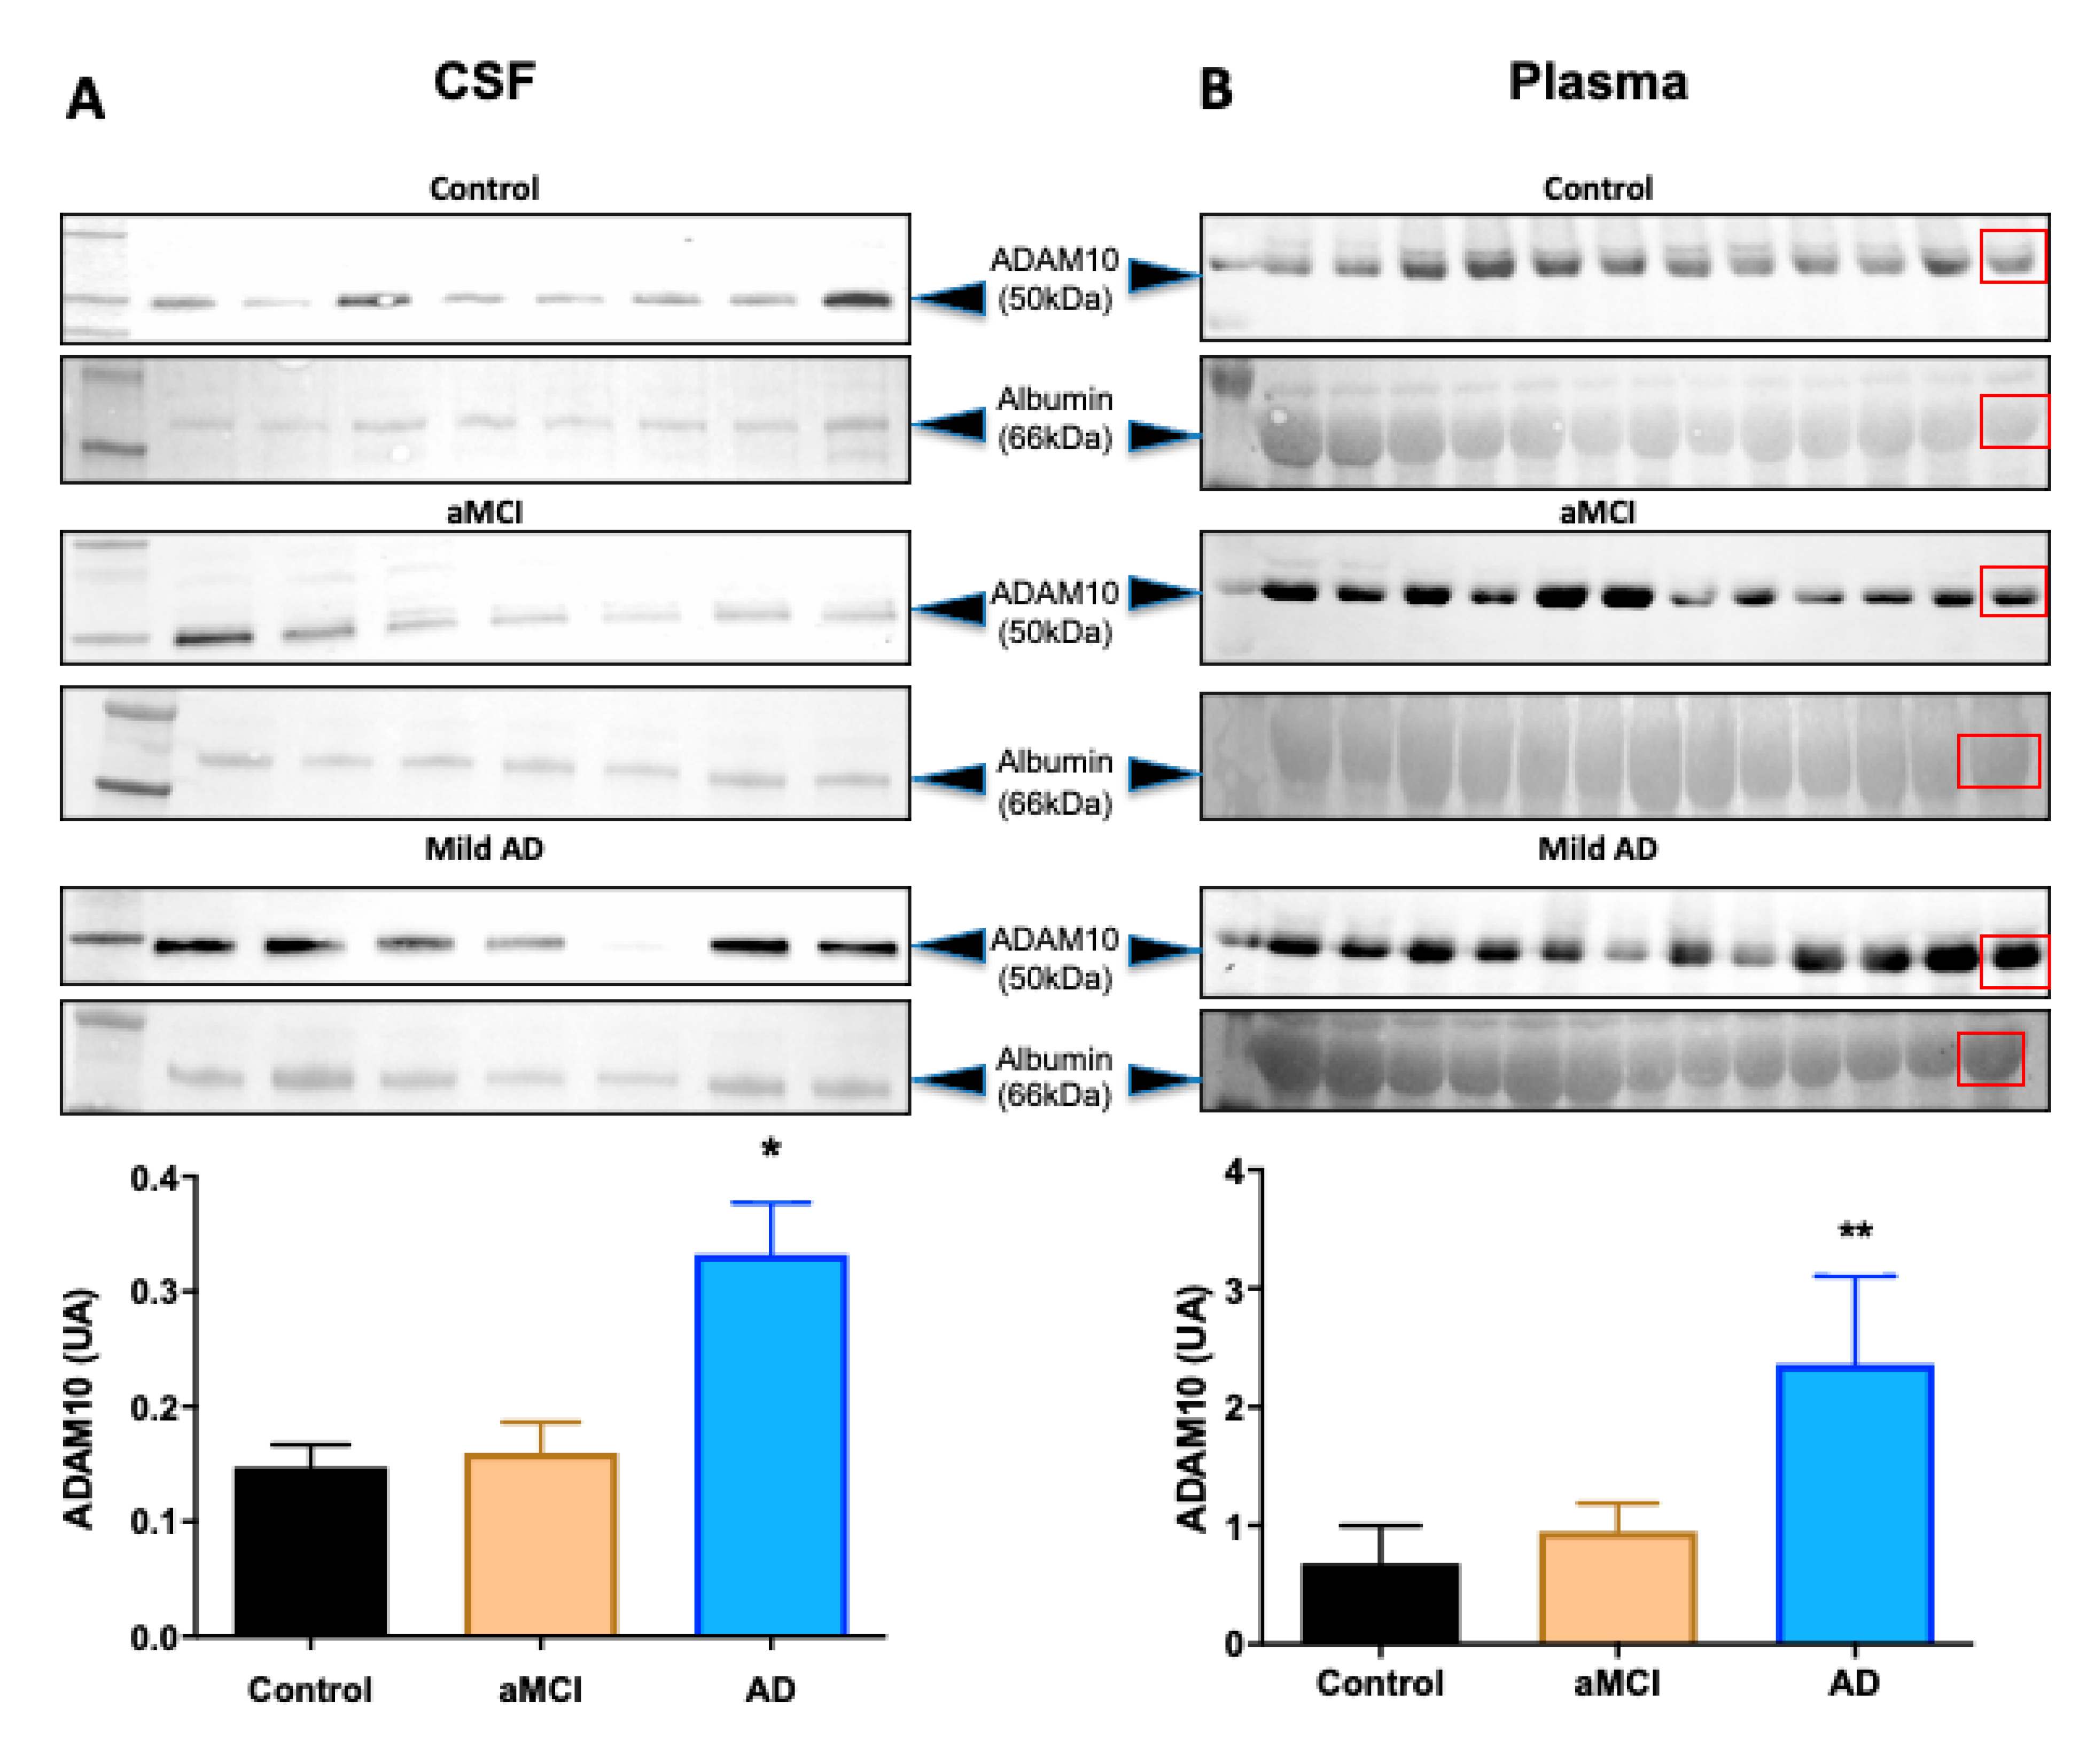
2. Results
3. Discussion
4. Materials and Methods
4.1. Patients
4.2. Blood and CSF Collection
4.3. Cell Culture
4.4. Subcellular Fractionations
4.5. SDS-PAGE and Western Blotting
4.6. ADAM10 Activity Assay
4.7. Statistical Analysis
Supplementary Materials
Author Contributions
Funding
Institutional Review Board Statement
Informed Consent Statement
Data Availability Statement
Conflicts of Interest
Abbreviations
| AD | Alzheimer’s Disease |
| ADAM10 | A Disintegrin And Metallopeptidase 10 |
| Aβ | β-amyloid |
| aMCI | Amnestic Mild Cognitive Impairment |
| CSF | Cerebrospinal Fluid |
| APP | Amyloid Precursor Protein |
| NIA/AA | National Institute on Aging/Alzheimer’s Association |
| CDR | Clinical Dementia Rating |
| PS | Phosphatidylserine |
| MMSE | Mini Mental Status Examination |
| PRP | Platelet-Rich Plasma |
| PPP | Platelet-Poor Plasma |
| DMEM | Dulbecco’s Modified Eagle Medium |
| FBS | Fetal Bovine Serum |
| PBS | Phosphate-Buffered Saline |
| NMDA | N-methyl-D-aspartate |
| SAP97 | Synapse-associated Protein 97 |
| TSPs | Tetraspanins |
| GPVI | Glycoprotein VI |
| FRET | Sensitive Fluorescence Resonance Energy Transfer |
| TIMPs | Tissue Inhibitors of Metalloproteinases |
| MMP | Metalloproteinases |
References
- Colom-Cadena, M.; Spires-Jones, T.; Zetterberg, H.; Blennow, K.; Caggiano, A.; DeKosky, S.T.; Fillit, H.; Harrison, J.E.; Schneider, L.S.; Scheltens, P.; et al. The clinical promise of biomarkers of synapse damage or loss in Alzheimer’s disease. Alzheimer Res. Ther. 2020, 12, 1–12. [Google Scholar] [CrossRef]
- Hardy, J.; Selkoe, D.J. The amyloid hypothesis of Alzheimer’s disease: Progress and problems on the road to therapeutics. Science 2002, 297, 353–356. [Google Scholar] [CrossRef] [Green Version]
- Endres, K.; Deller, T. Regulation of Alpha-Secretase ADAM10 In vitro and In vivo: Genetic, Epigenetic, and Protein-Based Mechanisms. Front. Mol. Neurosci. 2017, 10, 56. [Google Scholar] [CrossRef]
- Blennow, K.; Zetterberg, H. The Past and the Future of Alzheimer’s Disease Fluid Biomarkers. J. Alzheimers Dis. 2018, 62, 1125–1140. [Google Scholar] [CrossRef] [PubMed] [Green Version]
- Manzine, P.R.; Barham, E.J.; Vale, F.A.C.; Selistre-de-Araújo, H.S.; Pavarini, S.C.I.; Cominetti, M.R. Platelet a disintegrin and metallopeptidase 10 expression correlates with clock drawing test scores in Alzheimer’s disease. Int. J. Geriatr. Psychiatry 2014, 29, 414–420. [Google Scholar] [CrossRef]
- Manzine, P.R.; Barham, E.J.; Vale, F.A.C.; Selistre-de-Araújo, H.S.; Iost Pavarini, S.C.; Cominetti, M.R. Correlation between mini-mental state examination and platelet ADAM10 expression in Alzheimer’s disease. J. Alzheimers Dis. 2013, 36, 253–260. [Google Scholar] [CrossRef] [PubMed]
- Manzine, P.R.; Bram, J.M.D.F.; Barham, E.J.; Vale, F.D.A.C.D.; Selistre-De-Araújo, H.S.; Cominetti, M.R.; Pavarini, S.C.I. ADAM10 as a Biomarker for Alzheimer’s Disease: A Study with Brazilian Elderly. Dement. Geriatr. Cogn. Disord. 2013, 35, 58–66. [Google Scholar] [CrossRef] [PubMed]
- Colciaghi, F.; Marcello, E.; Borroni, B.; Zimmermann, M.; Caltagirone, C.; Cattabeni, F.; Padovani, A.; Di Luca, M. Platelet APP, ADAM 10 and BACE alterations in the early stages of Alzheimer disease. Neurology 2004, 62, 498–501. [Google Scholar] [CrossRef] [PubMed]
- Manzine, P.R.; Ettcheto, M.; Cano, A.; Busquets, O.; Marcello, E.; Pelucchi, S.; di Luca, M.; Endres, K.; Olloquequi, J.; Camins, A.; et al. ADAM10 in Alzheimer’s disease: Pharmacological modulation by natural compounds and its role as a peripheral marker. Biomed. Pharmacother. 2019, 113, 108661. [Google Scholar] [CrossRef]
- Schuck, F.; Wolf, D.; Fellgiebel, A.; Endres, K. Increase of α-Secretase ADAM10 in Platelets Along Cognitively Healthy Aging. J. Alzheimers Dis. 2016, 50, 817–826. [Google Scholar] [CrossRef]
- Lundgren, J.L.; Vandermeulen, L.; Sandebring-Matton, A.; Ahmed, S.; Winblad, B.; di Luca, M.; Tjernberg, L.O.; Marcello, E.; Frykman, S. Proximity ligation assay reveals both pre- and postsynaptic localization of the APP-processing enzymes AD-AM10 and BACE1 in rat and human adult brain. BMC Neurosci. 2020, 21, 6. [Google Scholar] [CrossRef]
- Endres, K.; Fahrenholz, F. The Role of the Anti-Amyloidogenic Secretase ADAM10 in Shedding the APP-like Proteins. Curr. Alzheimer Res. 2012, 9, 157–164. [Google Scholar] [CrossRef] [PubMed]
- Seifert, A.; Düsterhöft, S.; Wozniak, J.; Koo, C.Z.; Tomlinson, M.G.; Nuti, E.; Rossello, A.; Cuffaro, D.; Yildiz, D.; Ludwig, A. The metalloproteinase ADAM10 requires its activity to sustain surface expression. Cell. Mol. Life Sci. 2021, 78, 715–732. [Google Scholar] [CrossRef] [PubMed]
- Bleibaum, F.; Sommer, A.; Veit, M.; Rabe, B.; Andrä, J.; Kunzelmann, K.; Nehls, C.; Correa, W.; Gutsmann, T.; Grötzinger, J.; et al. ADAM10 sheddase activation is controlled by cell membrane asymmetry. J. Mol. Cell Biol. 2019, 11, 979–993. [Google Scholar] [CrossRef] [Green Version]
- De Oliveira, T.R.; Erbereli, C.R.; Manzine, P.R.; Magalhães, T.N.C.; Balthazar, M.L.F.; Cominetti, M.R.; Faria, R.C. Early Diagnosis of Alzheimer’s Disease in Blood Using a Disposable Electrochemical Microfluidic Platform. ACS Sens. 2020, 5, 1010–1019. [Google Scholar] [CrossRef]
- Skalnikova, H.K.; Bohuslavova, B.; Turnovcova, K.; Juhasova, J.; Juhas, S.; Rodinova, M.; Vodicka, P. Isolation and Characterization of Small Extracellular Vesicles from Porcine Blood Plasma, Cerebrospinal Fluid, and Seminal Plasma. Proteomes 2019, 7, 17. [Google Scholar] [CrossRef] [PubMed] [Green Version]
- Baghirova, S.; Hughes, B.G.; Hendzel, M.J.; Schulz, R. Sequential fractionation and isolation of subcellular proteins from tissue or cultured cells. MethodsX 2015, 2, 440–445. [Google Scholar] [CrossRef] [PubMed]
- Schulz, I. Permeabilizing cells: Some methods and applications for the study of intracellular processes. Methods Enzymol. 1990, 192, 280–300. [Google Scholar] [CrossRef]
- Peron, R.; Vatanabe, I.P.; Manzine, P.R.; Camins, A.; Cominetti, M.R. Alpha-Secretase ADAM10 Regulation: Insights into Alzheimer’s Disease Treatment. Pharmaceuticals 2018, 11, 12. [Google Scholar] [CrossRef] [Green Version]
- Colciaghi, F.; Borroni, B.; Pastorino, L.; Marcello, E.; Zimmermann, M.; Cattabeni, F.; Padovani, A.; Di Luca, M. α-Secretase ADAM10 as Well as αAPPs Is Reduced in Platelets and CSF of Alzheimer Disease Patients. Mol. Med. 2002, 8, 67–74. [Google Scholar] [CrossRef] [Green Version]
- Ebsen, H.; Schröder, A.; Kabelitz, D.; Janssen, O. Differential Surface Expression of ADAM10 and ADAM17 on Human T Lymphocytes and Tumor Cells. PLoS ONE 2013, 8, e76853. [Google Scholar] [CrossRef] [PubMed]
- Pruessmeyer, J.; Hess, F.M.; Alert, H.; Groth, E.; Pasqualon, T.; Schwarz, N.; Nyamoya, S.; Kollert, J.; Van Der Vorst, E.; Donners, M.; et al. Leukocytes require ADAM10 but not ADAM17 for their migration and inflammatory recruitment into the alveolar space. Blood 2014, 123, 4077–4088. [Google Scholar] [CrossRef] [Green Version]
- Marcello, E.; Gardoni, F.; Di Luca, M.; Pérez-Otaño, I. An Arginine Stretch Limits ADAM10 Exit from the Endoplasmic Reticulum. J. Biol. Chem. 2010, 285, 10376–10384. [Google Scholar] [CrossRef] [Green Version]
- Schafer, W.; Stroh, A.; Berghöfer, S.; Seiler, J.; Vey, M.; Kruse, M.L.; Kern, H.F.; Klenk, H.D.; Garten, W. Two independent targeting signals in the cytoplasmic domain determine trans-Golgi network localization and endosomal trafficking of the proprotein convertase furin. EMBO J. 1995, 14, 2424–2435. [Google Scholar] [CrossRef] [PubMed]
- Wouters, S.; Leruth, M.; Decroly, E.; Vandenbranden, M.; Creemers, J.W.M.; De, J.-W.H.P.V.L.; Ruysschaert, J.-M.; Courtoy, P.J. Furin and proprotein convertase 7 (PC7)/lymphoma PC endogenously expressed in rat liver can be resolved into distinct post-Golgi compartments. Biochem. J. 1998, 336 Pt 2, 311–316. [Google Scholar] [CrossRef] [Green Version]
- Sahin, U.; Weskamp, G.; Kelly, K.; Zhou, H.-M.; Higashiyama, S.; Peschon, J.; Hartmann, D.; Saftig, P.; Blobel, C.P. Distinct roles for ADAM10 and ADAM17 in ectodomain shedding of six EGFR ligands. J. Cell Biol. 2004, 164, 769–779. [Google Scholar] [CrossRef] [PubMed] [Green Version]
- Marcello, E.; Gardoni, F.; Mauceri, D.; Romorini, S.; Jeromin, A.; Epis, R.; Borroni, B.; Cattabeni, F.; Sala, C.; Padovani, A.; et al. Synapse-Associated Protein-97 Mediates α-Secretase ADAM10 Trafficking and Promotes Its Activity. J. Neurosci. 2007, 27, 1682–1691. [Google Scholar] [CrossRef] [Green Version]
- Haining, E.J.; Yang, J.; Bailey, R.L.; Khan, K.; Collier, R.; Tsai, S.; Watson, S.P.; Frampton, J.; Garcia, P.; Tomlinson, M.G. The TspanC8 Subgroup of Tetraspanins Interacts with A Disintegrin and Metalloprotease 10 (ADAM10) and Regulates Its Maturation and Cell Surface Expression. J. Biol. Chem. 2012, 287, 39753–39765. [Google Scholar] [CrossRef] [Green Version]
- Dornier, E.; Coumailleau, F.; Ottavi, J.-F.; Moretti, J.; Boucheix, C.; Mauduit, P.; Schweisguth, F.; Rubinstein, E. TspanC8 tetraspanins regulate ADAM10/Kuzbanian trafficking and promote Notch activation in flies and mam-mals. J. Cell Biol. 2012, 199, 481–496. [Google Scholar] [CrossRef] [Green Version]
- Prox, J.; Willenbrock, M.; Weber, S.; Lehmann, T.; Schmidt-Arras, D.; Schwanbeck, R.; Saftig, P.; Schwake, M. Tetraspanin15 regulates cellular trafficking and activity of the ectodomain sheddase ADAM10. Cell. Mol. Life Sci. 2012, 69, 2919–2932. [Google Scholar] [CrossRef] [PubMed]
- Jouannet, S.; Saint-Pol, J.; Fernandez, L.; Nguyen, V.; Charrin, S.; Boucheix, C.; Brou, C.; Milhiet, P.-E.; Rubinstein, E. TspanC8 tetraspanins differentially regulate the cleavage of ADAM10 substrates, Notch activation and ADAM10 membrane compartmentalization. Cell. Mol. Life Sci. 2016, 73, 1895–1915. [Google Scholar] [CrossRef] [PubMed] [Green Version]
- Al-Tamimi, M.; Tan, C.W.; Qiao, J.; Pennings, G.J.; Javadzadegan, A.; Yong, A.S.C.; Arthur, J.F.; Davis, A.K.; Jing, J.; Mu, F.-T.; et al. Pathologic shear triggers shedding of vascular receptors: A novel mechanism for down-regulation of platelet glycoprotein VI in stenosed coronary vessels. Blood 2012, 119, 4311–4320. [Google Scholar] [CrossRef] [PubMed] [Green Version]
- Facey, A.; Pinar, I.; Arthur, J.F.; Qiao, J.; Jing, J.; Mado, B.; Carberry, J.; Andrews, R.K.; Gardiner, E.E. A-Disintegrin-And-Metalloproteinase (ADAM) 10 Activity on Resting and Activated Platelets. Biochemistry 2016, 55, 1187–1194. [Google Scholar] [CrossRef] [PubMed]
- Sogorb-Esteve, A.; García-Ayllón, M.S.; Gobom, J.; Alom, J.; Zetterberg, H.; Blennow, K.; Sáez-Valero, J. Levels of ADAM10 are reduced in Alzheimer’s disease CSF. J. Neuroinflamm. 2018, 15, 213. [Google Scholar] [CrossRef]
- Tamkovich, S.N.; Yunusova, N.V.; Tugutova, E.; Somov, A.K.; Proskura, K.V.; Kolomiets, L.A.; Stakheeva, M.N.; Grigor’Eva, A.E.; Laktionov, P.P.; Kondakova, I.V. Protease Cargo in Circulating Exosomes of Breast Cancer and Ovarian Cancer Patients. Asian Pac. J. Cancer Prev. 2019, 20, 255–262. [Google Scholar] [CrossRef] [Green Version]
- Koh, Y.Q.; Peiris, H.N.; Vaswani, K.; Reed, S.; Rice, G.E.; Salomon, C.; Mitchell, M.D. Characterization of exosomal release in bovine endometrial intercaruncular stromal cells. Reprod. Biol. Endocrinol. 2016, 14, 1–21. [Google Scholar] [CrossRef] [Green Version]
- Yang, M.; Li, Y.; Chilukuri, K.; Brady, O.A.; Boulos, M.I.; Kappes, J.C.; Galileo, D.S. L1 stimulation of human glioma cell motility correlates with FAK activation. J. Neuro Oncol. 2011, 105, 27–44. [Google Scholar] [CrossRef] [Green Version]
- Parkin, E.; Harris, B. A disintegrin and metalloproteinase (ADAM)-mediated ectodomain shedding of ADAM10. J. Neurochem. 2009, 108, 1464–1479. [Google Scholar] [CrossRef]
- Scharfenberg, F.; Helbig, A.; Sammel, M.; Benzel, J.; Schlomann, U.; Peters, F.; Wichert, R.; Bettendorff, M.; Schmidt-Arras, D.; Rose-John, S.; et al. Degradome of soluble ADAM10 and ADAM17 metalloproteases. Cell. Mol. Life Sci. 2020, 77, 331–350. [Google Scholar] [CrossRef]
- Arpino, V.; Brock, M.; Gill, S.E. The role of TIMPs in regulation of extracellular matrix proteolysis. Matrix Biol. 2015, 44-46, 247–254. [Google Scholar] [CrossRef]
- Amour, A.; Knight, C.; Webster, A.; Slocombe, P.M.; Stephens, P.E.; Knäuper, V.; Docherty, A.J.; Murphy, G. The in vitro activity of ADAM-10 is inhibited by TIMP-1 and TIMP-3. FEBS Lett. 2000, 473, 275–279. [Google Scholar] [CrossRef] [Green Version]
- Forlenza, O.V.; Radanovic, M.; Talib, L.L.; Aprahamian, I.; Diniz, B.S.; Zetterberg, H.; Gattaz, W.F. Cerebrospinal fluid biomarkers in Alzheimer’s disease: Diagnostic accuracy and prediction of dementia. Alzheimers Dement. 2015, 1, 455–463. [Google Scholar] [CrossRef] [PubMed]
- Monteiro, M.P.A.O.; Oliveira, D.S.M.S.; Manzine, P.R.; Nascimento, C.M.C.; Orlandi, A.A.D.S.; Gomes, G.A.D.O.; Orlandi, F.D.S.; Zazzetta, M.S.; Pott-Junior, H.; Cominetti, M.R. ADAM10 plasma levels predict worsening in cognition of older adults: A 3-year follow-up study. Alzheimer Res. Ther. 2021, 13, 1–8. [Google Scholar] [CrossRef]
- Albert, M.S.; DeKosky, S.T.; Dickson, D.; Dubois, B.; Feldman, H.H.; Fox, N.C.; Gamst, A.; Holtzman, D.M.; Jagust, W.J.; Petersen, R.C.; et al. The diagnosis of mild cognitive impairment due to Alzheimer’s disease: Recommendations from the National Insti-tute on Aging-Alzheimer’s Association workgroups on diagnostic guidelines for Alzheimer’s disease. Alzheimers Dement. 2011, 7, 270–279. [Google Scholar] [CrossRef] [PubMed] [Green Version]
- Morris, J.C. The Clinical Dementia Rating (CDR): Current version and scoring rules. Neurology 1993, 43, 2412. [Google Scholar] [CrossRef] [PubMed]
- Folstein, M.F.; Folstein, S.E.; McHugh, P.R. Mini-mental state. A practical method for grading the cognitive state of patients for the clinician. J. Psychiatry Res. 1975, 12, 189–198. [Google Scholar] [CrossRef]


| Control | aMCI | Mild AD | |
|---|---|---|---|
| Sex (F/M) | 8/0 | 5/2 | 7/0 |
| Age | 63.7 ± 3.7 | 71.1 ± 6 | 72.7 ± 7 |
| Scholarity (years ± SD) | 10.2 ± 5.37 | 7.4 ± 4.4 | 7.1 ± 4.3 |
| CDR 0 (n) | 8 | 7 | 0 |
| CDR 1(n) | 0 | 0 | 7 |
| CDR2 (n) | 0 | 0 | 0 |
| MEEM (mean ± SD) | 28.3 ± 2.3 | 27 ± 2.1 ** | 19.5 ± 3.6 *** |
| CSF t-tau (pg/mL ± SD) | 80.3 ± 38.4 | 103.3 ± 32.8 | 156.0 ± 86.4 * |
| CSF p-tau181 (pg/mL ± SD) | 35 ± 16.6 | 38 ± 9.7 | 62.6 ± 37.5 * |
| β-amyloid (pg/mL ± SD) | 541.7 ± 302.2 | 530.3 ± 365.2 | 303.2 ± 107.0 |
| CSF ADAM10 (AU) | 0.1475 ± 0.0551 | 0.1598 ± 0.0707 * | 0.3323 ± 0.1185 *,† |
| Plasma ADAM10 (AU) | 0.6805 ± 0.3171 | 0.9512 ± 0.2362 ** | 2.362 ± 0.7428 **,† |
Publisher’s Note: MDPI stays neutral with regard to jurisdictional claims in published maps and institutional affiliations. |
© 2021 by the authors. Licensee MDPI, Basel, Switzerland. This article is an open access article distributed under the terms and conditions of the Creative Commons Attribution (CC BY) license (http://creativecommons.org/licenses/by/4.0/).
Share and Cite
Pereira Vatanabe, I.; Peron, R.; Mantellatto Grigoli, M.; Pelucchi, S.; De Cesare, G.; Magalhães, T.; Manzine, P.R.; Figueredo Balthazar, M.L.; Di Luca, M.; Marcello, E.; et al. ADAM10 Plasma and CSF Levels Are Increased in Mild Alzheimer’s Disease. Int. J. Mol. Sci. 2021, 22, 2416. https://doi.org/10.3390/ijms22052416
Pereira Vatanabe I, Peron R, Mantellatto Grigoli M, Pelucchi S, De Cesare G, Magalhães T, Manzine PR, Figueredo Balthazar ML, Di Luca M, Marcello E, et al. ADAM10 Plasma and CSF Levels Are Increased in Mild Alzheimer’s Disease. International Journal of Molecular Sciences. 2021; 22(5):2416. https://doi.org/10.3390/ijms22052416
Chicago/Turabian StylePereira Vatanabe, Izabela, Rafaela Peron, Marina Mantellatto Grigoli, Silvia Pelucchi, Giulia De Cesare, Thamires Magalhães, Patricia Regina Manzine, Marcio Luiz Figueredo Balthazar, Monica Di Luca, Elena Marcello, and et al. 2021. "ADAM10 Plasma and CSF Levels Are Increased in Mild Alzheimer’s Disease" International Journal of Molecular Sciences 22, no. 5: 2416. https://doi.org/10.3390/ijms22052416