
Novel Cell Permeable Polymers of N-Substituted L-2,3-Diaminopropionic Acid (DAPEGs) and Cellular Consequences of Their Interactions with Nucleic Acids

 , , and
Abstract
:
1. Introduction
2. Results and Discussion
2.1. Synthesis
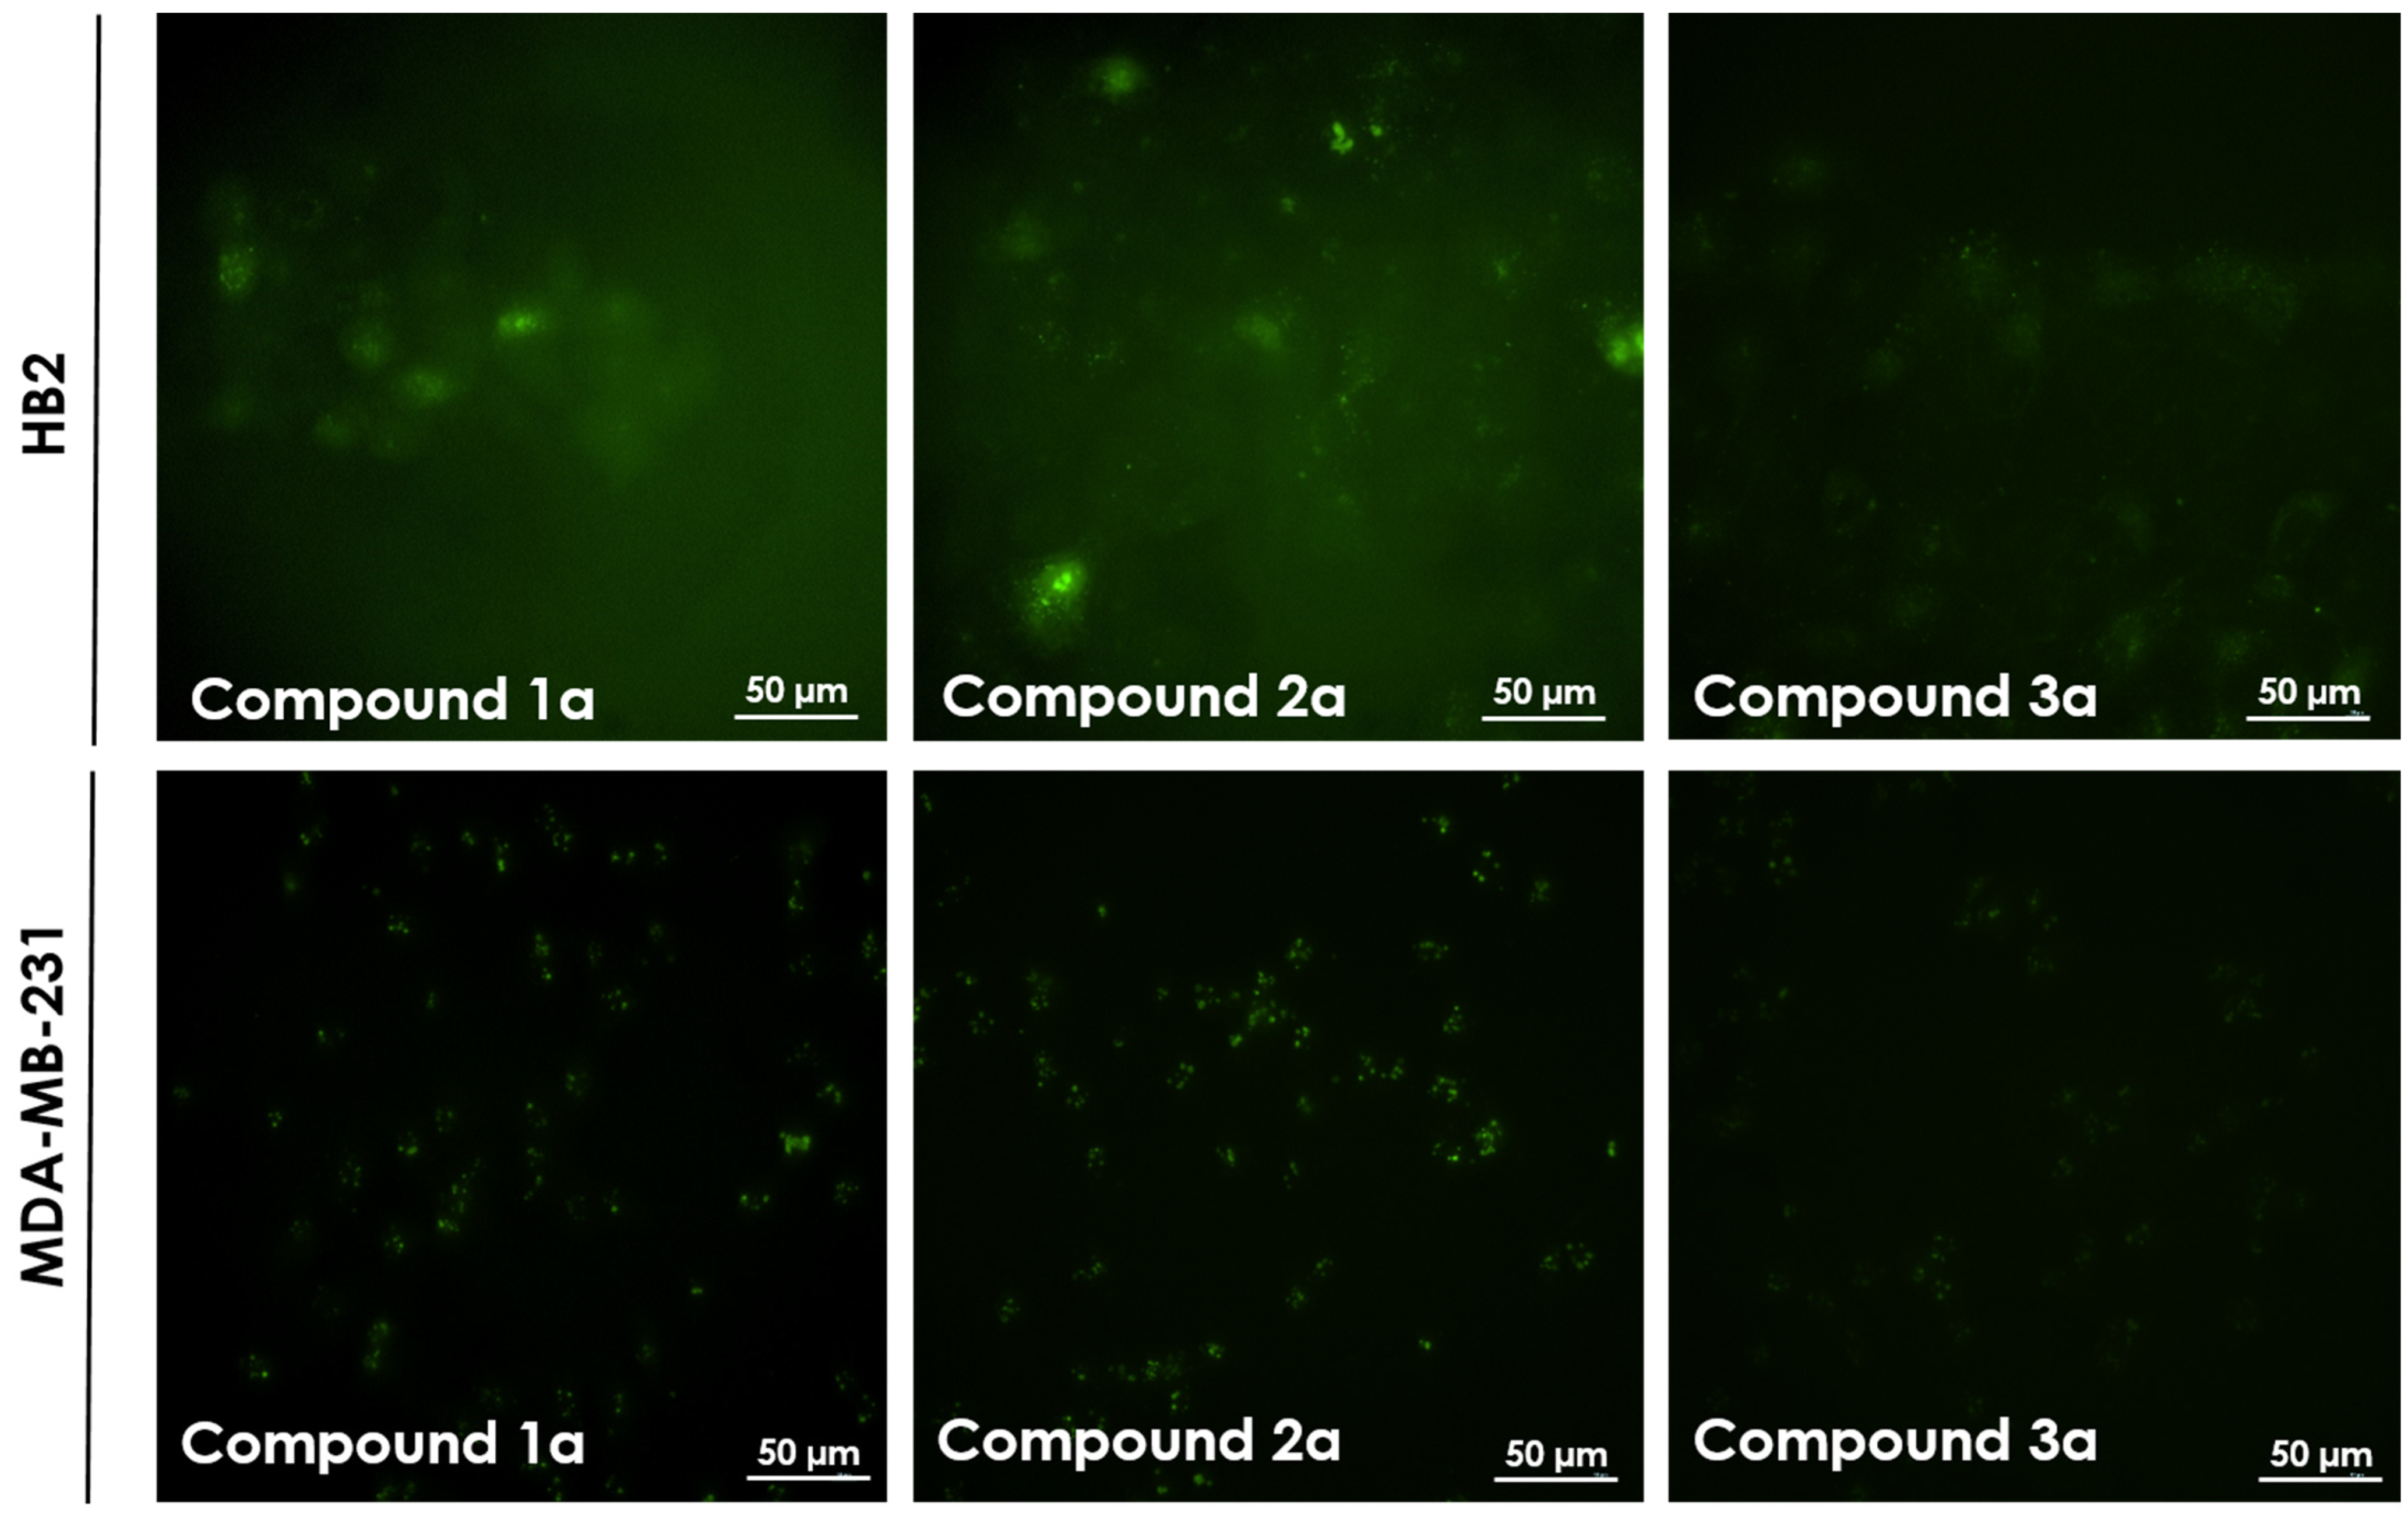
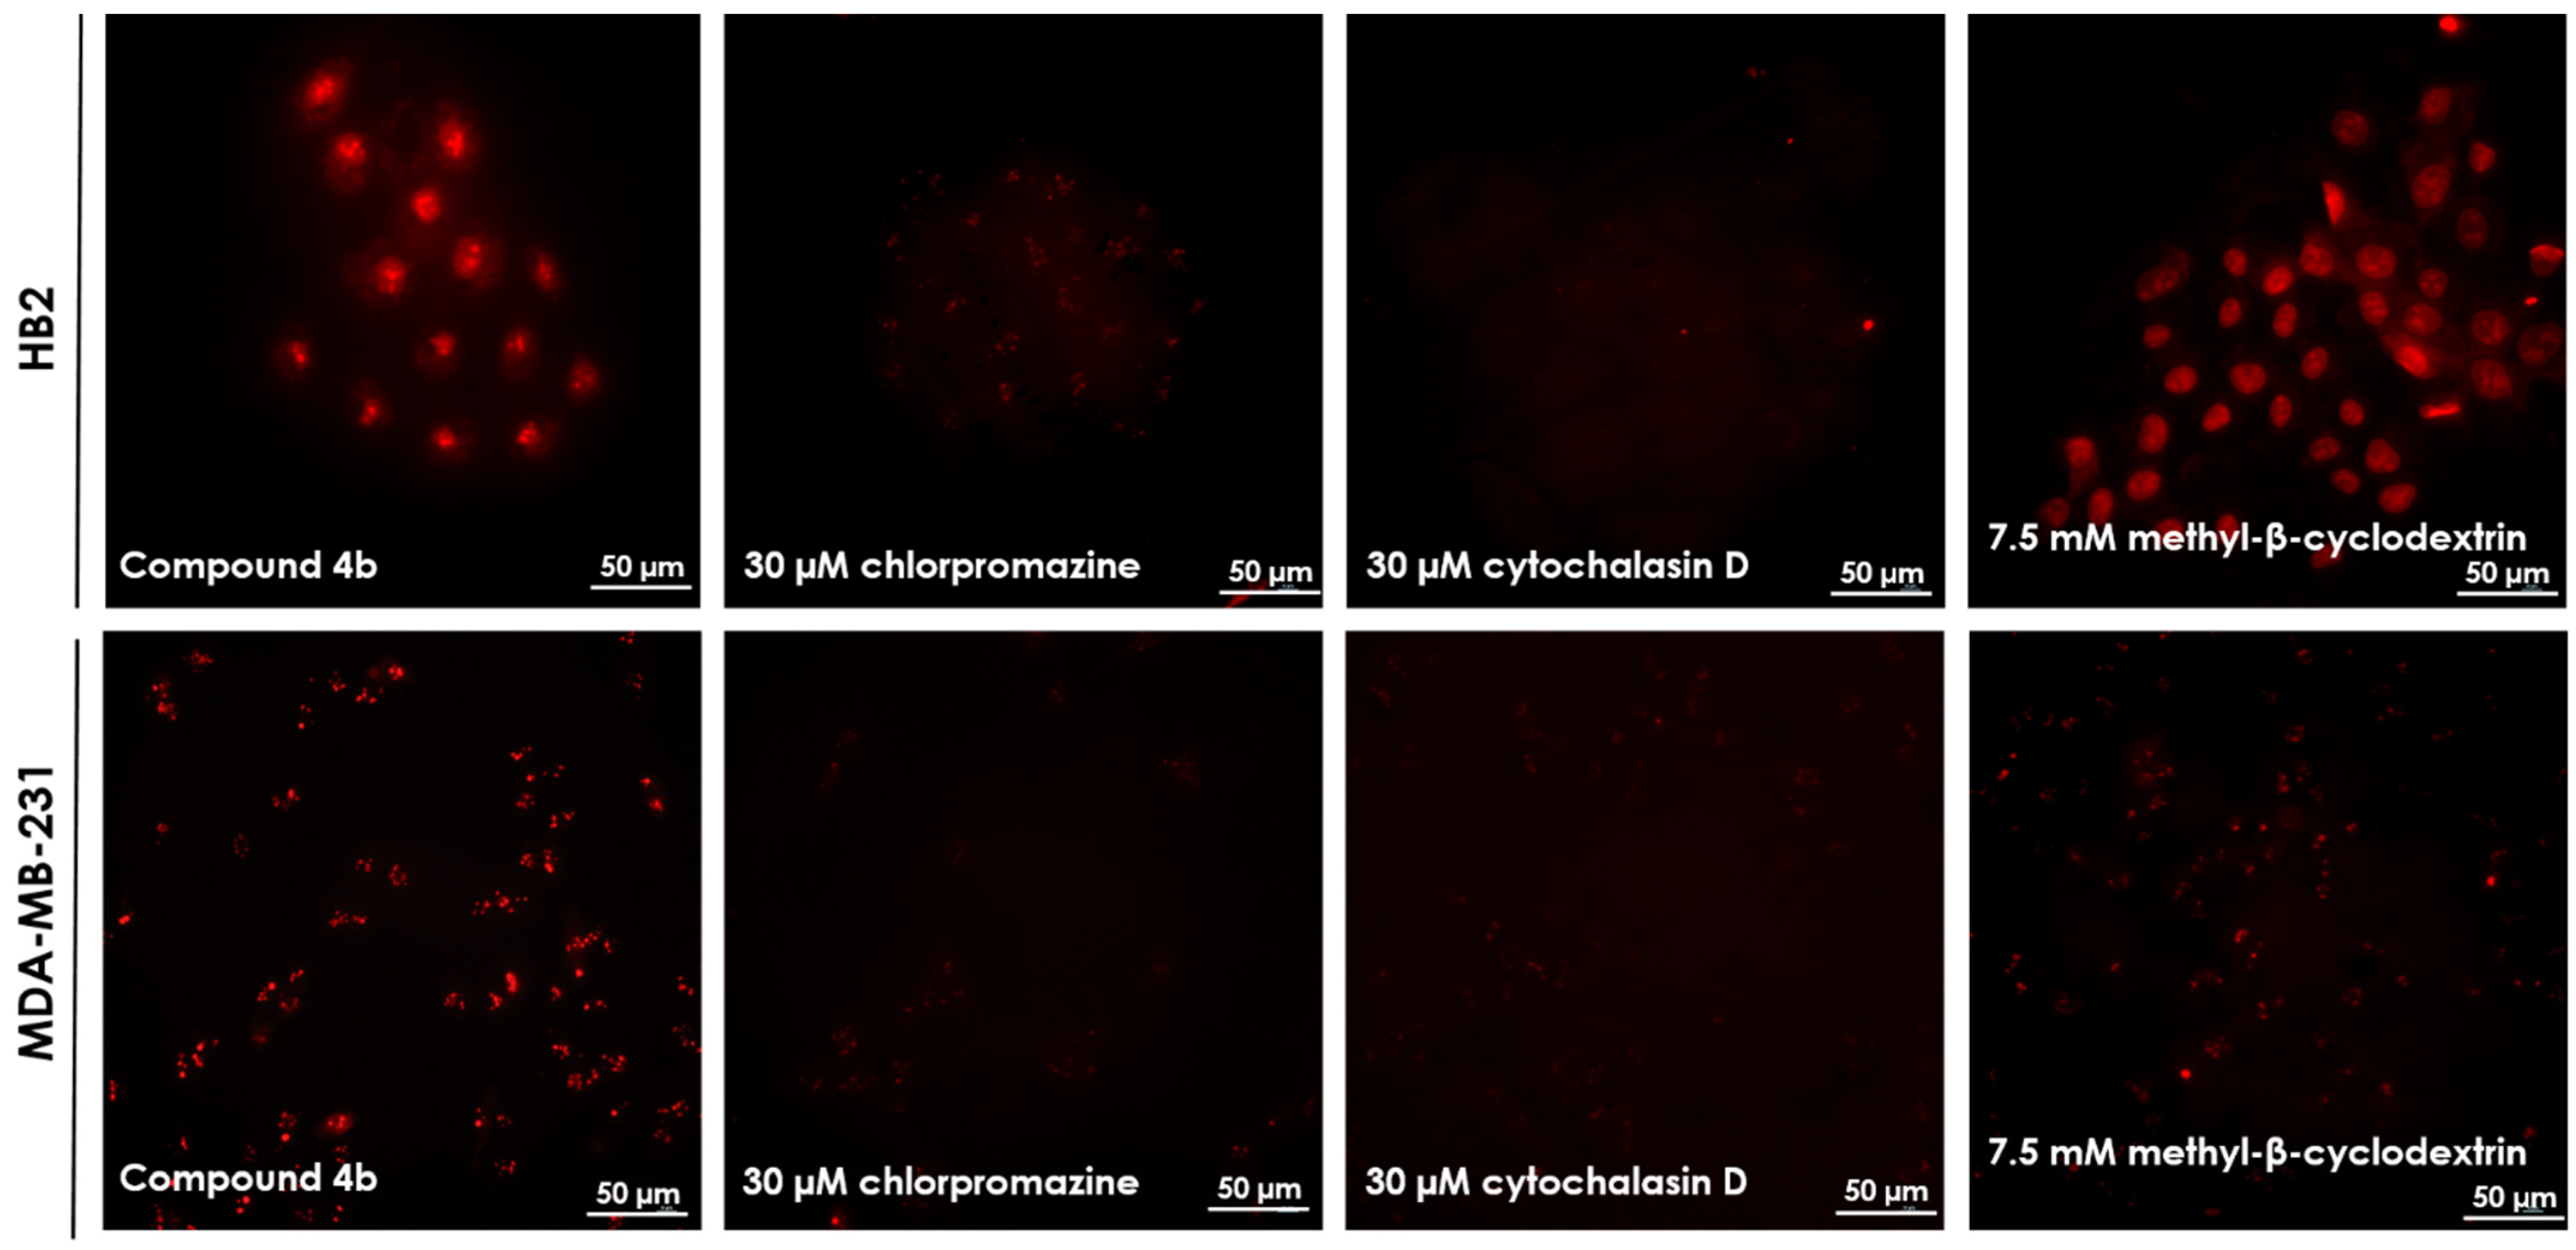
2.2. Cell Permeability and Localization
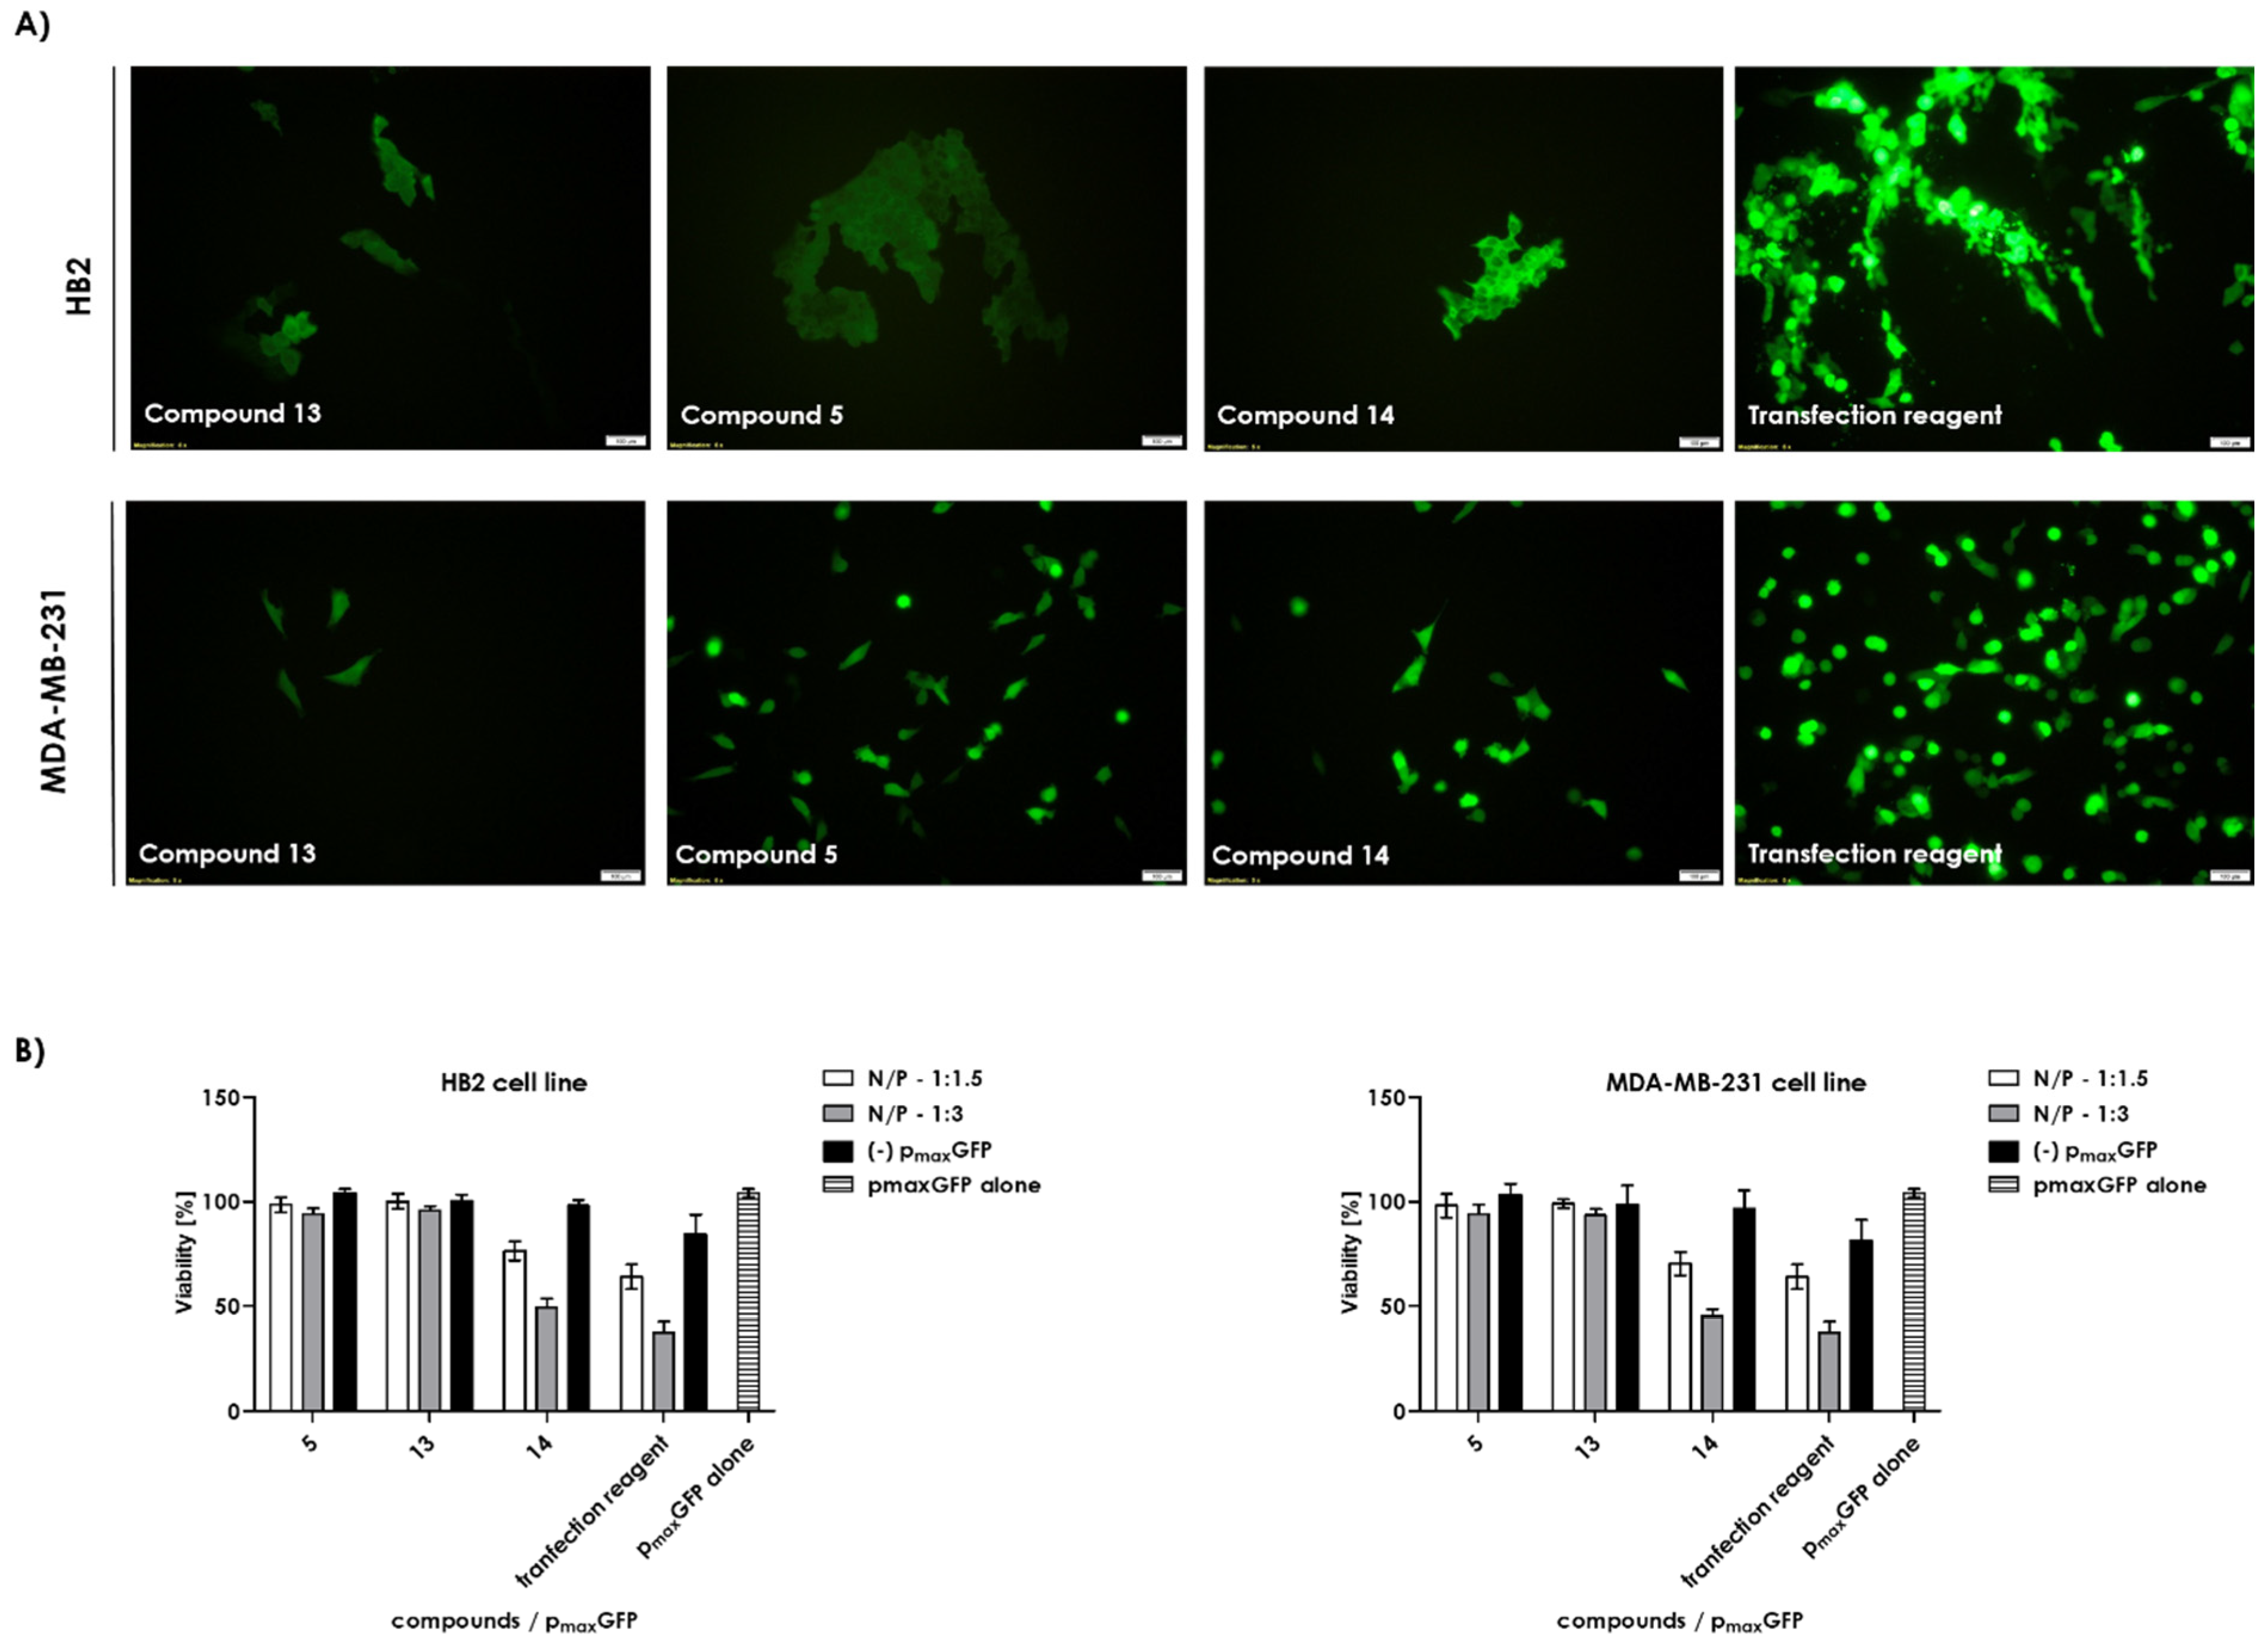
2.3. Transfection
3. Materials and Methods
3.1. Chemistry
Compound Synthesis
3.2. Biology
3.2.1. Cell Culture
3.2.2. Fluorescence Microscopy
3.2.3. Cytotoxicity Assay: MTT
3.2.4. Cytotoxicity Assay–CCK-8
3.2.5. Cytotoxicity of Peptidomimetic–Plasmid pmaxGFP Complexes
3.2.6. Endocytosis Inhibitors
3.2.7. Transfection
3.2.8. Electrophoretic Mobility Shift Assay
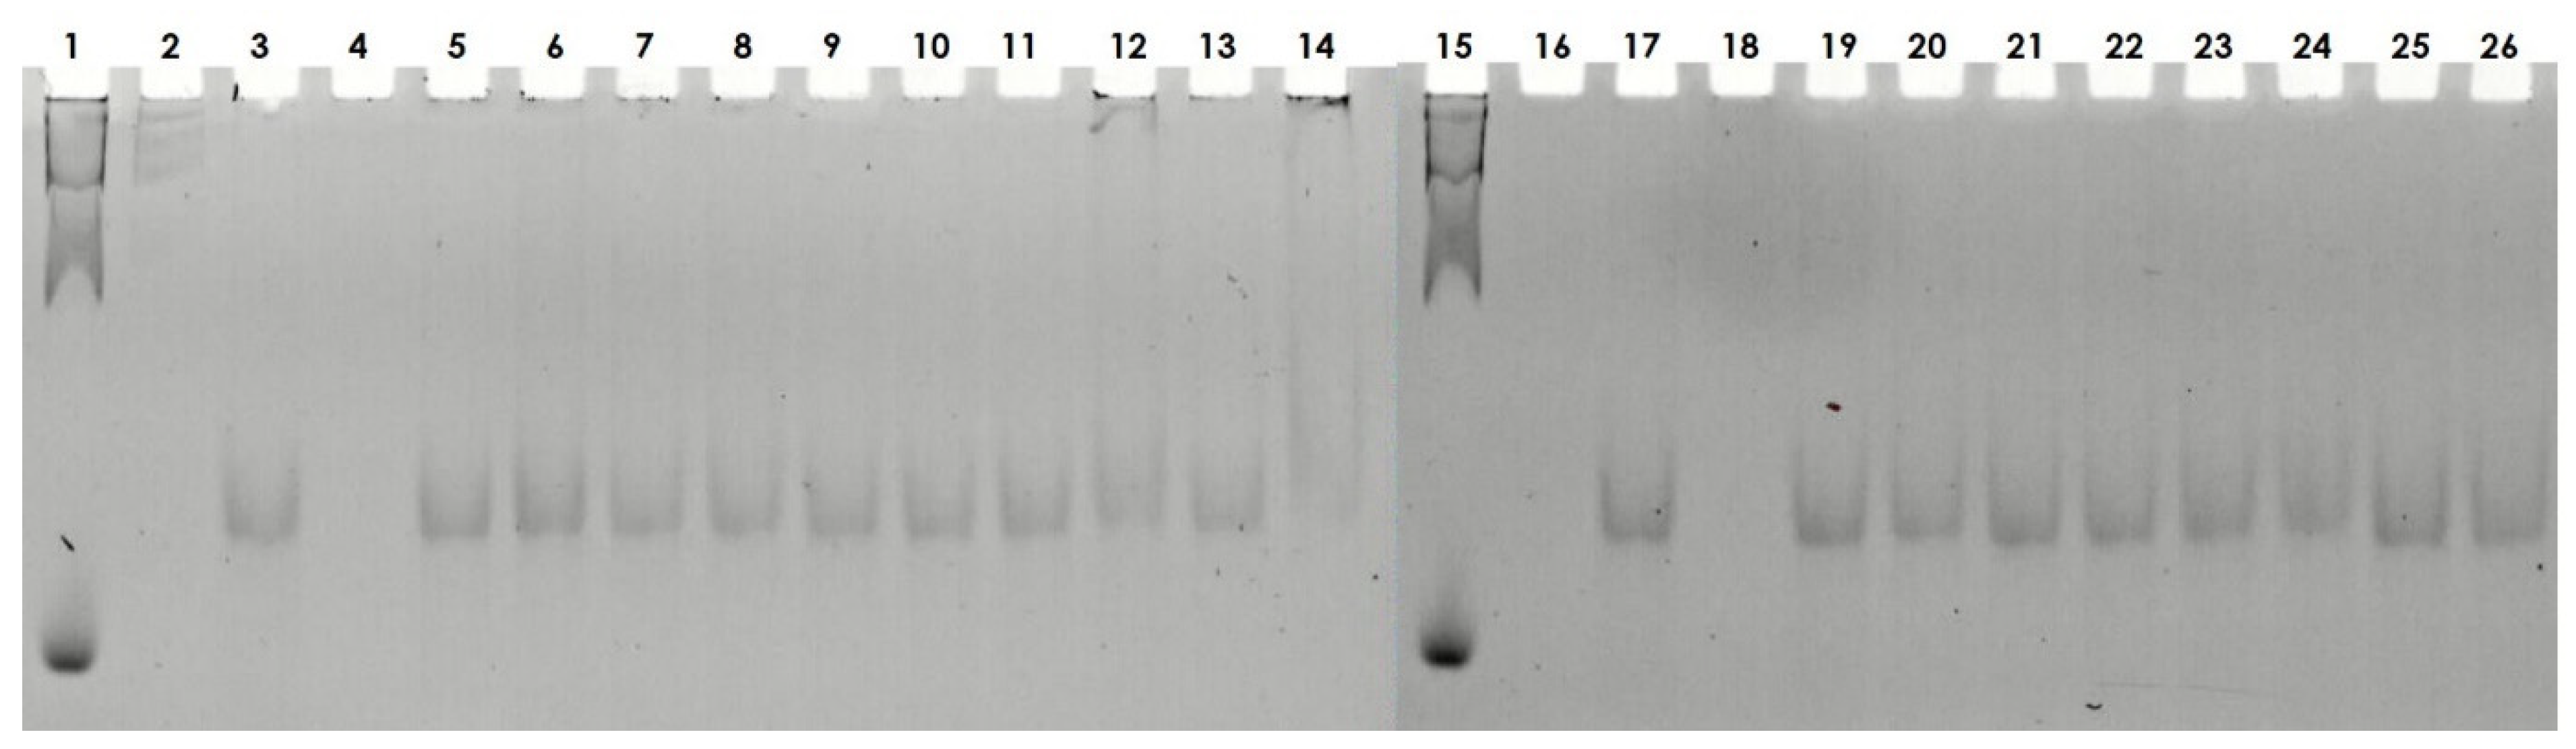
- DNA polyacrylamide gel electrophoresis. The DNA-binding activity of compounds 1a–9a was examined using electrophoretic mobility shift assay. The dsDNA; (76 bp) model fragment) was mixed with the peptidomimetics in various N/P ratios (0.2:1 and 1.5:1; charge peptidomimetic/charge dsDNA); after incubating for 30 min, 4 μL of loading buffer was added to the samples. The DNA–peptidomimetic complexes were resolved by 8% polyacrylamide gel electrophoresis, and the migrated DNA was visualized under UV light using the fluorescent dye Midori Green.
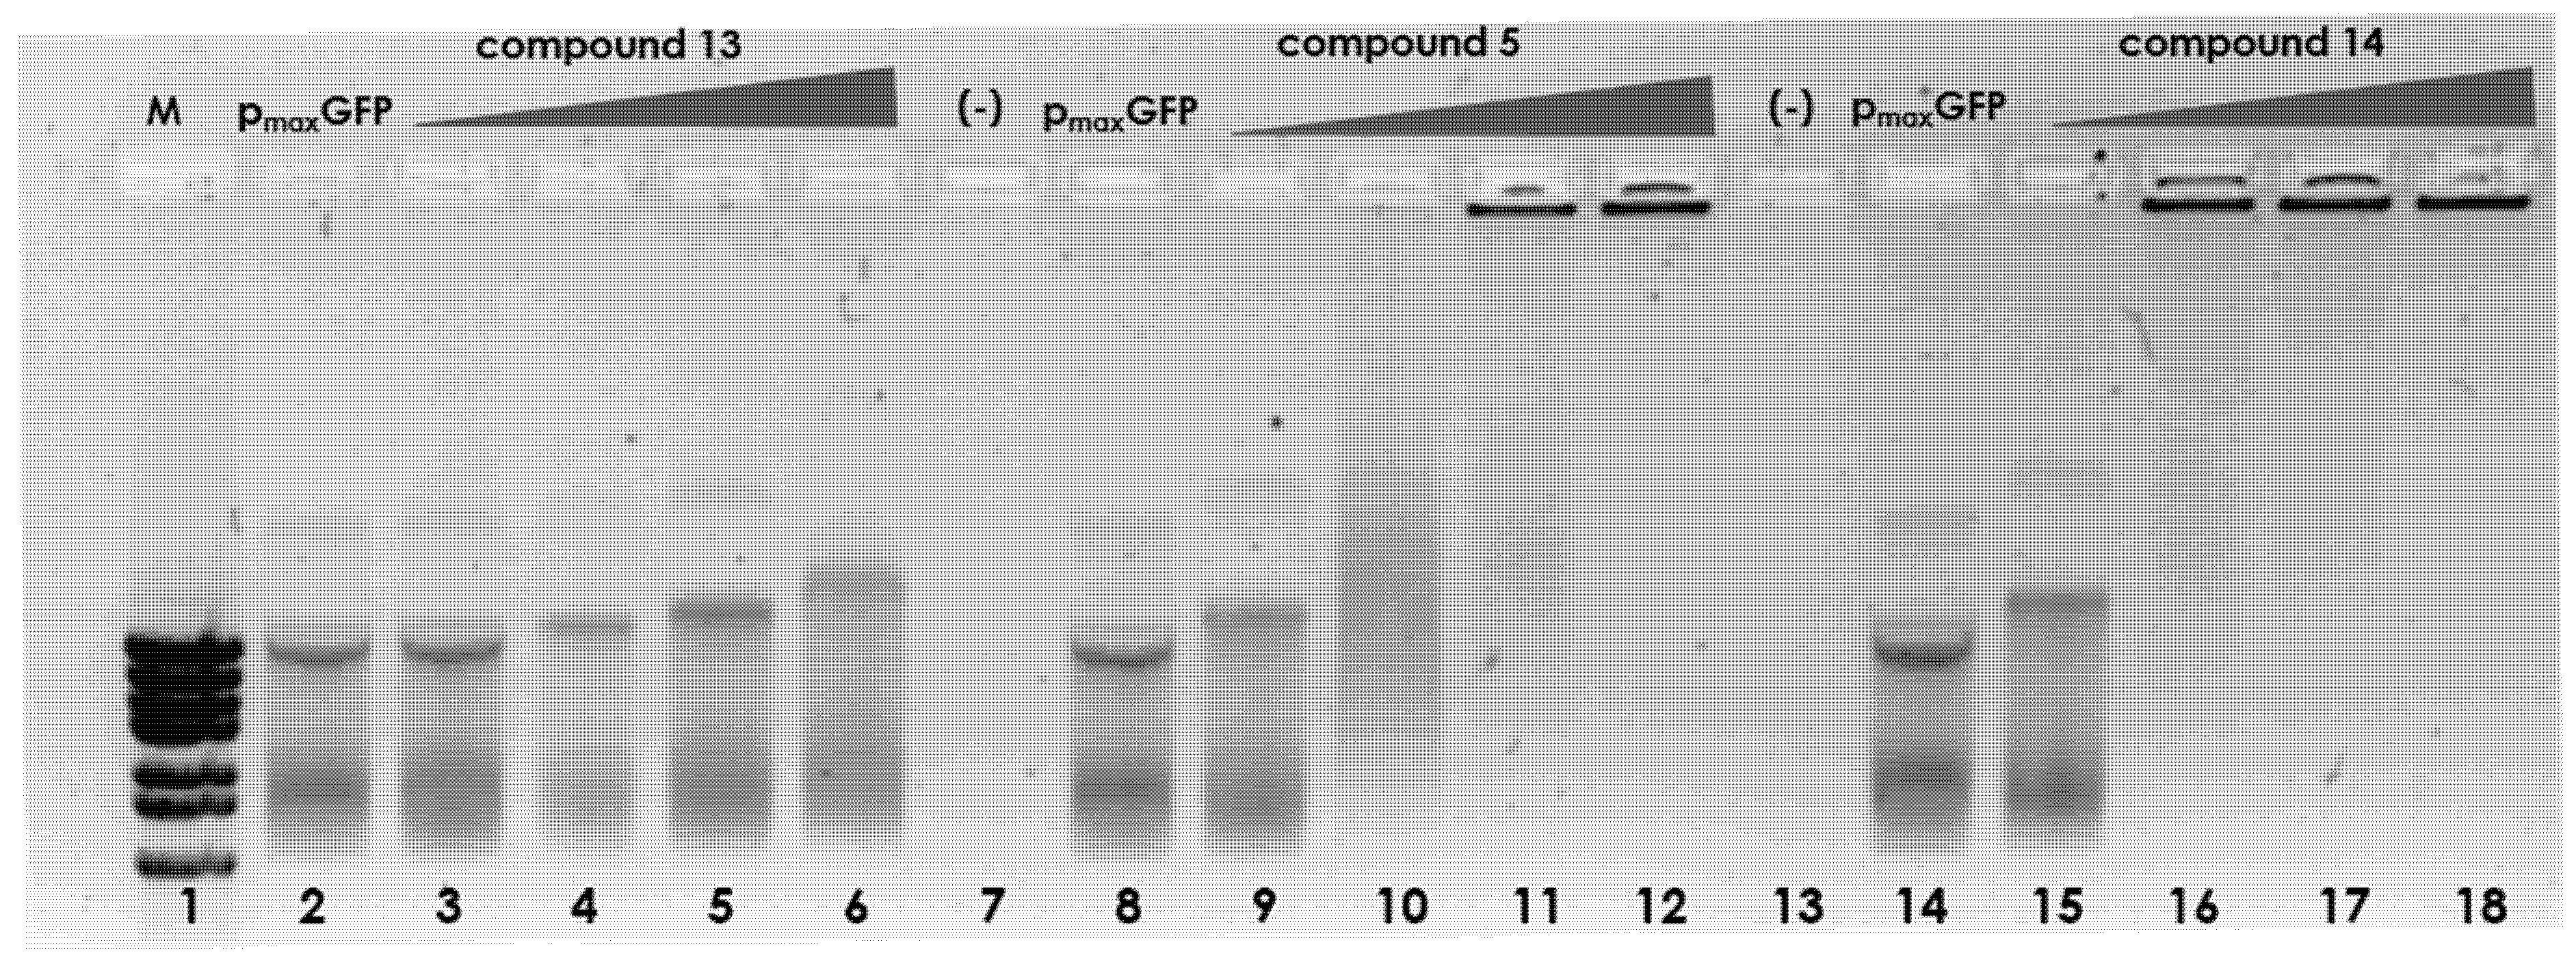
- Agarose gel electrophoresis. To test the interactions of compounds 5, 13, and 14 with DNA, electrophoretic mobility shift assay was performed. The pmaxGFP plasmid was mixed with the peptidomimetics in various N/P ratios (0.2:1, 1:1, 1.5:1, and 3:1; charge peptidomimetic/charge plasmid); after incubating for 30 min, 4 μL of loading buffer was added to the samples. The plasmid–peptidomimetic complexes were resolved by 0.7% agarose gel electrophoresis, and the migrated DNA was visualized under UV light using the fluorescent dye Midori Green.
3.2.9. Molecular Dynamics
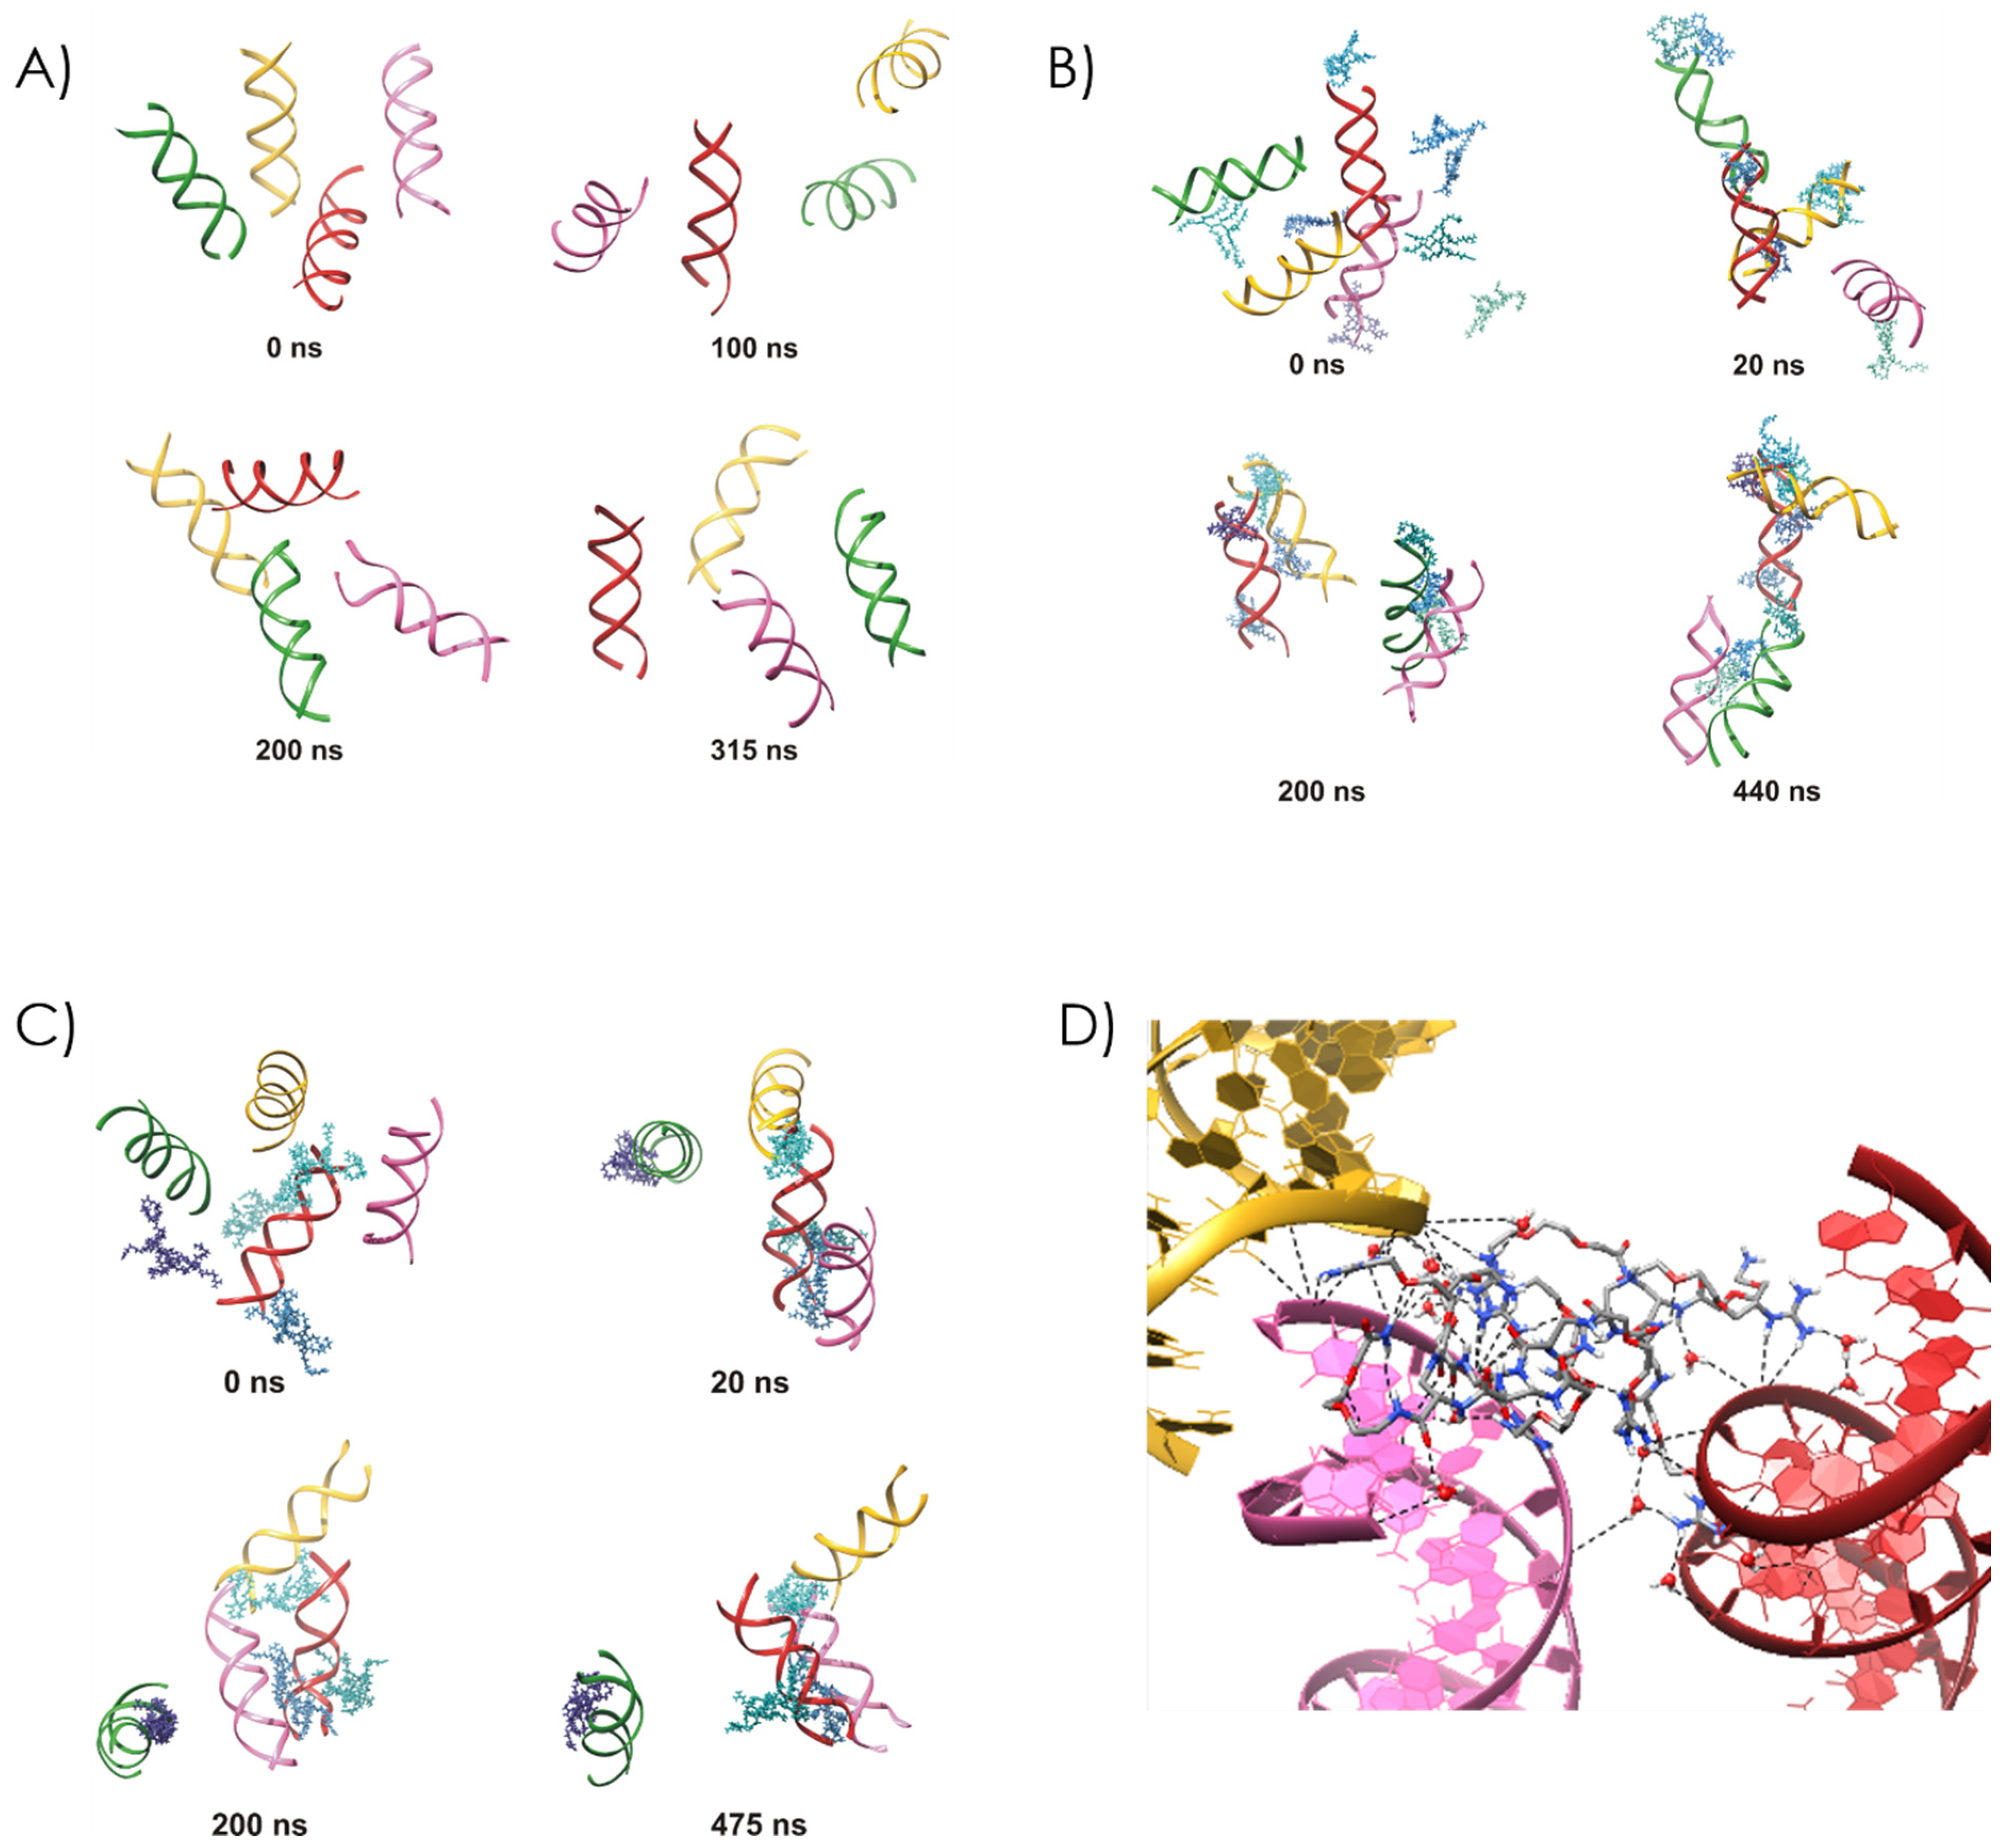
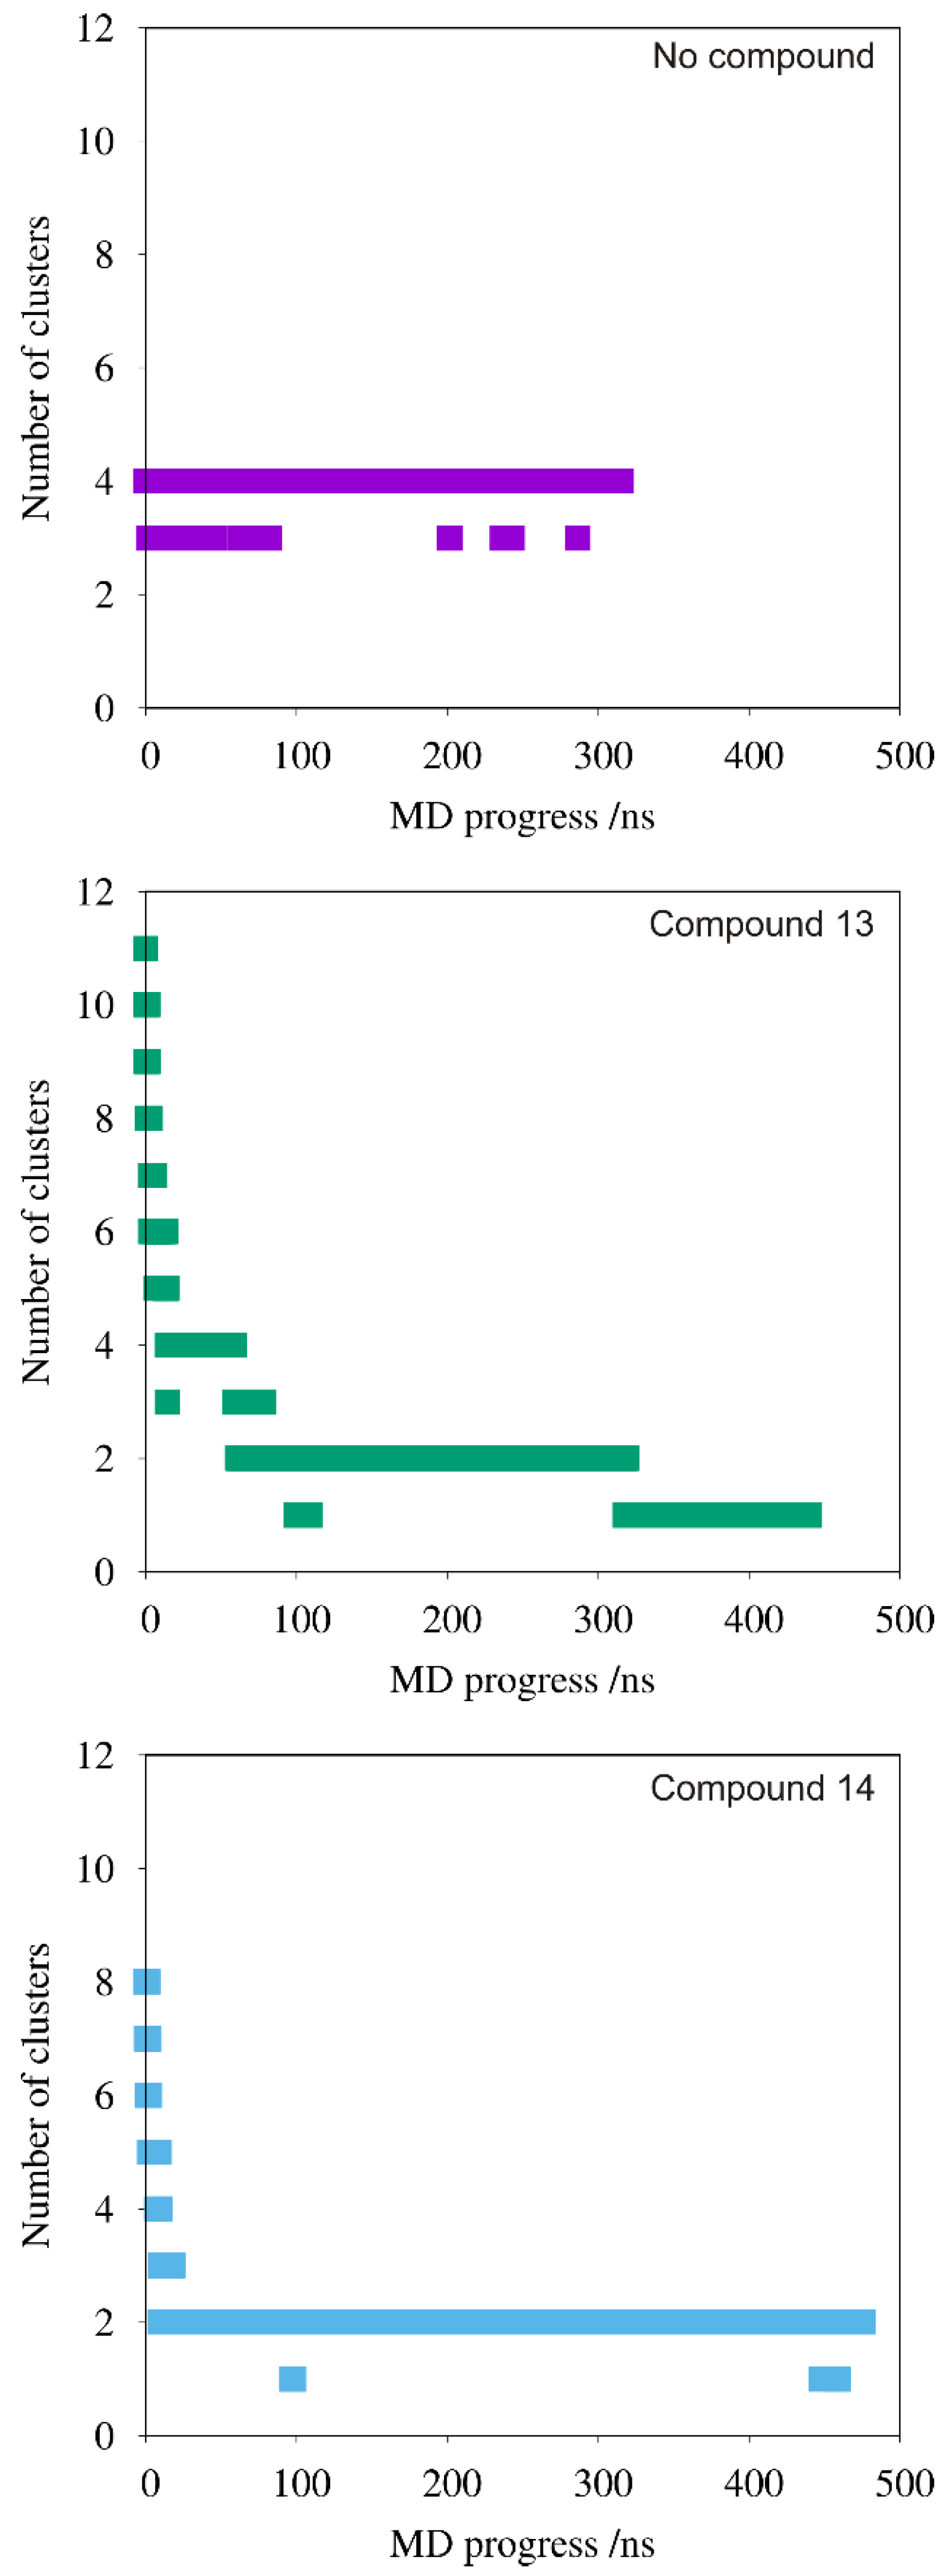
All-Atom Self-Assembly Simulations
3.2.10. Surface Plasmon Resonance Analysis
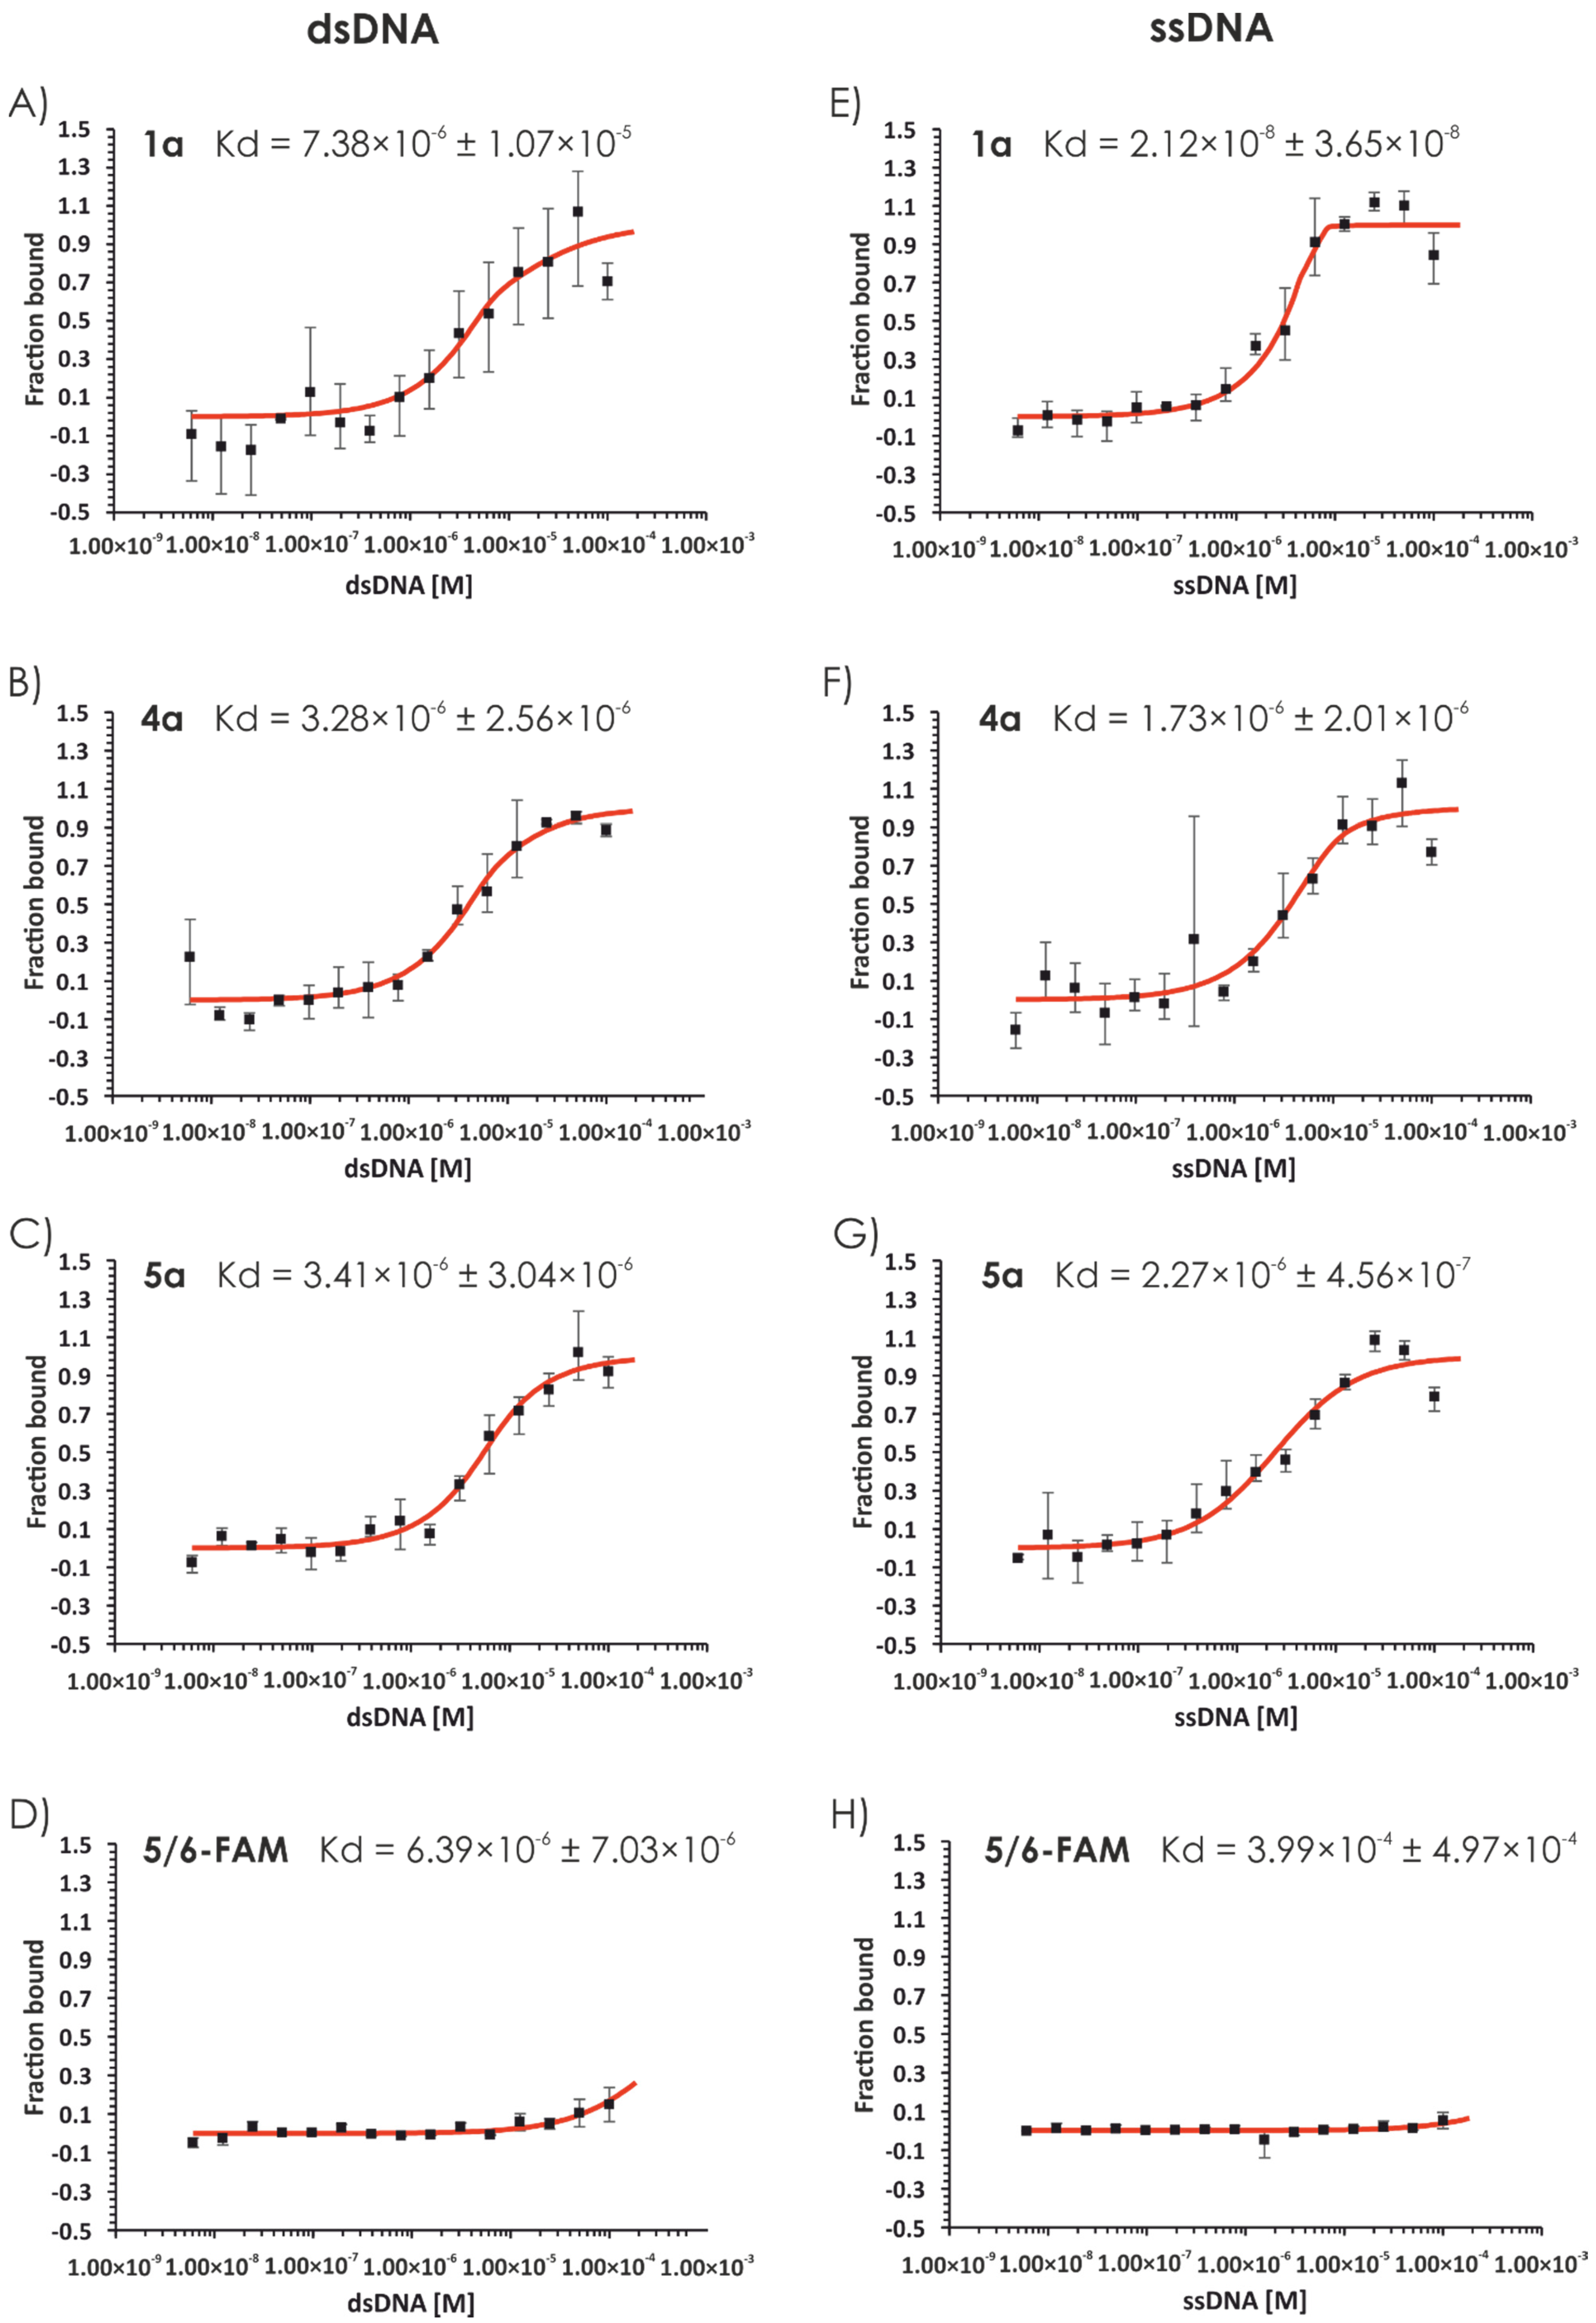
3.2.11. Microscale Thermophoresis
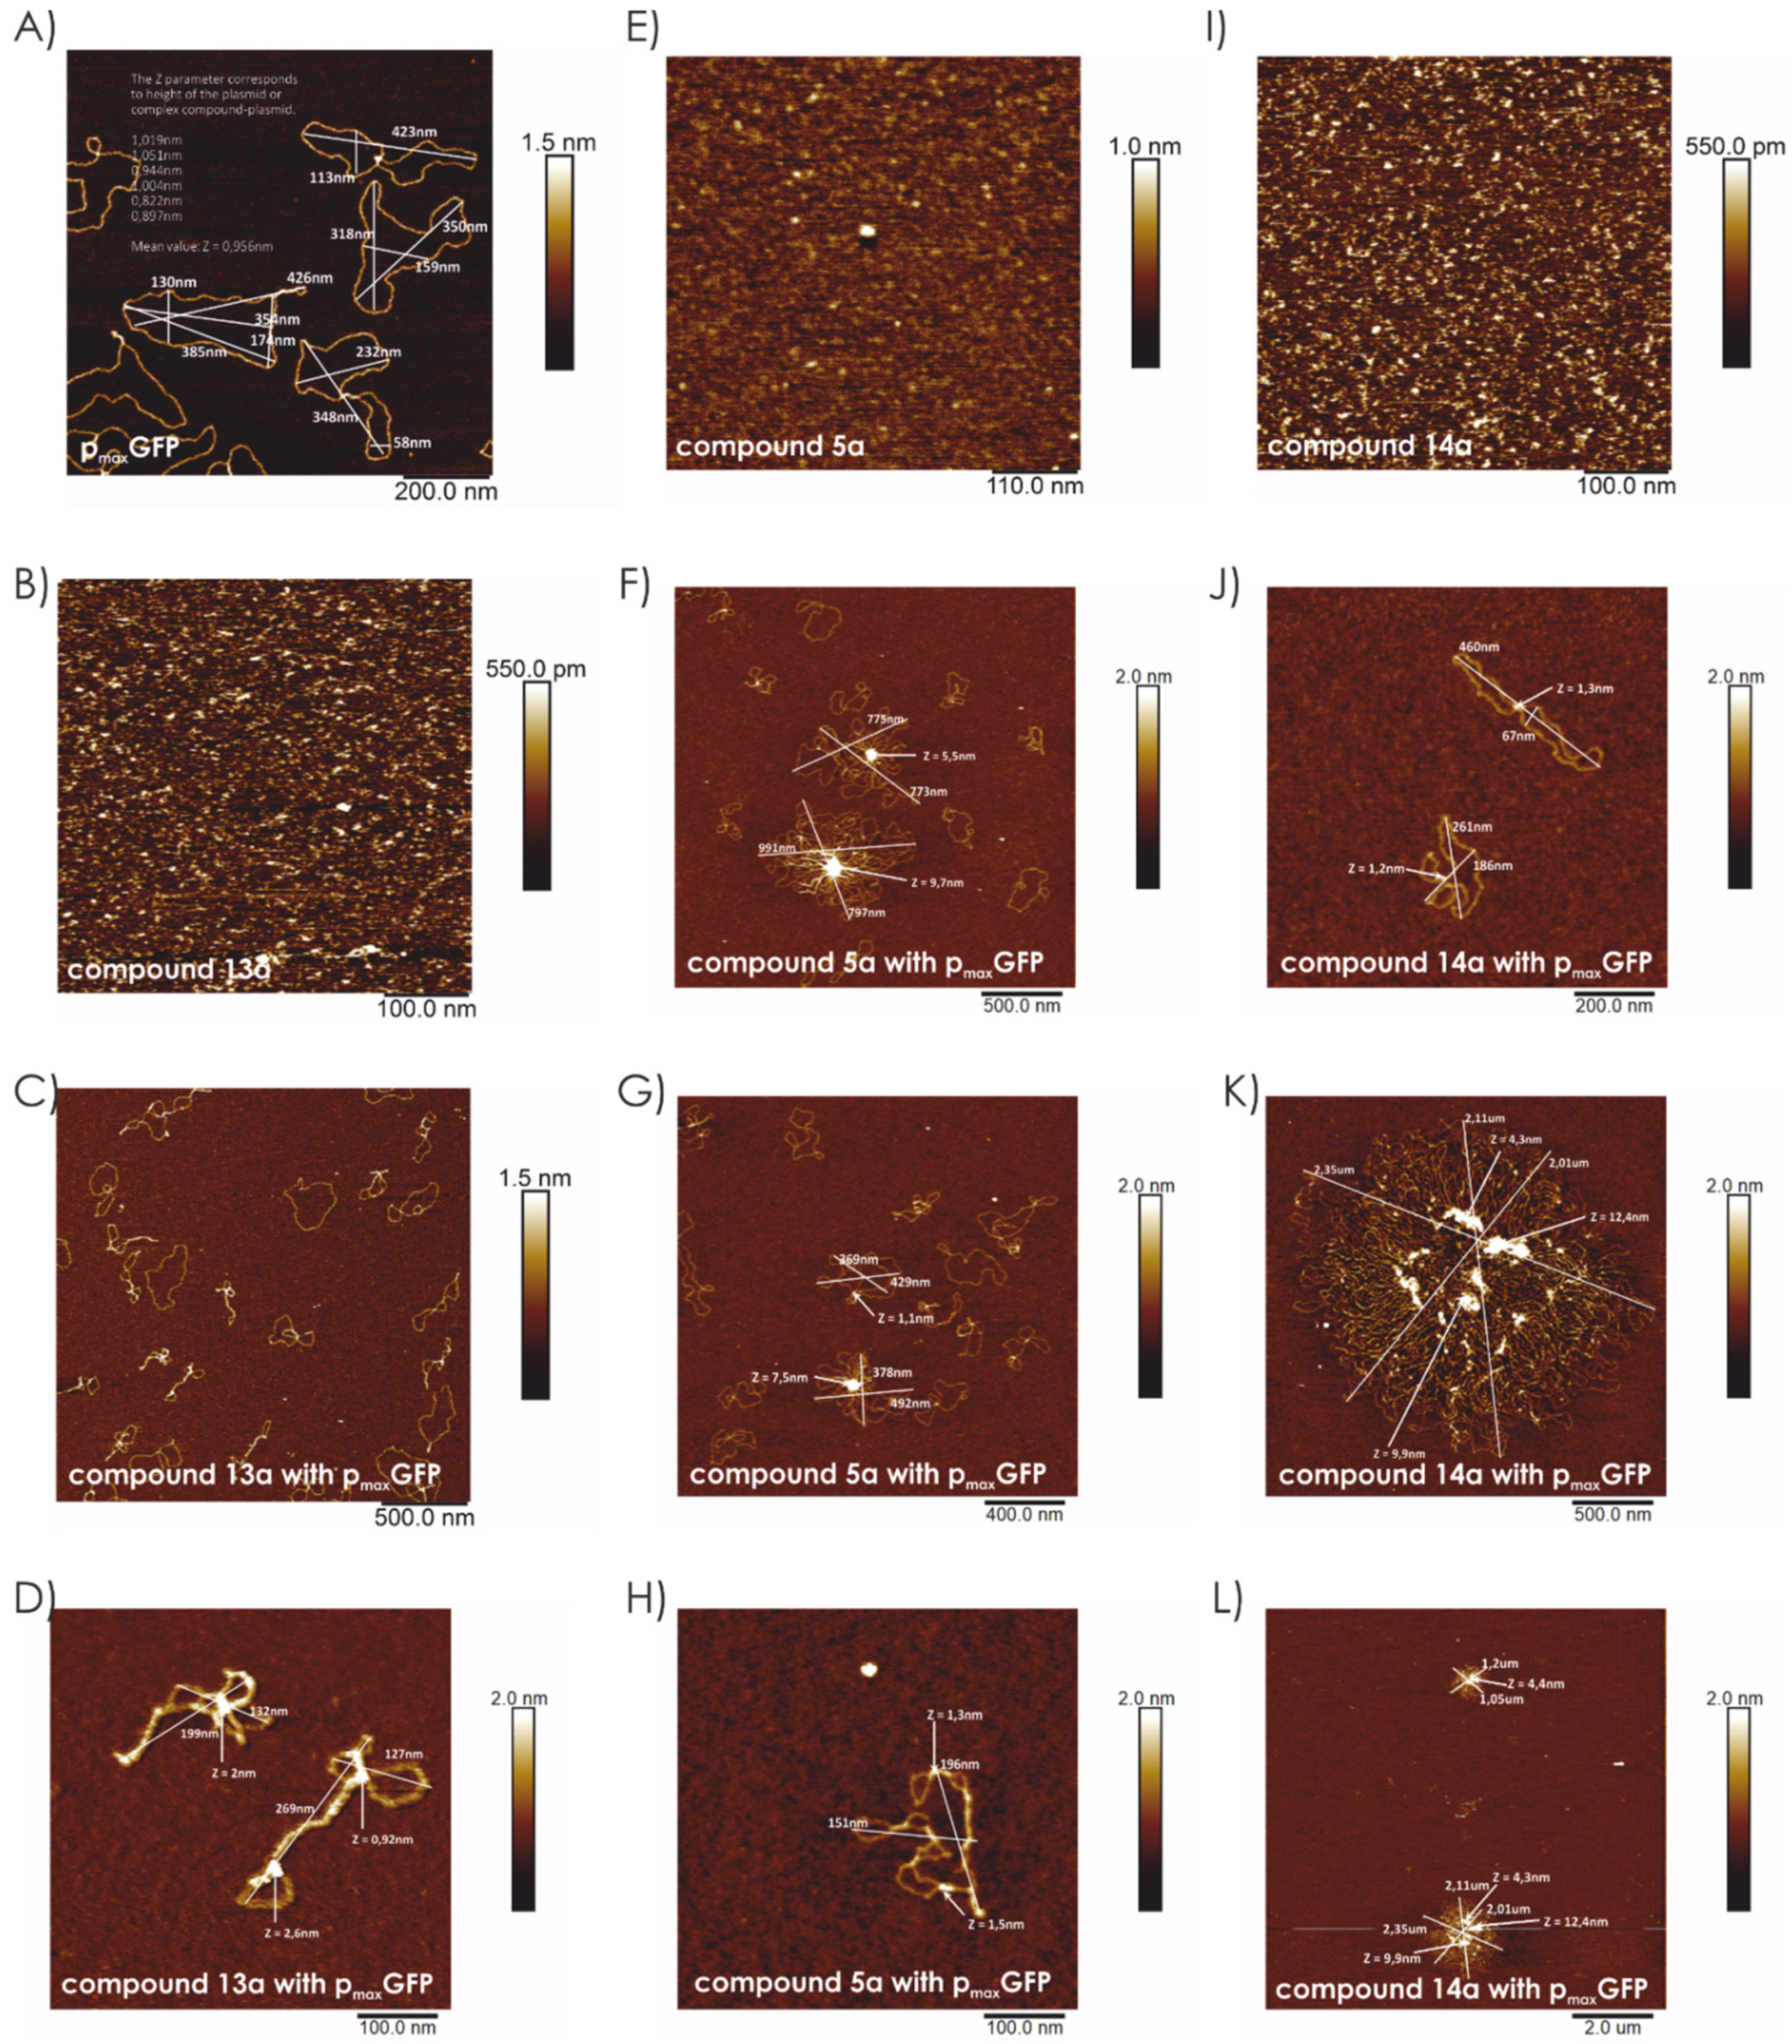
3.2.12. Atomic Force Microscopy
Supplementary Materials
Author Contributions
Funding
Institutional Review Board Statement
Informed Consent Statement
Data Availability Statement
Acknowledgments
Conflicts of Interest
References
- Li, Q.; Hao, X.; Wang, H.; Guo, J.; Ren, X.K.; Xia, S.; Zhang, W.; Feng, Y. Multifunctional REDV-G-TAT-G-NLS-Cys peptide sequence conjugated gene carriers to enhance gene transfection efficien-cy in endothelial cells. Colloids Surf. B Biointerfaces 2019, 184, 110510. [Google Scholar] [CrossRef]
- Li, L.; Wei, Y.; Gong, C. Polymeric Nanocarriers for Non-Viral Gene Delivery. J. Biomed. Nanotechnol. 2015, 11, 739–770. [Google Scholar] [CrossRef]
- Sun, Y.; Yang, Z.; Wang, C.; Yang, T.; Cai, C.; Zhao, X.; Yang, L.; Ding, P. Exploring the role of peptides in polymer-based gene delivery. Acta Biomater. 2017, 60, 23–37. [Google Scholar] [CrossRef] [PubMed]
- Ghaffari, M.; Dehghan, G.; Abedi-Gaballu, F.; Kashanian, S.; Baradaran, B.; Dolatabadi, J.E.N.; Losic, D. Surface functionalized dendrimers as controlled-release delivery nanosystems for tumor targeting. Eur. J. Pharm. Sci. 2018, 122, 311–330. [Google Scholar] [CrossRef]
- Budker, V.; Trubetskoy, V.; Wolff, J.A. Condensation of nonstochiometric DNA/polycation complexes by divalent cations. Biopolymers 2006, 83, 646–657. [Google Scholar] [CrossRef]
- Thomas, T. Collapse of DNA in packaging and cellular transport. Int. J. Biol. Macromol. 2018, 109, 36–48. [Google Scholar] [CrossRef]
- Oba, M. Cell-penetrating peptide foldamers: Drug-delivery tools. ChemBioChem 2019, 20, 2041–2045. [Google Scholar] [CrossRef] [Green Version]
- He, Y.; Li, F.; Huang, Y. Smart cell-penetrating peptide-based techniques for intracellular delivery of thera-peutic macromolecules. Adv. Protein Chem. Struct. Biol. 2018, 112, 183–220. [Google Scholar] [PubMed]
- Lindberg, S.; Copolovici, D.M.; Langel, U. Therapeutic delivery opportunities, obstacles and applications for cell-penetrating peptides. Ther. Deliv. 2011, 2, 71–82. [Google Scholar] [CrossRef] [PubMed]
- Ye, J.; Liu, E.; Yu, Z.; Pei, X.; Chen, S.; Zhang, P.; Shin, M.C.; Gong, J.; He, H.; Yang, V.C. CPP-assisted intra-cellular drug delivery, what is next? Int. J. Mol. Sci. 2016, 17, 1892. [Google Scholar] [CrossRef] [PubMed] [Green Version]
- Kargaard, A.; Sluijter, J.P.; Klumperman, B. Polymeric siRNA gene delivery—Transfection efficiency versus cytotoxicity. J. Control. Release 2019, 316, 263–291. [Google Scholar] [CrossRef]
- Soltani, F.; Parhiz, H.; Mokhtarzadeh, A.; Ramezani, M. Synthetic and biological vesicular nano-carriers designed for gene delivery. Curr. Pharm. Des. 2015, 21, 6214–6235. [Google Scholar] [CrossRef]
- Rehman, Z.U.; Zuhorn, I.S.; Hoekstra, D. How cationic lipids transfer nucleic acids into cells and across cellular membranes: Recent advances. J. Control. Release 2013, 166, 46–56. [Google Scholar] [CrossRef] [PubMed]
- Wysocka, M.; Gruba, N.; Grzywa, R.; Giełdoń, A.; Bąchor, R.; Brzozowski, K.; Sieńczyk, M.; Dieter, J.; Szewczuk, Z.; Rolka, K.; et al. PEGylated substrates of NSP4 protease: A tool to study protease specificity. Sci. Rep. 2016, 6, 22856. [Google Scholar] [CrossRef] [Green Version]
- Wysocka, M.; Romanowska, A.; Gruba, N.; Michalska, M.; Giełdoń, A.; Lesner, A. A peptidomimetic fluo-rescent probe to detect the trypsin β2 subunit of the human 20S proteasome. Int. J. Mol. Sci. 2020, 21, 2396. [Google Scholar] [CrossRef] [Green Version]
- He, C.; Hu, Y.; Yin, L.; Tang, C.; Yin, C. Effects of particle size and surface charge on cellular uptake and biodistribution of polymeric nanoparticles. Biomaterials 2010, 31, 3657–3666. [Google Scholar] [CrossRef]
- Iversen, T.-G.; Skotland, T.; Sandvig, K. Endocytosis and intracellular transport of nanoparticles: Present knowledge and need for future studies. Nano Today 2011, 6, 176–185. [Google Scholar] [CrossRef]
- Jiang, Z.; He, H.; Liu, H.; Thayumanavan, S. Cellular Uptake Evaluation of Amphiphilic Polymer Assemblies: Importance of Interplay between Pharmacological and Genetic Approaches. Biomacromolecules 2019, 20, 4407–4418. [Google Scholar] [CrossRef] [PubMed]
- Gao, T.; Zhang, W.; Wang, Y.; Guangcan, Y. DNA compaction and charge neutralization regulated by divalent ions in very low pH solution. Polymers 2019, 11, 337. [Google Scholar] [CrossRef] [PubMed] [Green Version]
- Iacomino, G.; Picariello, G.; D’Agostino, L. DNA and nuclear aggregates of polyamines. BBA Mol. Cell Res. 2012, 1823, 1745–1755. [Google Scholar] [CrossRef] [Green Version]
- Kaufman, B.A.; Durisic, N.; Mativetsky, J.M.; Costantino, S.; Hancock, M.A.; Grutter, P.; Shoubridge, E.A. The mitochondrial transcription factor TFAM coordinates the assembly of multiple DNA molecules into nu-cleoid-like structures. Mol. Biol. Cell 2007, 18, 3225–3236. [Google Scholar] [CrossRef]
- Zabolotnaya, E.; Mela, I.; Williamson, M.J.; Bray, S.M.; Yau, S.K.; Papatziamou, D.; Edwardson, J.M.; Robinson, N.P.; Henderson, R.M. Modes of action of the archaeal Mre11/Rad50 DNA-repair complex re-vealed by fast-scan atomic force microscopy. Proc. Natl. Acad. Sci. USA 2020, 117, 14936–14947. [Google Scholar] [CrossRef] [PubMed]
- Speir, J.A.; Johnson, J.E. Nucleic acid packaging in viruses. Curr. Opin. Struct. Biol. 2012, 22, 65–71. [Google Scholar] [CrossRef] [Green Version]
- Pires, R.H.; Felix, S.B.; Delcea, M. The architecture of neutrophil extracellular traps investigated by atomic force microscopy. Nanoscale 2016, 8, 14193–14202. [Google Scholar] [CrossRef] [PubMed]
- Qian, Z.; Macvanin, M.; Dimitriadis, E.K.; He, X.; Zhurkin, V.; Adhya, S. A new noncoding RNA arranges bacterial chromosome organization. mBio 2015, 6, e00998-15. [Google Scholar] [CrossRef] [Green Version]
- Aletras, A.; Barlos, K.; Gatos, D.; Koutsogianni, S.; Mamos, P. Preparation of the very acid-sensitive Fmoc-Lys(Mtt)-OH Application in the synthesis of side-chain to side-chain cyclic peptides and oligolysine cores suitable for the solid-phase assembly of MAPs and TASPs. Int. J. Pept. Protein Res. 2009, 45, 488–496. [Google Scholar] [CrossRef]
- Case, D.A.; Betz, R.M.; Cerutti, D.S.; Cheatham, T.E.; Darden, T.A.; Duke, R.E.; Giese, T.J.; Gohlke, H.; Goetz, A.W.; Homeyer, N.; et al. AMBER 2016 Reference Manual; University of California: San Francisco, CA, USA, 2016; pp. 1–923. [Google Scholar]
- Schmidt, M.W.; Baldridge, K.K.; Boatz, J.A.; Elbert, S.T.; Gordon, M.S.; Jensen, J.H.; Koseki, S.; Matsunaga, N.; Nguyen, K.A.; Su, S.; et al. General atomic and molecular electronic structure system. J. Comput. Chem. 1993, 14, 1347–1363. [Google Scholar] [CrossRef]
- Bayly, C.I.; Cieplak, P.; Cornell, W.; Kollman, P.A. A well-behaved electrostatic potential based method using charge restraints for deriving atomic charges: The RESP model. J. Phys. Chem. 1993, 97, 10269–10280. [Google Scholar] [CrossRef]
- Van der Spoel, D.; Lindahl, E.; Hess, B.; Groenhof, G.; Mark, A.E.; Berendsen, H.J.C. GROMACS: Fast, flexible and free. J. Comput. Chem. 2005, 26, 1701–1718. [Google Scholar] [CrossRef] [PubMed]
- Pettersen, E.F.; Goddard, T.D.; Huang, C.C.; Couch, G.S.; Greenblatt, D.M.; Meng, E.C.; Ferrin, T.E. UCSF Chimera-a visualization system for exploratory research and analysis. J. Comput. Chem. 2004, 25, 1605–1612. [Google Scholar] [CrossRef] [Green Version]

| No | Sequence | Retention Time * [min] | Molecular Weight Calculated/Determined ** | Cell Permeablility (Target) *** | Binding Constants Double [µM] # | Cytotoxicity ## |
|---|---|---|---|---|---|---|
| Single-Stranded DNA [µM] # | ||||||
| 1 | O2Oc(Arg)6-O2Oc-NH2 | 2.11 | 1244.5/1245.4 | ND | Moderate | 10% |
| 1a | 5′,6-FAM-O2Oc-(Arg)6-O2Oc-NH2 | 9.12/9.26 | 1603.8/1604.4 | ++ (cytoplasm) | 7.4 ± 0.1 | 10% |
| 0.02 ± 0.04 & | ||||||
| 2 | O2Oc(D-arg)6-O2Oc-NH2 | 2.12 | 1244.5/1245.5 | ND | Moderate | 15% |
| 2a | 5′,6-FAM -O2Oc-(D-arg)6-O2Oc-NH2 | 8.46/8.71 | 1603.8/1604.8 | ++ (cytoplasm) | – | 15% |
| 3 | O2Oc-(Har)6-O2Oc-NH2 | 2.45 | 1329.6/1330.4 | ND | Weak | 10% |
| 3a | 5′,6-FAM -O2Oc-(Har)6-O2Oc-NH2 | 8.55/8.83 | 1687.9/1689.0 | ++ (cytoplasm) | – | 10% |
| 4 | O2Oc-[Dap(GO1)]6-O2Oc-NH2 | 3.15 | 1682.8/1683.6 | ND | 8.8 ± 2.1/ | – |
| 1.8 ± 1.1 && | ||||||
| 4a | 5′,6-FAM -O2Oc-[Dap(GO1)]6-O2Oc-NH2 | 7.89/8.13 | 2042.1/2043.0 | ++ (nucleus) | 3.3 ± 2.6/ | – |
| 1.7 ± 2.0 & | ||||||
| 4b | 5′,6-TAMRA-O2Oc-[Dap(GO1)]6-O2Oc-NH2 | 8.17/8.59 | 2096.2/2097.0 | ++ (nucleus) | ND | – |
| 5 | O2Oc-Dap(GO2)6-O2Oc-NH2 | 3.40 | 1947.1/1947.9 | ND | 1.8 ± 0.9/ | – |
| 2.8 ± 1.2 && | ||||||
| 5a | 5′,6-FAM-O2Oc-[Dap(GO2)]6-O2Oc-NH2 | 9.10/9.83 | 2306.4/2307.6 | +++ (nucleus) | 3.4 ± 3.0/ | – |
| 2.3 ± 4.6 & | ||||||
| 5b | 5′,6-TAMRA-O2Oc-[Dap(GO2)]6-O2Oc-NH2 | 9.82/10.15 | 2360.6/2361.4 | +++ (nucleus) | ND | – |
| 6 | O2Oc-[Dap(O2(GO1))]6-O2Oc-NH2 | 3.55 | 2554.7/2555.3 | ND | ND | – |
| 6a | 5′,6-FAM-O2Oc-[Dap(O2(GO1))]6-O2Oc-NH2 | 12.99/13.43 | 2913.0/2913.8 | – | ND | – |
| 7 | O2Oc-[Dap(O2(GO2))]6-O2Oc-NH2 | 4.09 | 2819.1/2819.9 | ND | ND | – |
| 7a | 5′,6-FAM-O2Oc-[Dap(O2(GO2))]6-O2Oc-NH2 | 14.35/15.03 | 3177.3/3178.3 | – | ND | – |
| 8 | O2Oc-[Dap(O2)]6-O2Oc-NH2 | 3.45 | 1694.9/1696.0 | ND | Weak | – |
| 8a | 5′,6-FAM-O2Oc-[Dap(O2)]6-O2Oc-NH2 | 9.12/9.38 | 2053.2/2054.1 | – | ND | – |
| 9 | O2Oc-[Dap(HO2)]6-O2Oc-NH2 | 3.71 | 1700.8/1701.5 | ND | Weak | – |
| 9a | 5′,6-FAM-O2Oc-[Dap(HO2)]6-O2Oc-NH2 | 9.45/9.78 | 2059.1/2060.4 | – | ND | – |
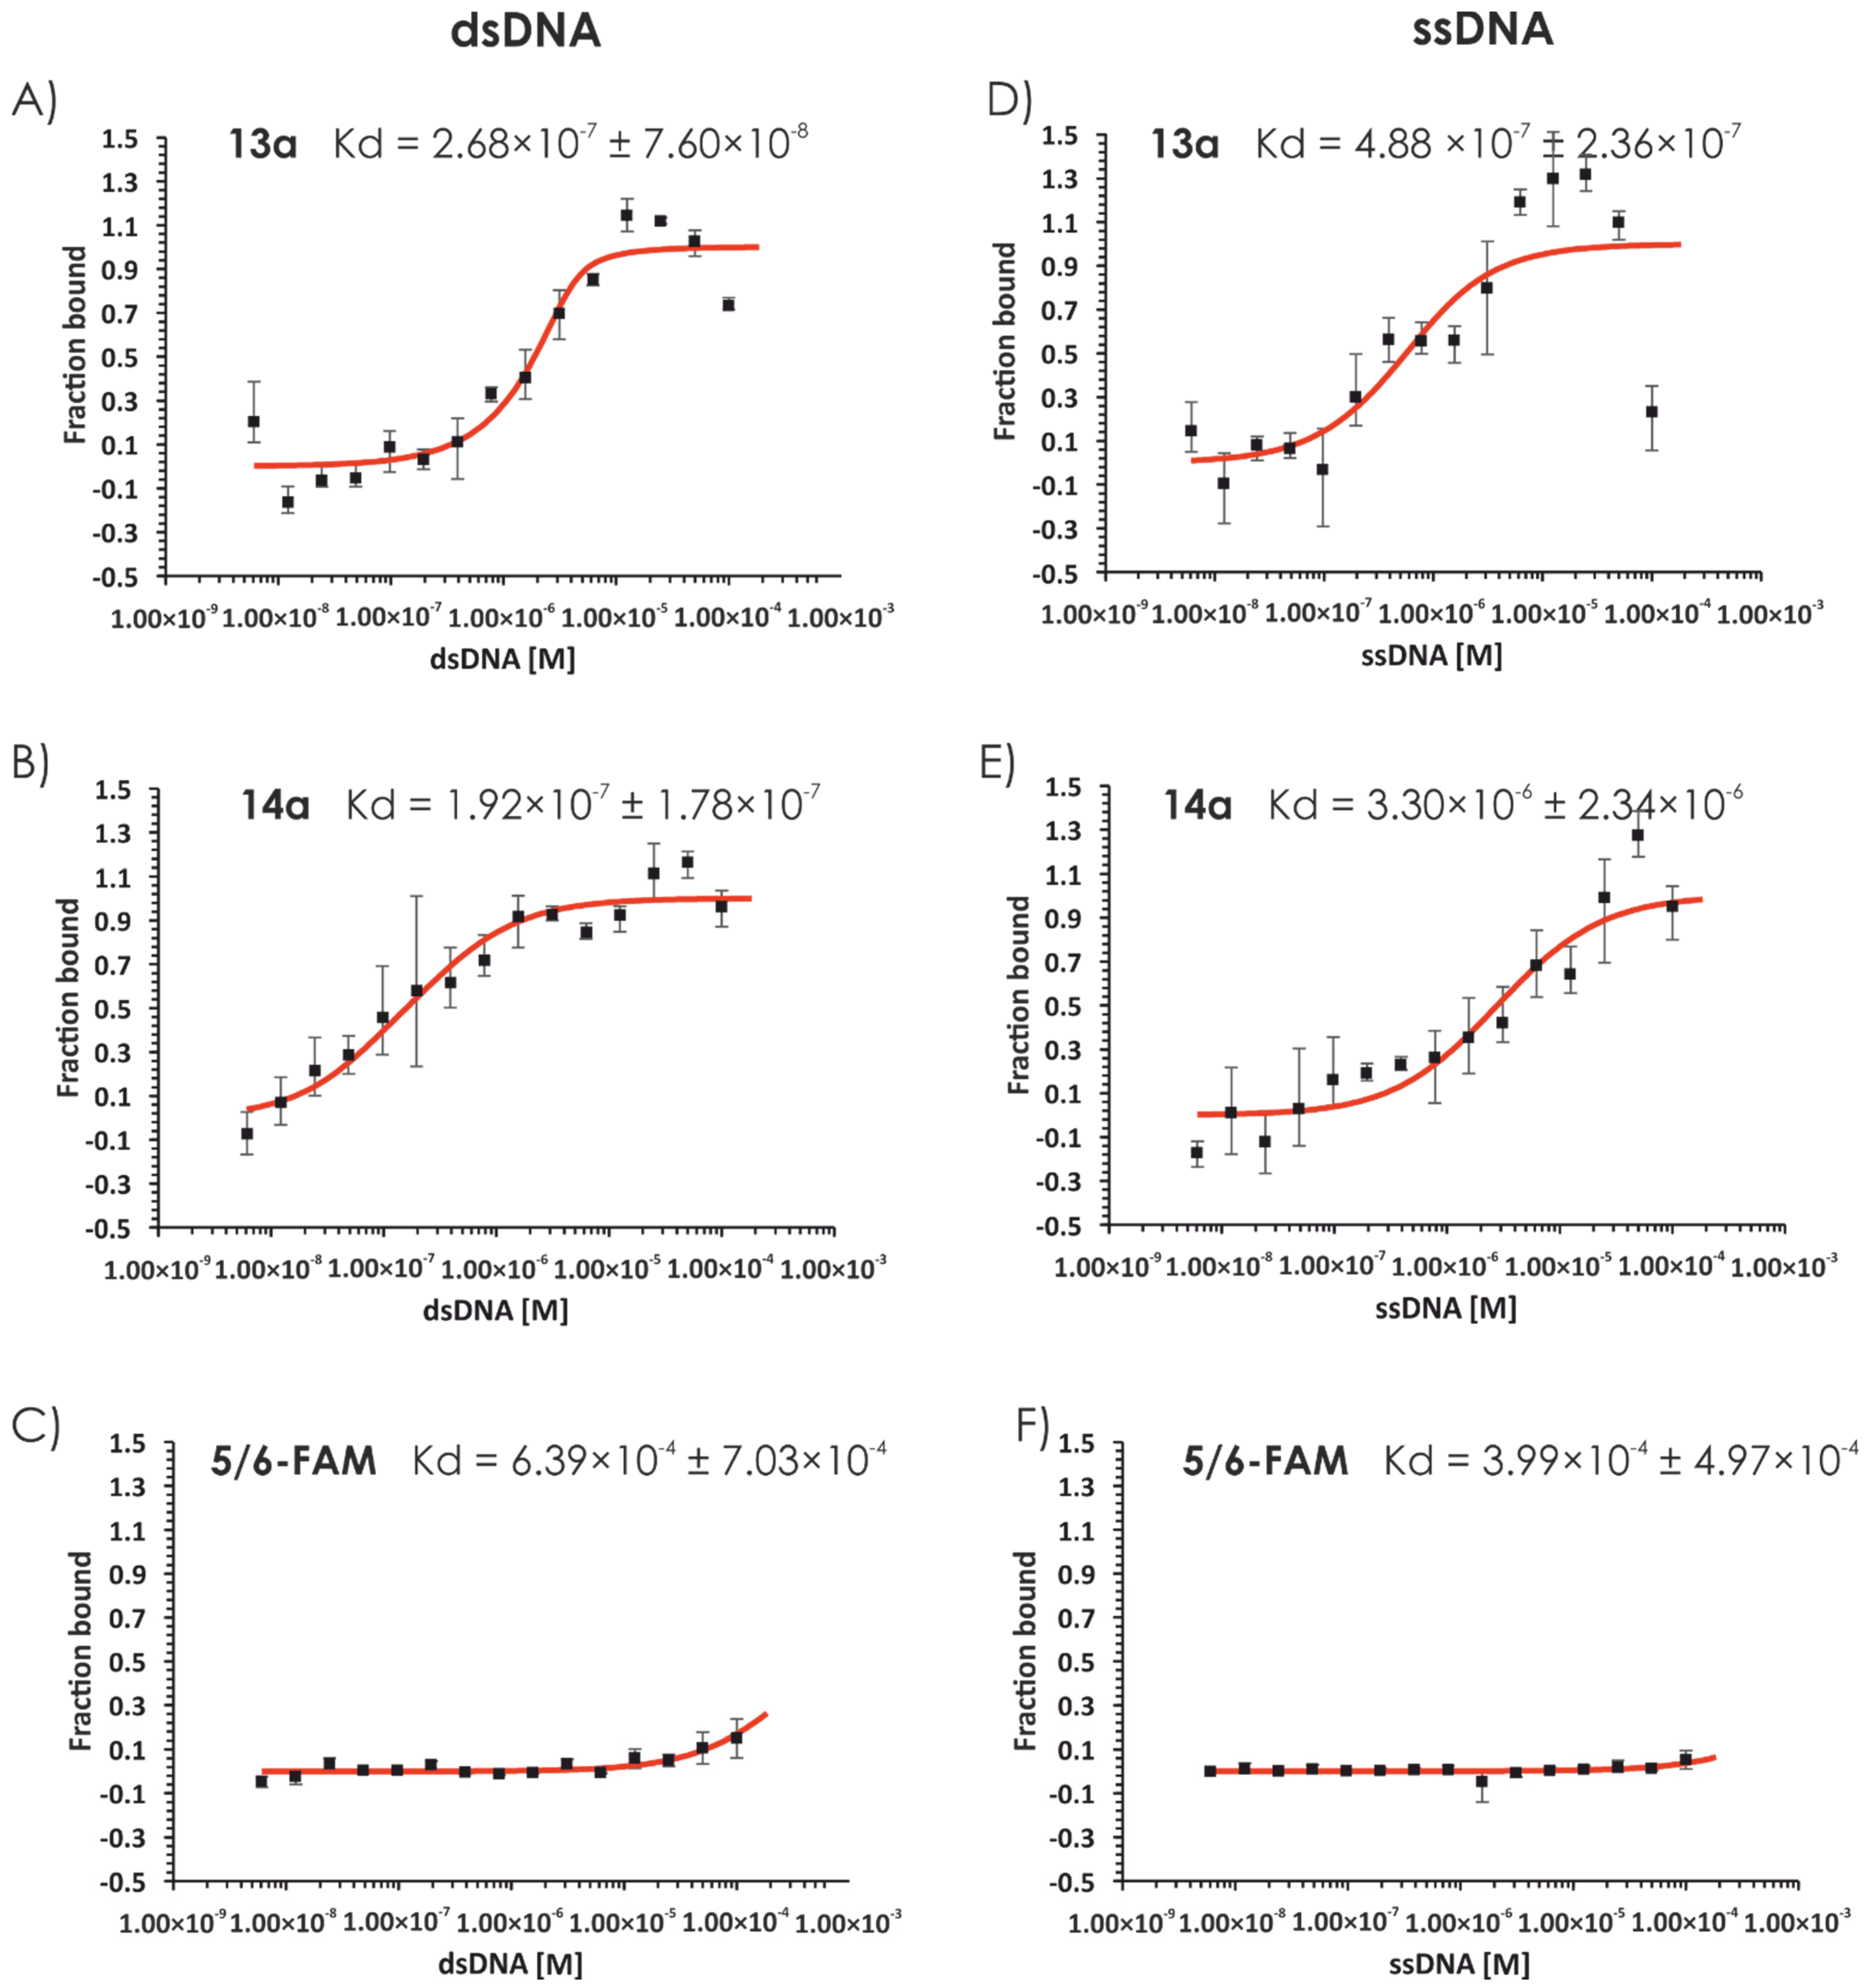
| 10 | 5′,6-FAM | 11.21 | 376.3 | – | 639 ± 703/ | – |
| 399 ± 497 & | ||||||
| 11 | 5′,6-TAMRA | 12.17 | 431.5 | – | ND | – |
| No | Sequence | Retention Time * [min] | Molecular Weight Calculated/Determined ** | Cell Permeablility (Target) *** | Binding Constant Double DNA [µM] # | Cytotoxicity ## |
|---|---|---|---|---|---|---|
| Single-Stranded DNA [µM] # | ||||||
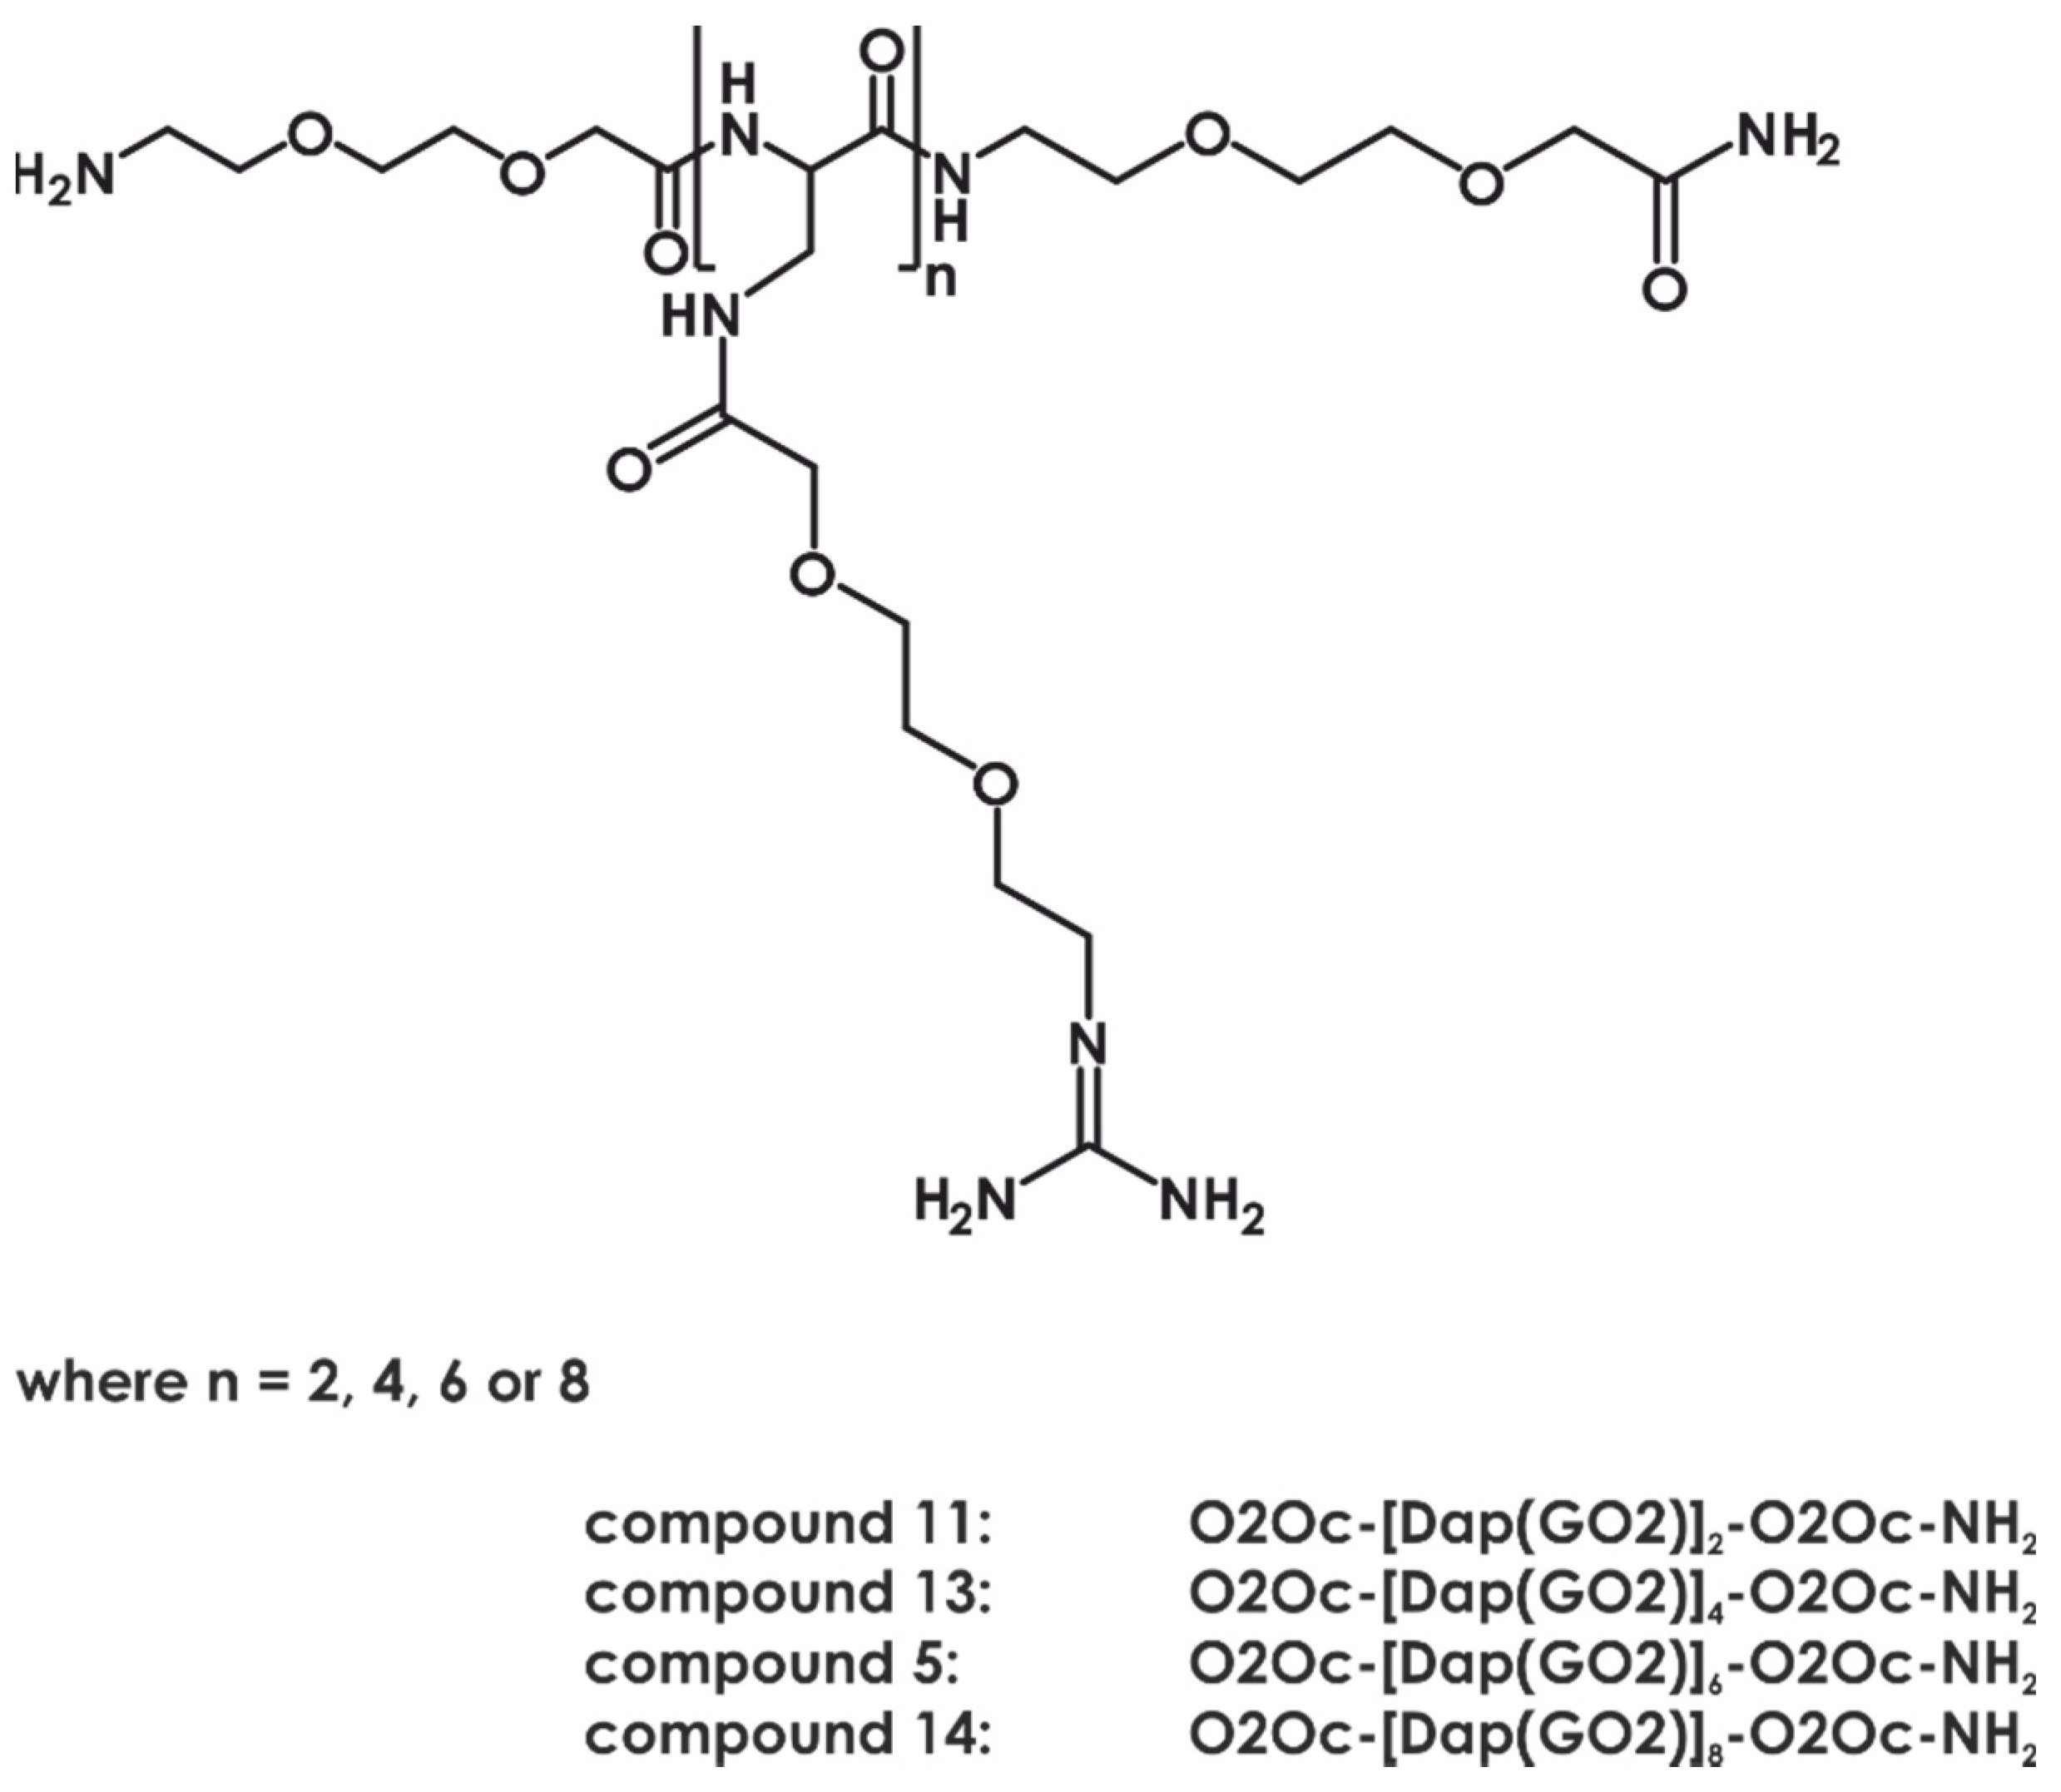
| 12 | O2Oc-[Dap(GO2)]2-O2Oc-NH2 | 1.94 | 853.9/854.6 | ND | weak | – |
| 12a | 5′,6-FAM-O2Oc-[Dap(GO2)]2-O2Oc-NH2 | 10.11/10.43 | 1213.2/1213.5 | – | – | – |
| 13 | O2Oc-[Dap(GO2)]4-O2Oc-NH2 | 2.09 | 1400.5/1401.2 | ND | – | – |
| 13a | 5′,6-FAM-O2Oc-[Dap(GO2)]4-O2Oc-NH2 | 9.78/10.01 | 1759.8/1759.8 | ++ (cytoplasm) | 0.3 ± 0.1/ | – |
| 0.5 ± 0.2 & | ||||||
| 5 | O2Oc-[Dap(GO2)]6-O2Oc-NH2 | 3.40 | 1948.1/1947.1 | ND | 1.8 ± 0.9/ | – |
| 2.8 ± 1.2 && | ||||||
| 5a | 5′,6-FAM-O2Oc-[Dap(GO2)]6-O2Oc-NH2 | 9.10/9.83 | 2306.4/2307.6 | +++ (nucleus) | 3.4 ± 3.0/ | – |
| 2.3 ± 4.6 & | ||||||
| 5b | 5,6-TAMRA-O2Oc-[Dap(GO2)]6-O2Oc-NH2 | 9.82/10.15 | 2360.6/2361.4 | +++ (nucleus) | ND | – |
| 14 | O2Oc-[Dap(GO2)]8-O2Oc-NH2 | 2.97 | 2493.7/2493.5 | ND | ND | 10% |
| 14a | 5′,6-FAM-O2Oc-[Dap(GO2)]8-O2Oc-NH2 | 8.2/8.8 | 2852.0/2853.7 | +++ (nucleus) | 0.2 ± 0.1/ | 15% |
| 3.3 ± 2.34 & | ||||||
| 14b | 5′,6-TAMRA-O2Oc-[Dap(GO2)]8-O2Oc-NH2 | 8.2/8.5 | 2907.1/2908.5 | +++ (nucleus) | ND | 15% |
Publisher’s Note: MDPI stays neutral with regard to jurisdictional claims in published maps and institutional affiliations. |
© 2021 by the authors. Licensee MDPI, Basel, Switzerland. This article is an open access article distributed under the terms and conditions of the Creative Commons Attribution (CC BY) license (http://creativecommons.org/licenses/by/4.0/).
Share and Cite
Romanowska, A.; Węgrzyn, K.; Bury, K.; Sikorska, E.; Gnatek, A.; Piwkowska, A.; Konieczny, I.; Lesner, A.; Wysocka, M. Novel Cell Permeable Polymers of N-Substituted L-2,3-Diaminopropionic Acid (DAPEGs) and Cellular Consequences of Their Interactions with Nucleic Acids. Int. J. Mol. Sci. 2021, 22, 2571. https://doi.org/10.3390/ijms22052571
Romanowska A, Węgrzyn K, Bury K, Sikorska E, Gnatek A, Piwkowska A, Konieczny I, Lesner A, Wysocka M. Novel Cell Permeable Polymers of N-Substituted L-2,3-Diaminopropionic Acid (DAPEGs) and Cellular Consequences of Their Interactions with Nucleic Acids. International Journal of Molecular Sciences. 2021; 22(5):2571. https://doi.org/10.3390/ijms22052571
Chicago/Turabian StyleRomanowska, Anita, Katarzyna Węgrzyn, Katarzyna Bury, Emilia Sikorska, Aleksandra Gnatek, Agnieszka Piwkowska, Igor Konieczny, Adam Lesner, and Magdalena Wysocka. 2021. "Novel Cell Permeable Polymers of N-Substituted L-2,3-Diaminopropionic Acid (DAPEGs) and Cellular Consequences of Their Interactions with Nucleic Acids" International Journal of Molecular Sciences 22, no. 5: 2571. https://doi.org/10.3390/ijms22052571