Article

Hydrolysis of Extracellular ATP by Vascular Smooth Muscle Cells Transdifferentiated into Chondrocytes Generates Pi but Not PPi

1
Institute for Molecular and Supramolecular Chemistry and Biochemistry, Université Lyon 1, French National Centre for Scientific Research, F-69622 Lyon, France
2
State Key Laboratory of Supramolecular Structure and Materials, Institute of Theoretical Chemistry, Jilin University, Changchun 130012, China
*
Author to whom correspondence should be addressed.
Int. J. Mol. Sci. 2021, 22(6), 2948; https://doi.org/10.3390/ijms22062948
Submission received: 1 February 2021 / Revised: 11 March 2021 / Accepted: 11 March 2021 / Published: 14 March 2021

Abstract

:
(1) Background: Tissue non-specific alkaline phosphatase (TNAP) is suspected to induce atherosclerosis plaque calcification. TNAP, during physiological mineralization, hydrolyzes the mineralization inhibitor inorganic pyrophosphate (PPi). Since atherosclerosis plaques are characterized by the presence of necrotic cells that probably release supraphysiological concentrations of ATP, we explored whether this extracellular adenosine triphosphate (ATP) is hydrolyzed into the mineralization inhibitor PPi or the mineralization stimulator inorganic phosphate (Pi), and whether TNAP is involved. (2) Methods: Murine aortic smooth muscle cell line (MOVAS cells) were transdifferentiated into chondrocyte-like cells in calcifying medium, containing ascorbic acid and β-glycerophosphate. ATP hydrolysis rates were determined in extracellular medium extracted from MOVAS cultures during their transdifferentiation, using 31P-NMR and IR spectroscopy. (3) Results: ATP and PPi hydrolysis by MOVAS cells increased during transdifferentiation. ATP hydrolysis was sequential, yielding adenosine diphosphate (ADP), adenosine monophosphate (AMP), and adenosine without any detectable PPi. The addition of levamisole partially inhibited ATP hydrolysis, indicating that TNAP and other types of ectonucleoside triphoshatediphosphohydrolases contributed to ATP hydrolysis. (4) Conclusions: Our findings suggest that high ATP levels released by cells in proximity to vascular smooth muscle cells (VSMCs) in atherosclerosis plaques generate Pi and not PPi, which may exacerbate plaque calcification.

Graphical Abstract

1. Introduction

Atherosclerosis calcification is a predictor of cardiovascular mortality [1]. Vulnerable plaques are characterized by a thin fibrous cap, macrophage infiltration, a large necrotic core, intraplaque hemorrhage, and calcification [2,3,4,5,6]. During atherosclerosis plaque calcification in mice, vascular smooth muscle cells (VSMCs) transdifferentiate into chondrocyte-like cells, which then induce calcification in the vascular walls [7,8,9]. Like osteoblasts and growth plate chondrocytes, these cells express bone/cartilage-specific Runt-related transcription factor 2 (RUNX2), triggering the expression of bone/cartilage-specific proteins, such as osteocalcin (encoded by Bglap) [10,11]. Moreover, these cells have increased tissue non-specific alkaline phosphatase (TNAP) activity and produce extracellular vesicles which accumulate calcium-phosphate crystals [11,12,13]. TNAP (E.C. 3.1.3.1) is a phosphomonoesterase with a broad range of substrates in vitro including nucleotides and pyrophosphate (Figure 1).
TNAP is the key enzyme during calcification since it hydrolyzes extracellular pyrophosphate (PPi), a strong inhibitor of apatite formation [14]. Extracellular PPi originates from: (i) intracellular PPi transported into the extracellular medium by progressive ankylosis protein homolog (ANKH) [15]; and (ii) from the hydrolysis of extracellular ATP by ectonucleotide pyrophosphatase phosphodiesterase (ENPP1) to produce PPi and AMP (Figure 1) [16]. Under physiological conditions, normal levels of extracellular PPi and other calcification inhibitors, including osteopontin, matrix-Gla proteins, and Fetuin A, are sufficient to prevent vascular calcification by inhibiting the formation of apatite. However, under pathological conditions, where the PPi concentration can decrease, for example in the case of systemic ENPP1 deficiency (Generalized Arterial Calcification of Infancy), it is sufficient to induce vascular calcification [17]. Therefore, the Pi/PPi ratio regulates apatite formation [18,19]. Besides PPi, ATP and ADP can also inhibit apatite formation [20]. As a result of its ability to hydrolyze PPi, TNAP is a putative drug target to treat vascular calcification [21]. Under physiological conditions, the concentration of extracellular ATP is found to be in the 10–1000 nM range [22,23]. Upon atherosclerosis around a threefold (plus) increase in extracellular ATP is released from the cells [24]. Necrotic cells release high quantities of ATP that act as danger-signal recruiting leukocytes [25]. ATP is actively released from activated or stressed cells [26,27] and passively from necrotic cells [28] via ruptured cell membranes. Once released, ATP can bind to P2 purinergic receptors, triggering intracellular signaling [29]. Extracellular ATP is then rapidly hydrolyzed by TNAP [30], ENPP1 [16], and ectonucleoside triphoshatediphosphohydrolases, including CD39 (Figure 1) [31]. TNAP [30] and CD39 [31] dephosphorylate ADP to form AMP. AMP is further hydrolyzed by TNAP [13] and 5′-ectonucleotidase (CD73) [31]. VSMCs express several ecto-nucleotidases, including ENPP1, and can release ATP in a controlled manner [32,33,34]. Since high levels of ATP may lead to the generation of both Pi and PPi, we questioned whether this extracellular ATP is hydrolyzed into the mineralization inhibitor PPi or the mineralization stimulator Pi, and whether TNAP is involved. At present, very little is known about the hydrolysis of ATP by VSMCs, especially during transdifferentiation of VSMCs toward osteo-chondrocyte-like cells. Our aim was to measure the rates of ATP hydrolysis, to determine whether the ATP hydrolysis is sequential, and whether it can yield PPi and to what extent. Furthermore, we estimated the number of ATP molecules hydrolyzed per cell and per minute to substantiate the time frame of the cellular response to extracellular ATP fluctuations. For this purpose, we selected murine MOVAS line cells as a cellular model of VSMC. An increase in the mRNA expression profile of key genes associated with vascular calcification, such as Akp2 (gene coding for TNAP), was observed in MOVAS-1 cells cultured under calcifying conditions, with similar changes in expression in murine aortic VSMCs [35]. MOVAS proliferate rapidly, have a long lifespan, and are reliable and convenient in vitro models of vascular calcification [35,36,37].

2. Results

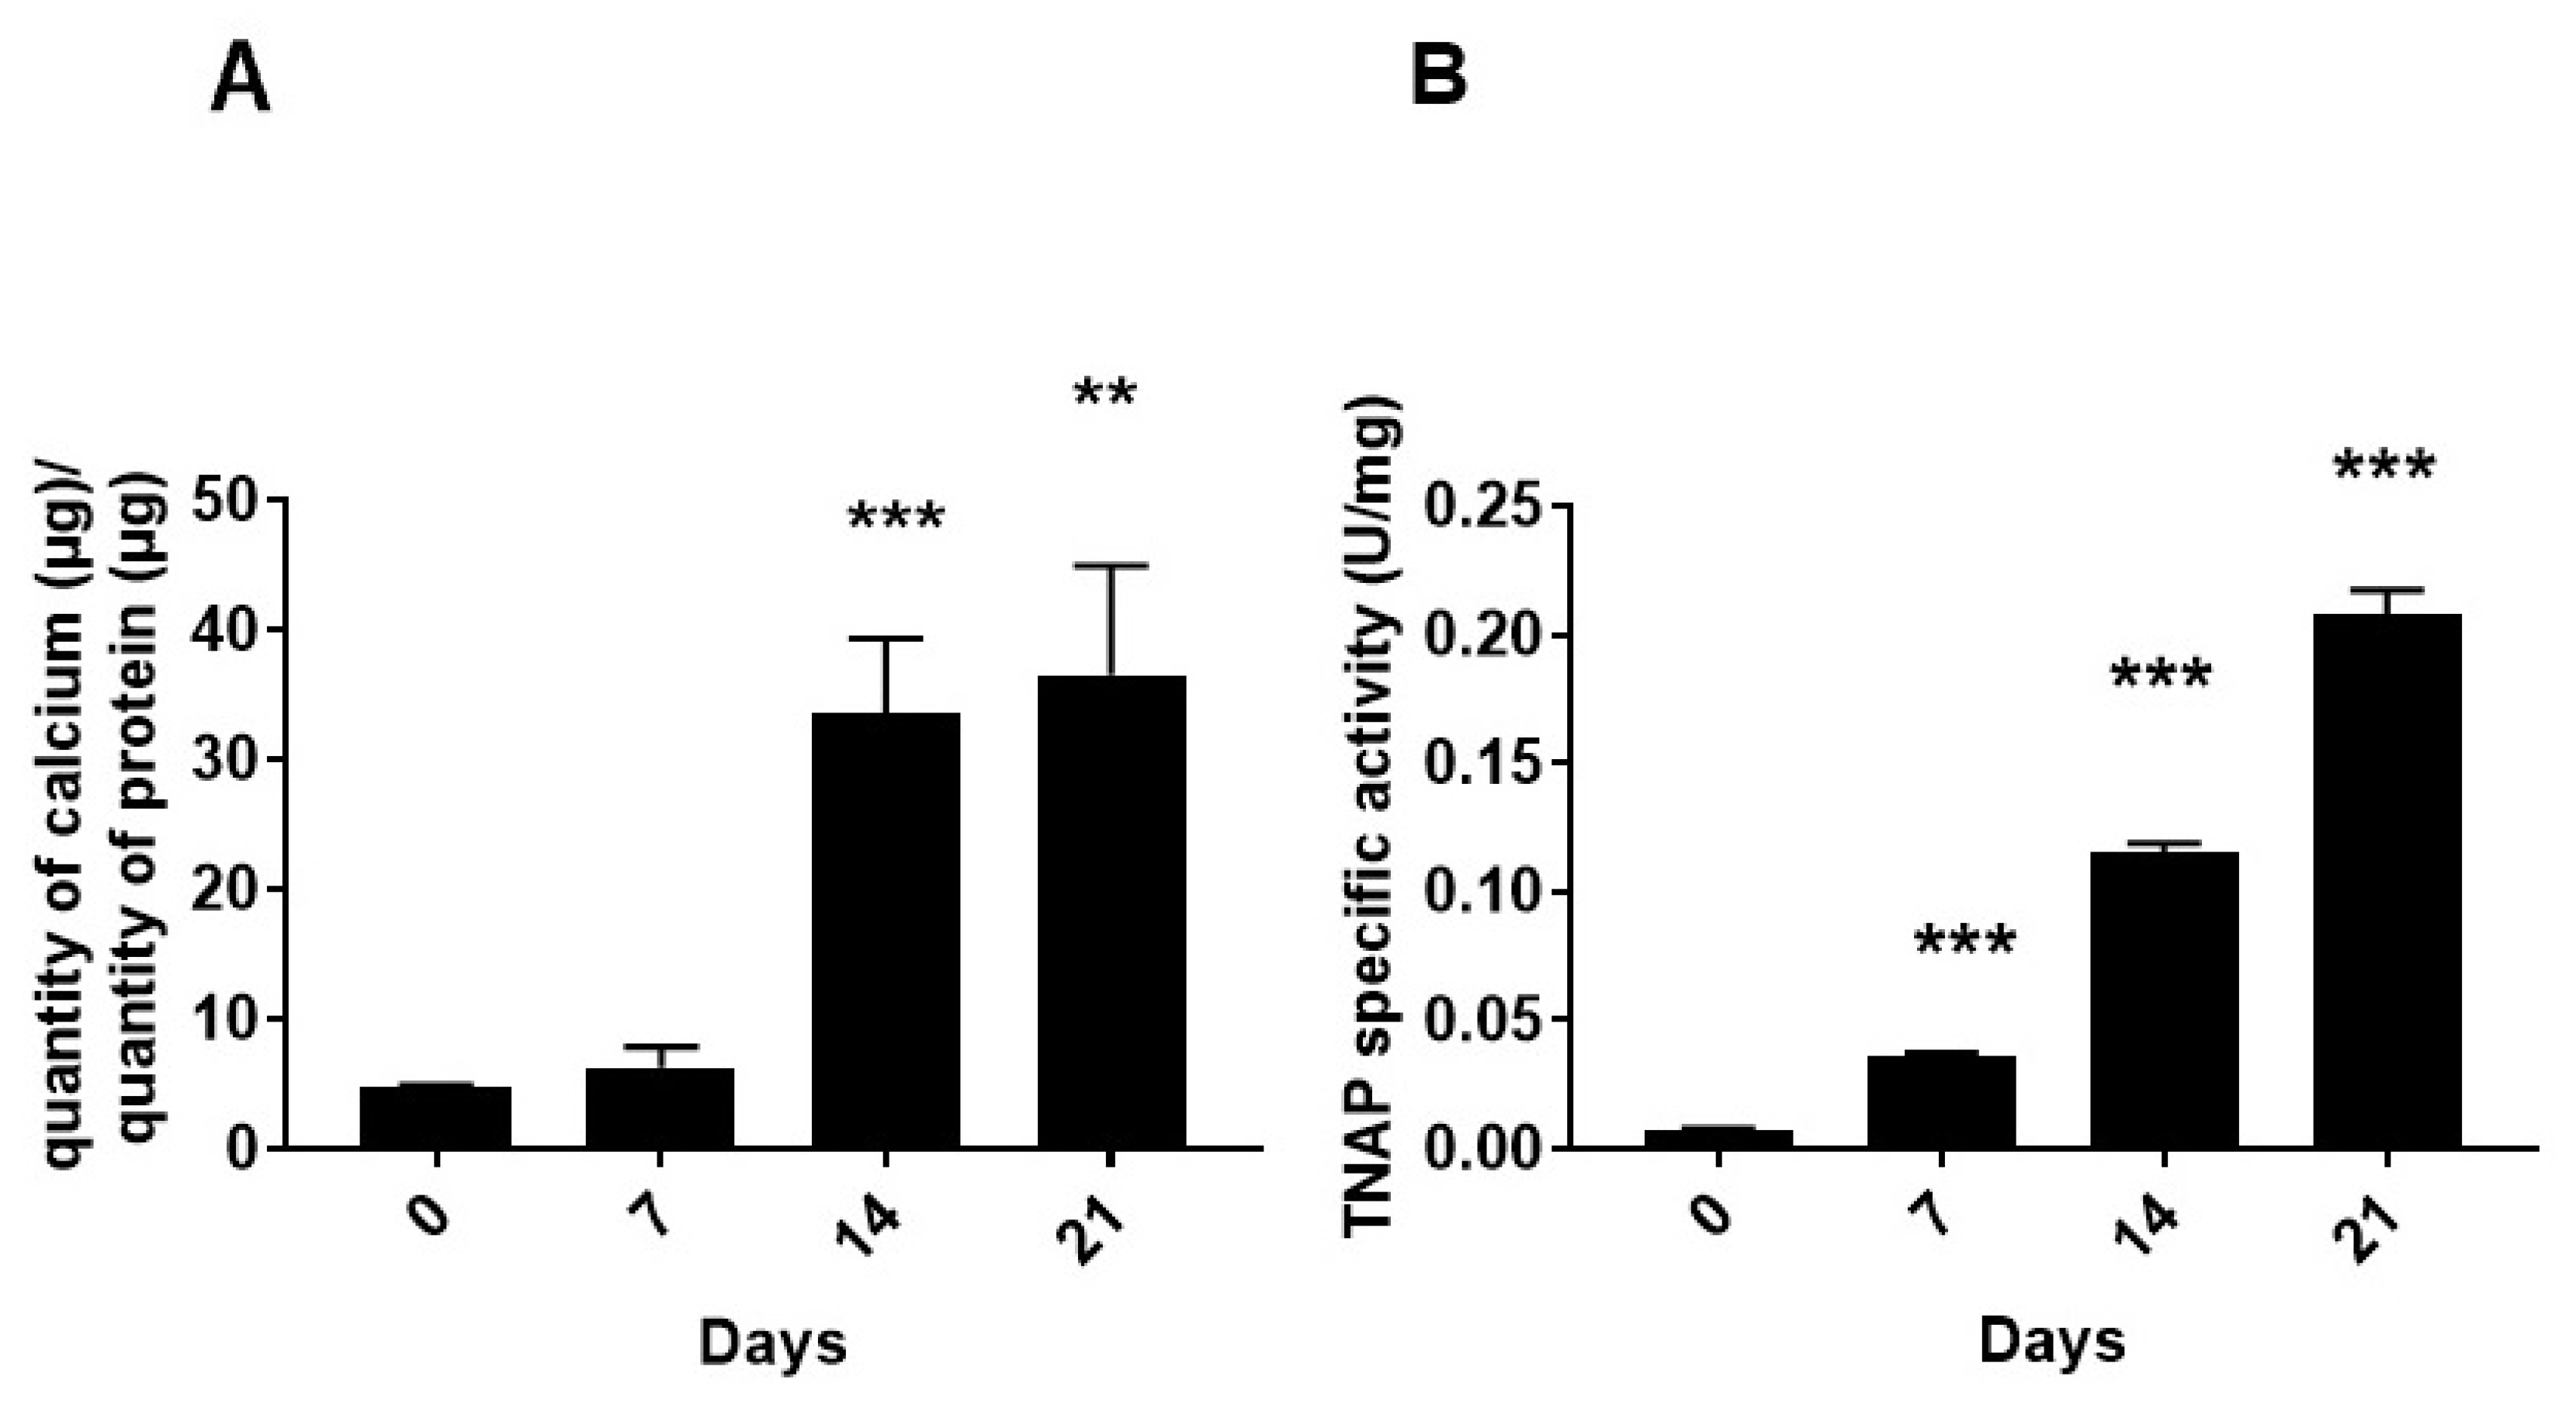
2.1. Characterization of MOVAS Cells

To monitor the transdifferentiation of MOVAS cells toward the osteochondrogenic phenotype, we determined the presence of calcium phosphate and its TNAP activity. The quantity of calcium relative to the mass of proteins increased from day 0 to day 21 (Figure 2A), which correlates with a significant increase in specific TNAP activity from day 0 to day 21 (Figure 2B).
TNAP activity is a marker for calcifying cells [13,14]. Taken together, these findings confirmed that MOVAS cells were able to calcify during the transdifferentiation in osteogenic medium as reported earlier [35,36,37]. A culture of MOVAS cells in stimulation medium (ascorbic acid and β glycerophosphate) is a suitable model to investigate vascular calcification (VC) in vitro [35,36,37]. 31P-NMR and infrared spectroscopy were used to monitor the direct hydrolysis of ATP under physiological pH.

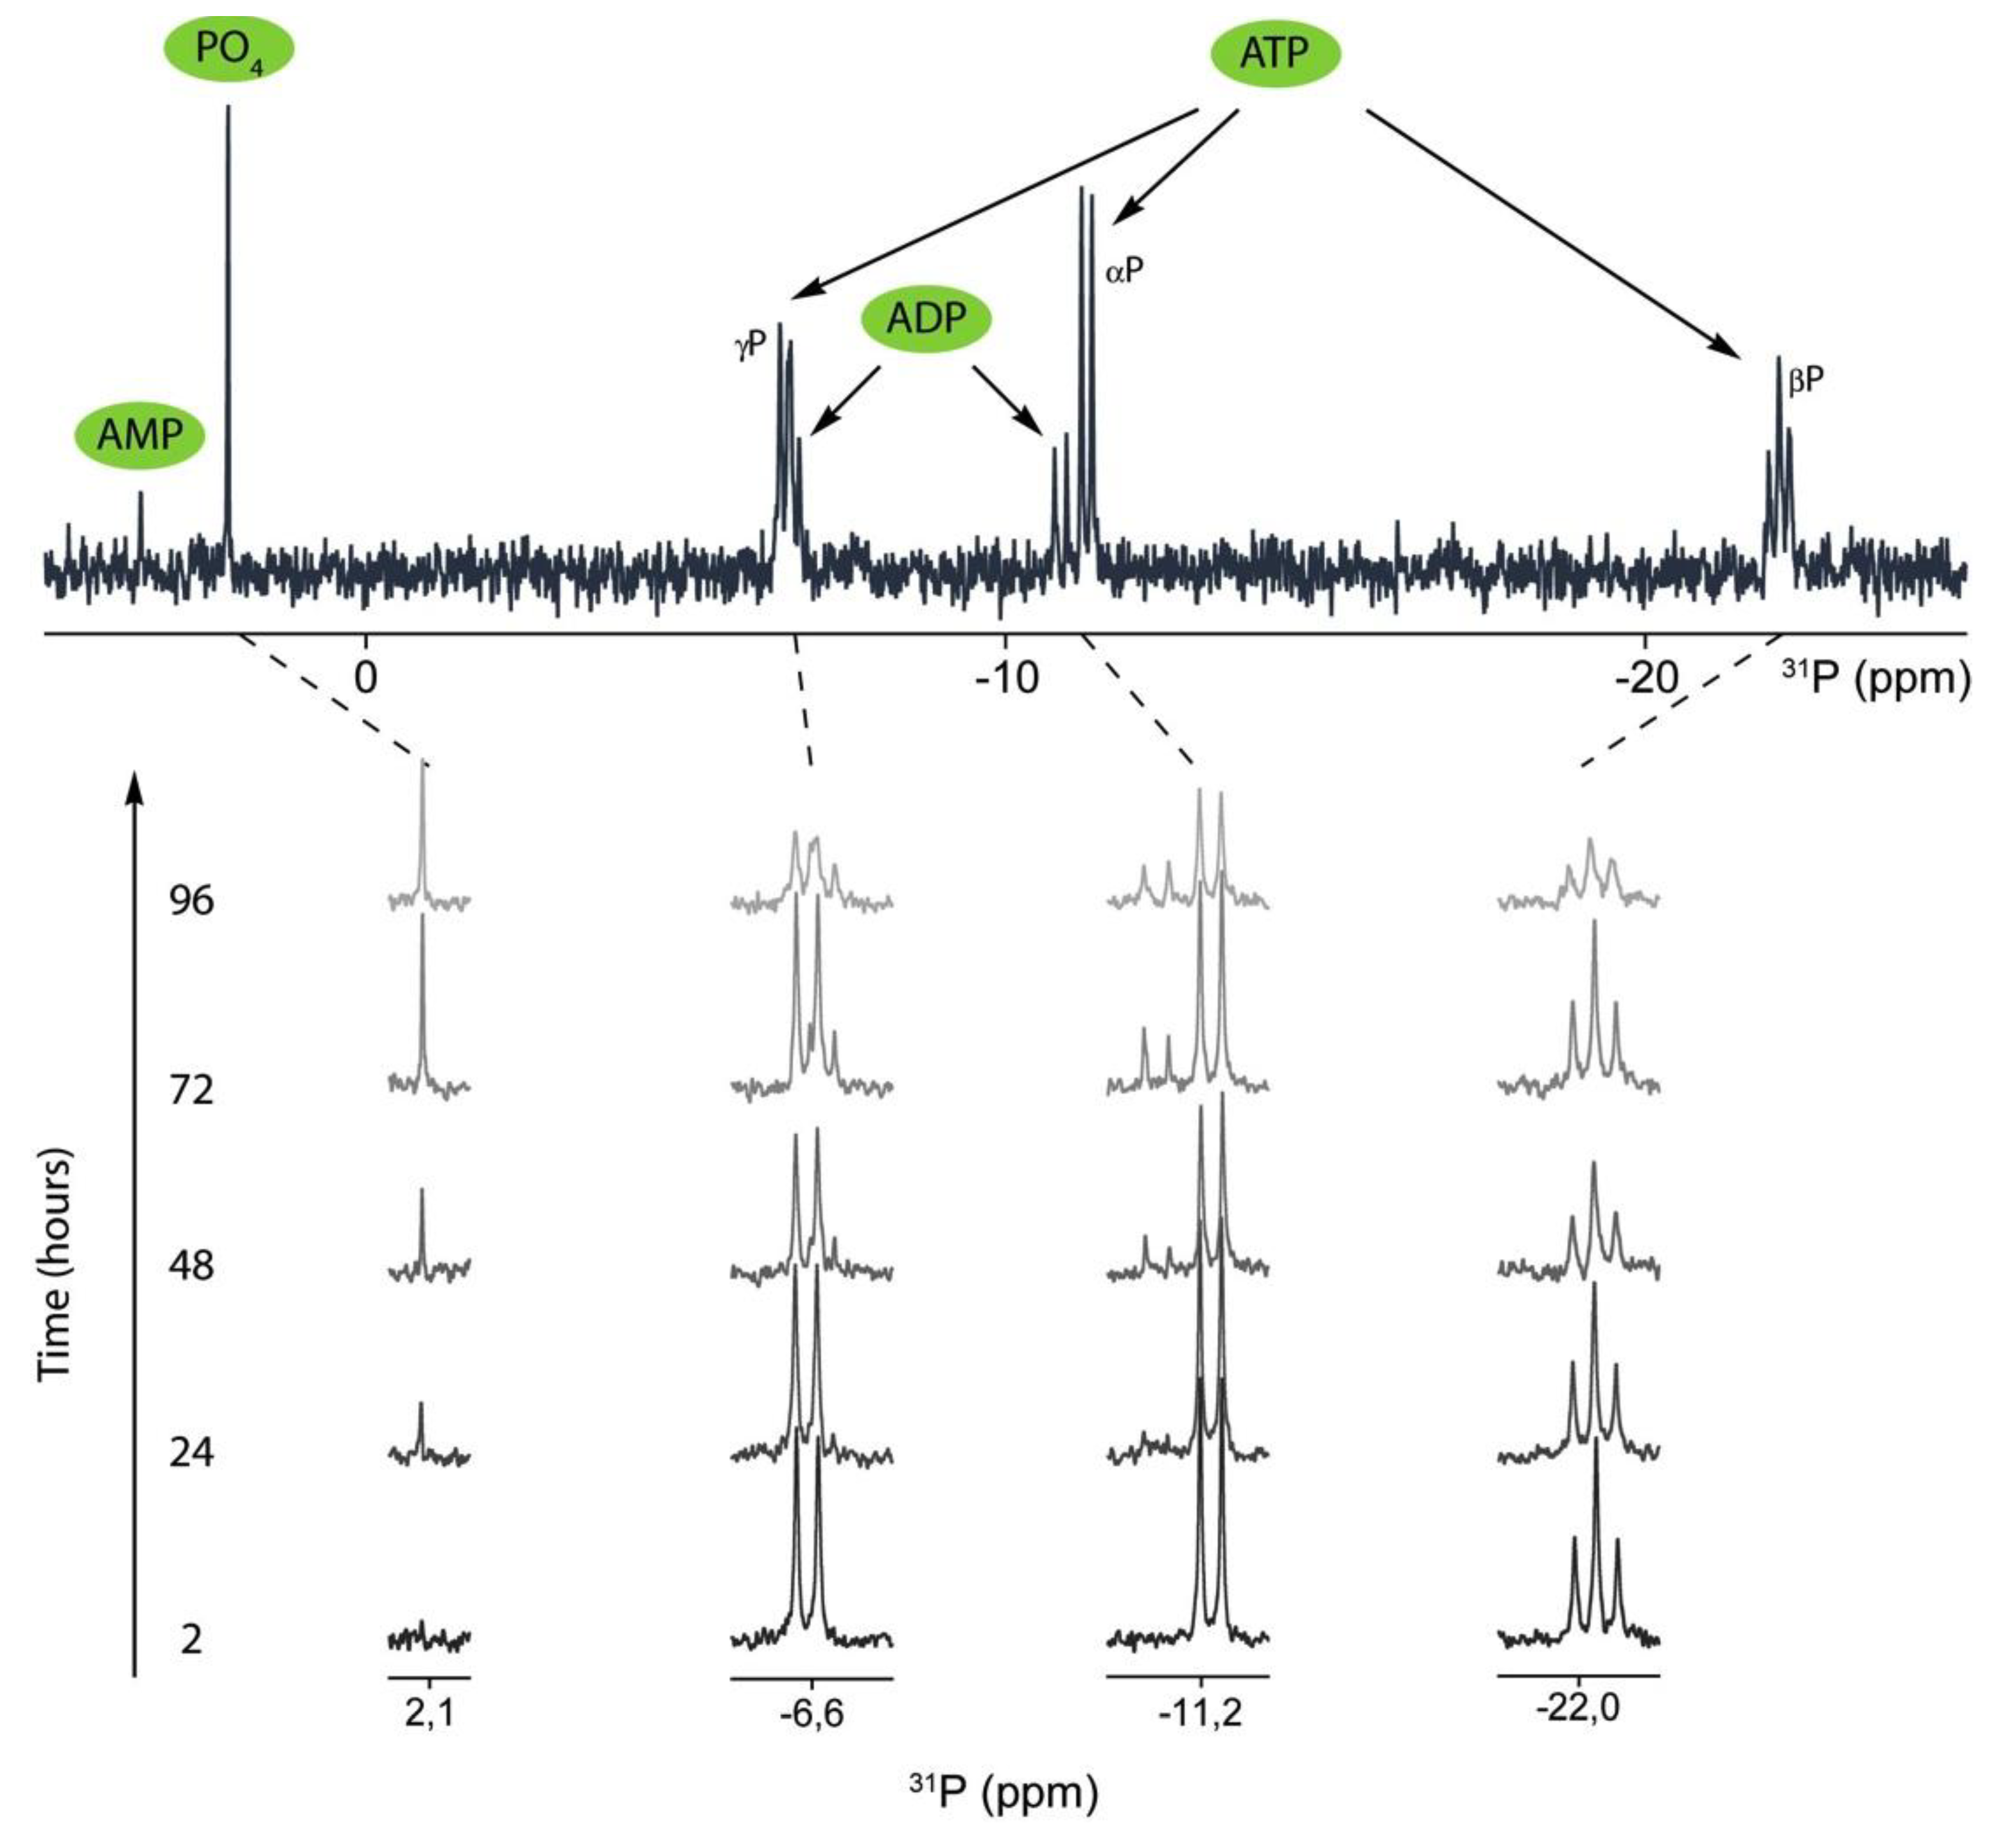
2.2. 31P-NMR Spectra of ATP Hydrolysis by MOVAS Cells during Transdifferentiation

Thanks to the natural abundance of phosphorous, 31P-NMR is a convenient method to quantify various nucleotides in a mixture (e.g., ATP hydrolysis products) without isolation (e.g., chromatographic analysis) or/and labeling [38]. Additionally, it does not require the use of radioactive species. Moreover, as a non-destructive method, it is particularly adapted to follow reaction kinetics [38]. Here, extracellular reaction media were extracted periodically from MOVAS to record 31P-NMR spectra from the whole reaction system, avoiding interference from intracellular nucleotides, nucleic acids, and phospholipids. MOVAS cells were incubated in osteogenic medium for 0, 7, 14, and 21 days. Then, after each incubation time in osteogenic medium, they were washed with Tris buffer (pH = 7.8), fixed with paraformaldehyde (PFA), and incubated in the presence of 50 mM extracellular ATP in Tris buffer with or without 5 mm Levamisole to determine the ATP hydrolysis rate. Extracellular media from fixed MOVAS cells were taken after 2, 24, 48, 72, and 96 h and analyzed by 31P-NMR. To illustrate the NMR findings, we selected those obtained on day 21 in the presence of 5 mM Levamisole (Figure 3).
ATP peaks (a triplet at −22.1 ppm, a doublet at −11.3 ppm, and a doublet at −6.6 ppm) decreased from 0 to 96 h, indicating significant hydrolysis of ATP (Figure 3). We observed the appearance of ADP (a doublet at −10.9 ppm and a doublet at −6.7 ppm) and Pi (a singlet at +2.2 ppm), which correlated with a decrease in ATP, indicating slight hydrolysis of ATP (Figure 3). ADP was hydrolyzed by forming AMP (a singlet at +3.5) and Pi (a singlet at +2.2 ppm). There was no formation of PPi (the singlet at −7.45 ppm was not observed) ruling out the hydrolysis of ATP into AMP and PPi. ATP hydrolysis increased from days 0 to 21 (Figure S1). The presence of TNAP was evidenced by measuring its activity at alkaline pH (Figure 2B), with p-nitrophenylphosphate (pNPP) as substrate. The addition of 5 mM levamisole, an inhibitor of TNAP, decreased ATP hydrolysis (Figure S1 in Supplementary Materials). The hydrolysis of extracellular ATP, in the presence of levamisole, was not fully abolished, suggesting the occurrence of CD39 or various types of ectonucleoside triphoshatediphosphohydrolases in MOVAS cells. The determination of kinetic constants k1, k2, and k3 were obtained by assuming sequential hydrolysis of ATP, which was confirmed in the experimental data since no PPi was observed (Figure 3). This was performed from each set of spectra measured at 0, 7, 14, and 21 days. The experimental data fitted well with the model (Figure S1 in Supplementary Materials) allowing the decrease in ATP to be quantified, together with the increase in ADP, followed by AMP and Pi (Table 1).
Regarding kinetic constants, k1 increased with the duration of incubation time from d9ay 0 to day 21, indicating a higher extracellular ATP hydrolysis rate, while k2 values, reflecting the extracellular ADP hydrolysis rate, were significant only from day 14 (Table 1). Under a saturating substrate concentration ([ATP] = 50 mM), the reaction rate was directly proportional to the enzyme concentration and therefore the kinetic rates reflect the phosphatase concentration associated with MOVAS. During maturation and differentiation, the number of MOVAS cells increased from approximately 0.97 million on day 0; 2.07 million on day 7; 3.5 million on day 14; to 5.1 million on day 21. The number of ATP molecules which were hydrolyzed per cell and per minute increased from 72 million on day 0; 143 million on day 7; 288 million on day 14; to 526 million on day 21 (Table 1, last column), corresponding approximately to a sevenfold increase in enzymes hydrolyzing ATP per cell, consistent with a 10-fold increase in specific TNAP activity (Figure 2B). The addition of 5 mM levamisole induced a decrease in the k1 and k2 values (Figure S1, right panel in Supplementary Materials and Table 2) as compared to those obtained without levamisole (Figure S1, left panel and Table 1).
The first-order constant k1 was significant only after incubating MOVAS cells for 14 days, while k2 was significant only when MOVAS cells were incubated for 21 days. The activity on day 21 slowed down to 158 million molecules per minute and per cell, in the presence of 5 mM levamisole (Table 2, last column), indicating: (1) a partial inhibition of ATP hydrolysis by levamisole and (2) that about one-third of the phosphomonoesterase activity was due to ectonucleoside triphoshatediphosphohydrolases other than TNAP.

2.3. 31P-NMR Spectra of PPi Hydrolysis by MOVAS Cells during Transdifferentiation

The hydrolysis of PPi by MOVAS incubated in osteogenic medium for 0 and 15–17 days was determined by 31P-NMR, with the addition of 50 mM PPi as substrate, under the same conditions as performed with 50 mM ATP. We observed significant PPi hydrolysis induced by MOVAS, which increased from approximately 0.04 nmol min−1 on day 0 to 0.2 ± 0.1 nmol min−1 on day 15–17. One of the most likely enzymes for the PPi hydrolysis is TNAP. Indeed, consistent with the fivefold increase in the hydrolysis of PPi from day 0 to day 15–17, TNAP-specific activity in MOVAS increased 10-fold from day 0 to day 14 (Figure 2B, using pPNP as substrate at alkaline pH).

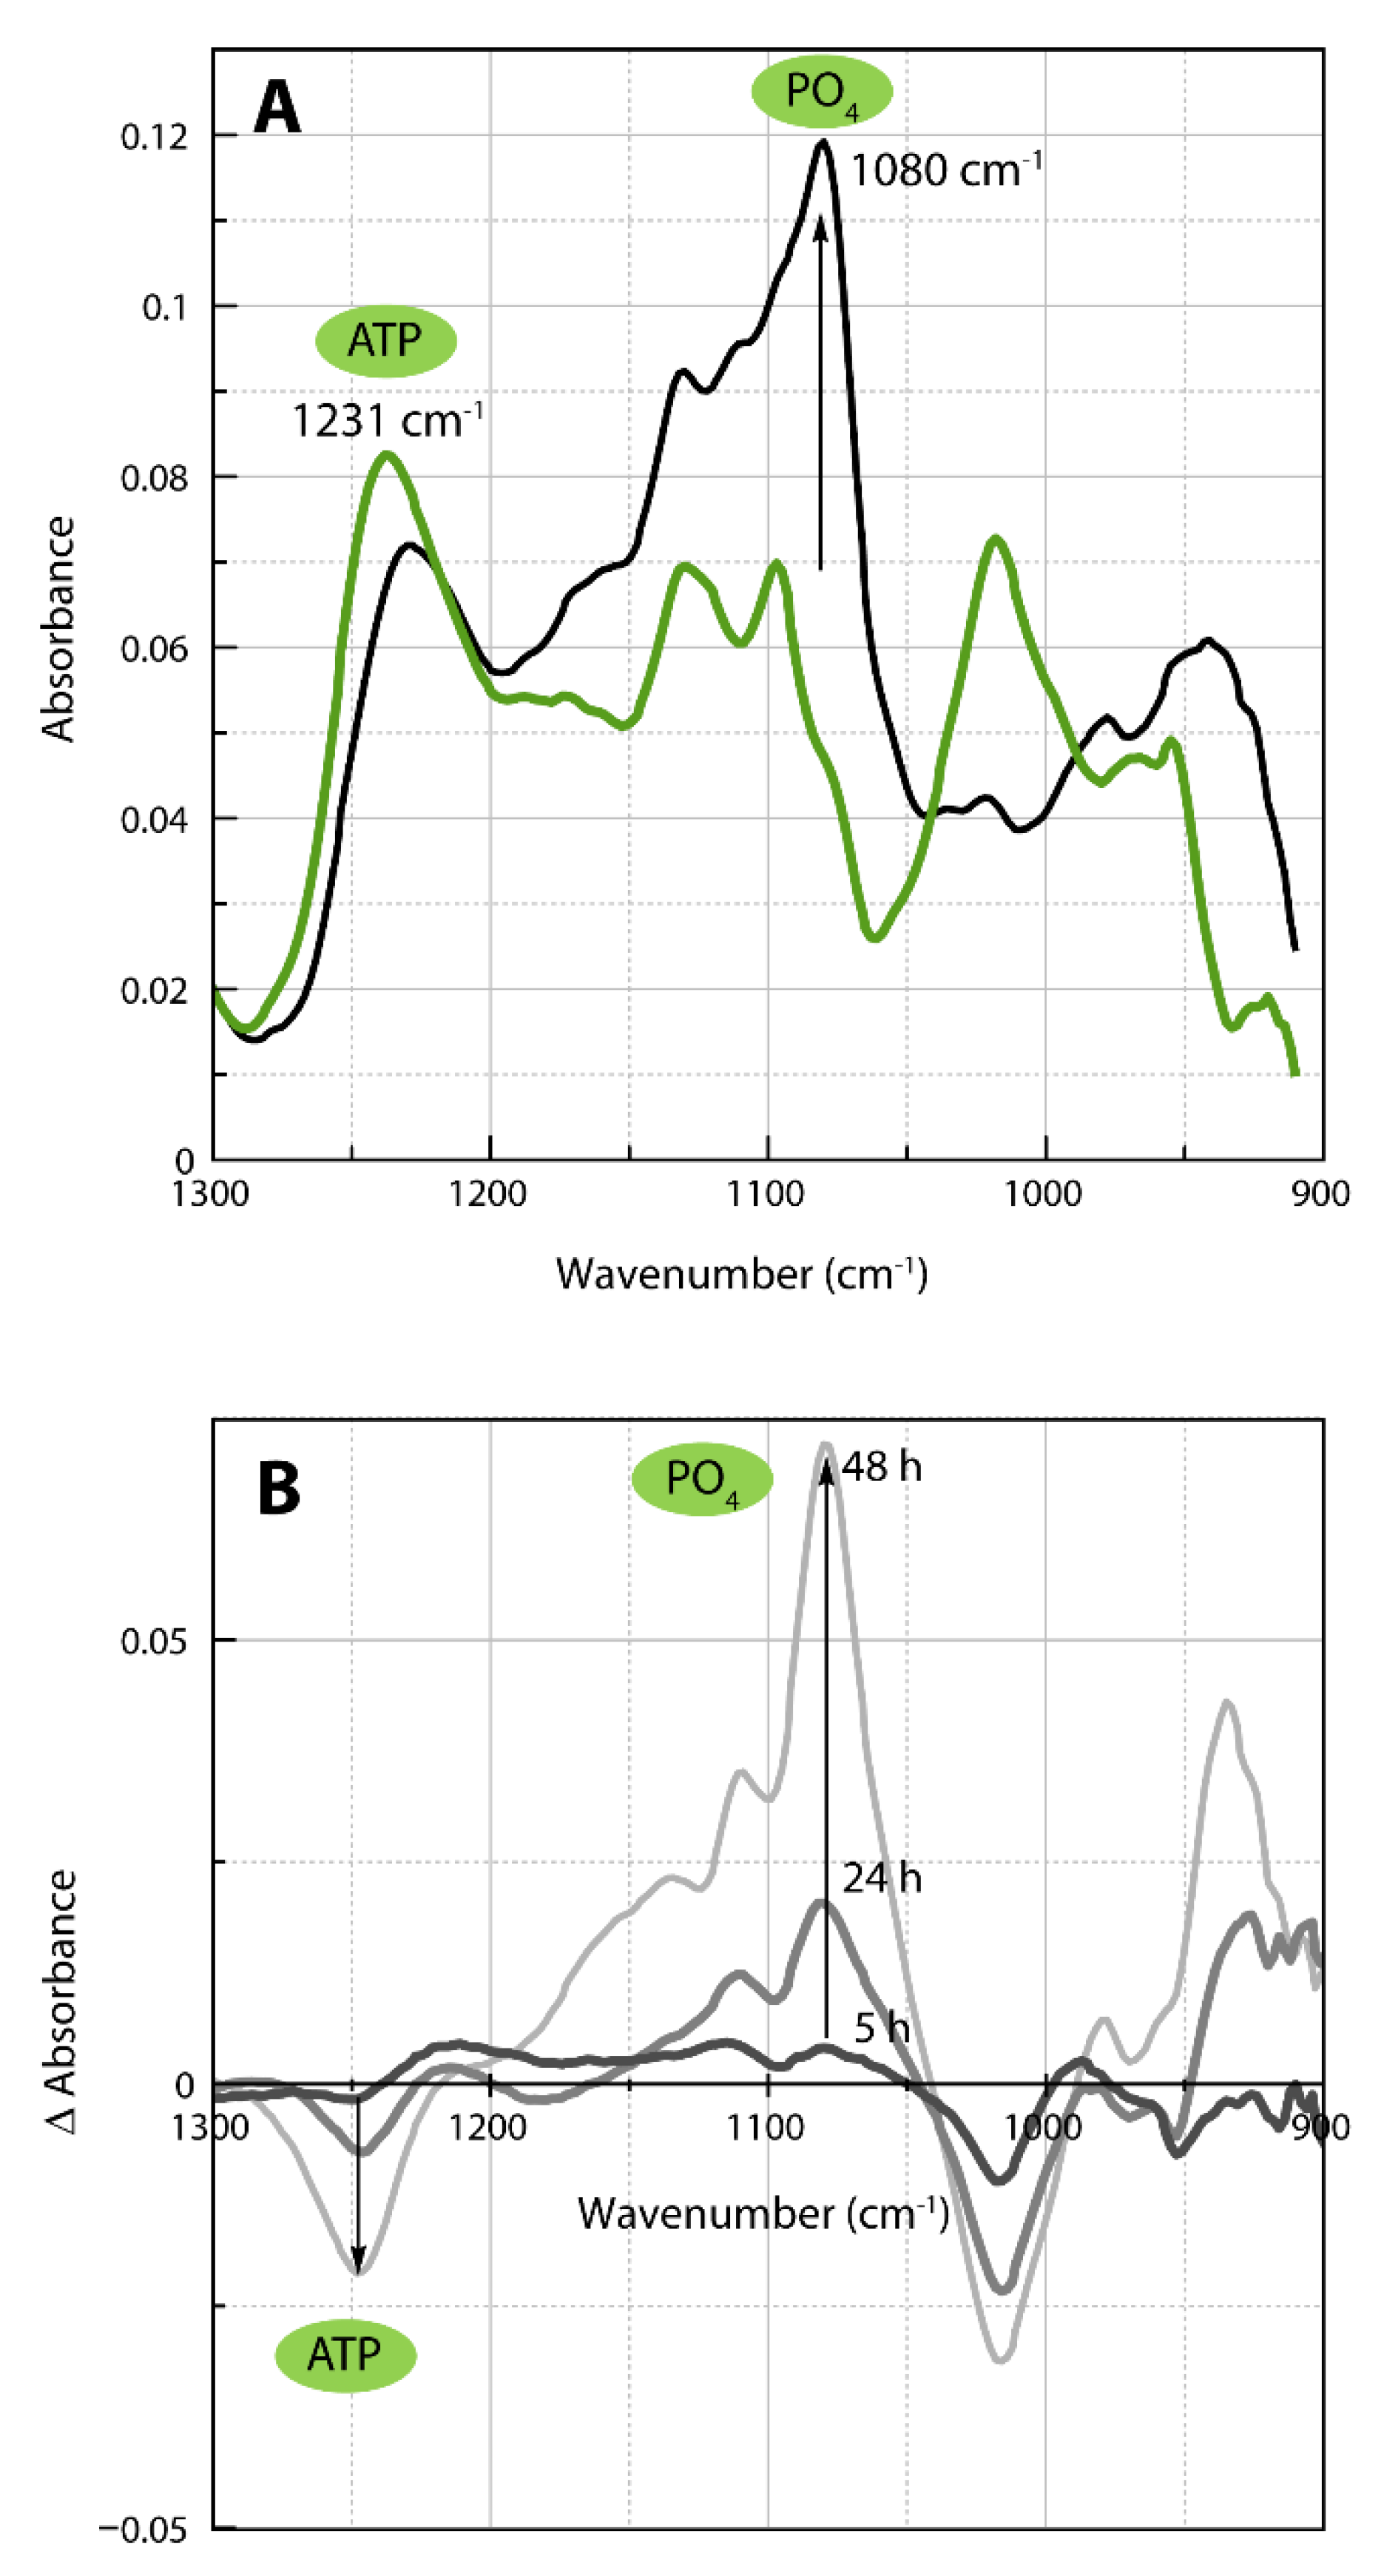
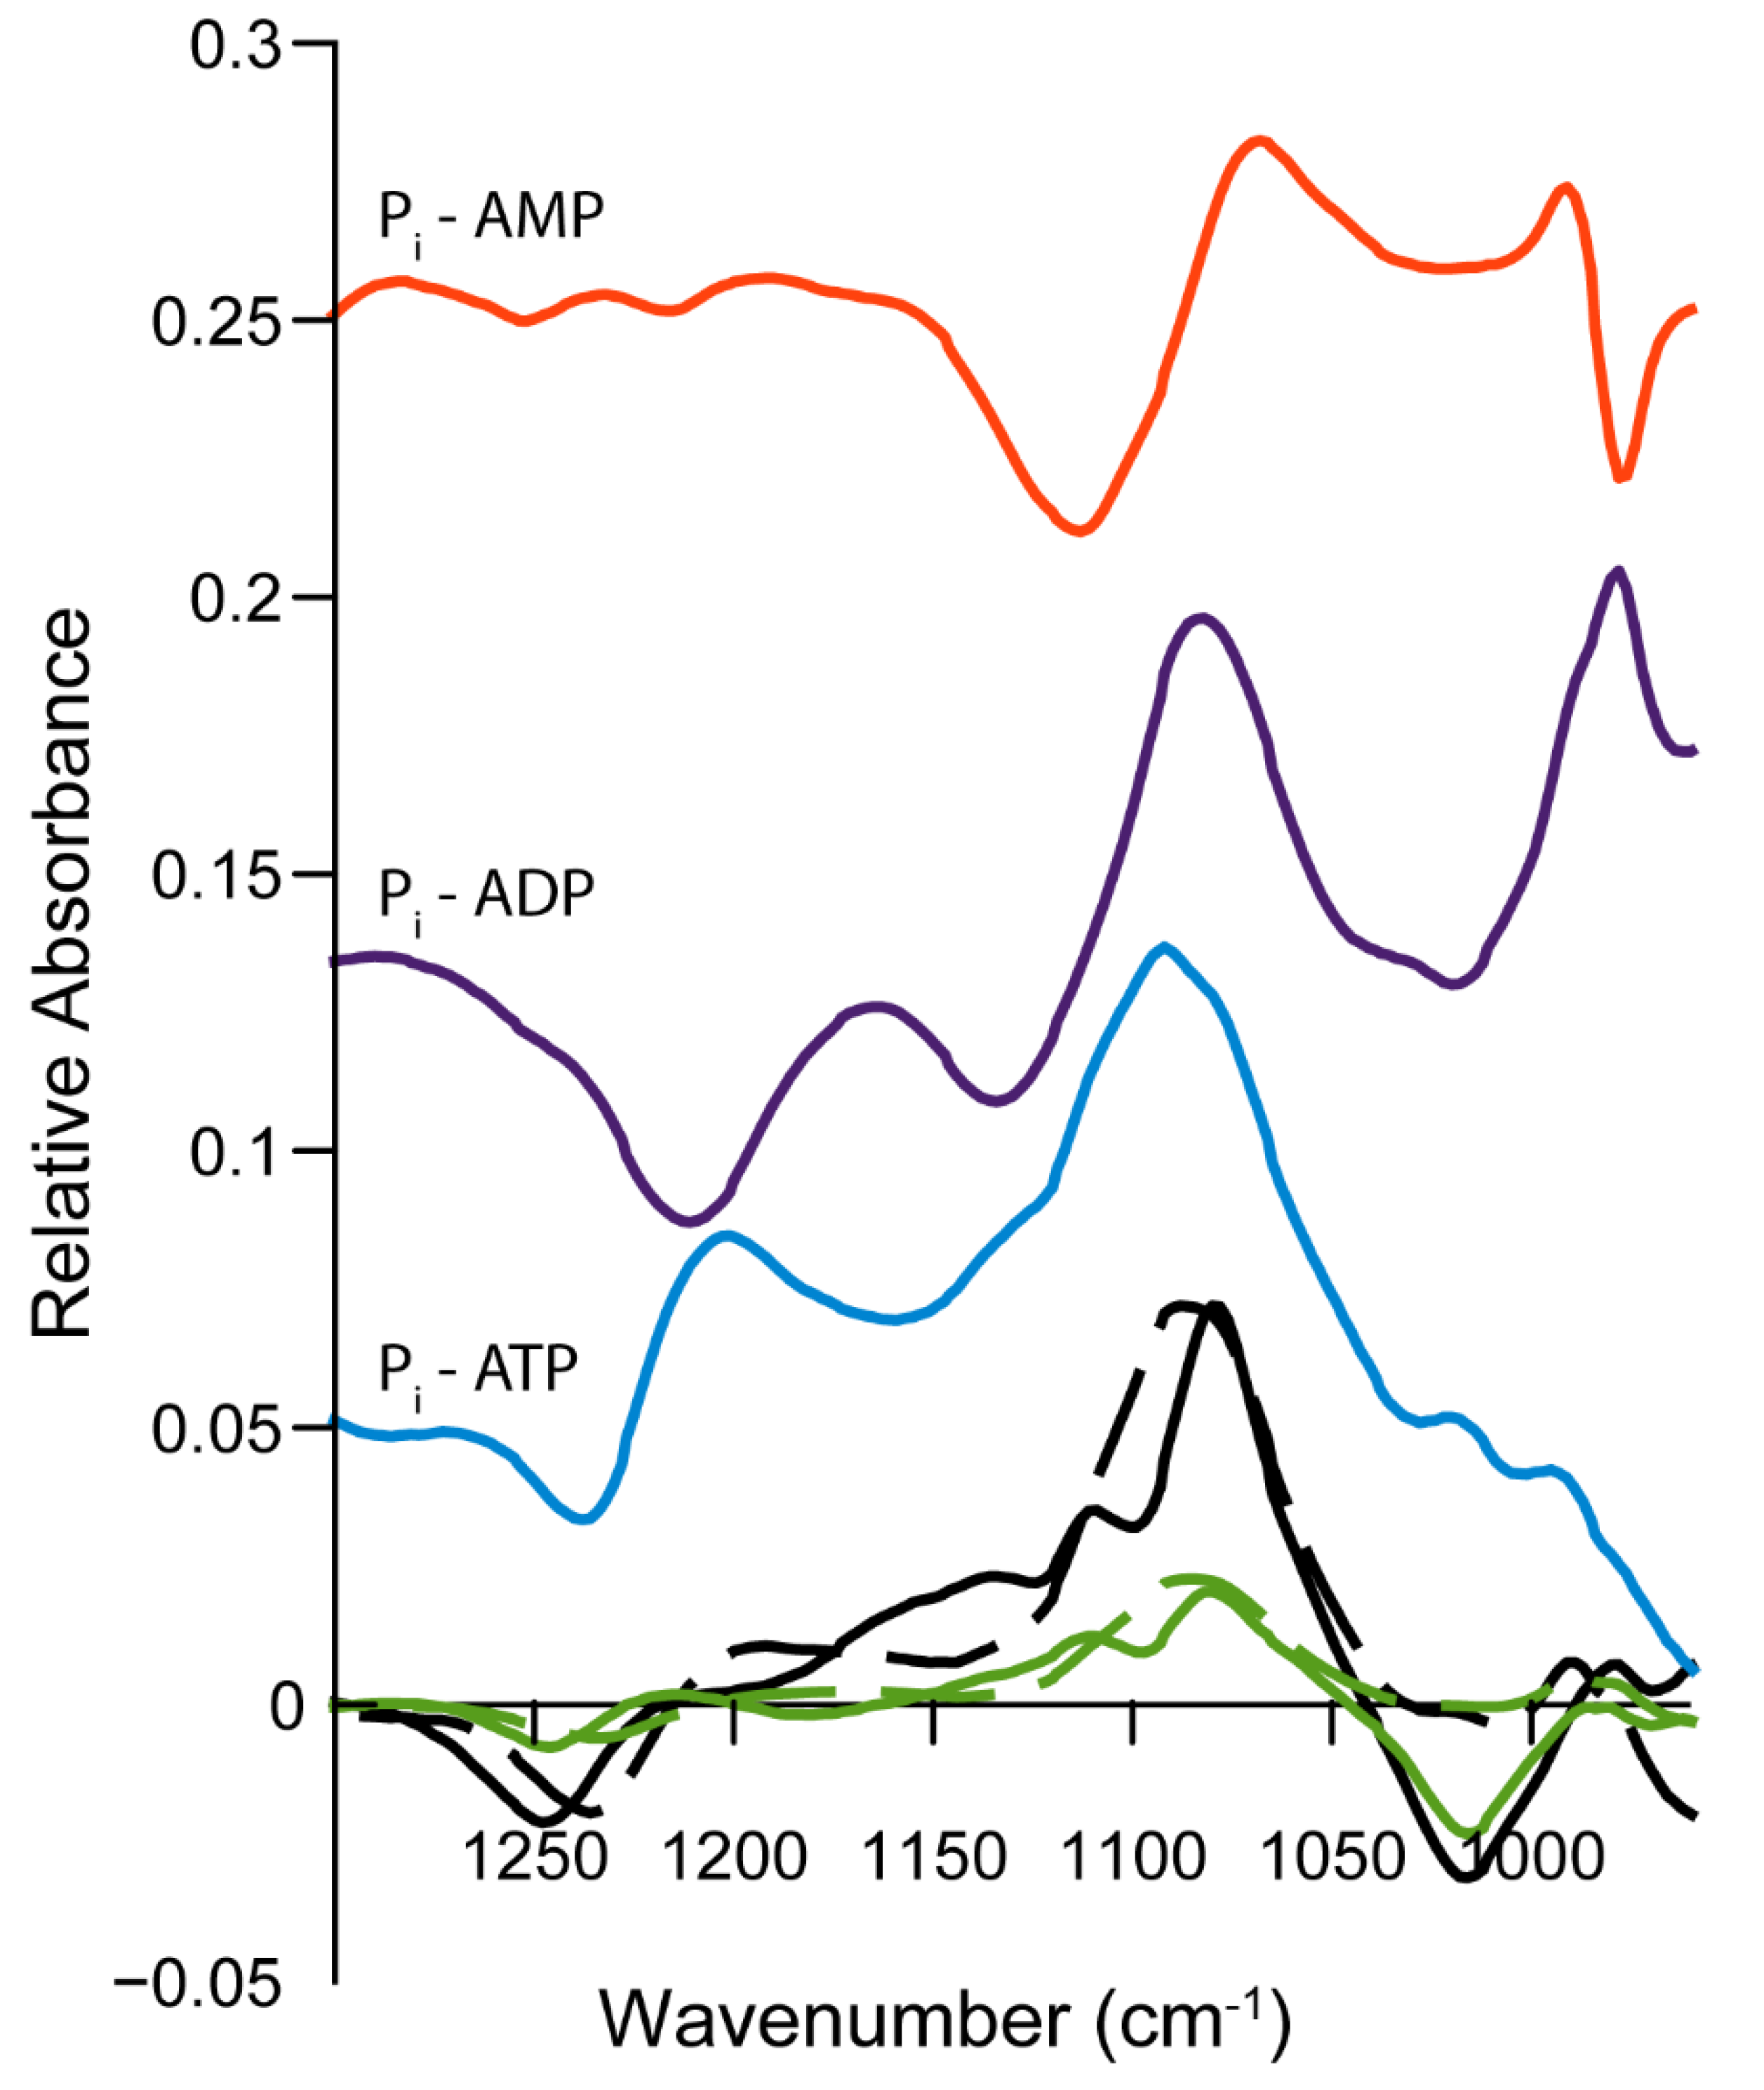
2.4. Infrared Spectra of ATP Hydrolysis by MOVAS Cells during Transdifferentiation

To complement the NMR findings, we analyzed the extracellular medium from PFA-fixed MOVAS using infrared spectroscopy. ATP (1231 cm−1), ADP (1212 cm−1), AMP (1088 cm−1), phosphate (1080 cm−1), and pyrophosphate (1107 cm−1) were identified from one of their respective phosphate vibration modes (Figure S2 in Supplementary Materials) [39,40]. For the sake of clarity, we present one typical example to illustrate the methodology. In this example, MOVAS cells were incubated in osteogenic medium for 14 days. Then, they were washed with Tris buffer, fixed, and incubated in the presence of 50 mm ATP in Tris buffer to determine the ATP hydrolysis by MOVAS cells. Extracellular media were collected after 3, 5, 24, and 48 h to be analyzed by IR. The IR spectrum of the medium after 3 h of incubation indicated the presence of ATP (Figure 4A, green trace).
ATP hydrolysis by MOVAS cells after 48 h (Figure 4A, black trace) was evidenced by a decrease in the 1231 cm−1 band corresponding to vibrational mode of phosphate belonging to ATP [39,40,41], with a concomitant increase in the band at 1080 cm−1 associated to the vibrational mode of phosphate [41]. IR difference spectra of extracellular media extracted from MOVAS cells incubated at the indicated times allowed us to determine the amount of phosphate as a function of time thanks to the molar extinction coefficient of Pi (Figure 4B). This calculation was done for each day of the transdifferentiation of MOVAS into chondrocyte-like cells. The rate was as low as 0.5 nmol min−1 on day 0 and increased to 6 nmol min−1 on day 21 (Table 3).
We observed an approximately twofold increase from 292 million phosphate produced per minute and per cell on day 0 to 625 million phosphate produced per minute and per cell on day 21 (Table 3, last column). We pooled activity values determined from NMR (Table 1) and from IR (Table 3) to evaluate the statistical significance of the increase (Figure 5). The increase in the ATP hydrolysis from day 0 was significant on days 14 and 21 (Figure 5A), while the increase in the activity per cell was significant on day 21 (Figure 5B).
To substantiate the sequential hydrolysis of ATP by MOVAS, we compared the IR difference spectra with the best-fitted curves composed of the IR difference spectra of the nucleotides (Figure 6).
The IR difference spectra corresponding to ATP hydrolysis (Figure 6, blue trace, ADP + Pi minus ATP), to ADP hydrolysis (Figure 6, violet trace, AMP + Pi minus ADP), and to AMP hydrolysis (Figure 6, orange trace, Pi minus AMP) served as input values to fit the IR difference spectra of the extracellular medium containing ATP measured after 48 h minus 3 h (Figure 6, full black line) and 24 h minus 3 h (Figure 6, full green line). The best fits (Figure 6, dashed lines) were not perfect, especially in the range 1060–960 cm−1, where neither nucleotide, Pi or PPi, absorbed, indicating contributions from other unidentified species. Nevertheless, the curve fitting was sufficient to confirm the sequential hydrolysis of ATP as observed on the dashed and full lines of the IR difference spectra for 48 h minus 3 h (Figure 6, black traces) and for 24 h minus 3 h (Figure 6, green traces). The experimental data were fitted with the model (Figure S3 in Supplementary Materials) allowing the decrease in ATP to be quantified, together with the increase in ADP, and AMP and Pi. We obtained a k1 value of approximately 0.01617 ± 0.00096 h−1 which was higher than that measured from the 31P-NMR. In addition to the sequential hydrolysis of ATP, as evidenced by the IR spectra, a shoulder at approximately 1107 cm−1 (Figure 4) may indicate the presence of PPi, which absorbs at 1107 cm−1 (Figure S2 in Supplementary Materials). AMP, which has a doublet at 1088 and 1107 cm−1 (Figure S2 in Supplementary Materials), may also contribute to the 1107 cm−1 shoulder. From the IR spectra, we cannot rule out the presence of PPi. However, the whole hydrolysis of ATP by MOVAS at a saturated ATP concentration is dominated by sequential phosphomonoesterase activity, which yields ADP, AMP, and Pi, and not by the phosphodiesterase activity, which leads to PPi.

3. Discussion

3.1. Functions of Tissue Non-Specific Alkaline Phosphatase and Its Relevance to Vascular Calcification

We confirmed that the calcification of MOVAS-1 cells can be induced in the presence of calcifying medium (containing β-glycerophosphate and ascorbic acid) [35], as detected by Alizarin Red and the quantification of calcium deposition and alkaline phosphatase activity (Figure 2). In rodent MOVAS and A7R5 VSMCs, the addition of exogenous alkaline phosphatase (AP) or TNAP overexpression were sufficient to stimulate the expression of several chondrocyte markers and induce mineralization [42]. TNAP is an ectoenzyme that is necessary for mineralization due to its ability to hydrolyze PPi—a mineralization inhibitor—as observed in VSMCs transdifferentiated into chondrocyte-like cells, as well as in primary chondrocytes [42]. That was confirmed by the addition of levamisole, a TNAP inhibitor, which inhibited the PPi hydrolysis in VSMCs transdifferentiated into chondrocyte-like cells [42]. Our findings indicated that the hydrolysis of exogeneous PPi by MOVAS increased fivefold from non-mineralizing MOVAS to calcifying MOVAS after 15–17 days of incubation under calcifying medium. This is consistent with the postulate that activation of TNAP in VSMCs in vascular smooth muscle cells precedes vascular calcification [43].

3.2. Sequential Hydrolysis of ATP

Extracellular nucleotides are released from the secretory pathway or via conductive/transport mechanisms, such as membrane connexin hemichannels, pannexin channels, and ATP conducting anion channels (Figure 1), or when membranes lose their integrity as cells die through necrosis [32,44]. The hydrolysis of ATP by smooth muscle cells was sequential, indicating that the hydrolysis was dominated by phosphomonoesterase activity. It appears from the 31P-NMR data that more than two-thirds of the hydrolytic activity was inhibited in the presence of levamisole in fully trans-differentiated VSMC. This is consistent with previous reports that show that 75% of phosphatase activity in the plasma membrane is due to a levamisole-sensitive enzyme, probably TNAP [45]. Therefore, the remaining phosphomonesterase activity, including that of ectonucleoside triphosphate diphosphohydrolase 1 (CD39), which catalyzes the hydrolysis of ATP into ADP and ADP into AMP, cannot be excluded [31]. Furthermore, AMP can be further dephosphorylated to adenosine by 5′ ectonucleotidase or CD73 [31]. The hydrolysis of locally released ATP by ENPP1 is the major source of extracellular PPi in chondrocytes and osteoblasts [46,47,48]. However, transdifferentiated smooth muscle cells did not produce detectable PPi from ATP, suggesting that the phosphodiesterase activity was very weak, while PPi is the major end product during hydrolysis of ATP by C6 rat glioma cells [49]. This indicates that non-mineralizing cells have a lower ability to hydrolyze PPi as compared to calcifying cells, which is coherent with the observed fivefold increase in PPi hydrolysis from non-calcifying MOVAS to calcifying MOVAS. This is also consistent with recent findings that report that pyrophosphate synthesis from ATP was reduced and pyrophosphate hydrolysis (via TNAP; PPi →Pi) was increased in both aortas and blood obtained from mice with Hutchinson–Gilford progeria syndrome [50]. Under pathological conditions, smooth muscle cells, by becoming calcifying cells, increased pyrophosphate hydrolysis. This indicates a possible treatment strategy for improving extracellular pyrophosphate metabolism, which could constitute an alternative therapy against vascular calcification with pyrophosphate deficiency [50].

3.3. Limitations and Comparisons between 31P-NMR and IR Findings

The transdifferentiation of smooth muscle cells into chondrocyte-like cells was accompanied by increasing specific TNAP activity determined under alkaline conditions with pNPP (Figure 2B), as well as increasing ATP hydrolysis by cells at neutral pH (Table 1 and Table 3). The increase in ATP hydrolysis by cells was not solely due to the increase in cell numbers (Figure 5) but also to the increase in phosphomonoesterase activity by a factor of two (IR findings, Table 3) to seven (31P-NMR findings, Table 1), confirming that transdifferentiation occurred. This was corroborated by the rises in calcium phosphate deposits and the amount of calcium during transdifferentiation (Figure 2A). ATP hydrolysis by MOVAS cells as determined from 31P-NMR was lower than that obtained from the IR spectra due to different experimental setups and variations. This is consistent with the fact that the decrease in ATP concentration was measured in the case of 31P-NMR, while the increase in Pi concentration, reflecting the hydrolysis of all nucleotides, was determined by IR. Moreover, the superposition of nucleotide signals in the IR leads to a more difficult data analysis while the signals in 31P-NMR are clearly defined. The fixation of cells by PFA may suggest but do not necessarily reflect all the action of cell-surface activities.

3.4. Physiological and Pathological Relevance of Kinetic Values Determined under Saturated Conditions

Under physiological conditions, extracellular ATP concentration can reach approximately 1–1000 nM [22,23,51,52], while pericellular ATP can reach approximately 1–10 μM [31]. Exogeneous ATP (50 μM) suppresses the calcification of living VSMC co-stimulated with cAMP and high Pi [33], suggesting that ATP (or other molecules) is sufficient to prevent calcification in living cells. Atherosclerotic plaques are characterized by the presence of necrotic macrophages and VMSCs, which are likely associated with dramatically increased local concentrations of ATP. In this context, our measurements were performed under the saturated concentration of 50 mM of ATP. The activity of the apparent ATP hydrolysis, which was approximately 72–292 pmol min−1 per million cells on day 0, was largely due to the high ATP concentration, as compared with those observed at physiological ATP concentrations, which were around a few pmol min−1 per million cells [53]. Such high concentrations of ATP would increase ATP hydrolysis to close to maximal values (Vm), affecting cellular activity. The addition of exogeneous ATP interacted with P2Y2 purinergic receptors, triggering TNAP expression, as evidenced in the osteoblasts [54], and may change CD39 and CD73 expression, as observed in rat cortical astrocytes [55]. The extracellular ATP hydrolysis reflected the overall contributions of all ecto-enzymes of the cells. The absence of any PPi formation, even with low TNAP activity in smooth cells that are not fully transdifferentiated, is of particular interest. This was corroborated with the fivefold increase in the hydrolysis rate of PPi from non-mineralizing MOVAS, which is reminiscent of normal physiological conditions, to calcifying MOVAS, which corresponds to pathological conditions, similar to those that occur in the media of arteries during aortic calcification. Indeed, previous reports indicate an association between the loss of plasma PPi and vascular calcification [45,50,56,57]. PPi deficiency contributes to vascular calcification [52]. Extracellular PPi can be synthesized from extracellular ATP by ENPP1 or transported by ANKH, whereas PPi is hydrolyzed to phosphate by TNAP, contributing to the formation of apatite crystals or calcium phosphate salts [56,57]. A small variation of PPi concentrations within micromolar range has a drastic inhibition effect on apatite formation, in contrast to the millimolar range of Pi necessary to induce apatite formation [20]. Since the PPi hydrolysis is dominated by TNAP this suggests that TNAP is a possible target to prevent calcification [56]. Taken together, these findings support that TNAP and other phosphatases in the vasculature contribute to the pathology of vascular calcification and that it is a druggable target [21,43,56,57,58,59].

4. Materials and Methods

4.1. Chemicals and Reagents

Culture media, serum, streptomycin, penicillin Alizarin red (ARS), bicinchoninic acid, p-nitrophenyl phosphate, Nonidet P-40, and cetylpyridimium chloride were obtained from Sigma Aldrich (Lyon, FR). Phosphate buffered saline (PBS) pH 7.4 contained 137 mM sodium chloride, 10 mM phosphate, and 2.7 mM potassium chloride (D8537, Sigma Aldrich®, Lyon, FR).

4.2. Cell Cultures

Mouse MOVAS cells from ATCC (ATCC® CRL-2797, Molsheim, FR) were cultured in Dulbecco’s Modified Eagle’s Medium rich in glucose (4.5 g.mL−1) (DMEM, Sigma®, St. Louis, MO, USA) with L-glutamine (2 mM), streptomycin (0.1 mg.mL−1), penicillin (100 U), fetal bovine serum (10% v/v), and 4-(2-hydroxyethyl)-1-piperazineethanesulfonic acid buffer (20 µM). This medium is identified as the growth medium. Cultures were maintained in a humidified atmosphere consisting of 95% air and 5% CO2 at 37 °C. Cells were plated at a density of 10,000 cells.cm−2. Cells were grown confluent in growth medium supplemented with 50 μg.mL−1 ascorbic acid and 10 mM β-glycerophosphate (called osteogenic medium), for 0, 7, 14, and 21 days (respectively D0, D7, D14 and D21). The medium was changed three times per week. These two osteogenic factors enable MOVAS cells to become calcifying vascular cells [35,36,37]. Cell cultures were analyzed for calcium content (Section 4.3), protein determination (Section 4.4), and TNAP activity using visible spectrometry (Section 4.5), NMR (Section 4.6), and IR (Section 4.7).

4.3. Calcium Assay

At the indicated time of incubation (D0, D7, D14, and D21), the extracellular medium was removed and MOVAS cells were washed with 1 mL of PBS. Deposited calcium was extracted from the extracellular matrix using 200 µL of 0.6 M HCl and kept overnight at room temperature. Then, 20 µL of the supernatant was mixed with 100 µL of 2-amino-2-methyl-1-propanol and 100 µL of a mix of 160 µm o-cresolphtaleine complexone and 6.8 mm 8-hydroxyquinoline in water. It was incubated for 5 min at room temperature [36,37]. Absorbance was measured at 570 nm by TECAN® Infinite M200 Pro microtiterplate reader. Calcium deposition was normalized to the protein amount in cells. Protein concentration was determined as indicated in Section 4.4.

4.4. Protein Determination

MOVAS cells grown at the indicated incubation times (D0, D7, D14, and D21) were harvested in 200 µL of 0.1M NaOH and 0.1% SDS aqueous solution for calcium determination or in 400 µL Nonidet P-40 (0.2%) for the determination of enzymatic activity. Cells were disrupted by sonication then centrifuged 5 min (2000 g) at 4 °C. Then, 10 µL of supernatant was completed to 200 µL of reactive medium as reported [36,37]. It was incubated for 30 min at 37 °C. The reaction was stopped by thermal shock (plunging into ice). Absorbance was measured at 562 nm by TECAN® Infinite M200 Pro microtiterplate reader. Calibration was obtained using bovine serum albumin as standard.

4.5. Tissue Non-Specific Alkaline Phosphatase Activity Determination

MOVAS cells grown for the indicated incubation times (D0, D7, D14, and D21) were harvested in 0.2% Nonidet P-40 and disrupted by sonication then centrifuged 5 min (2000 g) at 4 °C. Cell lysates were used to determine TNAP activity to demonstrate the VSMC transdifferentiation associated with increased TNAP expression, which is a marker for mineral competent cells [32,33,35,36,42]. An aliquot (10 µL) of supernatant was pre-incubated for 5 min at 37 °C. Then, 190 µL of 10 mM p-NPP, 0.56 mM 2-amino-2-methyl-1-propanol and 1 mM MgCl2 in alkalinized distilled water (pH 10) was added [60]. The rate of p-nitrophenolate (pNP) release was measured for 2 min every 10 s at 405 nm by TECAN® Infinite M200 Pro spectrophotometer. Specific activity was expressed as µmol of pNP released per minute and per milligram of protein (µmol.min−1.mg−1 or U.mg−1). Protein concentration was determined as indicated in Section 4.4.

4.6. Preparation of Extracellular Medium to Be Analyzed by 31P-NMR and IR

MOVAS cells were collected at the indicated time (D0, D7, D14, or D21) in growth medium with 50 μg.mL−1 ascorbic acid and 10 mM β-glycerophosphate, then they were washed with 1 mL of PBS, and fixed with 400 µL of 4% (v/v) PFA for 20 min at room temperature. PFA was then removed. PFA may affect the enzymatic activity of the cell surface. However, it was necessary to fix the cells with PFA since the incubation volume was too small to take aliquots of extracellular medium at time intervals. PFA or formalin were used to fix cells or tissues to determine activity or presence of ANKH [15], ENPP [17], and TNAP [17,42,58]. To initiate the phosphatase reaction, cells were incubated in Tris buffer (pH 7.8 100 mM Tris, 5 mM MgCl2, 5 µm ZnCl2) containing either 50 mM ATP or 50 mM PPi corresponding to a total of around 0.5 mL including cells. The reaction was performed with or without 5 mM Levamisole, a commercial inhibitor of TNAP. At the indicated time (2, 5, 24, 48, 72, and 96 h), 50 µL of reaction medium was sampled and stored at −20 °C prior to NMR or IR analyses.

4.7. 31P-NMR Spectroscopy

Herein, 40 µL of reaction medium (see Section 4.6) was mixed with 40 µL of 2H2O (10% (v/v) in Tris buffer) and 320 µL of Tris buffer (pH 7.8, 100 mM Tris, 5 mm MgCl2, 5 µm ZnCl2,). Auto-shim was done on 2H2O. 31P-NMR spectra were measured with a Ascend™ 600 (Bruker®, Birrica, MA, USA) or with a 300 ultrashield (Bruker®) spectrometer. Simultaneous ATP, ADP, AMP, PPi, and Pi peaks were monitored [38]. Peaks were integrated to determine the concentrations of species based on the total phosphorous content (150 mM for), thanks to the natural abundancy of 31P. At least three independent measurements were performed to obtain kinetics parameters. In the absence of cells, the ATP hydrolysis was found to be negligible in the time course of the reaction.

4.8. Infrared Spectroscopy

IR spectra were acquired with a Thermo Scientific Nicolet iS10 spectrometer equipped with a DTGS detector. The IR spectra were recorded at 20 °C with 64 interferograms at 4 cm−1 resolution each and Fourier transformed. During data acquisition, the spectrometer was continuously purged with dry filtered air (Balston regenerating desiccant dryer, model 75-45 12 VDC). For infrared measurements, an aliquot of 5 µL of reaction medium (Section 4.6) was deposited between two CaF2 windows separated by a 12-μm spacers. It was further sealed in a temperature-controlled (25 °C) flow-through cell (model TFC M13-3 Harrick Scientific Corp.). The phosphate band located at 1080 cm−1 has a molar absorption coefficient of 1215 m−1 cm−1 [41]. At least three independent measurements were performed to calculate the phosphate release rate.

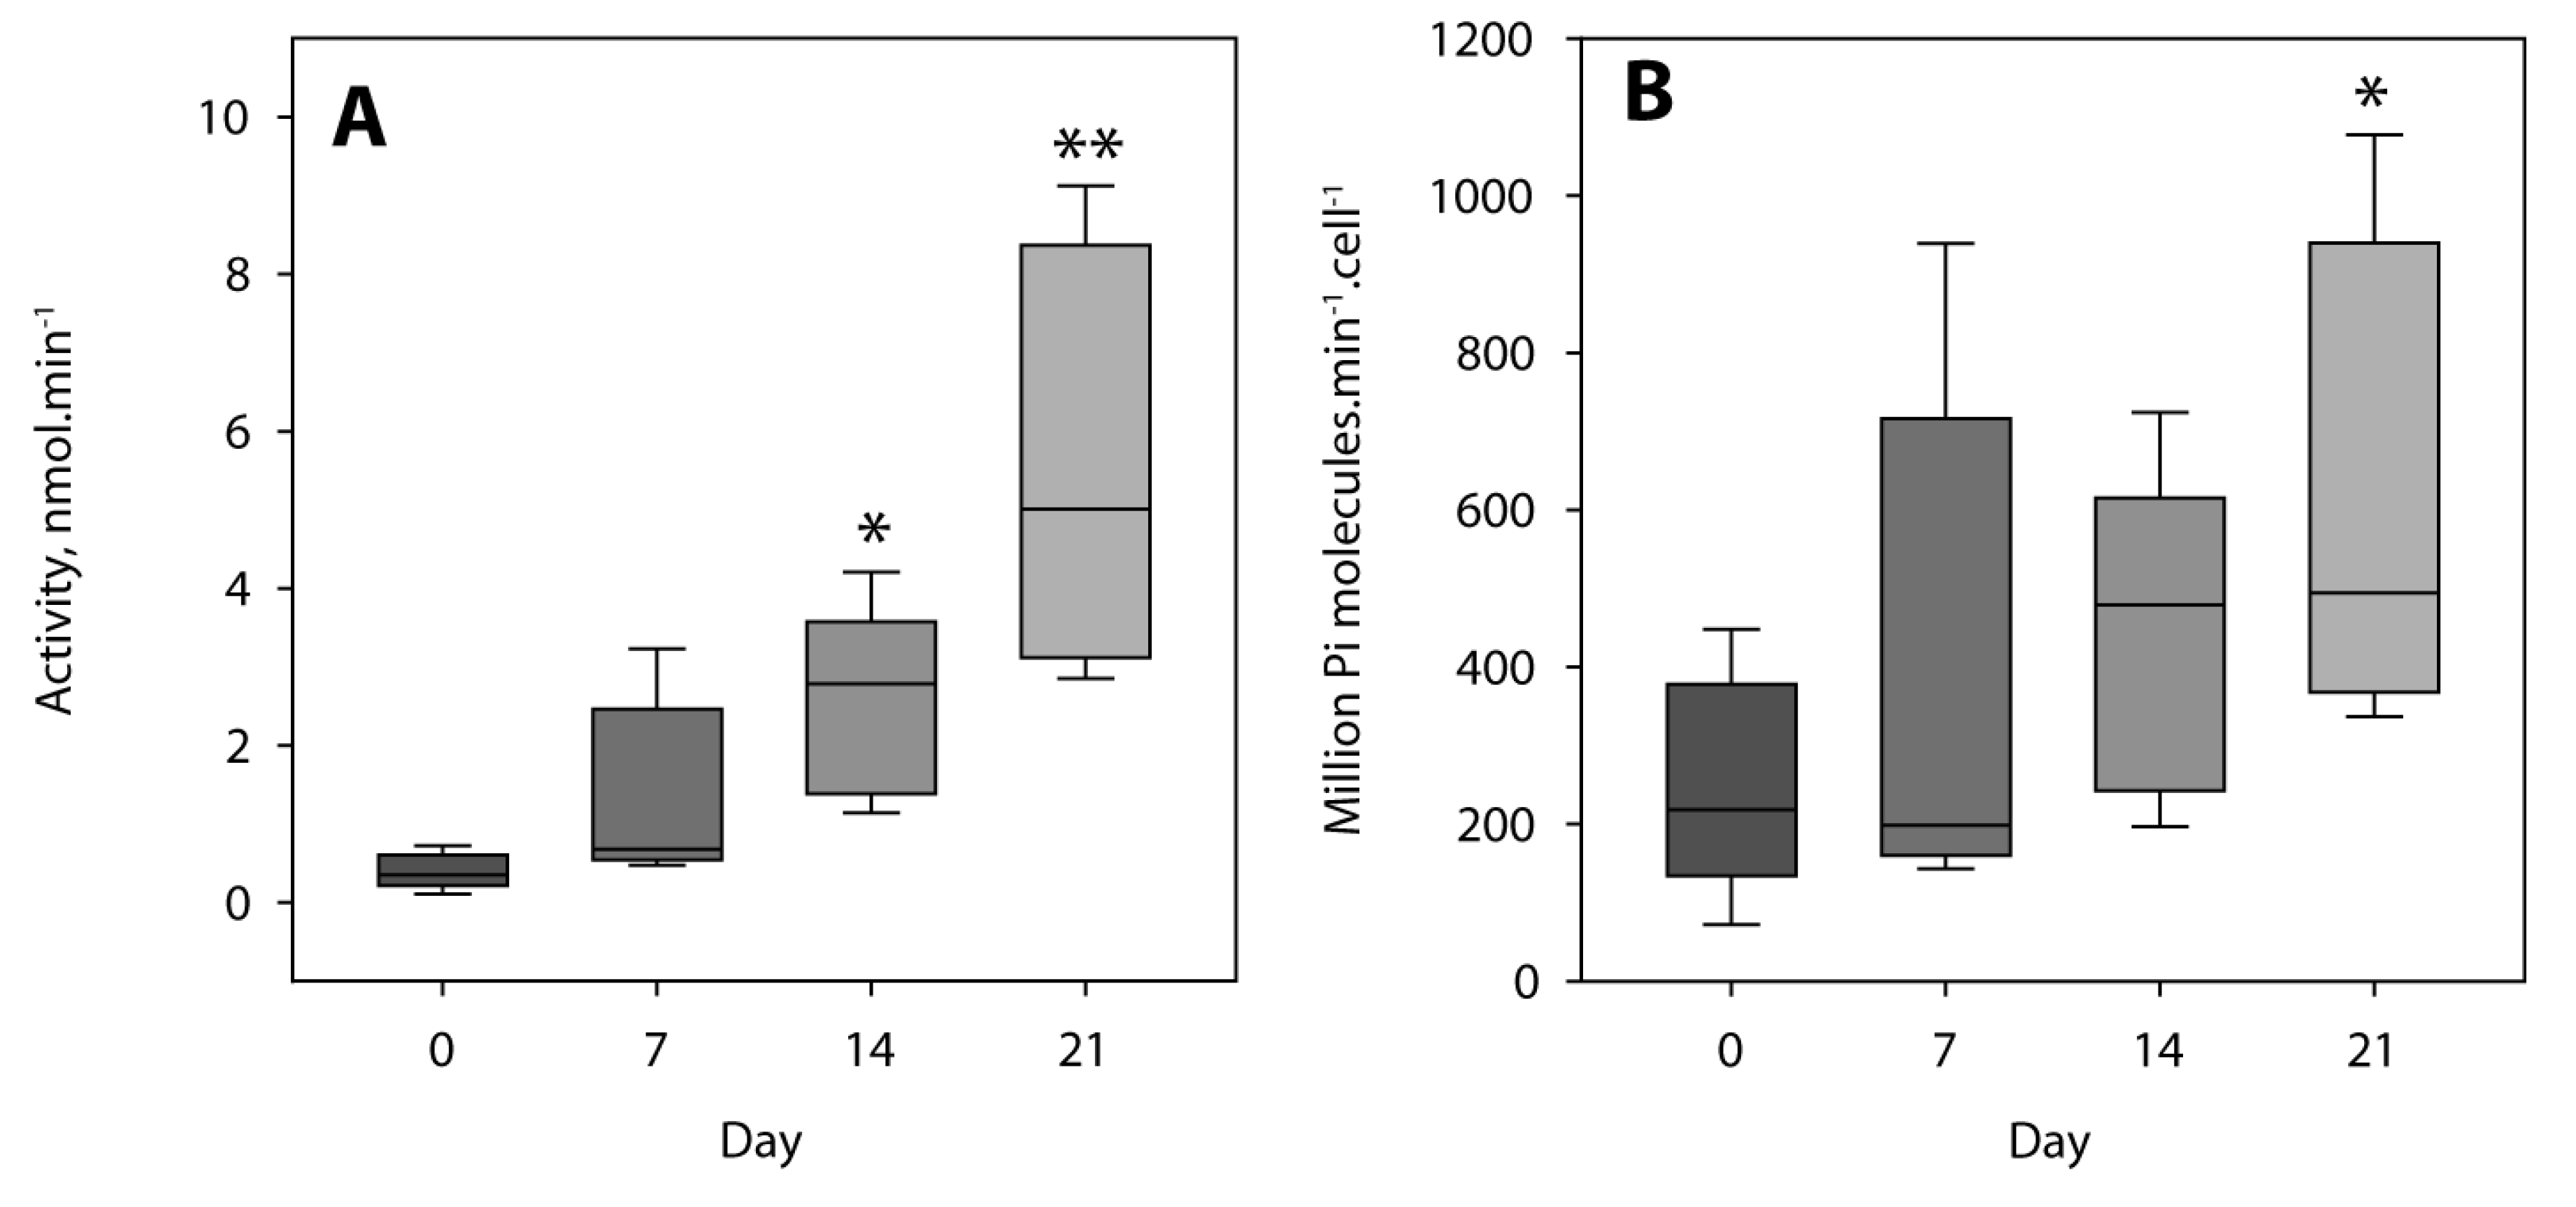
4.9. Kinetics Analysis

The kinetic model of ATP hydrolysis assumes a sequential and irreversible mechanism described by Equations (1)–(3):
T P +   H 2 O k 1   A D P +   P i
A D P +   H 2 O k 2   A M P +   P i
A M P +   H 2 O k 3   A d e n o s i n e +   P i
where k1, k2, and k3 are the corresponding apparent first-order kinetic constants. The theoretical model was curve-fitted using the DYNAFIT software [61], using time-dependent concentrations of nucleotides and phosphate, determined by 31P-NMR and IR. At least three independent measurements were performed to evaluate errors. Assuming that the KM values of the phosphatases for ATP were below the mm range and because the substrate concentration was 50 mM, the rates could be assumed to be close to the Vm values. Therefore, the apparent first-order constants are strictly proportional to the phosphatase concentrations. To determine the ATP hydrolysis rate by the cells, Vm is expressed as nmol.min−1 using apparent first-order constant k1, neglecting variations of ADP and AMP from the 31P-NMR and IR spectra. Protein determination was performed according to Section 4.4.

4.10. Statistical Analysis

For each analysis in Figure 2, at least six independent experiments were performed. Groups were compared using Anova’s one-way test followed by Sidak’s multiple comparison test two-sided NMR (Table 1) and IR (Table 3) data (five independent experiments) were pooled and were subjected to Mann–Whitney test (Figure 5). Results were expressed as mean ± standard error of the mean (SEM). Results were considered significant when p < 0.05 (*), highly significant when p < 0.01 (**), and extremely significant when p < 0.001 (***).

5. Conclusions

The fact that MOVAS generated Pi and not PPi is consistent with a possible molecular mechanism through which high ATP levels released by necrotic cells in atherosclerosis plaques generate Pi, exacerbating plaque calcification.

Supplementary Materials

The following are available online at https://www.mdpi.com/1422-0067/22/6/2948/s1.

Author Contributions

Conceptualization, B.D., D.M., M.F., R.B., S.M. and Y.W.; methodology, B.D., M.F., S.M., R.B. and Y.W.; software, B.D.; validation, B.D., D.M., M.F., S.M., R.B. and Y.W.; formal analysis, B.D., D.M., M.F., S.M., R.B. and Y.W.; investigation, C.T., S.M. and V.R.; resources, B.D., M.F., D.M., R.B. and Y.W.; data curation, B.D., D.M., R.B. and S.M.; writing: original draft preparation, R.B.; writing: review and editing, all authors; visualization, B.D., D.M., M.F., S.M., R.B. and Y.W.; supervision, B.D., D.M., M.F., S.M., R.B. and Y.W.; project administration, R.B. and Y.W.; funding acquisition, D.M., M.F., R.B. and Y.W. All authors have read and agreed to the published version of the manuscript.

Funding

The China-France cooperation project was funded by PHC Cai Yuanpei (Project N° 32065TD).

Institutional Review Board Statement

Not applicable.

Informed Consent Statement

Not applicable.

Data Availability Statement

Not applicable.

Conflicts of Interest

The authors declare no conflict of interest.

Abbreviations

ANKHProgressive ankylosis protein homolog
ADPAdenosine monophosphate
AMPAdenosine diphosphate
ATPAdenosine triphosphate
CD39Ectonucleoside triphoshatediphosphohydrolase
CD73 5′-ectonucleotidase
D0, D7, D14 and D21Incubation time, days 0, 7, 14 and 21
DMEMDulbecco’s Modified Eagle’s Medium rich in glucose (4.5 g.mL−1)
ENPP1Ectonucleotide pyrophosphatase/phosphodiesterase 1
MOVASMurine aortic smooth muscle cell line
PBSPhosphate buffered saline
PFAParaformaldehyde
PiInorganic phosphate
PPiInorganic pyrophosphate;
SEMStandard error of the mean
TNAPTissue non-specific alkaline phosphatase
VSMCsVascular smooth musccle cells

References

  1. Vliegenthart, R.; Oudkerk, M.; Hofman, A.; Oei, H.H.; van Dijck, W.; van Rooij, F.J.; Witteman, J.C. Coronary Calcification Improves Cardiovascular Risk Prediction in the Elderly. Circulation 2005, 112, 572–577. [Google Scholar] [CrossRef] [Green Version]
  2. Dweck, M.R.; Aikawa, E.; Newby, D.E.; Tarkin, J.M.; Rudd, J.H.; Narul, J.; Fayad, Z.A. Noninvasive Molecular Imaging of Disease Activity in Atherosclerosis. Circ. Res. 2016, 119, 330–340. [Google Scholar] [CrossRef] [PubMed] [Green Version]
  3. Sage, A.P.; Tintut, Y.; Demer, L.L. Regulatory Mechanisms in Vascular Calcification. Nat. Rev. Cardiol. 2010, 7, 528–536. [Google Scholar] [CrossRef] [PubMed]
  4. Zhu, D.; Mackenzie, N.C.W.; Farquharson, C.; Macrae, V.E. Mechanisms and Clinical Consequences of Vascular Calcification. Front. Endocrinol. 2012, 3, 95. [Google Scholar] [CrossRef] [Green Version]
  5. Libby, P.; Buring, J.E.; Badimon, L.; Hansson, G.K.; Deanfield, J.; Bittencourt, M.S.; Tokgözoğlu, L.; Lewis, E.F. Atherosclerosis. Nat. Rev. Dis. Primers 2019, 5, 56. [Google Scholar] [CrossRef] [PubMed]
  6. Geovanini, G.R.; Libby, P. Atherosclerosis and Inflammation: Overview and Updates. Clin. Sci. 2018, 132, 1243–1252. [Google Scholar] [CrossRef]
  7. Rattazzi, M.; Bennett, B.J.; Bea, F.; Kirk, E.A.; Ricks, J.L.; Speer, M.; Schwartz, S.M.; Giachelli, C.M.; Rosenfeld, M.E. Calcification of Advanced Atherosclerotic Lesions in the Innominate Arteries of ApoE-deficient Mice: Potential Role of Chondrocyte-like Cells. Arterioscler. Thromb. Vasc. Biol. 2005, 25, 1420–1425. [Google Scholar] [CrossRef] [PubMed] [Green Version]
  8. Durham, A.L.; Speer, M.Y.; Scatena, M.; Giachelli, C.M.; Shanahan, C.M. Role of Smooth Muscle Cells in Vascular Calcification: Implications in Atherosclerosis and Arterial Stiffness. Cardiovasc. Res. 2018, 114, 590–600. [Google Scholar] [CrossRef] [PubMed]
  9. Wolf, M.P.; Hunziker, P. Atherosclerosis: Insights into Vascular Pathobiology and Outlook to Novel Treatments. J. Cardiovasc. Transl. Res. 2020, 13, 744–757. [Google Scholar] [CrossRef]
  10. Shroff, R.; Long, D.A.; Shanahan, C. Mechanistic Insights into Vascular Calcification in CKD. J. Am. Soc. Nephrol. 2013, 24, 179–189. [Google Scholar] [CrossRef]
  11. Reynolds, J.L.; Joannides, A.J.; Skeppe, J.N.; McNair, R.; Schurgers, L.J.; Proudfoot, D.; Jahnen-Dechent, W.; Weissberg, P.L.; Shanahan, C.M. Human Vascular Smooth Muscle Cells Undergo Vesicle-mediated Calcification in Response to Changes in Extracellular Calcium and Phosphate Concentrations: A Potential Mechanism for Accelerated Vascular Calcification in ESRD. J. Am. Soc. Nephrol. 2004, 15, 2857–2867. [Google Scholar] [CrossRef] [Green Version]
  12. Bottini, M.; Mebarek, S.; Anderson, K.L.; Strzelecka-Kiliszek, A.; Bozycki, L.; Simão, A.M.S.; Bolean, M.; Ciancaglini, P.; Pikula, J.B.; Pikula, S.; et al. Matrix Vesicles from Chondrocytes and Osteoblasts: Their Biogenesis, Properties, Functions and Biomimetic Models. Biochim. Biophys. Acta Gen. Subj. 2018, 1862, 532–546. [Google Scholar] [CrossRef]
  13. Buchet, R.; Millán, J.L.; Magne, D. Multisystemic Functions of Alkaline Phosphatases. Methods Mol. Biol. 2013, 1053, 27–51. [Google Scholar] [CrossRef] [PubMed]
  14. Millán, J.L.; Whyte, M.P. Alkaline Phosphatase and Hypophosphatasia. Calcif. Tissue Int. 2016, 98, 398–416. [Google Scholar] [CrossRef] [PubMed] [Green Version]
  15. Zhao, G.; Xu, M.J.; Zhao, M.M.; Dai, X.Y.; Kong, W.; Wilson, G.M.; Guan, Y.; Wang, C.Y.; Wang, X. Activation of Nuclear Factor-kappa B Accelerates Vascular Calcification by Inhibiting Ankylosis Protein Homolog Expression. Kidney Int. 2012, 82, 34–44. [Google Scholar] [CrossRef] [PubMed] [Green Version]
  16. Albright, R.A.; Stabach, P.; Cao, W.; Kavanagh, D.; Mullen, I.; Braddock, A.A.; Covo, M.S.; Tehan, M.; Yang, G.; Cheng, Z.; et al. ENPP1-Fc Prevents Mortality and Vascular Calcifications in Rodent Model of Generalized Arterial Calcification of Infancy. Nat. Commun. 2015, 6, 10006. [Google Scholar] [CrossRef]
  17. Lomashvili, K.A.; Narisawa, S.; Millán, J.L.; O’Neill, W.C. Vascular Calcification is Dependent on Plasma Levels of Pyrophosphate. Kidney Int. 2014, 85, 1351–1356. [Google Scholar] [CrossRef] [PubMed] [Green Version]
  18. Garimella, R.; Bi, X.; Anderson, H.C.; Camacho, N.P. Nature of Phosphate Substrate as a Major Determinant of Mineral Type Formed in Matrix Vesicle-mediated in vitro Mineralization: An FTIR Imaging Study. Bone 2006, 38, 811–817. [Google Scholar] [CrossRef] [PubMed]
  19. Thouverey, C.; Bechkoff, G.; Pikula, S.; Buchet, R. Inorganic Pyrophosphate as a Regulator of Hydroxyapatite or Calcium Pyrophosphate Dihydrate Mineral Deposition by Matrix Vesicles. Osteoarthr. Cartil. 2009, 17, 64–72. [Google Scholar] [CrossRef] [PubMed] [Green Version]
  20. Li, L.; Buchet, R.; Wu, Y. Dimethyl Sulfoxide-induced Hydroxyapatite Formation: A Biological Model of Matrix Vesicle Nucleation to Screen Inhibitors of Mineralization. Anal. Biochem. 2008, 381, 123–128. [Google Scholar] [CrossRef] [PubMed]
  21. Dahl, R.; Sergienko, E.A.; Su, Y.; Mostofi, Y.S.; Yang, L.; Simao, A.M.; Narisawa, S.; Brown, B.; Mangravita-Novo, A.; Vicchiarelli, M.; et al. Discovery and Validation of a Series of Aryl Sulfonamides as Selective Inhibitors of Tissue-nonspecific Alkaline Phosphatase (TNAP). J. Med. Chem. 2009, 52, 6919–6925. [Google Scholar] [CrossRef] [Green Version]
  22. Bakker, W.W.; Donker, R.B.; Timmer, A.; van Pampus, M.G.; van Son, W.J.; Aarnoudse, J.G.; van Goor, H.; Niezen-Koning, K.E.; Navis, G.; Borghuis, T.; et al. Plasma Hemopexin Activity in Pregnancy and Preeclampsia. Hypertens. Pregnancy 2007, 26, 227–239. [Google Scholar] [CrossRef] [PubMed]
  23. Ryan, L.M.; Rachow, J.W.; McCarty, B.A.; McCarty, D.J. Adenosine Triphosphate Levels in Human Plasma. J. Rheumatol. 1996, 23, 214–219. [Google Scholar] [PubMed]
  24. Jalkanen, J.; Yegutkin, G.G.; Hollmén, M.; Aalto, K.; Kiviniemi, T.; Salomaa, V.; Jalkanen, S.; Hakovirta, H. Aberrant Circulating Levels of Purinergic Signaling Markers are Associated with Several Key Aspects of Peripheral Atherosclerosis and Thrombosis. Circ. Res. 2015, 116, 1206–1215. [Google Scholar] [CrossRef] [PubMed] [Green Version]
  25. McDonald, B.; Pittman, K.; Menezes, G.B.; Hirota, S.A.; Slaba, I.; Waterhouse, C.C.M.; Beck, P.L.; Muruve, D.A.; Kubes, P. Intravascular Danger Signals Guide Neutrophils to Sites of Sterile Inflammation. Science 2010, 330, 362–366. [Google Scholar] [CrossRef] [PubMed]
  26. Gallucci, S.; Matzinger, P. Danger Signals: SOS to the Immune System. Curr. Opin. Immunol. 2001, 13, 114–119. [Google Scholar] [CrossRef]
  27. Lazarowski, E.R. Vesicular and Conductive Mechanisms of Nucleotide Release. Purinergic Signal 2012, 8, 359–373. [Google Scholar] [CrossRef] [Green Version]
  28. Faas, M.M.; Sáez, T.; de Vos, P. Extracellular ATP and Adenosine: The Yin and Yang in Immune Responses? Mol. Aspects Med. 2017, 55, 9–19, Erratum in Corrigendum to “Extracellular ATP and Adenosine: The Yin and Yang in Immune Responses?” Mol. Aspects Med. 2017, 57, 30, doi:10.1016/j.mam.2017.08.003. [Google Scholar] [CrossRef]
  29. Idzko, M.; Ferrari, D.; Eltzschig, H.K. Nucleotide Signalling During Inflammation. Nature 2015, 509, 310–317. [Google Scholar] [CrossRef] [Green Version]
  30. Ferney, H.N. Mammalian Alkaline Phosphatases. In The Enzymes, 3rd ed.; Boyer, A., Ed.; Academic Press: New York, NY, USA, 1971; Volume 4, pp. 417–447. [Google Scholar]
  31. Yegutkin, G.G. Nucleotide- and Nucleoside-converting Ectoenzymes: Important Modulators of Purinergic Signalling Cascade. Biochim. Biophys. Acta 2008, 178, 673–694. [Google Scholar] [CrossRef] [Green Version]
  32. Prosdocimo, D.A.; Douglas, D.C.; Romani, A.M.; O’Neill, W.C.; Dubyak, G.R. Autocrine ATP Release Coupled to Extracellular Pyrophosphate Accumulation in Vascular Smooth Muscle Cells. Am. J. Physiol. Cell. Physiol. 2009, 296, C828–C839. [Google Scholar] [CrossRef] [PubMed] [Green Version]
  33. Prosdocimo, D.A.; Wyler, S.C.; Romani, A.M.; O’Neill, W.C.; Dubyak, G.R. Regulation of Vascular Smooth Muscle Cell Calcification by Extracellular Pyrophosphate Homeostasis: Synergistic Modulation by Cyclic AMP and Hyperphosphatemia. Am. J. Physiol. Cell. Physiol. 2010, 298, C702–C713. [Google Scholar] [CrossRef] [Green Version]
  34. Villa-Bellosta, R.; Wang, X.; Millán, J.L.; Dubyak, G.R.; O’Neill, W.C. Extracellular Pyrophosphate Metabolism and Calcification in Vascular Smooth Muscle. Am. J. Physiol. Heart Circ. Physiol. 2011, 301, H61–H68. [Google Scholar] [CrossRef] [PubMed]
  35. Mackenzie, N.C.W.; Zhu, D.; Longley, L.; Patterson, C.S.; Kommareddy, S.; MacRae, V.E. MOVAS-1 Cell Line: A New in vitro Model of Vascular Calcification. Int. J. Mol. Med. 2011, 27, 663–668. [Google Scholar] [CrossRef] [PubMed] [Green Version]
  36. Bessueille, L.; Fakhry, M.; Hamade, E.; Badran, B.; Magne, D. Glucose Stimulates Chondrocyte Differentiation of Vascular Smooth Muscle Cells and Calcification: A Possible Role for IL-1β. FEBS Lett. 2015, 589, 2797–2804. [Google Scholar] [CrossRef] [PubMed]
  37. Skafi, N.; Abdallah, D.; Soulage, C.; Reibel, S.; Vitale, N.; Hamade, E.; Faour, W.; Magne, D.; Badran, B.; Hussein, N.; et al. Phospholipase D: A New Mediator During High Phosphate-induced Vascular Calcification Associated with Chronic Kidney Disease. J. Cell Physiol. 2019, 234, 4825–4839. [Google Scholar] [CrossRef]
  38. Nikolaev, Y.; Ripin, N.; Soste, M.; Picotti, P.; Iber, D.; Allain, F.H. Systems NMR: Single-sample Quantification of RNA, Proteins and Metabolites for Biomolecular Network Analysis. Nat. Methods 2019, 16, 743–749. [Google Scholar] [CrossRef]
  39. Liu, M.; Karjalainen, E.L.; Barth, A. Use of Helper Enzymes for ADP Removal in Infrared Spectroscopic Experiments: Application to Ca2+-ATPase. Biophys. J. 2005, 88, 3615–3624. [Google Scholar] [CrossRef] [Green Version]
  40. Liu, M.; Krasteva, M.; Barth, A. Interactions of Phosphate Groups of ATP and Aspartyl Phosphate with the Sarcoplasmic Reticulum Ca2+-ATPase: An FTIR Study. Biophys. J. 2005, 89, 4352–4363. [Google Scholar] [CrossRef] [Green Version]
  41. Ren, Z.; le Do, D.; Bechkoff, G.; Mebarek, S.; Keloglu, N.; Ahamada, S.; Meena, S.; Magne, D.; Pikula, S.; Wu, Y.; et al. Direct Determination of Phosphatase Activity from Physiological Substrates in cells. PLoS ONE 2015, 10, e0120087. [Google Scholar] [CrossRef] [Green Version]
  42. Fakhry, M.; Roszkowska, M.; Briolay, A.; Bougault, C.; Guignandon, A.; Diaz-Hernandez, J.I.; Diaz-Hernandez, M.; Pikula, S.; Buchet, R.; Hamade, E.; et al. TNAP Stimulates Vascular Smooth Muscle Cell Trans-differentiation into Chondrocytes Through Calcium Deposition and BMP-2 Activation: Possible Implication in Atherosclerotic Plaque Stability. Biochim. Biophys. Acta Mol. Basis. Dis. 2017, 1863, 643–653. [Google Scholar] [CrossRef] [PubMed]
  43. Bobryshev, Y.V.; Orekhov, A.N.; Sobenin, I.; Chistiakov, D.A. Role of Bone-type Tissue-nonspecific Alkaline Phosphatase and PHOSPO1 in Vascular Calcification. Curr. Pharm. Des. 2014, 20, 5821–5828. [Google Scholar] [CrossRef]
  44. Lazarowski, E.R.; Sesma, J.I.; Seminario-Vidal, L.; Kreda, S.M. Molecular Mechanisms of Purine and Pyrimidine Nucleotide Release. Adv. Pharmacol. 2011, 61, 221–261. [Google Scholar] [CrossRef] [PubMed]
  45. Azpiazu, D.; González-Parra, E.; Egido, J.; Villa-Bellosta, R. Hydrolysis of Extracellular Pyrophosphate Increases in Post-hemodialysis Plasma. Sci. Rep. 2018, 8, 11089. [Google Scholar] [CrossRef]
  46. Danino, O.; Svetitsky, S.; Kenigsberg, S.; Levin, A.; Journo, S.; Gold, A.; Drexler, M.; Snir, N.; Elkayam, O.; Fischer, B.; et al. Inhibition of nucleotide pyrophosphatase/phosphodiesterase 1: Implications for developing a calcium pyrophosphate deposition disease modifying drug. Rheumatology (Oxford) 2018, 57, 1472–1480. [Google Scholar] [CrossRef] [PubMed] [Green Version]
  47. Orriss, I.R.; Arnett, T.R.; Russell, R.G. Pyrophosphate: A Key Inhibitor of Mineralisation. Curr. Opin. Pharmacol. 2016, 28, 57–68. [Google Scholar] [CrossRef] [Green Version]
  48. Ciancaglini, P.; Yadav, M.; Simao, A.M.; Narisawa, S.; Pizauro, J.M.; Farquharson, C.; Hoylaerts, M.F.; Millán, J.L. Kinetic Analysis of Substrate Utilization by Native and TNAP-, NPP1-, or PHOSPHO1-deficient Matrix Vesicles. J. Bone Miner. Res. 2010, 25, 716–723. [Google Scholar] [CrossRef] [PubMed]
  49. Lazarowsk, E.R.; Boucher, R.C.; Harden, T.K. Constitutive Release of ATP and Evidence for Major Contribution of Ecto-nucleotide Pyrophosphatase and Nucleoside Diphosphokinase to Extracellular Nucleotide Concentrations. J. Biol. Chem. 2000, 275, 31061–31068. [Google Scholar] [CrossRef] [PubMed] [Green Version]
  50. Villa-Bellosta, R. ATP-based Therapy Prevents Vascular Calcification and Extends Longevity in a Mouse Model of Htichinson-Gilford Progeria Syndrome. Proc. Natl. Acad. Sci. USA 2019, 116, 23698–23704. [Google Scholar] [CrossRef]
  51. Okada, S.F.; Nicholas, R.A.; Kreda, S.M.; Lazarowski, E.R.; Boucher, R.C. Physiological Regulation of ATP Release at the Apical Surface of Human Airway Epithelia. J. Biol. Chem. 2006, 281, 22992–23002. [Google Scholar] [CrossRef] [PubMed] [Green Version]
  52. Allard, B.; Longhi, M.S.; Robson, S.C.; Stagg, J. The Ectonucleotidases CD39 and CD73: Novel Checkpoint Inhibitor Targets. Immunol. Rev. 2017, 276, 121–144. [Google Scholar] [CrossRef] [Green Version]
  53. Montalbetti, N.; Leal Denis, M.F.; Pignataro, O.P.; Kobatake, E.; Lazarowski, E.R.; Schwarzbaum, P.J. Homeostasis of Extracellular ATP in Human Erythrocytes. J. Biol. Chem. 2011, 286, 38397–38407. [Google Scholar] [CrossRef] [PubMed] [Green Version]
  54. Patel, J.J.; Zhu, D.; Opdebeeck, B.; D’Haese, P.; Millán, J.L.; Bourne, L.E.; Wheeler-Jones, C.P.D.; Arnett, T.R.; MacRae, V.E.; Orriss, I.R. Inhibition of Arterial Medial Calcification and Bone Mineralization by Extracellular Nucleotides: The Same Functional Effect Mediated by Different Cellular Mechanisms. J. Cell Physiol. 2018, 233, 3230–3243. [Google Scholar] [CrossRef] [PubMed]
  55. Brisevac, D.; Adzic, M.; Laketa, D.; Parabucki, A.; Milosevic, M.; Lavrnja, I.; Bjelobaba, I.; Sévigny, J.; Kipp, M.; Nedeljkovic, N. Extracellular ATP Selectively Upregulates Ecto-Nucleoside Triphosphate Diphosphohydrolase 2 and Ecto-5’-Nucleotidase by Rat Cortical Astrocytes In Vitro. J. Mol. Neurosci. 2015, 57, 452–462. [Google Scholar] [CrossRef]
  56. Azpiazu, D.; Gonzalo, S.; Villa-Bellosta, R. Tissue Non-Specific Alkaline Phosphatase and Vascular Calcification: A Potential Therapeutic Target. Curr. Cardiol. Rev. 2019, 5, 91–95. [Google Scholar] [CrossRef] [PubMed]
  57. Villa-Bellosta, R. New Insights into Endogenous Mechanisms of Protection Against Arterial Calcification. Atherosclerosis 2020, 306, 68–74. [Google Scholar] [CrossRef] [PubMed] [Green Version]
  58. Sheen, C.R.; Kuss, P.; Narisawa, S.; Yadav, M.C.; Nigro, J.; Wang, W.; Chhea, T.N.; Sergienko, E.A.; Kapoor, K.; Jackson, M.R.; et al. Pathophysiological Role of Vascular Smooth Muscle Alkaline Phosphatase in Medial Artery Calcification. J. Bone Miner. Res. 2015, 30, 824–836. [Google Scholar] [CrossRef] [Green Version]
  59. Haarhaus, M.; Brandenburg, V.; Kalantar-Zadeh, L.; Stenvinkel, P.; Magnusson, P. Alkaline Phosphatase: A Novel Treatment Target for Cardiovascular Disease in CKD. Nat. Rev. Nephrol. 2017, 13, 429–442. [Google Scholar] [CrossRef]
  60. Cyboron, G.W.; Wuthier, R.E. Purification and Initial Characterization of Intrinsic Membrane-bound Alkaline Phosphatase from Chicken Epiphyseal Cartilage. J. Biol. Chem. 1981, 256, 7262–7268. [Google Scholar] [CrossRef]
  61. Kuzmič, P. Program DYNAFIT for the Analysis of Enzyme Kinetic Data: Application to HIV Proteinase. Anal. Biochem. 1996, 237, 260–273. [Google Scholar] [CrossRef] [PubMed]
Figure 1. Extracellular adenosine triphosphate (ATP) is hydrolyzed by ectonucleotide pyrophosphatase phosphodiesterase (ENPP1) to form PPi and adenosine monophosphate (AMP). AMP is further hydrolyzed by CD73 or tissue non-specific alkaline phosphatase (TNAP) to form adenosine and Pi. ATP and adenosine diphosphate (ADP) can also be hydrolyzed by TNAP, CD39 (ENTPD1), or other types of ectonucleoside triphoshatediphosphohydrolases. The hydrolysis of PPi, which forms two Pi, is mainly catalyzed by TNAP. ATP can be transported from intracellular to extracellular media via connexin, pannexin, or ATP anion channels, while PPi is transported via progressive ankylosis protein homolog (ANKH). Eventually, large quantities of nucleotides are also released from necrotic cells.
Ijms 22 02948 g001
Figure 2. Characterization of the murine aortic smooth muscle cell line (MOVAS) during the transdifferentiation in osteogenic medium containing 50 µg.mL−1 of ascorbic acid and 10 mM of β-glycerophosphate. (A) Relative amount of calcium expressed as µg calcium per µg protein in calcium phosphate precipitates induced by MOVAS cells at the indicated incubation time in osteogenic medium (n = 6). (B) Tissue non-specific alkaline phosphatase activity in MOVAS cells at the indicated incubation time in osteogenic medium (n = 6). Results were considered highly significant when p < 0.01 (**), and extremely significant when p < 0.001 (***).
Ijms 22 02948 g002
Figure 3. Hydrolysis of extracellular ATP by MOVAS cells incubated for 21 days in osteogenic medium. Thereafter, cells were washed, fixed, and incubated in Tris buffer at the indicated times of 0, 24, 48, 72, and 96 h in active medium containing 50 mM ATP. Then, 5 mM levamisole was added into the medium to inhibit TNAP. The absence of PPi (no peak at −7.45 ppm) indicated that ATP hydrolysis by MOVAS cells was sequential and formed ADP and AMP.
Ijms 22 02948 g003
Figure 4. IR spectra of extracellular medium containing 50 mM ATP extracted from MOVAS after 14 days of incubation in osteogenic medium. (A) IR spectra obtained after 3 h (green) and 48 h (black) of ATP hydrolysis by extracellular phosphatases. (B) Successive IR difference spectra. ATP hydrolysis was monitored at the indicated incubation time. Dark gray: 5 h minus 3 h, medium gray: 24 h minus 3 h, light gray: 48 h minus 3 h.
Ijms 22 02948 g004
Figure 5. ATP hydrolysis by MOVAS cells expressed as (A) nmol min−1 and (B) as million Pi molecules min−1 cell−1 as determined by NMR (Table 1) and from IR (Table 3) (n = 5). Results were considered significant when p < 0.05 (*), and highly significant when p < 0.01 (**).
Ijms 22 02948 g005
Figure 6. IR difference spectra of 50 mM of the nucleotides and of the extracellular medium containing 50 mM ATP extracted from MOVAS after 14 days of incubation in osteogenic medium. Orange: IR difference spectrum Pi minus AMP; violet: IR difference spectrum AMP + Pi minus ADP; blue: IR difference spectrum ADP + Pi minus ATP; Full black line: IR difference spectrum at 48 h minus 3 h; dashed black line: best fit; Full green line: IR difference spectrum at 24 h minus 3 h; dashed green line: best fit.
Ijms 22 02948 g006
Table 1. Kinetic constants of extracellular ATP hydrolysis by MOVAS cells in the absence of levamisole on days 0, 7, 14, and 21 corresponding to the best fits (Figure S1).
Dayk1 (10−3 h−1)k2 (10−3 h−1)Activity (nmol ATP min−1)Activity (Million ATP cell−1 min−1)
00.27 ± 0.0700.11 ± 0.0372 ± 19
71.14 ± 0.200.48 ± 0.08143 ± 25
143.89 ± 0.21 ± 11.62 ± 0.08288 ± 15
2110.35 ± 0.46.1 ± 0.94.31 ± 0.17526 ± 20
Table 2. Kinetic constants of extracellular ATP hydrolysis by MOVAS cells on days 0, 7, 14, and 21 corresponding to the best fits (Figure S1). After 0, 7, 14, and 21 days, 5 mM of levamisole was added just before the enzymatic assay.
Dayk1 (10−3 h−1)k2 (10−3 h−1)Activity (nmol ATP min−1)Activity (Million ATP cell−1 min−1)
00000
70000
141.85 ± 0.200.77 ± 0.08137 ± 15
213.11 ± 0.31.1 ± 1.61.30 ± 0.13158 ± 15
Table 3. Kinetic constants of ATP hydrolysis by MOVAS cells on days 0, 7, 14, and 21, determined from the IR spectra. ATP hydrolysis was induced by all ectoenzymes of MOVAS cells, including TNAP.
DayActivity (nmol min−1)Activity (Million ATP per cell min−1)
00.5 ± 0.1292 ± 57
71.6 ± 0.6452 ± 177
142.8 ± 0.6476 ± 108
216.0 ± 1.7625 ± 198
Publisher’s Note: MDPI stays neutral with regard to jurisdictional claims in published maps and institutional affiliations.

