Article

Systematic Approach to Find the Global Minimum of Relaxation Dispersion Data for Protein-Induced B–Z Transition of DNA

1
Department of Chemistry and RINS, Gyeongsang National University, Gyeongnam 52828, Korea
2
Division of Magnetic Resonance, Korea Basic Science Institute, Ochang, Chungbuk 28119, Korea
3
Center for Research Equipment, Korea Basic Science Institute, Ochang, Chungbuk 28119, Korea
*
Author to whom correspondence should be addressed.
Int. J. Mol. Sci. 2021, 22(7), 3517; https://doi.org/10.3390/ijms22073517
Submission received: 26 February 2021 / Revised: 21 March 2021 / Accepted: 24 March 2021 / Published: 29 March 2021

Abstract

:
Carr–Purcell–Meiboom–Gill (CPMG) relaxation dispersion spectroscopy is commonly used for quantifying conformational changes of protein in μs-to-ms timescale transitions. To elucidate the dynamics and mechanism of protein binding, parameters implementing CPMG relaxation dispersion results must be appropriately determined. Building an analytical model for multi-state transitions is particularly complex. In this study, we developed a new global search algorithm that incorporates a random search approach combined with a field-dependent global parameterization method. The robust inter-dependence of the parameters carrying out the global search for individual residues (GSIR) or the global search for total residues (GSTR) provides information on the global minimum of the conformational transition process of the Zα domain of human ADAR1 (hZαADAR1)–DNA complex. The global search results indicated that a α-helical segment of hZαADAR1 provided the main contribution to the three-state conformational changes of a hZαADAR1—DNA complex with a slow B–Z exchange process. The two global exchange rate constants, kex and kZB, were found to be 844 and 9.8 s−1, respectively, in agreement with two regimes of residue-dependent chemical shift differences—the “dominant oscillatory regime” and “semi-oscillatory regime”. We anticipate that our global search approach will lead to the development of quantification methods for conformational changes not only in Z-DNA binding protein (ZBP) binding interactions but also in various protein binding processes.

1. Introduction

Molecular motions play important roles in biological processes; however, their complexity makes the accurate identification of motions difficult. NMR spectroscopy is a powerful tool that had been used to characterize these motions according to the chemical exchanges and kinetic processes of molecules [1,2,3]. In particular, Carr–Purcell–Meiboom–Gill (CPMG) relaxation dispersion (RD) experiments can be used to provide information on protein folding and binding events, with protein motions reported in an ms-to-μs timescale [4,5,6,7,8].
The first step of CPMG analysis is the establishment of an appropriate model to determine the exchange process. The two-state exchange process is a simple kinetic model that has been widely used to understand molecular motions, such as enzyme catalysis, protein folding, molecular recognition, and allostery, using CPMG RD analysis [1,9,10,11,12]. Despite the fact that multi-state conformational exchanges including three-state transitions have also been studied using CPMG RD [13,14,15,16,17], elucidating the dynamics of more complicated motions of multi-state exchange processes with high accuracy remains challenging.
Here, we provide a systematic procedure to obtain accurate dynamics parameters and chemical shifts from CPMG-based experimental data. Our approach is to generate an array of parameters using a random search method combined with various constraints. The R2 profiles are numerically computed by a three-state conformational transition model that includes fast and slow processes. In the proposed rationalization strategy and hierarchical steps, we provide a set of parameters for finding the exact global minimum according to the constraints. In principle, the parameterization is the direct mapping of multi-state transitional variables in the pseudo-three state transition model using spatial combinations to find the minimum χ2 value.
We applied this novel approach to identify the protein-induced B–Z conformational transition of DNA in a Z-DNA binding protein (ZBP) and DNA complex [18,19,20,21,22]. A left-handed helical Z-DNA structure can form from ZBPs, including human double-stranded (ds) RNA-specific adenosine deaminase I (ADAR1) [23,24], the DNA-dependent activator of IFN-regulatory factor (DAI, also known as DLM-1, ZBP1) [25,26], poxviral E3L protein [27,28], and RNA-dependent protein kinase (PKZ) [29]. In general, the intermolecular interactions of ZBPs and Z-DNA are mediated by residues in the third helix and the β-hairpin region [13,22,30]. Structural studies of the Zα domain of human ADAR1 (hZαADAR1) and a nucleic acid complex have shown protein-induced B–Z or A–Z transitions of DNA or RNA, respectively [22,31]. More recently, it has been reported by imino proton and heteronuclear single quantum correlation (HSQC) titrations that the rate of the A–Z RNA transition is 30-times slower than the B–Z structural transition of DNA induced by hZαADAR1 [13]. Therefore, the proposed multi-state conformational changes of hZαADAR1 and DNA complex indicate that the model is suitable to determine R2 profiles based on multi-magnetic field CPMG profiles. The suggested conformational transitions are described in Figure 1.

2. Results

The dynamic motion of hZαADAR1 induced by conformational transitions on a ms-to-μs timescale was investigated by modeling using the site-specific CPMG RD profiles. We used a hierarchical approach to characterize the quantitative kinetic and chemical shift parameters undergoing the three-state conformational transition: (i) Residues representing the three-state conformational exchanges were determined by error of fitting using the two-state model; (ii) the residue dependent R2 profiles were numerically computed by random parameters constrained by chemical shift values considering two different magnetic fields; and (iii) re-constrained kinetic and chemical shifts parameters were applied to characterize the global conformational transition through the entire backbone of hZαADAR1.

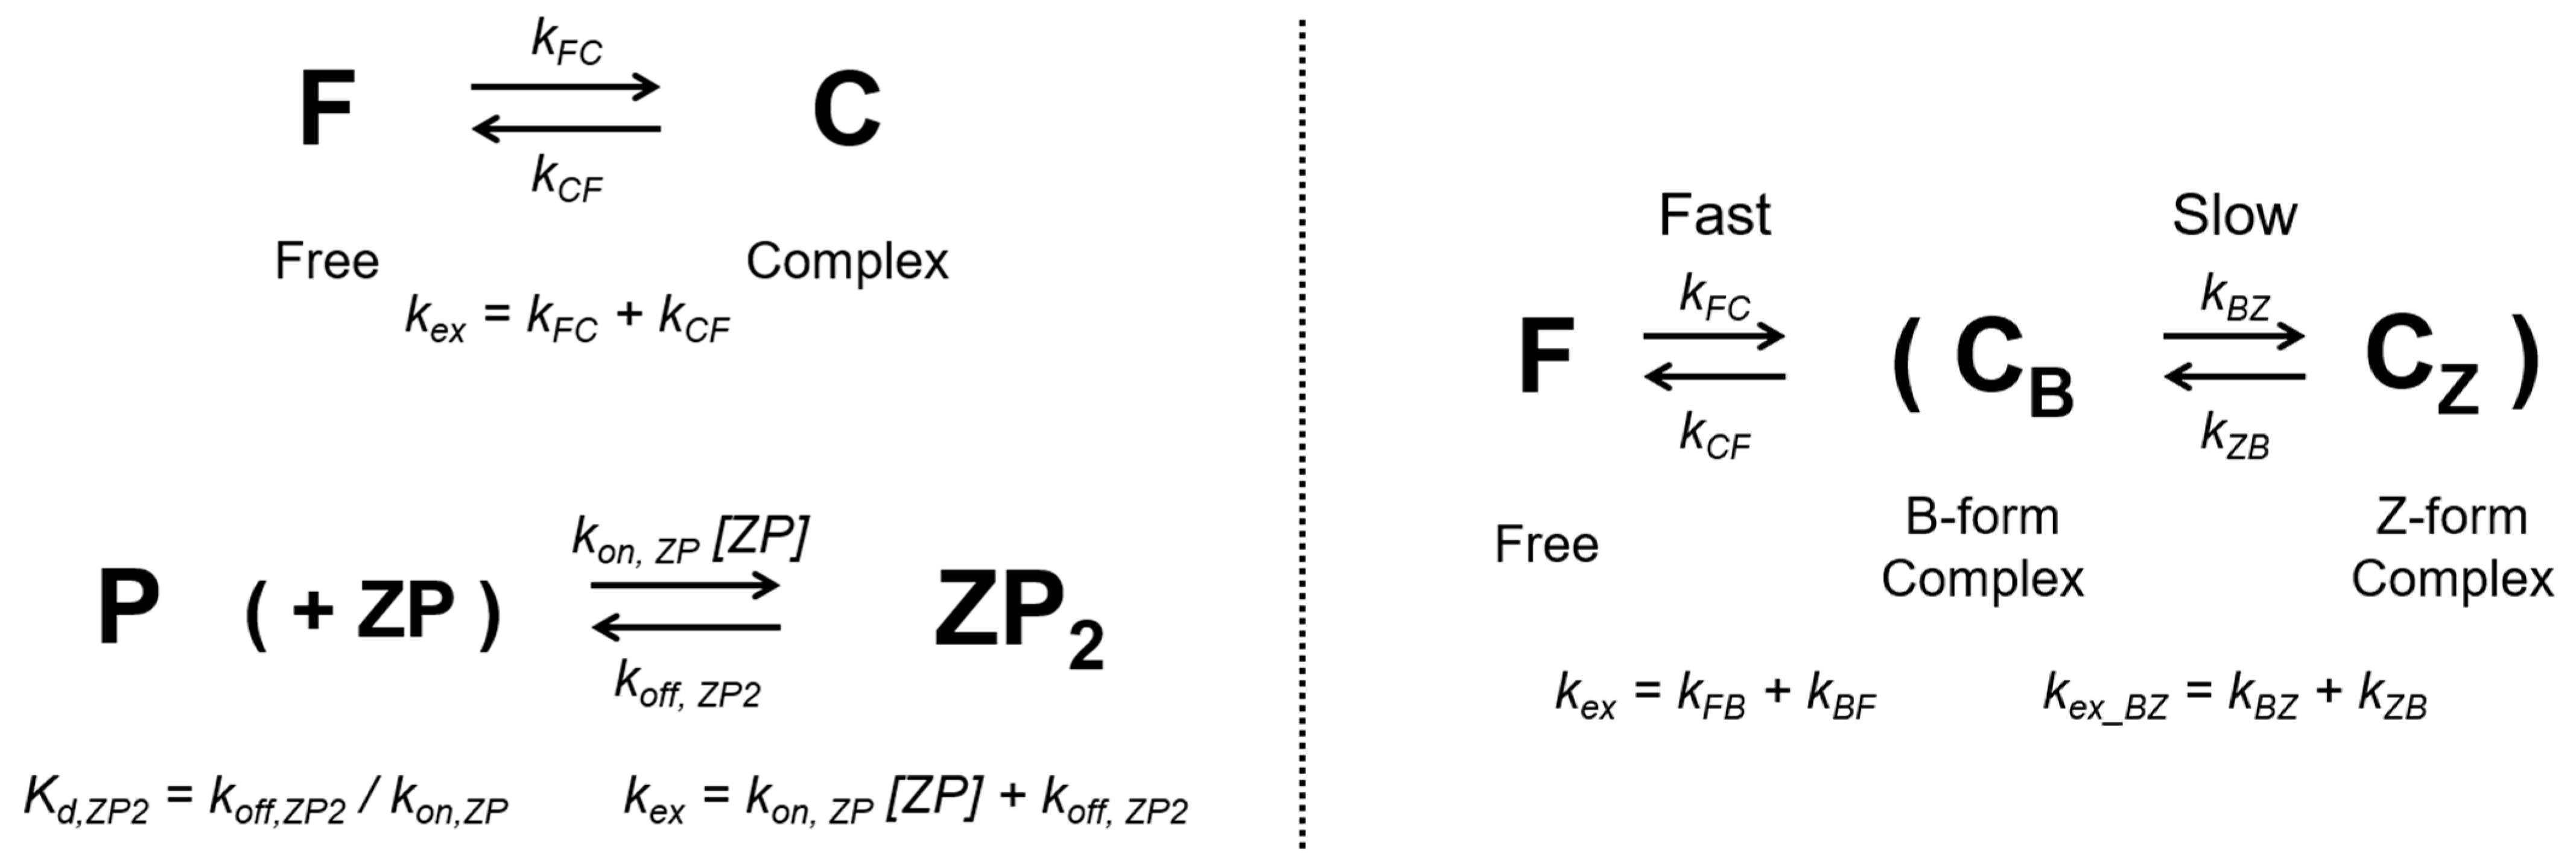
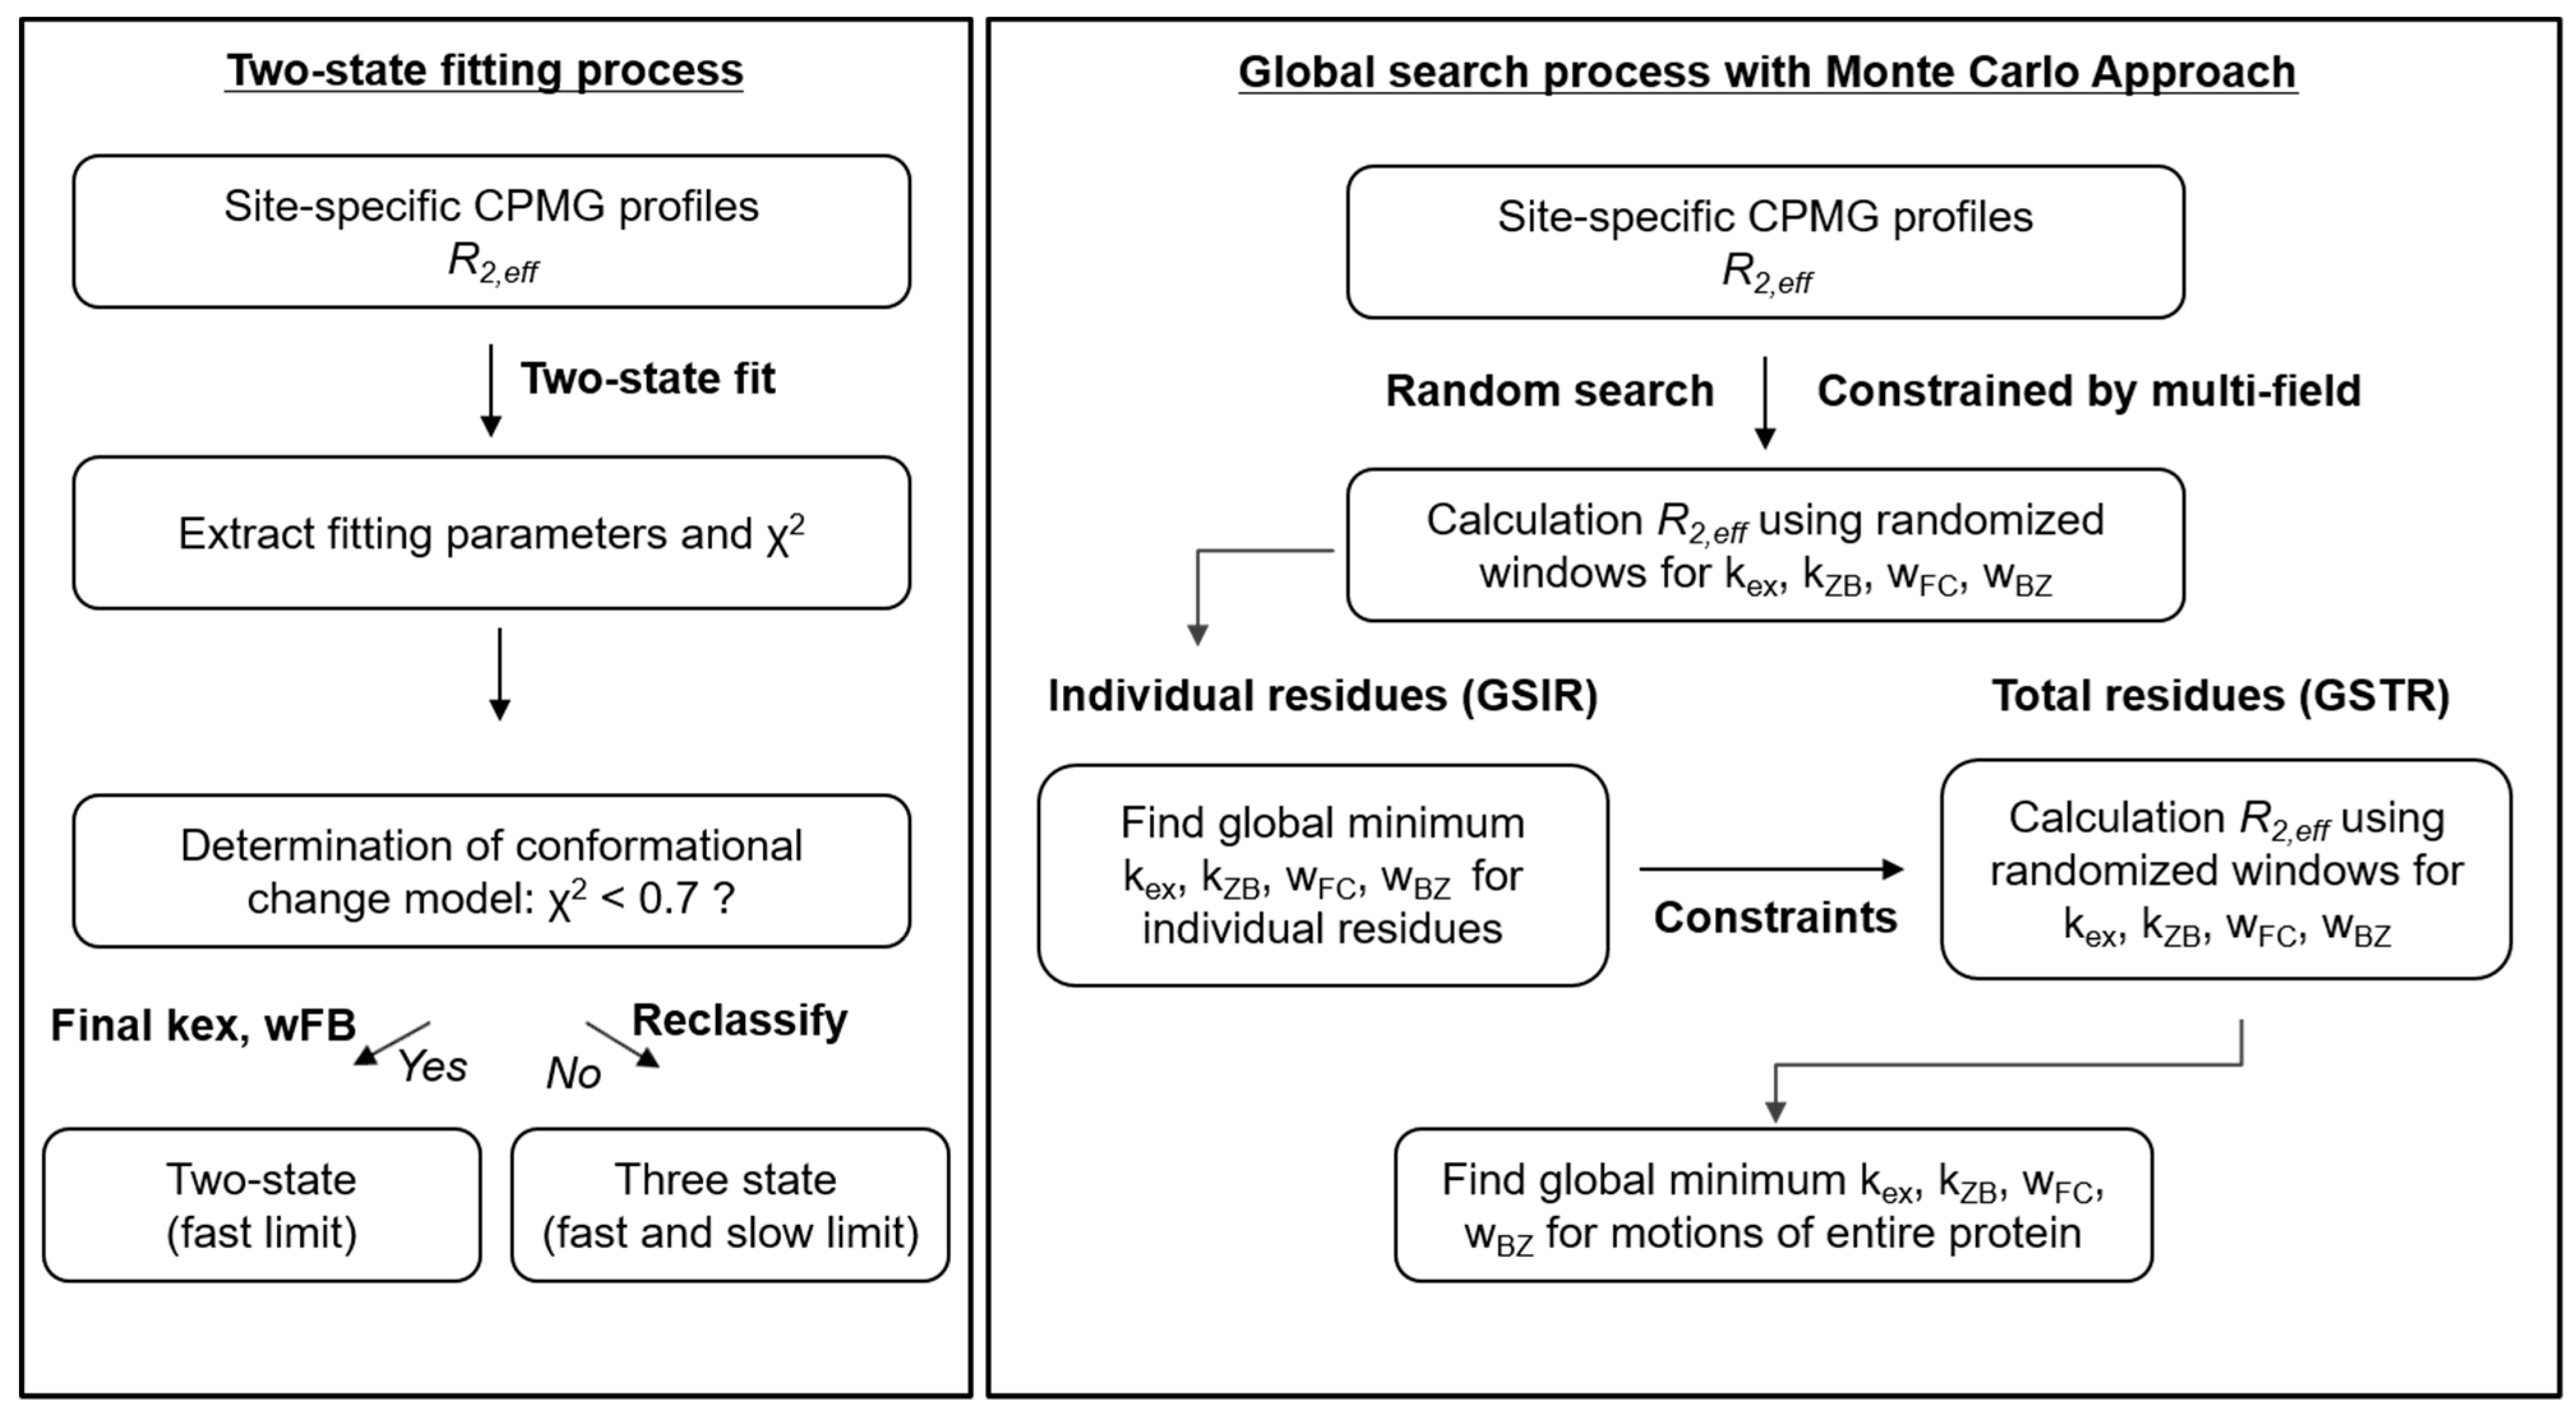
2.1. Classification of Three-State Conformational Transition of hZαADAR1

The rate constants for association and dissociation of hZαADAR1 onto d(CG)3, kFB and kBF, were determined by profiles of 15N amide CPMG RD data. In the previous study, the two major conformational transitions between free P and complex ZP2 were obtained in the range of [N]t/[P]t ≪ 0.5. The [N]t and [P]t are total concentrations of the DNA duplex and hZαADAR1, respectively [32]. Thus, we initially analyzed CPMG profiles based on a two-state model in the fast limit, as shown in Figure 1 and Figure 2 (also see Figure S1 and Table S1). The schemes of the two-state and pseudo-three state models of the conformational transition are described in Figure 1, respectively. In the two-state model, the P and ZP2 states are considered free and a complex of hZαADAR1, respectively. Association and dissociation rate constants are given as kFB = kon,ZP × [ZP] and kBF = koff,ZP2, respectively. The differences in the transverse relaxation rate constant between the complex and the free state were fitted to Equation (2). The global fit result of the rate constant, kex, is 832 s−1 (Table 1). The sum of squared errors (SSE) and fitting parameters were used to classify the residues of hZαADAR1 into two groups following the two-state or three-state conformational transition model. Cases with oscillatory CPMG profiles due to slow motion show relatively larger chemical shift differences in the free to complex conformational transition. In the following section, we present a method to determine the site-specific dynamics of 11 of the 19 residues showing oscillatory profiles.

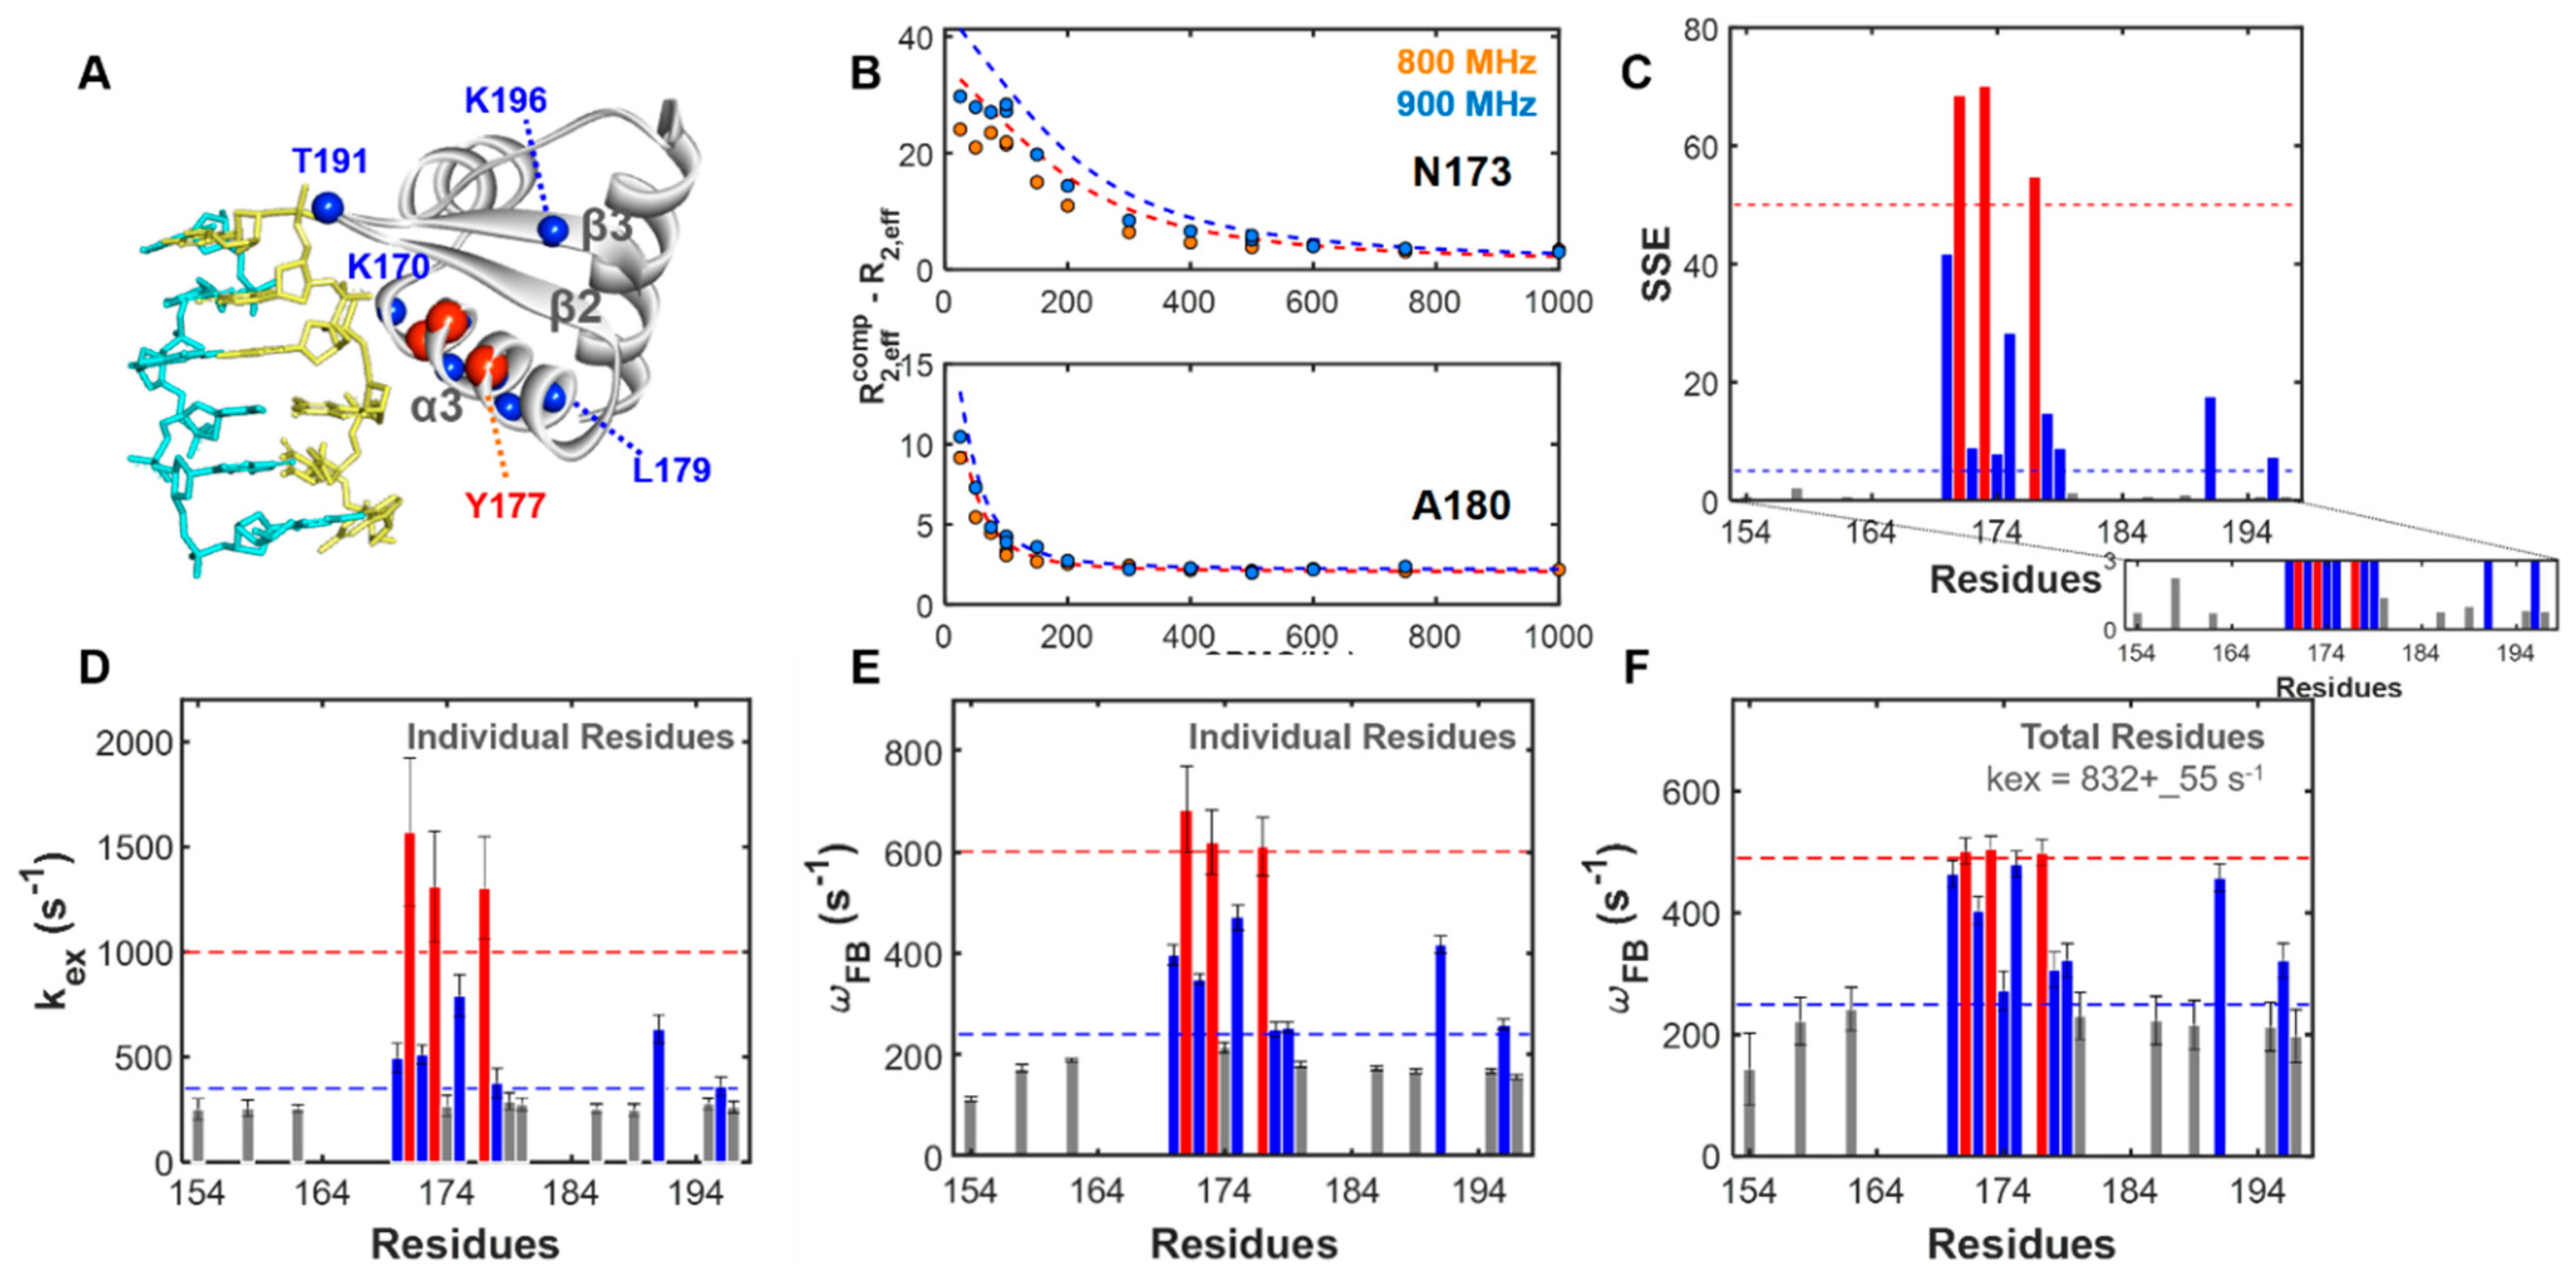
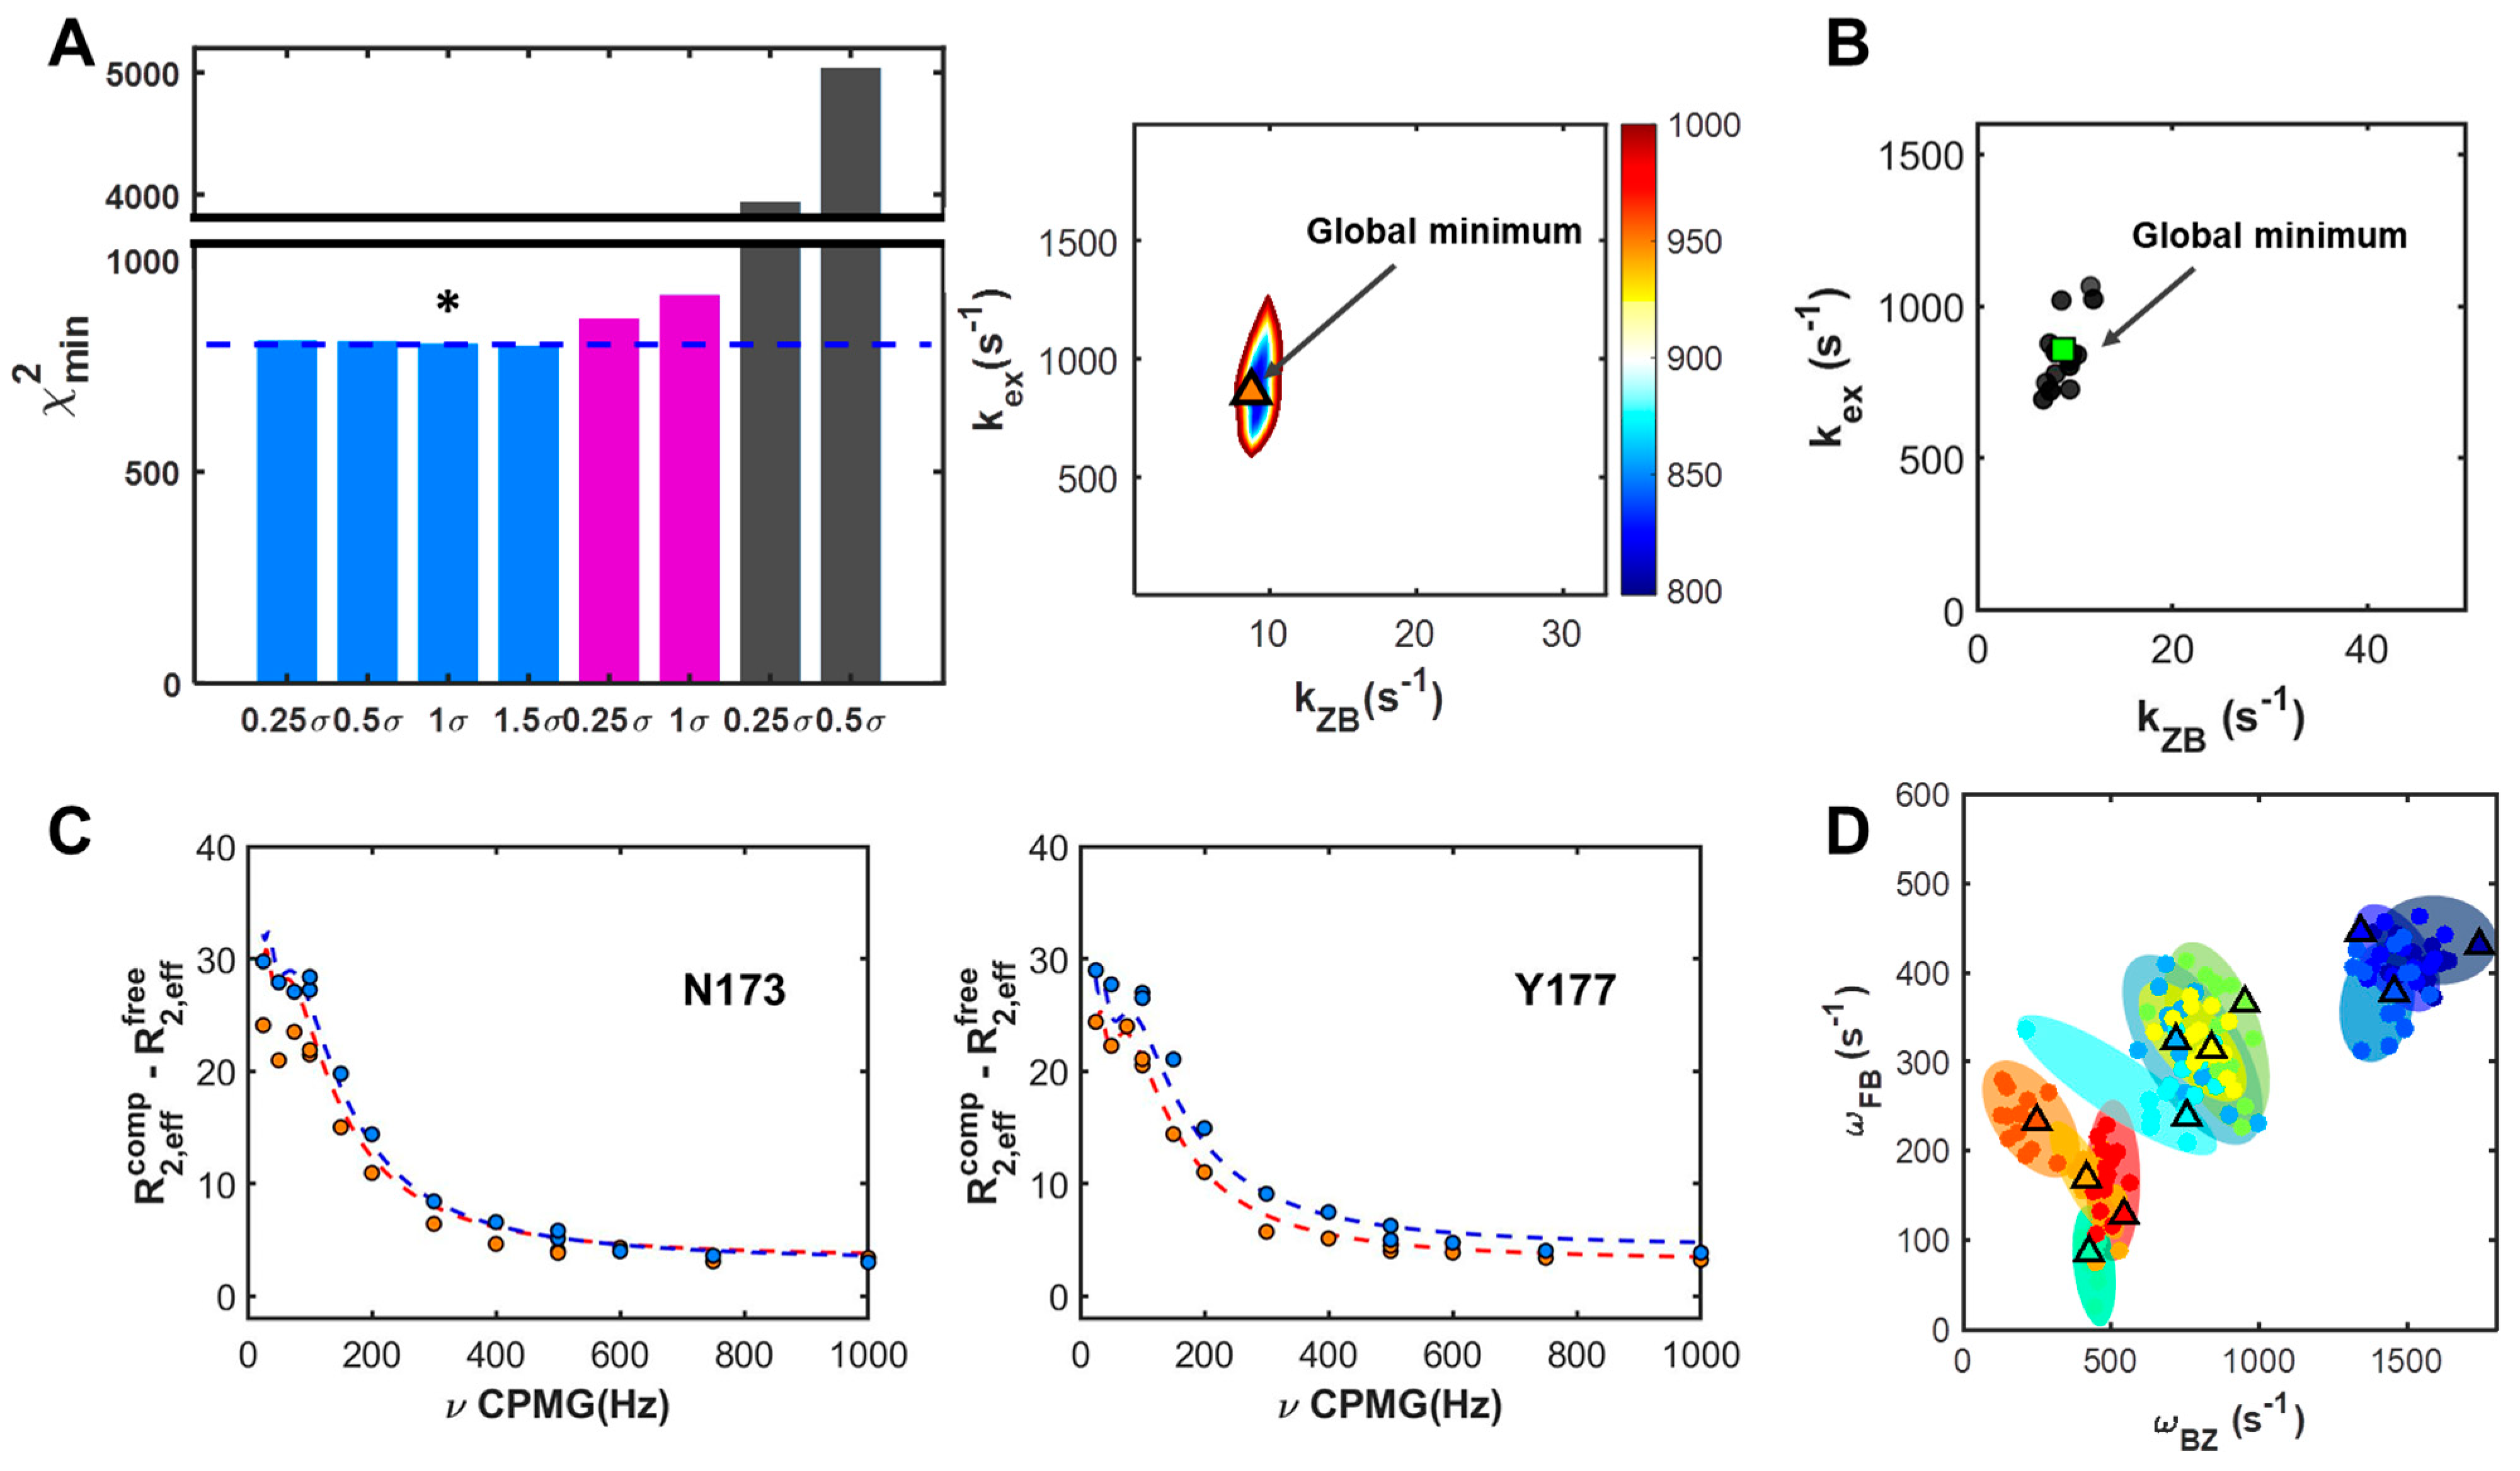
2.2. Site-Specific Analysis of Three-State Model Using Field-Dependent CPMG Profiles

Single-field numerical calculations were performed for the three-state conformational transition consisting of an independent two-state transition, as described in Figure 2B. Minimization of re-sampled parameters was carried out from one set of the χ2 surface. Comparing χ2 values from R 2 C a l c of re-sampled results provided the global minimum χ2 value, R02, kex, kZB, ΔωFC, and ΔωBZ. In Figure 3, residue-dependent parameters in different magnetic fields are described (see also Figures S2–S4 and Table S2). In principle, parameters with the minimum χ2 values between 800 MHz and 900 MHz data should be identical. In the current global search for individual residues using a single magnetic field-based approach, relative trends between residue-dependent parameters show consistency at different magnetic fields; however, the complexity of the multi-state conformational transition leads to discrepancies in the absolute values of parameters among the different magnetic field data (Figure S5). These discrepancies indicate that single-field data are insufficient to accurately characterize quantifiable kinetic parameters.
To increase the validity of the GSIR method, it adopts multiple static magnetic fields with restrained variables of chemical shift, ΔωFC and ΔωBZ. The proportional correlation between chemical shifts in different magnetic fields validates and reduces the number of parameter arrays during numerical calculations. Finally, in parallel with field-dependent parameterization, the Monte Carlo approach provides more plausible absolute values for GSIR.
Figure 4 presents the global χ2 map and GSIR results (Figures S2, S6, and S7, and Table 2). The minimized values for re-sampled sets are represented together with the optimized values of parameters at the global point in the χ2 map. The R 2 C a l c profiles based on the minimum χ2 show good agreement with the experimental CPMG profiles, as plotted in Figure 4 and Figure S2. The dynamics parameters for calculating the global minimum of χ2 are shown in Figure 3C,D. The residues, Glu171, Asn173, and Tyr177 reveal the greatest change in chemical shift due to the slow exchange motions of the B–Z conformational transition in the complex. Moreover, the exchange rate constant, kex, at a value of 638 s−1, is broadly distributed through individual residues. The kZB, at 10 s−1, also exhibits a broad distribution due to the high value of kZB at the residue, Lys 179. Removing the large value of kZB at the Lys 179 residue can result in a narrower distribution.

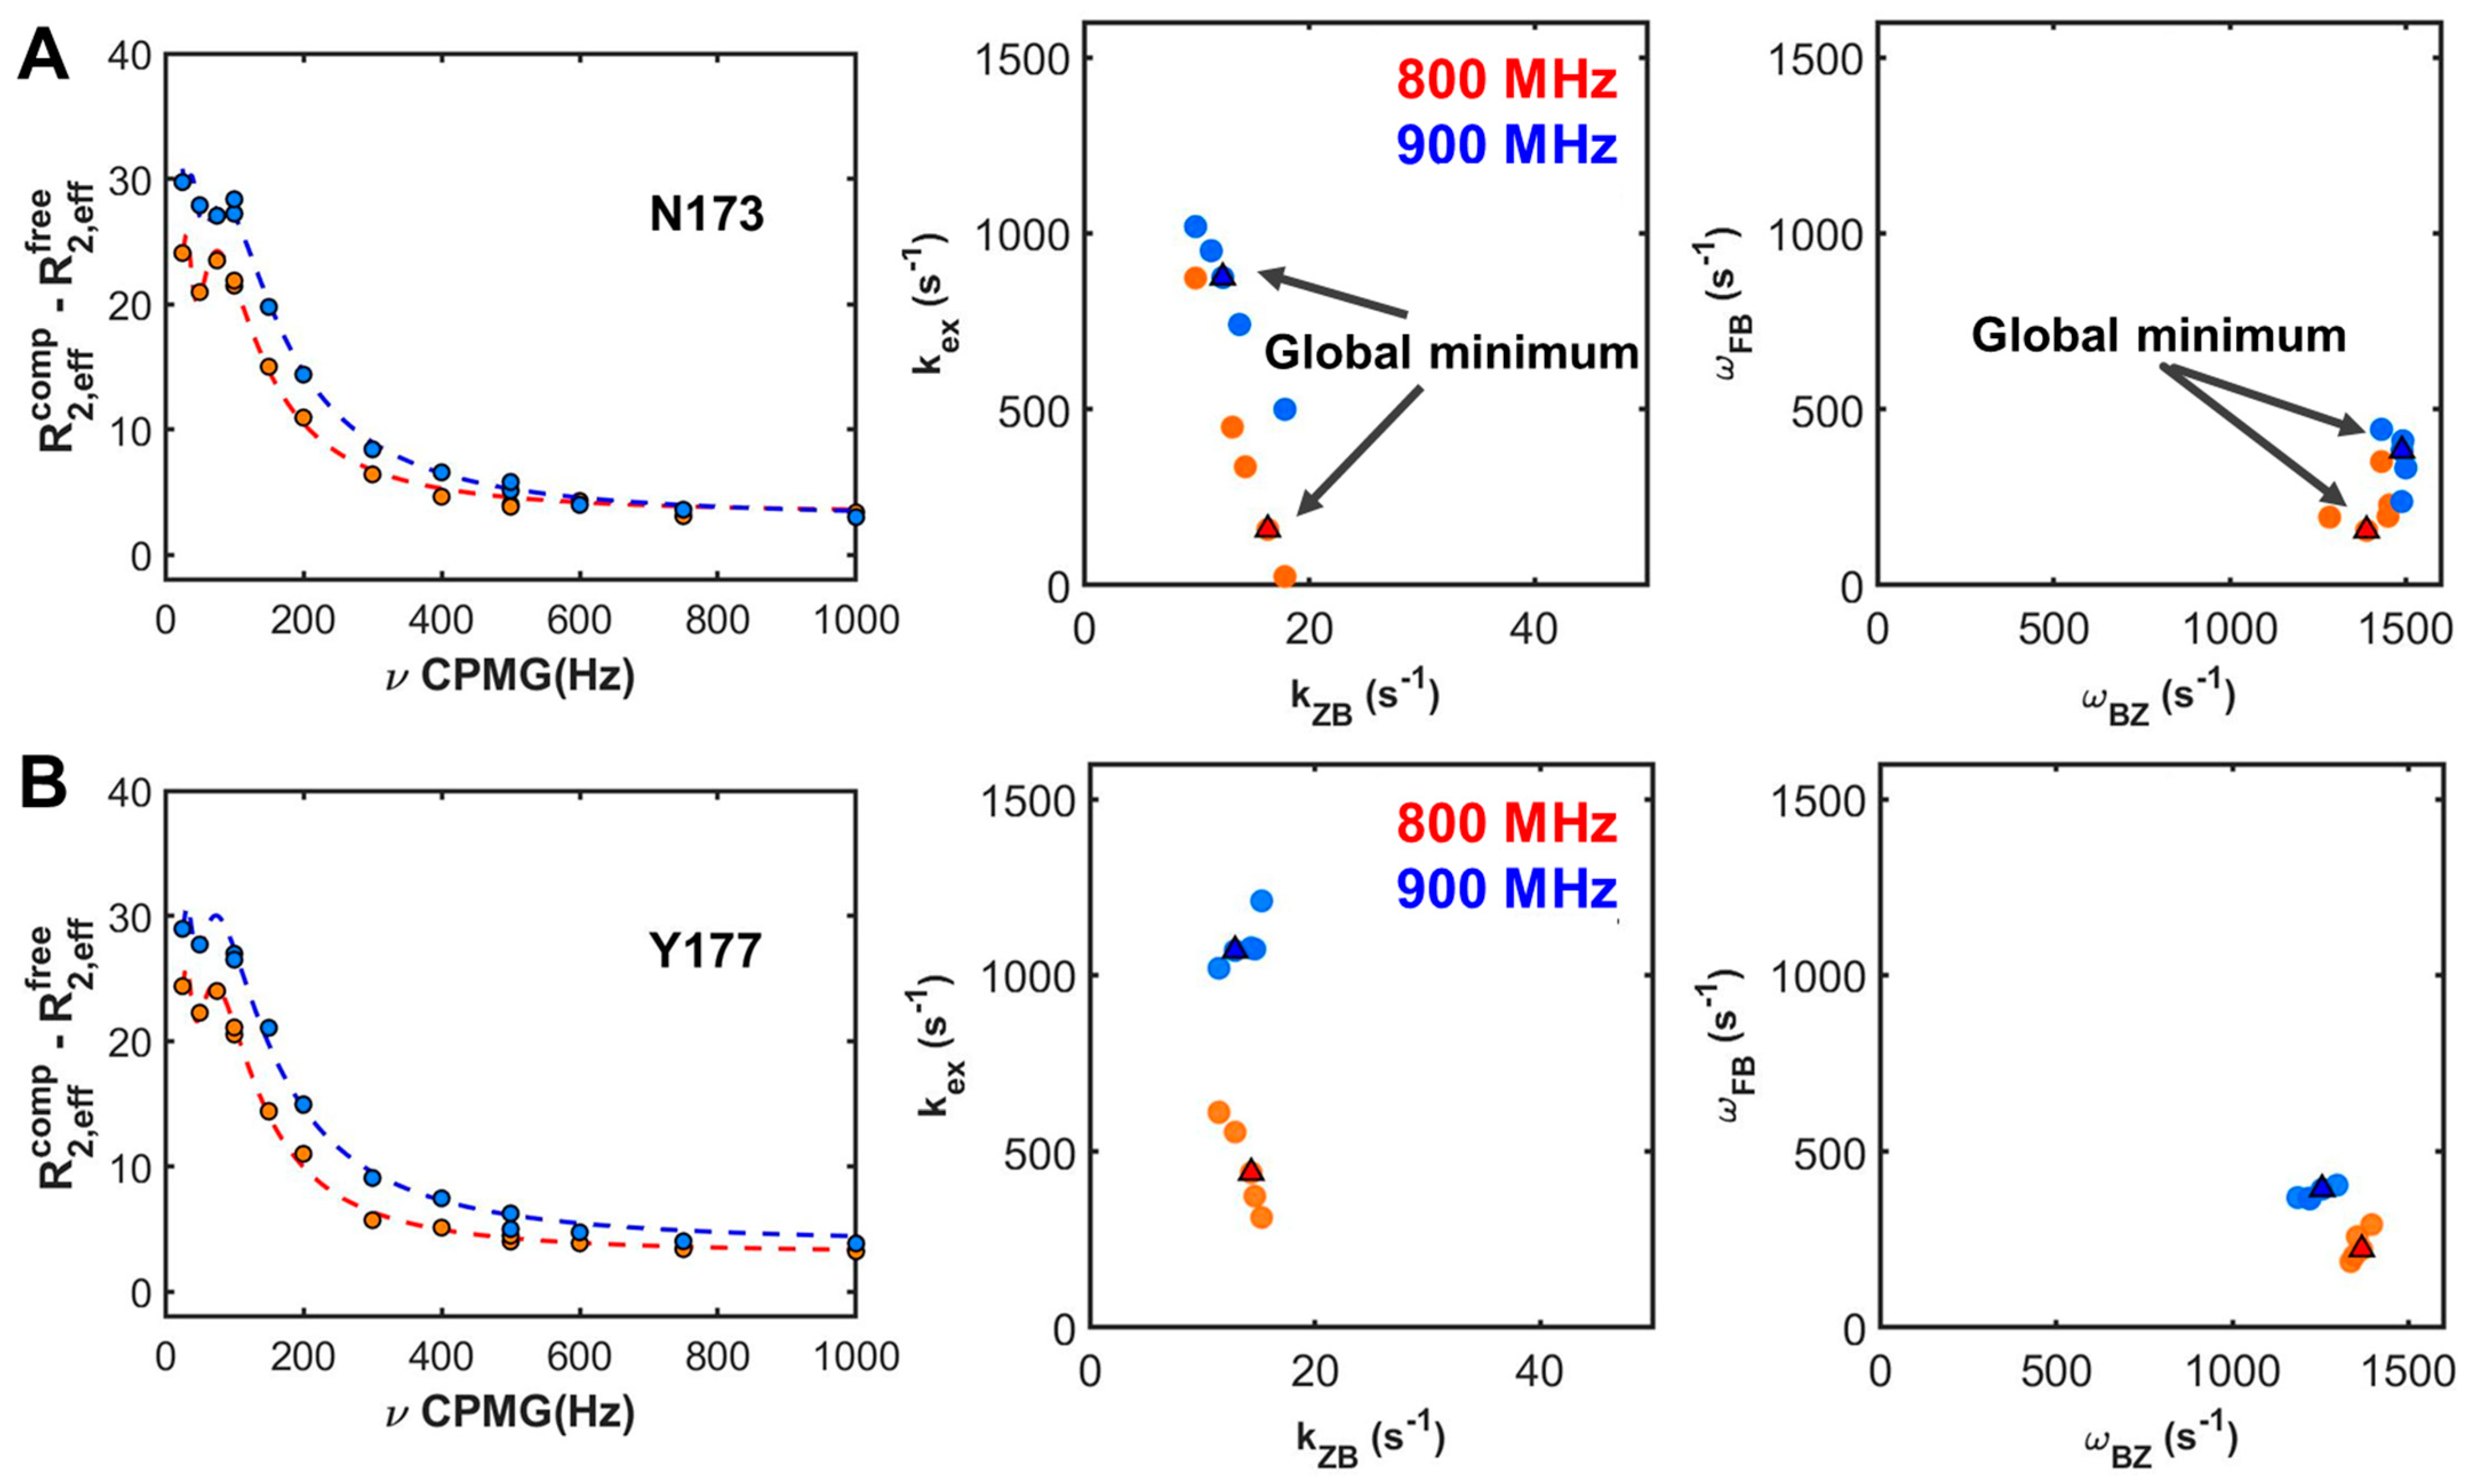
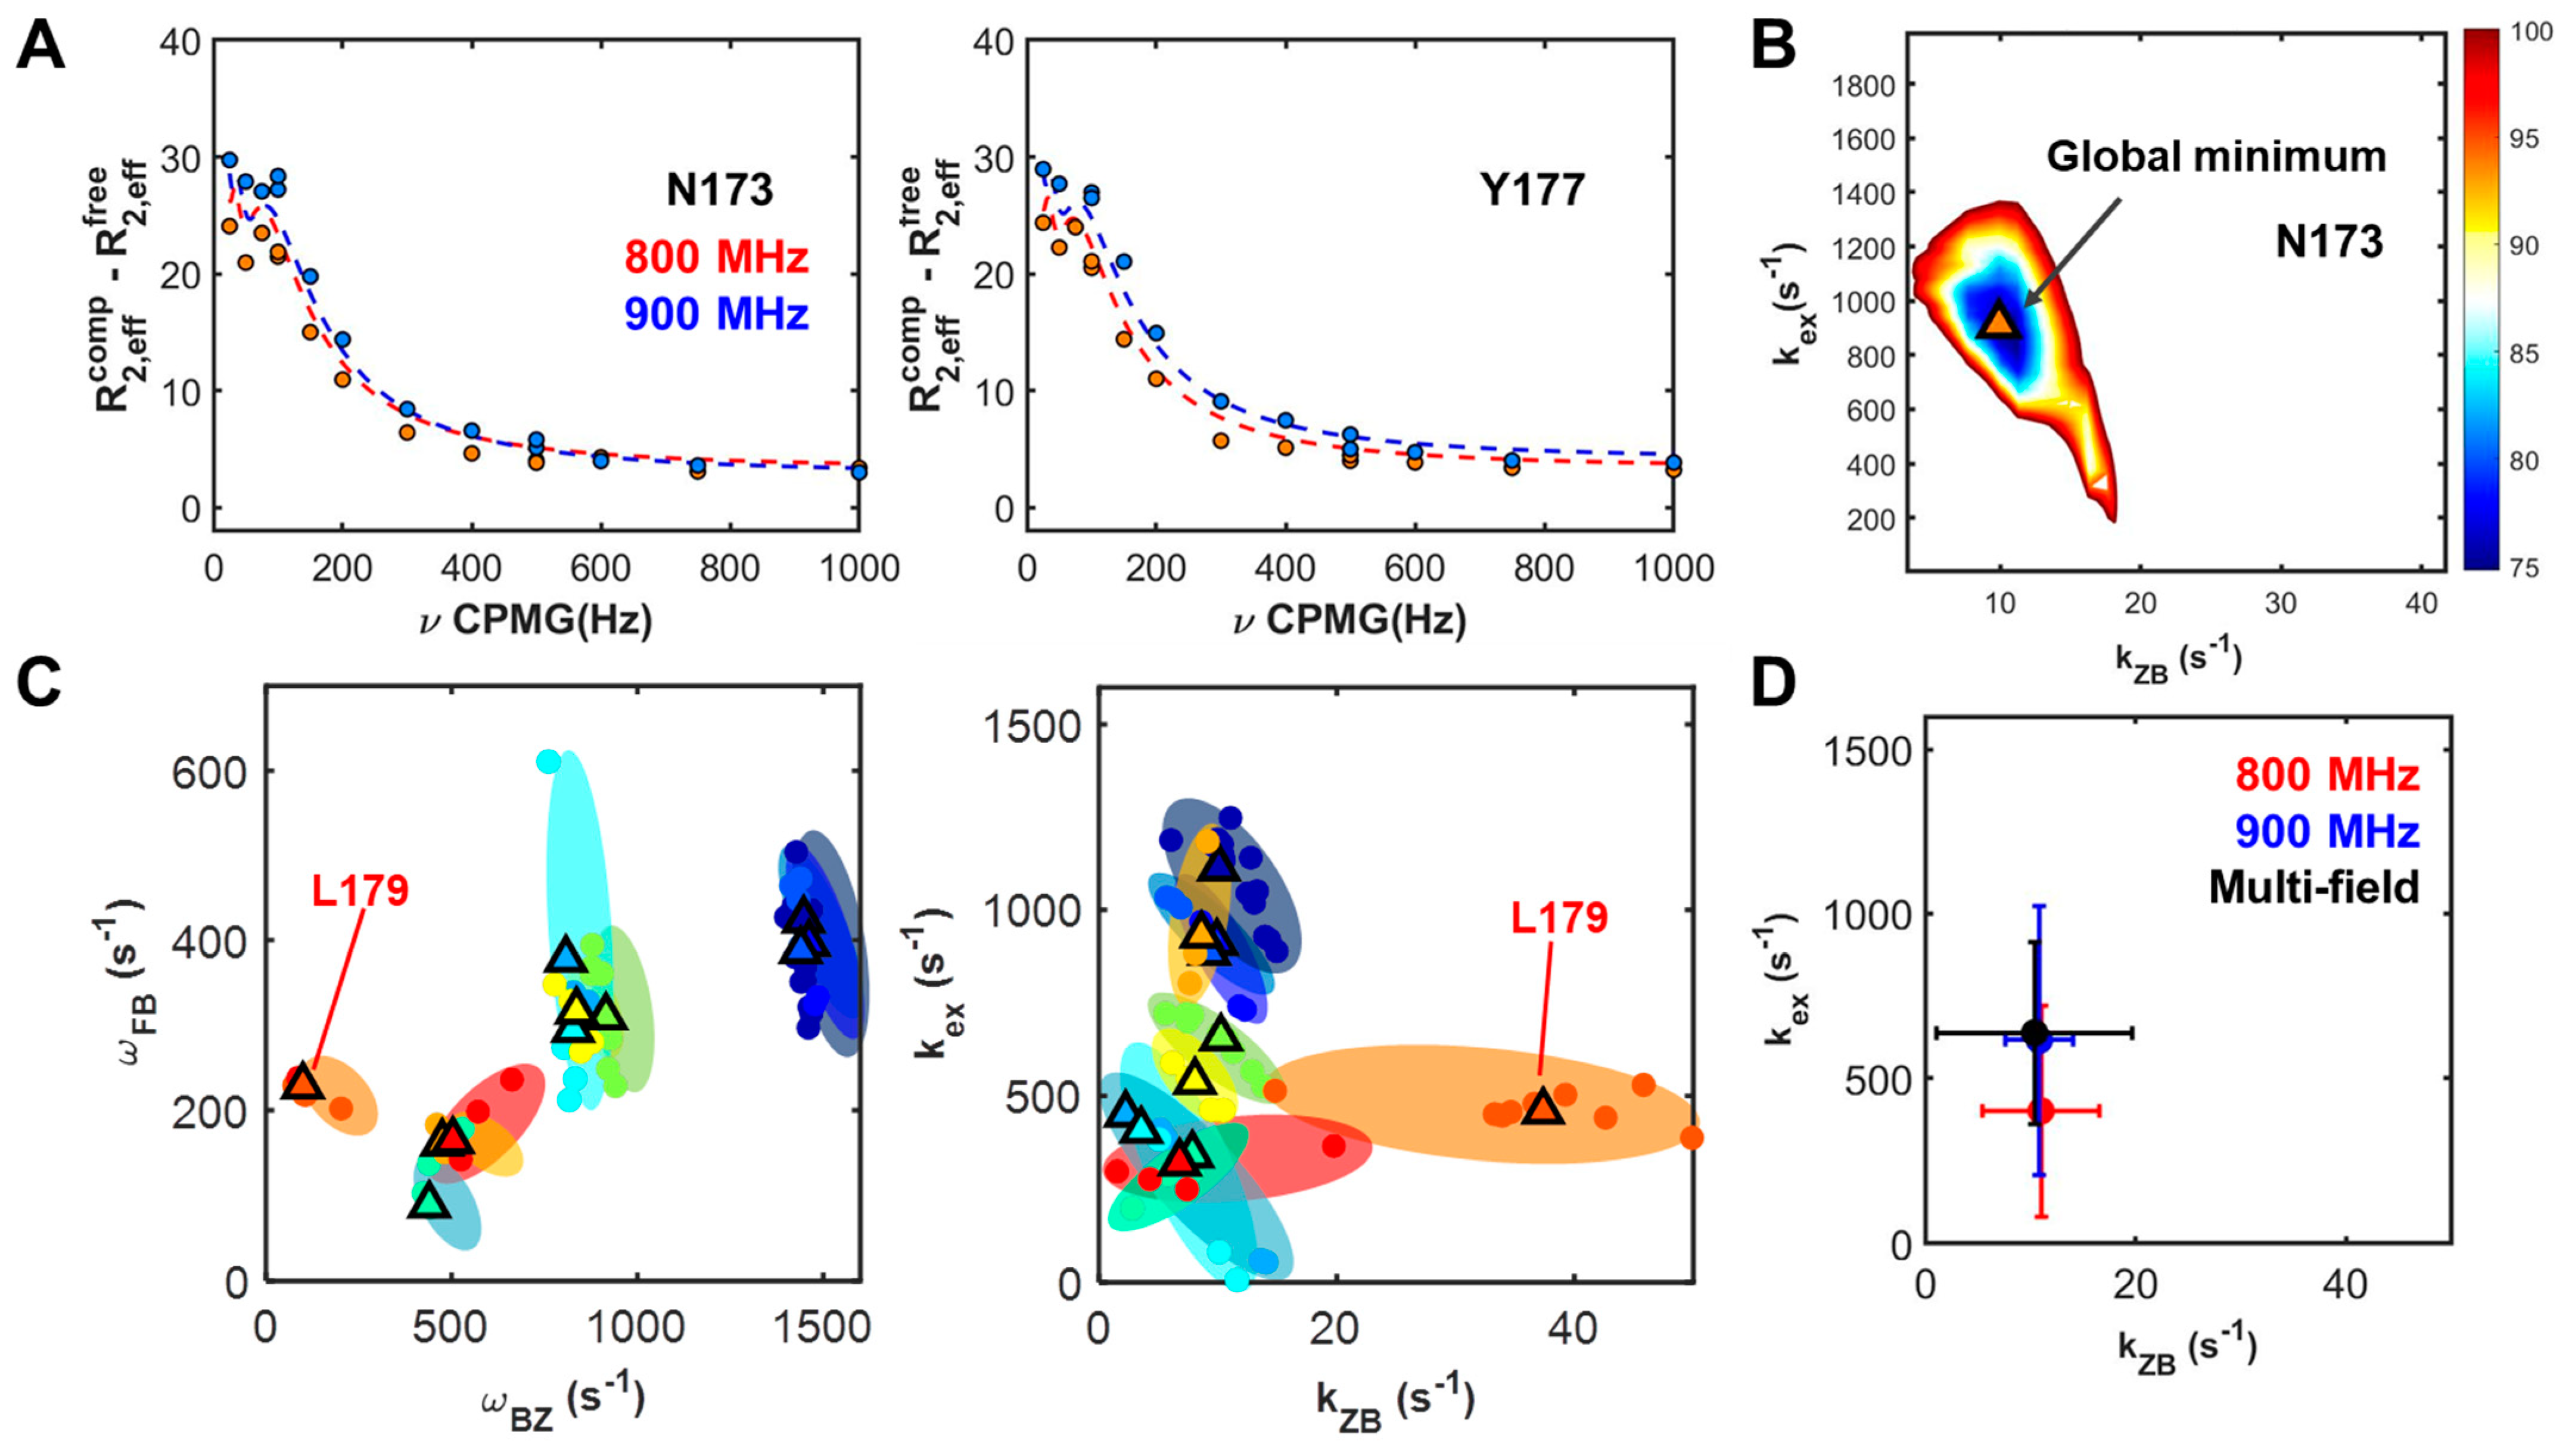
2.3. Dependencies of Parameters: Global Search for Total Residues (GSTR)

GSTR was performed to obtain rate constants and chemical shifts associated with the three-state conformational transition induced by protein binding onto DNA. To sample the valid R 2 C a l c values, various randomized parameters were constrained using Gaussian distributions. In brief, the unconstrained GSTR approach does not achieve convergence of χ2, so to determine the limitation condition of parameterization, we tested various Gaussian distribution widths of rate constants and chemical shifts based on the standard deviation of rate constants, the mean value of rate constants, and the middle values of chemical shift (Figures S8 and S9). These constraint ranges were obtained from the GSIR analysis results. Figure 5A shows comparisons of the minimum χ2, which represents similar minimized χ2 values for the cases where the range of Gaussian distribution widths of the chemical shifts for the global search process is 25%. The similarity of the minimized χ2 values indicates that in the GSIR results, a distribution range lower than 1.5 σ of the mean value is sufficient to accurately calculate the parameters of the three-state conformational transition. R 2 C a l c profiles were generated and show great agreement with the experimental observations of CPMG profiles (see also Figure S10). The globally optimized rate constants, kex and kZB, were 844 and 9.8 s−1, respectively, as shown in Table 2.

3. Discussion

Our results provide a systematic approach to map the multi-state conformational transition on a computational basis with rational constraints of input and numerical calculation limits. In order to determine quantitative kinetic and chemical shift parameters, a three-step strategy was applied. First, residues containing the contributions of slow motions in the three-state conformational transition were grouped based on the mismatches between CPMG profiles and fitting lines using a two-state transition model in the fast limit. Second, we used a Monte Carlo approach, with simultaneous constraint of the multi-magnetic field CPMG profiles and chemical shift parameters to identify totals of the residue-based variables, R02, kex, kZB, ΔωFC, and ΔωBZ. Finally, numerical parameter mapping to determine the global rate constants and residue-dependent chemical shifts was performed based on the global search results of individual residues obtained in the second step.
To determine global rate constants for the three-state conformational changes, various constraints were applied, since parameterization without constraints did not provide globally minimized R 2 C a l c profiles. Before computing the GSTR results, the GSIR parameters provided sufficient information to generate the input variables. Considering Gaussian distributions of rate constants and residue-dependent chemical shifts in relation to shared chemical shifts for multi-state profiles allows for well-optimized parameterization with high accuracy without the need for long-duration computational simulations. Residue-dependent global search constrained by independently measured CPMG RD profiles of multi-magnetic field results shows different value and narrower distribution of the exchange kinetic constant during the conformational transition between free to bound states than the cases from CPMG RD profiles of the single-magnetic field results. Also, GSTR process re-constrained by residue-dependent GSIR results provides the information on the entire changes of protein motions during three-state conformational changes. Taken together, the computational algorithm with the global search process is presented in Figure 6.
As shown in Figure 5 and Table 2, the cases with high oscillatory contributions to CPMG profiles were found to have large values of ΔωBZ. The cases with residues Glu171, Asn173, and Tyr177 are those that exhibit the sum of squared errors (SSE) in fitting to the two-state model. Based on the global analysis of the CPMG profiles to characterize the protein-induced conformational exchanges of the B–Z transition in DNA, we suggest three-state conformational changes including two independent two-state exchange processes: (i) The fast exchange between the free and DNA-complex state of hZαADAR1; (ii) the slow exchange associated with the B–Z transition of DNA in the hZαADAR1–DNA complex (Figure 2B). Interestingly, the cases with high oscillatory contributions to CPMG profiles were found to have large values of ΔωBZ on the three residues, Glu171, Asn173, and Tyr177, were found to provide the main contributions to the slow exchange process in CPMG profiles (Figure 5 and Table 2). These residue characteristics indicate the presence of two distinct regimes—the “dominant oscillatory regime” and “semi-oscillatory regime”.
We anticipate that this machine-learning-type approach will provide new insight to understand biomolecular motions in conformational transitions of protein–protein or protein–nucleic acid complexes.

4. Materials and Methods

Here we provide the experimental methods and the global search algorithms. One of the most common methods for RD curve fits is the grid search approach, but it does not always provide the global minimum, which imparts the best-fit and parameters. Moreover, increasing grid size is not the best way to improve the quality of fits as it increases the computational time. This is related to a common issue of the local minimum problem, which occurs in a non-linear curve fitting process. The same local minimum issue arises during the CPMG profile fitting process. For this reason, in practice, the development of a new logical process to find the global minimum is necessary to characterize the multi-state conformational transition by modeling CPMG profiles. Particularly, hierarchical step of Monte Carlo approach with randomized parameterization with rational constraints was employed for the robust determination of the global χ2 values.

4.1. Sample Preparation

The DNA oligomer was purchased from M-biotech Inc (Seoul, Korea). This DNA oligomer was purified by reverse-phase HPLC and desalted with a Sephadex G-25 gel-filtration column. The amount of DNA was represented as the concentration of the double-stranded sample. The hZαADAR1 (E140−Q202) was cloned into E. coli expression plasmid pET28a (Novagen, WI, USA). To produce 15N labeled hZαADAR1, BL21(DE3) bacteria were grown in M9 medium that contained 1 g/L 15NH4Cl. The details of purification and expression of 15N-labeled hZαADAR1 proteins were described in a previous study [1]. The DNA and protein samples were dissolved in a 90% H2O/10% D2O NMR buffer containing 10 mM sodium phosphate (pH 6.0) with 100 mM NaCl salt.

4.2. CPMG RD Results

The 15N amide CPMG RD experiments were performed using free 15N-labeled hZαADAR1 and 15N-labeled hZαADAR1 complexed with d(CG)3 at 35 °C. RD profiles of 15N amide of hZαADAR1 were measured in two magnetic fields on a Bruker Avance-III 800-MHz NMR spectrometer or a Bruker Avance-III 900-MHz spectrometer (KBSI, Ochang) equipped with a cold probe. The constant time interval, Trelax, was 60 ms and 14 values of υCPMG (=1/(2τCP)) in the range 25–1000 Hz were used in all the experiments. Transverse relaxation rates R2,eff from each cross-peak signal at each value were calculated using the following equation:
R 2 , e f f ( ν C P M G ) = 1 T l n { I I ( ν C P M G ) I 0 }
where I(υCPMG) and I0 are the peak intensity at a given value of υCPMG with delay time of 60 and 0 ms, respectively.

4.3. Binding Models and Global Searches

Classification: 15N amide CPMG RD profiles were initially fit to the two-state model, as described in Figure 2. The non-linear least-squares fitting algorithm was used and implemented in the MATLAB 2020a package (MathWorks Inc., Natick, MA, USA). For the fast exchange limit, all kinetic parameters calculated using the following equation:
R 2 , e f f c o m p ( ν C P M G ) R 2 , e f f   f r e e ( ν C P M G ) =   R 2 0 +   P F P C ( Δ ω F C ) 2 k e x { 1 4 ν C P M G k e x tanh ( k e x 4 ν C P M G ) }
where PF, PC, ΔωFC, and kex are the relative populations of the free and complex states, chemical shift changes between two states, and exchange rate constant, respectively. The sum of squared errors (SSE) was selected as the classification parameter for the conformational transition model, as described in Figure 2. The global fitting method was applied to examine the global exchange rate constant and residue-dependent chemical shifts between the free and complex states (see Figure 2F). In addition, residues with SSE greater than 0.7 were analyzed according to the three-state kinetic model, as described in following equation:
R 2 , e f f c o m p ( ν C P M G ) R 2 , e f f   f r e e ( ν C P M G ) = R 2 0 +   P F P C ( Δ ω F C ) 2 k e x { 1 4 ν C P M G k e x tanh ( k e x 4 ν C P M G ) . } + k Z B { 1 sin ( Δ ω B Z / 4 ν C P M G ) Δ ω B Z / 4 ν C P M G }
The kZB and ΔωFC are the exchange rate constant and chemical shift difference between the CBCZ states, respectively.
Global Search Algorithm: Global search algorithms were performed to find the global minimum of the three-state conformational transition using the global exchange rates, kex and kZB, and residue-dependent chemical shifts, ΔωFC and ΔωBZ. At the independent fast and slow limits, CPMG RD profiles were numerically calculated using Equation (3). R 2 C a l c was computed using the sum of all R 2 C a l c s on a per-residue basis to obtain the χ2 function, as described in Equation (4). below,
χ t o t a l 2 ( R 2 0 , k e x , k Z B , Δ ω F C , Δ ω B Z ) = ( R 2 c a l c ( R 2 0 , k e x , k Z B , Δ ω F C , Δ ω B Z ) R 2 e x p ) 2
The global χ2 values were estimated using the Monte Carlo approach, where the randomized χ2 surfaces were numerically obtained on summation profiles based on the bootstrap procedure using sub-arrays of parameters, R02, kex, kZB, ΔωFC, and ΔωBZ. The Monte Carlo approach was performed in the MATLAB 2020a package. Initial kinetic parameters, R02, kex, kZB, ΔωFC. and ΔωBZ, were randomly generated within the range of values obtained from the two-state fit ±0.2, 1–2000 s−1, 1–50 s−1, 1–1500 Hz, and 1–1500 Hz, respectively, for the 11 selected residues. Five arrays of re-sampled parameters were extracted to compute the minimum χ2 from one set of randomized χ2 surface. GSIR determined global minimum parameters using a global search on a per-residue basis, while GSTR was performed to determine the global rate constants and residue-dependent chemical shifts. For GSTR, initial kinetic parameters, kex, kZB, ΔωFC, and ΔωBZ, were generated from the Gaussian distributed random numbers to determine the constraints to be implemented for the numerical calculations. A rational, step-by-step, hierarchical approach was used to find appropriate constraints of the dynamic parameters throughout the entire residue and this approach described in the next section.
Constraints: For GSIR, chemical shift parameters ΔωFC and ΔωBZ, a strong inter-dependency between two magnetic fields, Δ ω F C i =   j / i ( Δ ω F C j ) and Δ ω B Z i =   j / i ( Δ ω B Z j )   was applied, where i and j are the magnetic fields. Kinetic rate constants between two magnetic fields, k e x i =   k e x j and k Z B i =   k Z B j , were used, since kinetic rate constants have to be equal under the different magnetic fields.
During the GSTR process, global parameters did not converge during calculation of the global minimum based on randomized global rate constants and residue-dependent chemical shifts (Figures S8 and S9). As a first step, the initial values of the rate constants were chosen from a range of standard deviations, σ, calculated from the mean value of GSIR residue-dependent rate constants, as shown in Table 1 and Table 2, using Gaussian distributions. Optimization of the suppressed rate constant did not lead to convergence of the χ2 values, so the chemical shift difference was constrained to obtain plausible values of residue-dependent chemical shifts. As the second step, to obtain more flexible boundaries for chemical shift screening rate constants, a broad range of constraints for chemical shifts with Gaussian distributions was applied. A 25% deviation from the middle value of residue-dependent chemical shifts was used for the Gaussian distributed width along with various Gaussian distributed rate constants (see Figure S9). The minimum χ2 was determined using various standard deviations (0.25σ, 0.5σ, σ, and 1.5σ) of the rate constants simultaneously with the chemical shift constrained. Finally, GSTR provided rational results of the globally optimized kinetic parameters (Table 2).

Supplementary Materials

The following are available online at https://www.mdpi.com/article/10.3390/ijms22073517/s1, Figure S1: The 15N CPMG RD data and the global fits to two-state model, Figure S2: The 15N CPMG RD data and GFIR results, Figure S3: Residue dependent rate constants, Figure S4: Residue dependent chemical shifts, Figure S5: Residue dependent GSIR results for all residues, Figure S6: Global χ2 maps projected onto rate constants for GSIR results, Figure S7: Global χ2 maps projected onto chemical shifts for GSIR results, Figure S8: Global χ2 maps projected onto rate constants for GSTR, Figure S9: Histograms of constrained input parameters, Figure S10: The 15N CPMG RD data and GFTR results, Table S1: Conformational exchange rate constants and chemical shift using two-state model, Table S2: Conformational exchange rate constants and chemical shift using single-field basis GSIR.

Author Contributions

Conceptualization, K.-I.O., A.-R.L., and J.-H.L.; methodology, K.-I.O. and A.-R.L., S.-R.C., Y.G., K.-S.R., and E.-H.K.; software, K.-I.O. and A.-R.L.; validation, K.-I.O. and J.-H.L.; formal analysis, K.-I.O. and A.-R.L.; investigation, K.-I.O., A.-R.L. S.-R.C., Y.G., K.-S.R., E.-H.K., and J.-H.L.; resources, K.-I.O., A.-R.L.; data curation, K.-I.O., A.-R.L., S.-R.C., Y.G., K.-S.R., and E.-H.K.; writing—original draft preparation, K.-I.O. and J.-H.L.; writing—review and editing, K.-I.O. and J.-H.L.; visualization, K.-I.O.; supervision, J.-H.L.; project administration, J.-H.L.; funding acquisition, J.-H.L. and K.-I.O. All authors have read and agreed to the published version of the manuscript.

Funding

This work was supported by the National Research Foundation of Korea (2020R1A2C1006909 to J.-H.L. and 2020R1I1A1A01070690 to K.-I.O.). This work was also supported by the Samsung Science and Technology Foundation (SSTF-BA1701-10 to J.-H.L.) and a KBSI grant [C030440].

Institutional Review Board Statement

Not applicable.

Informed Consent Statement

Not applicable.

Data Availability Statement

The data presented in this study are available on request from the corresponding author.

Acknowledgments

We thank to the KBSI for access to its NMR facilities.

Conflicts of Interest

The authors declare no conflict of interest.

Abbreviations

ADAR1RNA-specific adenosine deaminase I
CPMGCarr–Purcell–Meiboom–Gill
HSQCHeteronuclear single quantum correlation
hZαADAR1The Zα domain of human ADAR1
GSIRGlobal search for individual residues
GSTRGlobal search for total residues
RDRelaxation dispersion
SSESum of squared errors
ZBPZ-DNA binding protein

References

  1. Mizukoshi, Y.; Takeuchi, K.; Tokunaga, Y.; Matsuo, H.; Imai, M.; Fujisaki, M.; Kamoshida, H.; Takizawa, T.; Hanzawa, H.; Shimada, I. Targeting the cryptic sites: NMR-based strategy to improve protein druggability by controlling the conformational equilibrium. Sci. Adv. 2020, 6, eabd0480. [Google Scholar] [CrossRef]
  2. Roos, M.; Ott, M.; Hofmann, M.; Link, S.; Rössler, E.; Balbach, J.; Krushelnitsky, A.G.; Saalwächter, K.; Roessler, E.A.; Saalwaechter, K. Coupling and Decoupling of Rotational and Translational Diffusion of Proteins under Crowding Conditions. J. Am. Chem. Soc. 2016, 138, 10365–10372. [Google Scholar] [CrossRef] [Green Version]
  3. Esmaili, N.; Leroy, J.L. i-motif solution structure and dynamics of the d(AACCCC) and d(CCCCAA) tetrahymena telomeric repeats. Nucleic Acids Res. 2005, 33, 213–224. [Google Scholar] [CrossRef] [PubMed] [Green Version]
  4. Otten, R.; Villali, J.; Kern, D.; Mulder, F.A.A. Probing Microsecond Time Scale Dynamics in Proteins by Methyl 1H Carr−Purcell−Meiboom−Gill Relaxation Dispersion NMR Measurements. Application to Activation of the Signaling Protein NtrC r. J. Am. Chem. Soc. 2010, 132, 17004–17014. [Google Scholar] [CrossRef] [PubMed]
  5. Korzhnev, D.M.; Bezsonova, I.; Lee, S.; Chalikian, T.V.; Kay, L.E. Alternate Binding Modes for a Ubiquitin–SH3 Domain Interaction Studied by NMR Spectroscopy. J. Mol. Biol. 2009, 386, 391–405. [Google Scholar] [CrossRef]
  6. Baldwin, A.J.; Hansen, D.F.; Vallurupalli, P.; Kay, L.E. Measurement of Methyl Axis Orientations in Invisible, Excited States of Proteins by Relaxation Dispersion NMR Spectroscopy. J. Am. Chem. Soc. 2009, 131, 11939–11948. [Google Scholar] [CrossRef] [PubMed]
  7. Beach, H.; Cole, R.; Gill, M.L.; Loria, J.P. Conservation of mus-ms enzyme motions in the apo- and substrate-mimicked state. J. Am. Chem. Soc. 2005, 127, 9167–9176. [Google Scholar] [CrossRef]
  8. Grey, M.J.; Wang, C.; Palmer, A.G. Disulfide Bond Isomerization in Basic Pancreatic Trypsin Inhibitor: Multisite Chemical Exchange Quantified by CPMG Relaxation Dispersion and Chemical Shift Modeling. J. Am. Chem. Soc. 2003, 125, 14324–14335. [Google Scholar] [CrossRef]
  9. Farber, P.J.; Mittermaier, A. Relaxation dispersion NMR spectroscopy for the study of protein allostery. Biophys. Rev. 2015, 7, 191–200. [Google Scholar] [CrossRef] [Green Version]
  10. Demers, J.-P.; Mittermaier, A. Binding Mechanism of an SH3 Domain Studied by NMR and ITC. J. Am. Chem. Soc. 2009, 131, 4355–4367. [Google Scholar] [CrossRef]
  11. Sugase, K.; Lansing, J.C.; Dyson, A.H.J.; Wright, P.E. Tailoring Relaxation Dispersion Experiments for Fast-Associating Protein Complexes. J. Am. Chem. Soc. 2007, 129, 13406–13407. [Google Scholar] [CrossRef] [PubMed] [Green Version]
  12. Jae, L.T.; Raaben, M.; Riemersma, M.; Van Beusekom, E.; Blomen, V.A.; Velds, A.; Kerkhoven, R.M.; Carette, J.E.; Topaloglu, H.; Meinecke, P.; et al. Deciphering the Glycosylome of Dystroglycanopathies Using Haploid Screens for Lassa Virus Entry. Science 2013, 340, 479–483. [Google Scholar] [CrossRef] [PubMed] [Green Version]
  13. Lee, A.-R.; Hwang, J.; Hur, J.H.; Ryu, K.-S.; Kim, K.K.; Choi, B.-S.; Kim, N.-K.; Lee, J.-H. NMR Dynamics Study Reveals the Zα Domain of Human ADAR1 Associates with and Dissociates from Z-RNA More Slowly than Z-DNA. ACS Chem. Biol. 2018, 14, 245–255. [Google Scholar] [CrossRef] [PubMed]
  14. Rennella, E.; Sekhar, A.; Kay, L.E. Self-Assembly of Human Profilin-1 Detected by Carr–Purcell–Meiboom–Gill Nuclear Magnetic Resonance (CPMG NMR) Spectroscopy. Biochemistry 2017, 56, 692–703. [Google Scholar] [CrossRef] [PubMed]
  15. Farber, P.J.; Slager, J.; Mittermaier, A.K. Local Folding and Misfolding in the PBX Homeodomain from a Three-State Analysis of CPMG Relaxation Dispersion NMR Data. J. Phys. Chem. B 2012, 116, 10317–10329. [Google Scholar] [CrossRef] [PubMed]
  16. Neudecker, P.; Korzhnev, D.M.; Kay, L.E. Assessment of the Effects of Increased Relaxation Dispersion Data on the Extraction of 3-site Exchange Parameters Characterizing the Unfolding of an SH3 Domain. J. Biomol. NMR 2006, 34, 129–135. [Google Scholar] [CrossRef]
  17. Korzhnev, D.M.; Neudecker, P.; Mittermaier, A.; Orekhov, V.Y.; Kay, L.E. Multiple-Site Exchange in Proteins Studied with a Suite of Six NMR Relaxation Dispersion Experiments: An Application to the Folding of a Fyn SH3 Domain Mutant. J. Am. Chem. Soc. 2005, 127, 15602–15611. [Google Scholar] [CrossRef]
  18. Miyahara, T.; Nakatsuji, H.; Sugiyama, H. Similarities and Differences between RNA and DNA Double-Helical Structures in Circular Dichroism Spectroscopy: A SAC-CI Study. J. Phys. Chem. A 2016, 120, 9008–9018. [Google Scholar] [CrossRef]
  19. Pan, F.; Roland, C.; Sagui, C. Ion distributions around left- and right-handed DNA and RNA duplexes: A comparative study. Nucleic Acids Res. 2014, 42, 13981–13996. [Google Scholar] [CrossRef] [Green Version]
  20. Bae, S.; Kim, D.; Kim, K.K.; Kim, Y.-G.; Hohng, S. Intrinsic Z-DNA Is Stabilized by the Conformational Selection Mechanism of Z-DNA-Binding Proteins. J. Am. Chem. Soc. 2011, 133, 668–671. [Google Scholar] [CrossRef]
  21. Rich, A.; Zhang, S. Z-DNA: The long road to biological function. Textb. Met. Struct. Chem. 2018, 4, 261–268. [Google Scholar] [CrossRef]
  22. Lee, A.-R.; Kim, N.-H.; Seo, Y.-J.; Choi, S.-R.; Lee, J.-H. Thermodynamic Model for B-Z Transition of DNA Induced by Z-DNA Binding Proteins. Molecules 2018, 23, 2748. [Google Scholar] [CrossRef] [Green Version]
  23. Schwartz, T.; Rould, M.A.; Lowenhaupt, K.; Herbert, A.; Rich, A. Crystal Structure of the Zα Domain of the Human Editing Enzyme ADAR1 Bound to Left-Handed Z-DNA. Textb. Met. Struct. Chem. 2018, 284, 234–238. [Google Scholar] [CrossRef]
  24. Ha, S.C.; Lowenhaupt, K.; Rich, A.; Kim, Y.-G.; Kim, K.K. Crystal structure of a junction between B-DNA and Z-DNA reveals two extruded bases. Textb. Met. Struct. Chem. 2018, 437, 207–210. [Google Scholar] [CrossRef]
  25. Wang, Z.; Choi, M.K.; Ban, T.; Yanai, H.; Negishi, H.; Lu, Y.; Tamura, T.; Takaoka, A.; Nishikura, K.; Taniguchi, T. Regulation of innate immune responses by DAI (DLM-1/ZBP1) and other DNA-sensing molecules. Proc. Natl. Acad. Sci. USA 2008, 105, 5477–5482. [Google Scholar] [CrossRef] [Green Version]
  26. Yanai, H.; Savitsky, D.; Tamura, T.; Taniguchi, T. Regulation of the cytosolic DNA-sensing system in innate immunity: A current view. Curr. Opin. Immunol. 2009, 21, 17–22. [Google Scholar] [CrossRef]
  27. Kim, Y.-G.; Lowenhaupt, K.; Oh, D.-B.; Kim, K.K.; Rich, A. Evidence that vaccinia virulence factor E3L binds to Z-DNA in vivo: Implications for development of a therapy for poxvirus infection. Textb. Met. Struct. Chem. 2018, 101, 244–248. [Google Scholar] [CrossRef]
  28. Kim, Y.-G.; Muralinath, M.; Brandt, T.; Pearcy, M.; Hauns, K.; Lowenhaupt, K.; Jacobs, B.L.; Rich, A. A role for Z-DNA binding in vaccinia virus pathogenesis. Proc. Natl. Acad. Sci. USA 2003, 100, 6974–6979. [Google Scholar] [CrossRef] [PubMed] [Green Version]
  29. Rothenburg, S.; Deigendesch, N.; Dittmar, K.; Koch-Nolte, F.; Haag, F.; Lowenhaupt, K.; Rich, A. A PKR-like eukaryotic initiation factor 2 kinase from zebrafish contains Z-DNA binding domains instead of dsRNA binding domains. Proc. Natl. Acad. Sci. USA 2005, 102, 1602–1607. [Google Scholar] [CrossRef] [PubMed] [Green Version]
  30. Jin, H.-S.; Kim, N.-H.; Choi, S.-R.; Oh, K.-I.; Lee, J.-H. Protein-induced B-Z transition of DNA duplex containing a 2′-OMe guanosine. Biochem. Biophys. Res. Commun. 2020, 533, 417–423. [Google Scholar] [CrossRef] [PubMed]
  31. Placido, D.; Brown, B.A.; Lowenhaupt, K.; Rich, A.; Athanasiadis, A. A Left-Handed RNA Double Helix Bound by the Zα Domain of the RNA-Editing Enzyme ADAR1. Structure 2007, 15, 395–404. [Google Scholar] [CrossRef] [PubMed] [Green Version]
  32. Kang, Y.-M.; Bang, J.; Lee, E.-H.; Ahn, H.-C.; Seo, Y.-J.; Kim, K.K.; Kim, Y.-G.; Choi, B.-S.; Lee, J.-H. NMR Spectroscopic Elucidation of the B−Z Transition of a DNA Double Helix Induced by the Zα Domain of Human ADAR1. J. Am. Chem. Soc. 2009, 131, 11485–11491. [Google Scholar] [CrossRef] [PubMed]
Figure 1. Two types of conformational transition model and 15N Carr–Purcell–Meiboom–Gill (CPMG) relaxation dispersion of hZαADAR1 bound to d(CG)3: Two-state models of association and dissociation of protein ligand complex (upper) and hZαADAR1−DNA complex (lower) (Left); Pseudo-three-state model of association and dissociation process in the protein–ligand complex composed of an independent two-state transition between B-form and Z-form in the complex (Right).
Ijms 22 03517 g001
Figure 2. Fitting results of Carr–Purcell–Meiboom–Gill (CPMG) relaxation dispersion (RD) profiles using two-state model: (A) Mapping the CPMG RD results on the hZαADAR1 structure (PDB ID: 1QBJ); (B) 15N CPMG RD data for two representative residues: (top) Asn173 (a case for three-state transition) and (bottom) Ala180 (a case for two-state transition); (C) sum of squared errors (SSE) plots in fitting to the two-state model; (D) the exchange rate constants from individual fitting with the two-state model, as described in Equation (2); (E) chemical shifts between free and complex states from individual fitting with the two-state model; (F) chemical shifts from global fitting with the two-state model, which includes rate constant, kex, as a shared parameter. The individual and global fitting parameters are presented in Table S1.
Ijms 22 03517 g002
Figure 3. 15N CPMG relaxation dispersion data (left), residue dependent global rate constants (middle), and residue dependent chemical shifts (right) for Asn173 (A) and Tyr177 (B) as representative residues. Dashed lines indicate R 2 C a l c using global search for individual residues (GSIR) for single-field results, 800 MHz (red or orange) and 900 MHz (blue or pale blue). Global parameters are shown with squares, while the optimized parameters of re-sampled results are shown with closed circles. All of the results are presented in Table S2.
Ijms 22 03517 g003
Figure 4. GSIR results are described: (A) 15N CPMG RD data for two representative residues, Asn173 and Tyr177 with R 2 C a l c lines based on GSIR; (B) representative plot of the global χ2 map for rate constants; (C) optimized chemical shifts (left) and rate constants (right) with the minimized χ2 of re-sampled results (closed circles) and global minima (triangles); (D) averaged residue-dependent rate constants for single-field and multi-field GSIR results. Different residues are indicated by different colors, while shaded ellipses indicate the areas of minimized χ2s of re-sampled results.
Ijms 22 03517 g004
Figure 5. GSTR results are described: (A) Comparisons of χ2 minima under the different restraints (left), and the representative global χ2 map with minimum value of rate constant as indicated by asterix, * (right); (B) residue dependent optimized rate constants with minimized χ2 of re-sampled results (closed circles) and global minima (triangles); (C) 15N CPMG relaxation dispersion data for two representative residues, Asn173 and Tyr177 with R 2 C a l c lines based on GSTR; and (D) residue dependent optimized chemical shifts with minimized χ2 of re-sampled results (closed circles) and global minima (triangles). Different residues are indicated by different colors, while shaded ellipses indicate the areas of re-sampled results. * p < 0.05.
Ijms 22 03517 g005
Figure 6. Flow chart of the two-state fitting and the global search process for analyzing CPMG profiles of hZαADAR1 and the hZαADAR1–DNA complex.
Ijms 22 03517 g006
Table 1. Conformational exchange rate constants extracted by different methods are described.
kex (s−1)kZB (s−1)
Two-state832 ± 55-
GSIR638 ± 27710 ± 9
GSIR (800 MHz)401 ± 31811 ± 5.5
GSIR (900 MHz)615 ± 40811 ± 3.2
GSTR 1844 ± 41 (858)9.8 ± 0.8 (8.7)
1 Averaged values of rate constant with constraints k ± 0.25σ to 1.5σ and Δω ± 0.25x <Δω> (rate constant for the case with constraints: k ± σ and Δω ± 0.25x <Δω>).
Table 2. GSIR and global search for total residues (GSTR) results are presented. The chemical shifts were shown as the 800 MHz field cases. For GSTR: Averaged values of rate constant with constraints k ± 0.25σ to 1.5 σ and Δω ± 0.25x <Δω> (rate constant for the case with restraints: k ± σ and Δω ± 0.25x <Δω>).
GSIRGSTR
Residuekex (s−1)ΔωFB (Hz)kZB (s−1)ΔωBZ (Hz)kex (s−1)ΔωFB (Hz)kZB (s−1)ΔωBZ (Hz)
K1704503782.25807845 ± 41.3 (858)342 ± 14.0 (320)9.81 ± 0.75 (8.74)633 ± 62.1 (718)
E171111042410.11450385 ± 36.3 (430)1590 ± 145 (1740)
I1724072953.56827226 ± 22.9 (238)758 ± 83.9 (755)
N1739123969.931460407 ± 31.6 (446)1473 ± 128 (1340)
R17434389.37.8644085.8 ± 16.0 (85.9)419 ± 45.4 (424)
V17565631010.3915345 ± 14.1 (366)900 ± 79.7 (951)
Y1778853889.291440367 ± 45.8 (378)1404 ± 165 (1450)
S1789321618.62474143 ± 19.0 (169)456 ± 54.5 (416)
L17945822937.499.5264 ± 23.3 (233)176 ± 53.6 (248)
T1915383168.08836334 ± 27.7 (314)764 ± 90.1 (838)
K1963211646.79503144 ± 19.5 (128)483 ± 89.6 (542)
Publisher’s Note: MDPI stays neutral with regard to jurisdictional claims in published maps and institutional affiliations.

