
CLDN6 Suppresses c–MYC–Mediated Aerobic Glycolysis to Inhibit Proliferation by TAZ in Breast Cancer

Abstract
:1. Introduction
2. Results
2.1. Low CLDN6 Expression Is Connected with a Poor Prognosis of Breast Cancer Patients
2.2. CLDN6 Suppresses Breast Cancer Cell Proliferation In Vitro and In Vivo
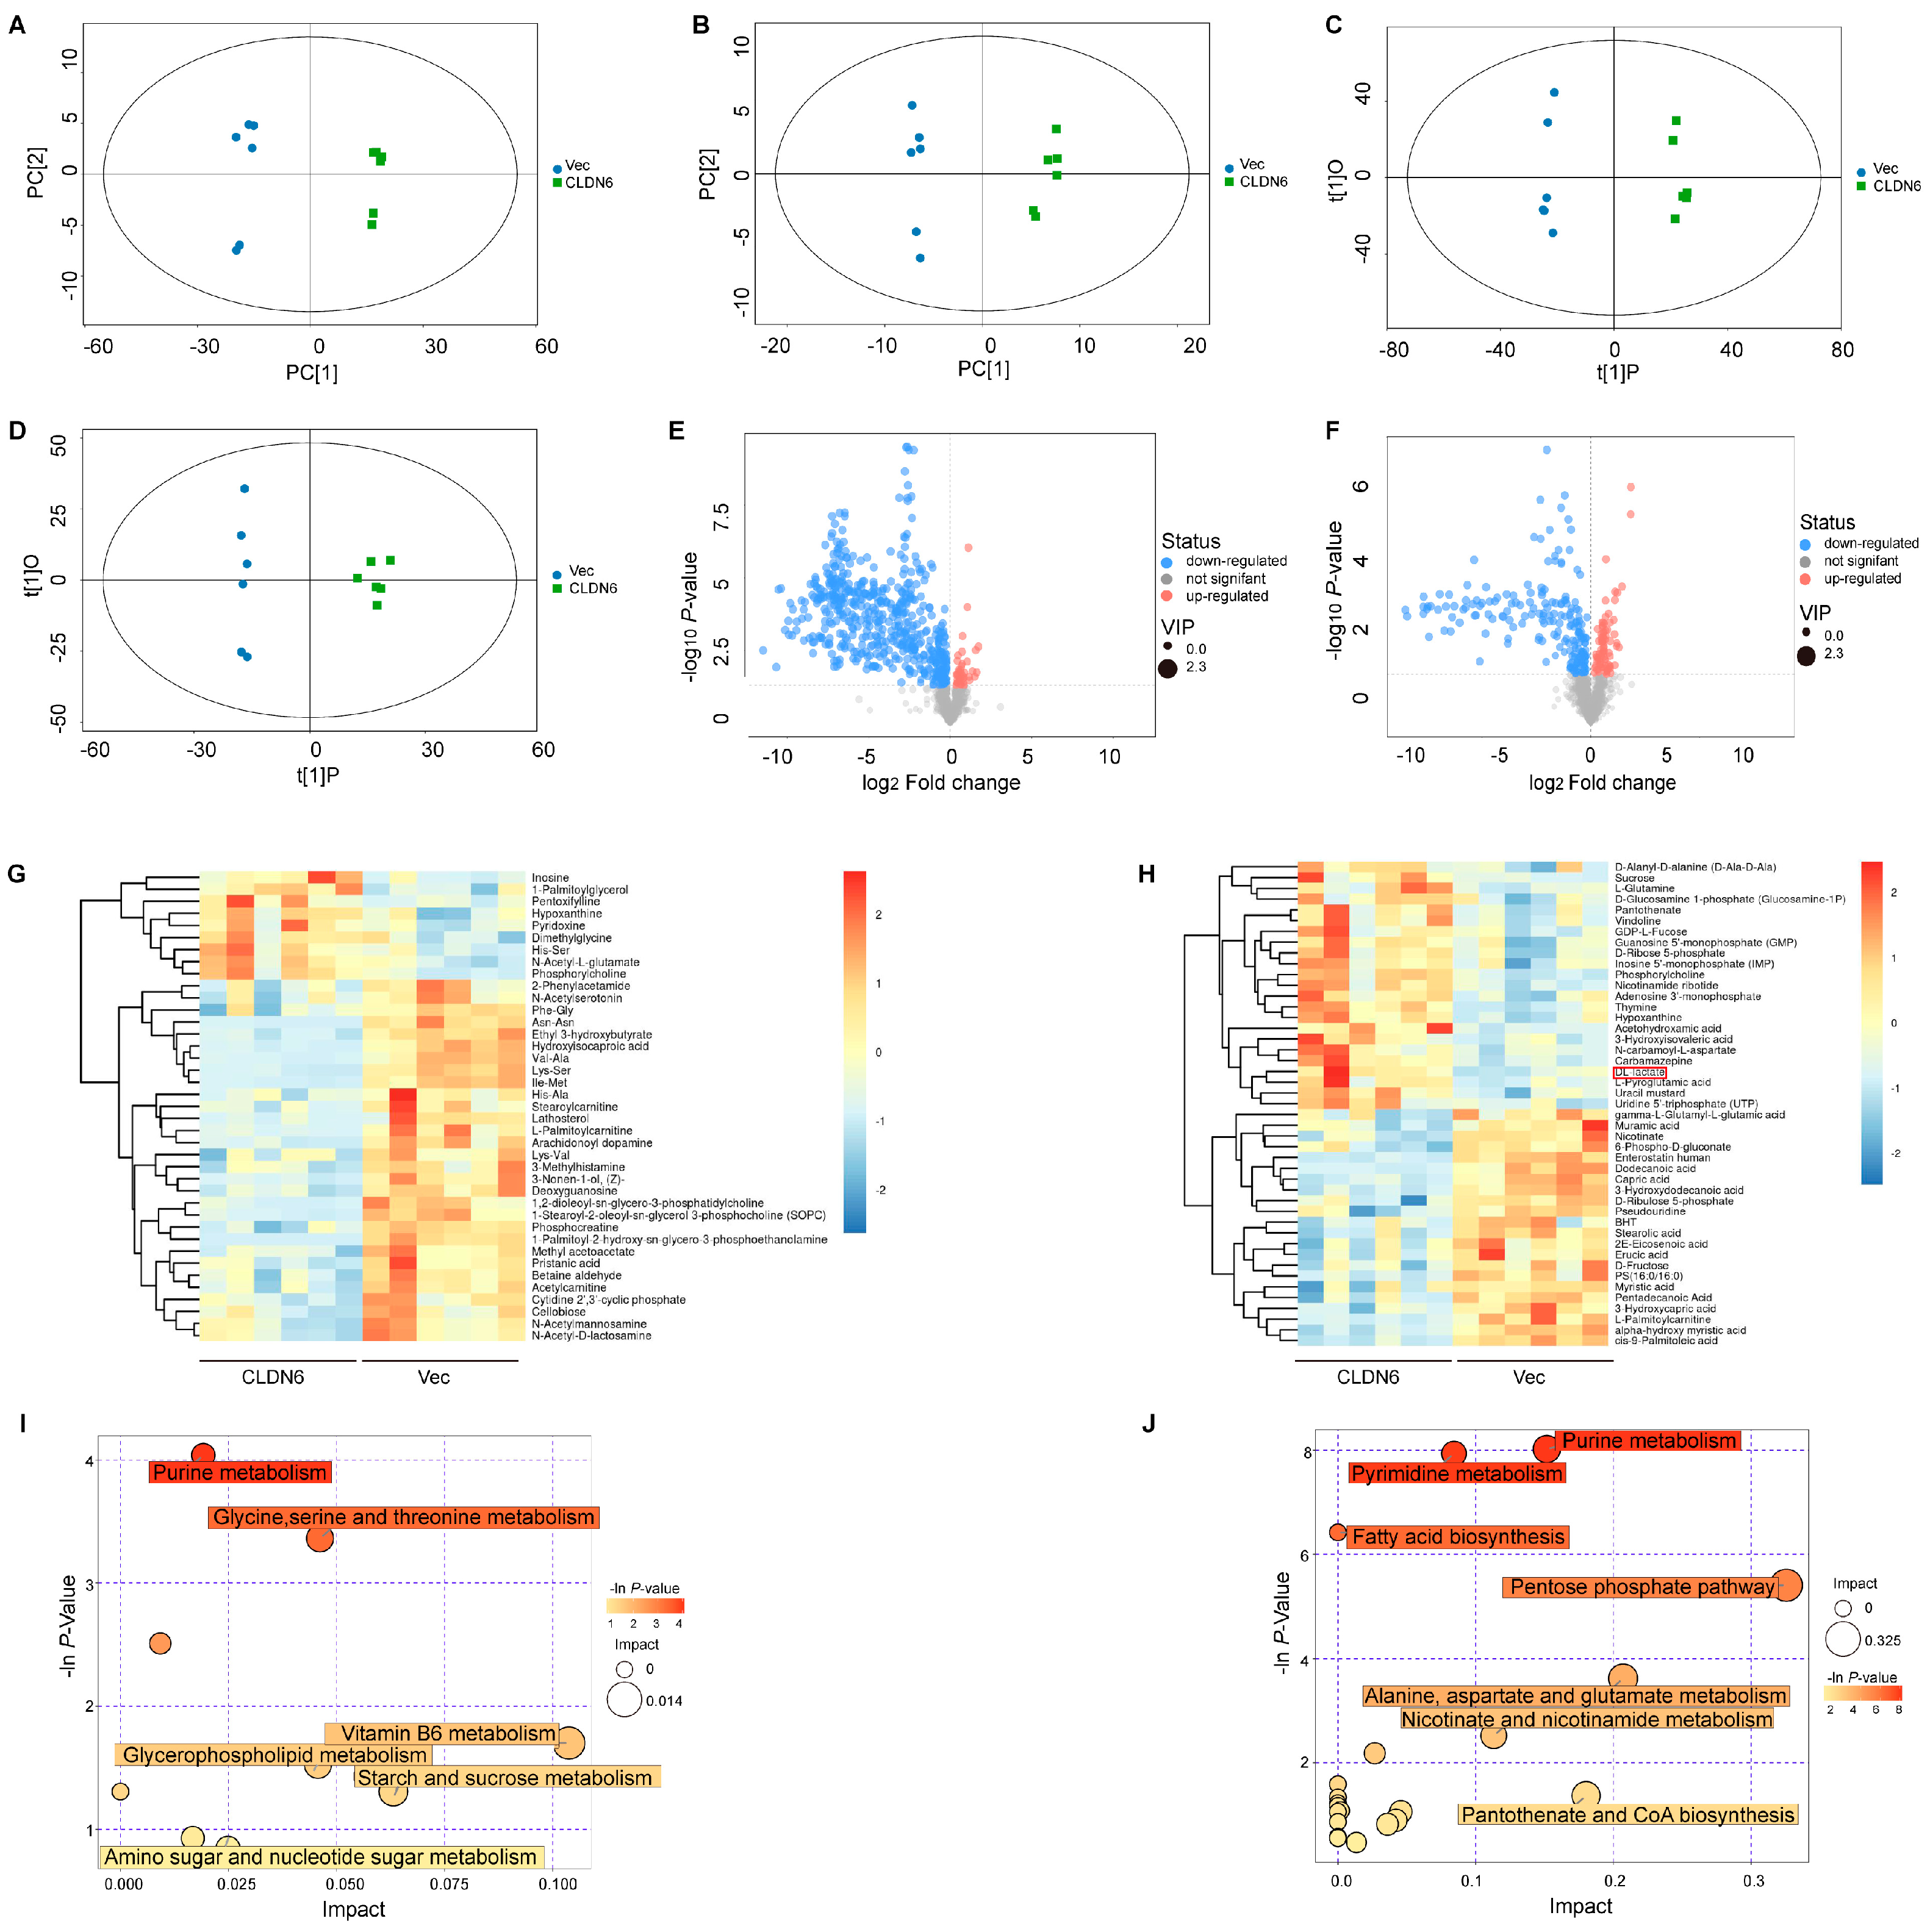
2.3. CLDN6 Induces Metabolomic Alterations in Breast Cancer Cells
2.4. CLDN6 Functions as a Negative Regulator of Aerobic Glycolysis in Breast Cancer Cells
2.5. CLDN6 Down–Regulates c–MYC–Mediated Aerobic Glycolysis
2.6. CLDN6 Inhibits Breast Cancer Cell Proliferation via c–MYC In Vitro and In Vivo
2.7. CLDN6 Inhibits the Transcription of c–MYC by Interacting with TAZ
2.8. The Expression of CLDN6, TAZ, and c–MYC Expression in Breast Cancer Patients and Xenografts Tissues in Nude Mice
3. Discussion
4. Materials and Methods
4.1. Immunohistochemistry (IHC)
4.2. Cell Culture
4.3. Transfection
4.4. RNA Extraction and RT–PCR
4.5. Western Blot (WB)
4.6. EdU Assay
4.7. Cell Counting Kit–8 (CCK8)
4.8. Plate Clone Formation Assay
4.9. In Vivo Tumor Xenograft Model
4.10. Sample Collection and Metabolomics Assay
4.11. Aerobic Glycolysis Measurement
4.12. Immunofluorescence (IF)
4.13. Co–Immunoprecipitation (Co–IP) Assay
4.14. Statistical Analysis
Supplementary Materials
Author Contributions
Funding
Institutional Review Board Statement
Informed Consent Statement
Data Availability Statement
Conflicts of Interest
References
- Runkle, E.A.; Mu, D. Tight junction proteins: From barrier to tumorigenesis. Cancer Lett. 2013, 337, 41–48. [Google Scholar] [CrossRef] [PubMed] [Green Version]
- Tsukita, S.; Tanaka, H.; Tamura, A. The Claudins: From Tight Junctions to Biological Systems. Trends Biochem. Sci. 2019, 44, 141–152. [Google Scholar] [CrossRef]
- Turksen, K.; Troy, T.C. Claudin-6: A novel tight junction molecule is developmentally regulated in mouse embryonic epithelium. Dev. Dyn. Off. Publ. Am. Assoc. Anat. 2001, 222, 292–300. [Google Scholar] [CrossRef]
- Turksen, K.; Troy, T.C. Permeability barrier dysfunction in transgenic mice overexpressing claudin 6. Development 2002, 129, 1775–1784. [Google Scholar] [CrossRef]
- Troy, T.C.; Rahbar, R.; Arabzadeh, A.; Cheung, R.M.; Turksen, K. Delayed epidermal permeability barrier formation and hair follicle aberrations in Inv-Cldn6 mice. Mech. Dev. 2005, 122, 805–819. [Google Scholar] [CrossRef]
- Kitajiri, S.I.; Furuse, M.; Morita, K.; Saishin-Kiuchi, Y.; Kido, H.; Ito, J.; Tsukita, S. Expression patterns of claudins, tight junction adhesion molecules, in the inner ear. Hear. Res. 2004, 187, 25–34. [Google Scholar] [CrossRef]
- Du, H.; Yang, X.; Fan, J.; Du, X. Claudin 6: Therapeutic prospects for tumours, and mechanisms of expression and regulation (Review). Mol. Med. Rep. 2021, 24, 1–9. [Google Scholar] [CrossRef]
- Jia, Y.; Guo, Y.; Jin, Q.; Qu, H.; Qi, D.; Song, P.; Zhang, X.; Wang, X.; Xu, W.; Dong, Y.; et al. A SUMOylation-dependent HIF-1α/CLDN6 negative feedback mitigates hypoxia-induced breast cancer metastasis. J. Exp. Clin. Cancer Res. 2020, 39, 42. [Google Scholar] [CrossRef] [Green Version]
- Song, P.; Li, Y.; Dong, Y.; Liang, Y.; Qu, H.; Qi, D.; Lu, Y.; Jin, X.; Guo, Y.; Jia, Y.; et al. Estrogen receptor β inhibits breast cancer cells migration and invasion through CLDN6-mediated autophagy. J. Exp. Clin. Cancer Res. CR 2019, 38, 354. [Google Scholar] [CrossRef] [PubMed] [Green Version]
- Yang, M.; Li, Y.; Ruan, Y.; Lu, Y.; Lin, D.; Xie, Y.; Dong, B.; Dang, Q.; Quan, C. CLDN6 enhances chemoresistance to ADM via AF-6/ERKs pathway in TNBC cell line MDAMB231. Mol. Cell. Biochem. 2018, 443, 169–180. [Google Scholar] [CrossRef]
- Wu, Q.; Liu, Y.; Ren, Y.; Xu, X.; Yu, L.; Li, Y.; Quan, C. Tight junction protein, claudin-6, downregulates the malignant phenotype of breast carcinoma. Eur. J. Cancer Prev.: Off. J. Eur. Cancer Prev. Organ. (ECP) 2010, 19, 186–194. [Google Scholar] [CrossRef]
- Yin, J.; Ren, W.; Huang, X.; Deng, J.; Li, T.; Yin, Y. Potential Mechanisms Connecting Purine Metabolism and Cancer Therapy. Front. Immunol. 2018, 9, 1697. [Google Scholar] [CrossRef] [PubMed] [Green Version]
- Lunt, S.Y.; Vander Heiden, M.G. Aerobic glycolysis: Meeting the metabolic requirements of cell proliferation. Annu. Rev. Cell Dev. Biol. 2011, 27, 441–464. [Google Scholar] [CrossRef] [Green Version]
- Dang, C.V. MYC on the path to cancer. Cell 2012, 149, 22–35. [Google Scholar] [CrossRef] [PubMed] [Green Version]
- Feng, M.; Xiong, G.; Cao, Z.; Yang, G.; Zheng, S.; Qiu, J.; You, L.; Zheng, L.; Zhang, T.; Zhao, Y. LAT2 regulates glutamine-dependent mTOR activation to promote glycolysis and chemoresistance in pancreatic cancer. J. Exp. Clin. Cancer Res. CR 2018, 37, 274. [Google Scholar] [CrossRef] [Green Version]
- Nagao, A.; Kobayashi, M.; Koyasu, S.; Chow, C.C.T.; Harada, H. HIF-1-Dependent Reprogramming of Glucose Metabolic Pathway of Cancer Cells and Its Therapeutic Significance. Int. J. Mol. Sci. 2019, 20, 238. [Google Scholar] [CrossRef] [Green Version]
- Osthus, R.C.; Shim, H.; Kim, S.; Li, Q.; Reddy, R.; Mukherjee, M.; Xu, Y.; Wonsey, D.; Lee, L.A.; Dang, C.V. Deregulation of glucose transporter 1 and glycolytic gene expression by c–MYC. J. Biol. Chem. 2000, 275, 21797–21800. [Google Scholar] [CrossRef] [PubMed] [Green Version]
- Liang, T.; Ye, X.; Yan, D.; Deng, C.; Li, Z.; Tian, B. FAM46B Promotes Apoptosis and Inhibits Glycolysis of Prostate Cancer through Inhibition of the MYC-LDHA Axis. OncoTargets Ther. 2020, 13, 8771–8782. [Google Scholar] [CrossRef]
- Holden, J.K.; Cunningham, C.N. Targeting the Hippo Pathway and Cancer through the TEAD Family of Transcription Factors. Cancers 2018, 10, 81. [Google Scholar] [CrossRef] [Green Version]
- Huh, H.D.; Kim, D.H.; Jeong, H.S.; Park, H.W. Regulation of TEAD Transcription Factors in Cancer Biology. Cells 2019, 8, 600. [Google Scholar] [CrossRef] [Green Version]
- Chan, S.W.; Lim, C.J.; Guo, K.; Ng, C.P.; Lee, I.; Hunziker, W.; Zeng, Q.; Hong, W. A role for TAZ in migration, invasion, and tumorigenesis of breast cancer cells. Cancer Res. 2008, 68, 2592–2598. [Google Scholar] [CrossRef] [Green Version]
- Wu, D.; Jia, H.; Zhang, Z.; Li, S. Circ_0000511 accelerates the proliferation, migration and invasion, and restrains the apoptosis of breast cancer cells through the miR-326/TAZ axis. Int. J. Oncol. 2021, 58, 1. [Google Scholar] [CrossRef] [PubMed]
- Sugimoto, K.; Ichikawa-Tomikawa, N.; Kashiwagi, K.; Endo, C.; Tanaka, S.; Sawada, N.; Watabe, T.; Higashi, T.; Chiba, H. Cell adhesion signals regulate the nuclear receptor activity. Proc. Natl. Acad. Sci. USA 2019, 116, 24600–24609. [Google Scholar] [CrossRef] [PubMed]
- Reinhard, K.; Rengstl, B.; Oehm, P.; Michel, K.; Billmeier, A.; Hayduk, N.; Klein, O.; Kuna, K.; Ouchan, Y.; Wöll, S.; et al. An RNA vaccine drives expansion and efficacy of claudin-CAR-T cells against solid tumors. Science 2020, 367, 446–453. [Google Scholar] [CrossRef] [PubMed]
- Kong, F.E.; Li, G.M.; Tang, Y.Q.; Xi, S.Y.; Loong, J.H.C.; Li, M.M.; Li, H.L.; Cheng, W.; Zhu, W.J.; Mo, J.Q.; et al. Targeting tumor lineage plasticity in hepatocellular carcinoma using an anti-CLDN6 antibody-drug conjugate. Sci. Transl. Med. 2021, 13. [Google Scholar] [CrossRef]
- Stadler, C.R.; Bähr-Mahmud, H.; Plum, L.M.; Schmoldt, K.; Kölsch, A.C.; Türeci, Ö.; Sahin, U. Characterization of the first-in-class T-cell-engaging bispecific single-chain antibody for targeted immunotherapy of solid tumors expressing the oncofetal protein claudin 6. Oncoimmunology 2016, 5, e1091555. [Google Scholar] [CrossRef] [PubMed] [Green Version]
- Zhang, C.; Guo, C.; Li, Y.; Liu, K.; Zhao, Q.; Ouyang, L. Identification of Claudin-6 as a Molecular Biomarker in Pan-Cancer Through Multiple Omics Integrative Analysis. Front. Cell Dev. Biol. 2021, 9, 726656. [Google Scholar] [CrossRef]
- Yu, S.; Zhang, Y.; Li, Q.; Zhang, Z.; Zhao, G.; Xu, J. CLDN6 promotes tumor progression through the YAP1-snail1 axis in gastric cancer. Cell Death Dis. 2019, 10, 949. [Google Scholar] [CrossRef] [Green Version]
- Lu, Y.; Dang, Q.; Bo, Y.; Su, X.; Wang, L.; Sun, J.; Wei, J.; Quan, C.; Li, Y. The Expression of CLDN6 in Hepatocellular Carcinoma Tissue and the Effects of CLDN6 on Biological Phenotypes of Hepatocellular Carcinoma Cells. J. Cancer 2021, 12, 5454–5463. [Google Scholar] [CrossRef] [PubMed]
- Huang, L.; Zhao, C.; Sun, K.; Yang, D.; Yan, L.; Luo, D.; He, J.; Hu, X.; Wang, R.; Shen, X.; et al. Downregulation of CLDN6 inhibits cell proliferation, migration, and invasion via regulating EGFR/AKT/mTOR signalling pathway in hepatocellular carcinoma. Cell Biochem. Funct. 2020, 38, 541–548. [Google Scholar] [CrossRef]
- Cao, X.; He, G.Z. Knockdown of CLDN6 inhibits cell proliferation and migration via PI3K/AKT/mTOR signaling pathway in endometrial carcinoma cell line HEC-1-B. OncoTargets Ther. 2018, 11, 6351–6360. [Google Scholar] [CrossRef] [PubMed] [Green Version]
- Jia, H.; Chai, X.; Li, S.; Wu, D.; Fan, Z. Identification of claudin-2, -6, -11 and -14 as prognostic markers in human breast carcinoma. Int. J. Clin. Exp. Pathol. 2019, 12, 2195–2204. [Google Scholar] [PubMed]
- Liu, Y.; Jin, X.; Li, Y.; Ruan, Y.; Lu, Y.; Yang, M.; Lin, D.; Song, P.; Guo, Y.; Zhao, S.; et al. DNA methylation of claudin-6 promotes breast cancer cell migration and invasion by recruiting MeCP2 and deacetylating H3Ac and H4Ac. J. Exp. Clin. Cancer Res. CR 2016, 35, 120. [Google Scholar] [CrossRef] [PubMed] [Green Version]
- Hanahan, D.; Weinberg, R.A. Hallmarks of cancer: The next generation. Cell 2011, 144, 646–674. [Google Scholar] [CrossRef] [Green Version]
- Kim, J.H.; Kim, E.L.; Lee, Y.K.; Park, C.B.; Kim, B.W.; Wang, H.J.; Yoon, C.H.; Lee, S.J.; Yoon, G. Decreased lactate dehydrogenase B expression enhances claudin 1-mediated hepatoma cell invasiveness via mitochondrial defects. Exp. Cell Res. 2011, 317, 1108–1118. [Google Scholar] [CrossRef]
- Lee, Y.K.; Lim, J.J.; Jeoun, U.W.; Min, S.; Lee, E.B.; Kwon, S.M.; Lee, C.; Yoon, G. Lactate-mediated mitoribosomal defects impair mitochondrial oxidative phosphorylation and promote hepatoma cell invasiveness. J. Biol. Chem. 2017, 292, 20208–20217. [Google Scholar] [CrossRef] [Green Version]
- Luengo, A.; Gui, D.Y.; Vander Heiden, M.G. Targeting Metabolism for Cancer Therapy. Cell Chem. Biol. 2017, 24, 1161–1180. [Google Scholar] [CrossRef] [Green Version]
- Ji, H.; Ding, X.; Zhang, W.; Zheng, Y.; Du, H.; Zheng, Y.; Song, H.; Li, M.; Jiang, Y.; Xie, J.; et al. Claudin-7 Inhibits Proliferation and Metastasis in Salivary Adenoid Cystic Carcinoma Through Wnt/β-Catenin Signaling. Cell Transplant. 2020, 29, 963689720943583. [Google Scholar] [CrossRef]
- Che, J.; Yue, D.; Zhang, B.; Zhang, H.; Huo, Y.; Gao, L.; Zhen, H.; Yang, Y.; Cao, B. Claudin-3 Inhibits Lung Squamous Cell Carcinoma Cell Epithelial-mesenchymal Transition and Invasion via Suppression of the Wnt/β-catenin Signaling Pathway. Int. J. Med Sci. 2018, 15, 339–351. [Google Scholar] [CrossRef] [Green Version]
- Zhou, B.; Flodby, P.; Luo, J.; Castillo, D.R.; Liu, Y.; Yu, F.X.; McConnell, A.; Varghese, B.; Li, G.; Chimge, N.O.; et al. Claudin-18-mediated YAP activity regulates lung stem and progenitor cell homeostasis and tumorigenesis. J. Clin. Investig. 2018, 128, 970–984. [Google Scholar] [CrossRef] [Green Version]
- Kumar, B.; Ahmad, R.; Giannico, G.A.; Zent, R.; Talmon, G.A.; Harris, R.C.; Clark, P.E.; Lokeshwar, V.; Dhawan, P.; Singh, A.B. Claudin-2 inhibits renal clear cell carcinoma progression by inhibiting YAP-activation. J. Exp. Clin. Cancer Res. CR 2021, 40, 77. [Google Scholar] [CrossRef]
- Mohajan, S.; Jaiswal, P.K.; Vatanmakarian, M.; Yousefi, H.; Sankaralingam, S.; Alahari, S.K.; Koul, S.; Koul, H.K. Hippo pathway: Regulation, deregulation and potential therapeutic targets in cancer. Cancer Lett. 2021, 507, 112–123. [Google Scholar] [CrossRef] [PubMed]
- Byun, M.R.; Hwang, J.-H.; Kim, A.R.; Kim, K.M.; Park, J.I.; Oh, H.T.; Hwang, E.S.; Hong, J.-H. SRC activates TAZ for intestinal tumorigenesis and regeneration. Cancer Lett. 2017, 410, 32–40. [Google Scholar] [CrossRef] [PubMed]
- Yang, M.; Li, Y.; Shen, X.; Ruan, Y.; Lu, Y.; Jin, X.; Song, P.; Guo, Y.; Zhang, X.; Qu, H.; et al. CLDN6 promotes chemoresistance through GSTP1 in human breast cancer. J. Exp. Clin. Cancer Res. CR 2017, 36, 157. [Google Scholar] [CrossRef] [Green Version]
- Jin, X.; Li, Y.; Guo, Y.; Jia, Y.; Qu, H.; Lu, Y.; Song, P.; Zhang, X.; Shao, Y.; Qi, D.; et al. ERα is required for suppressing OCT4-induced proliferation of breast cancer cells via DNMT1/ISL1/ERK axis. Cell Prolif. 2019, 52, e12612. [Google Scholar] [CrossRef] [PubMed]

 CLDN6 overexpression.
CLDN6 overexpression.
CLDN6 overexpression.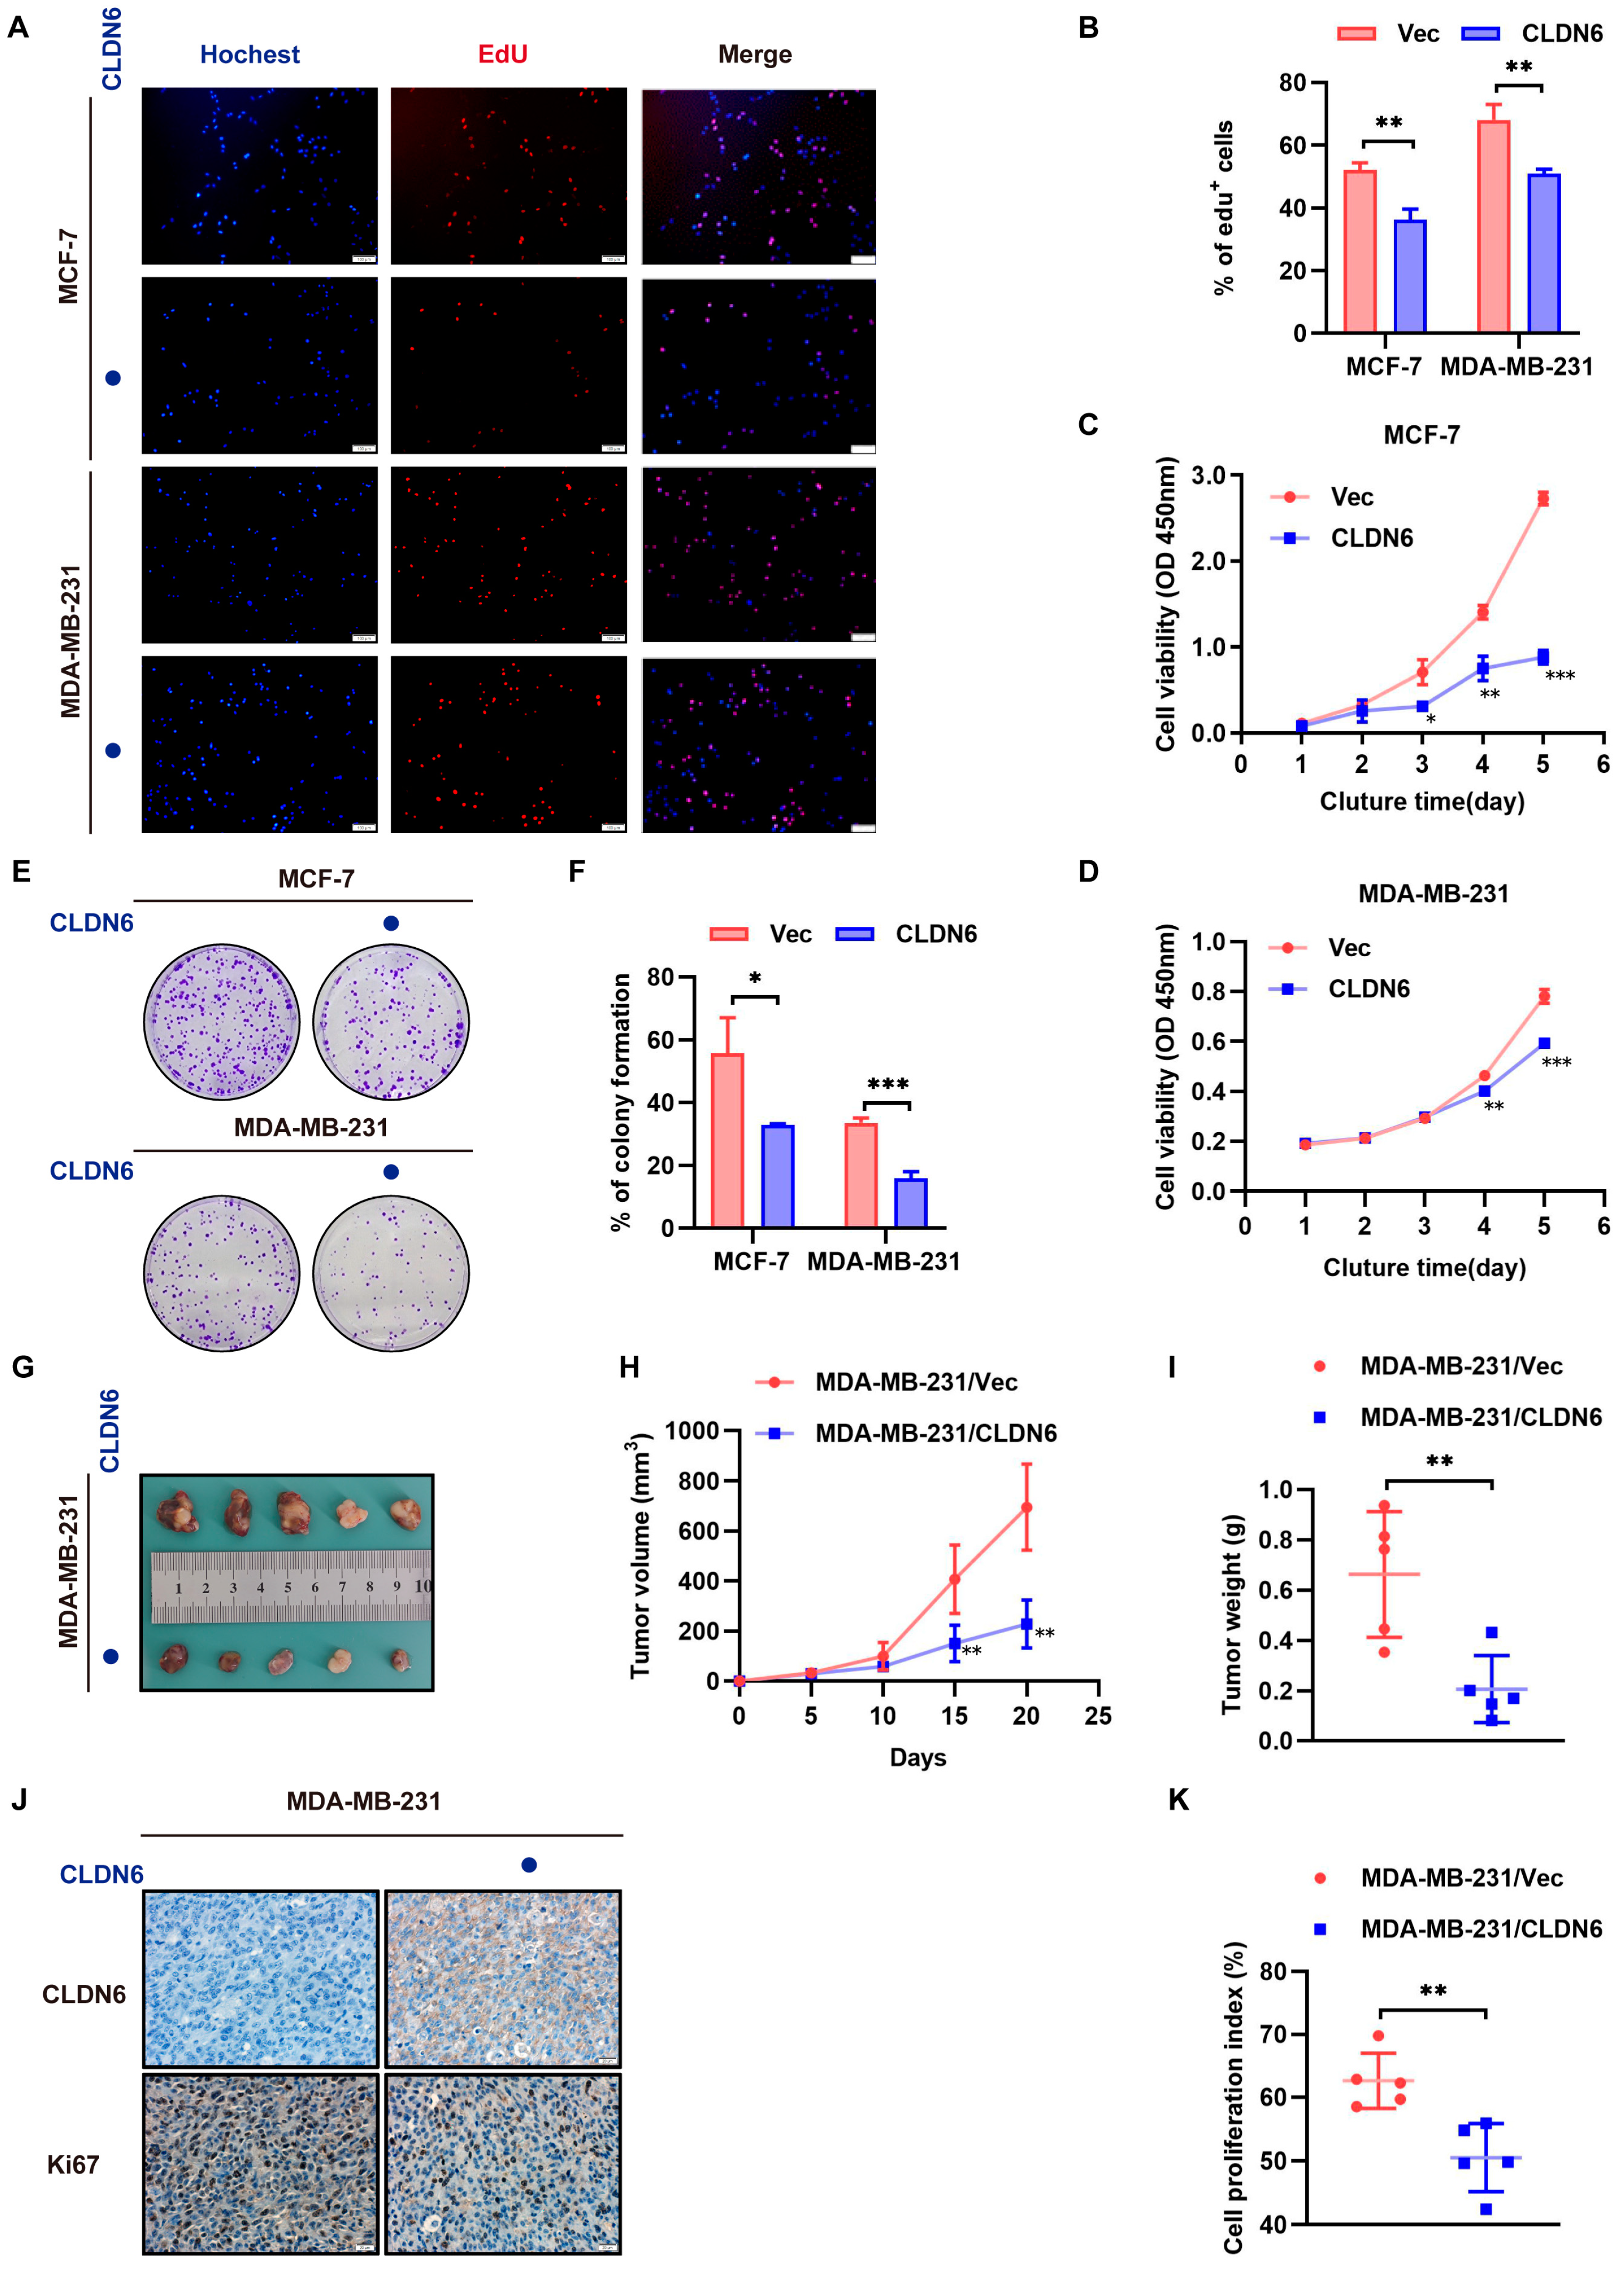
 CLDN6 or c–MYC overexpression.
CLDN6 or c–MYC overexpression.
CLDN6 or c–MYC overexpression.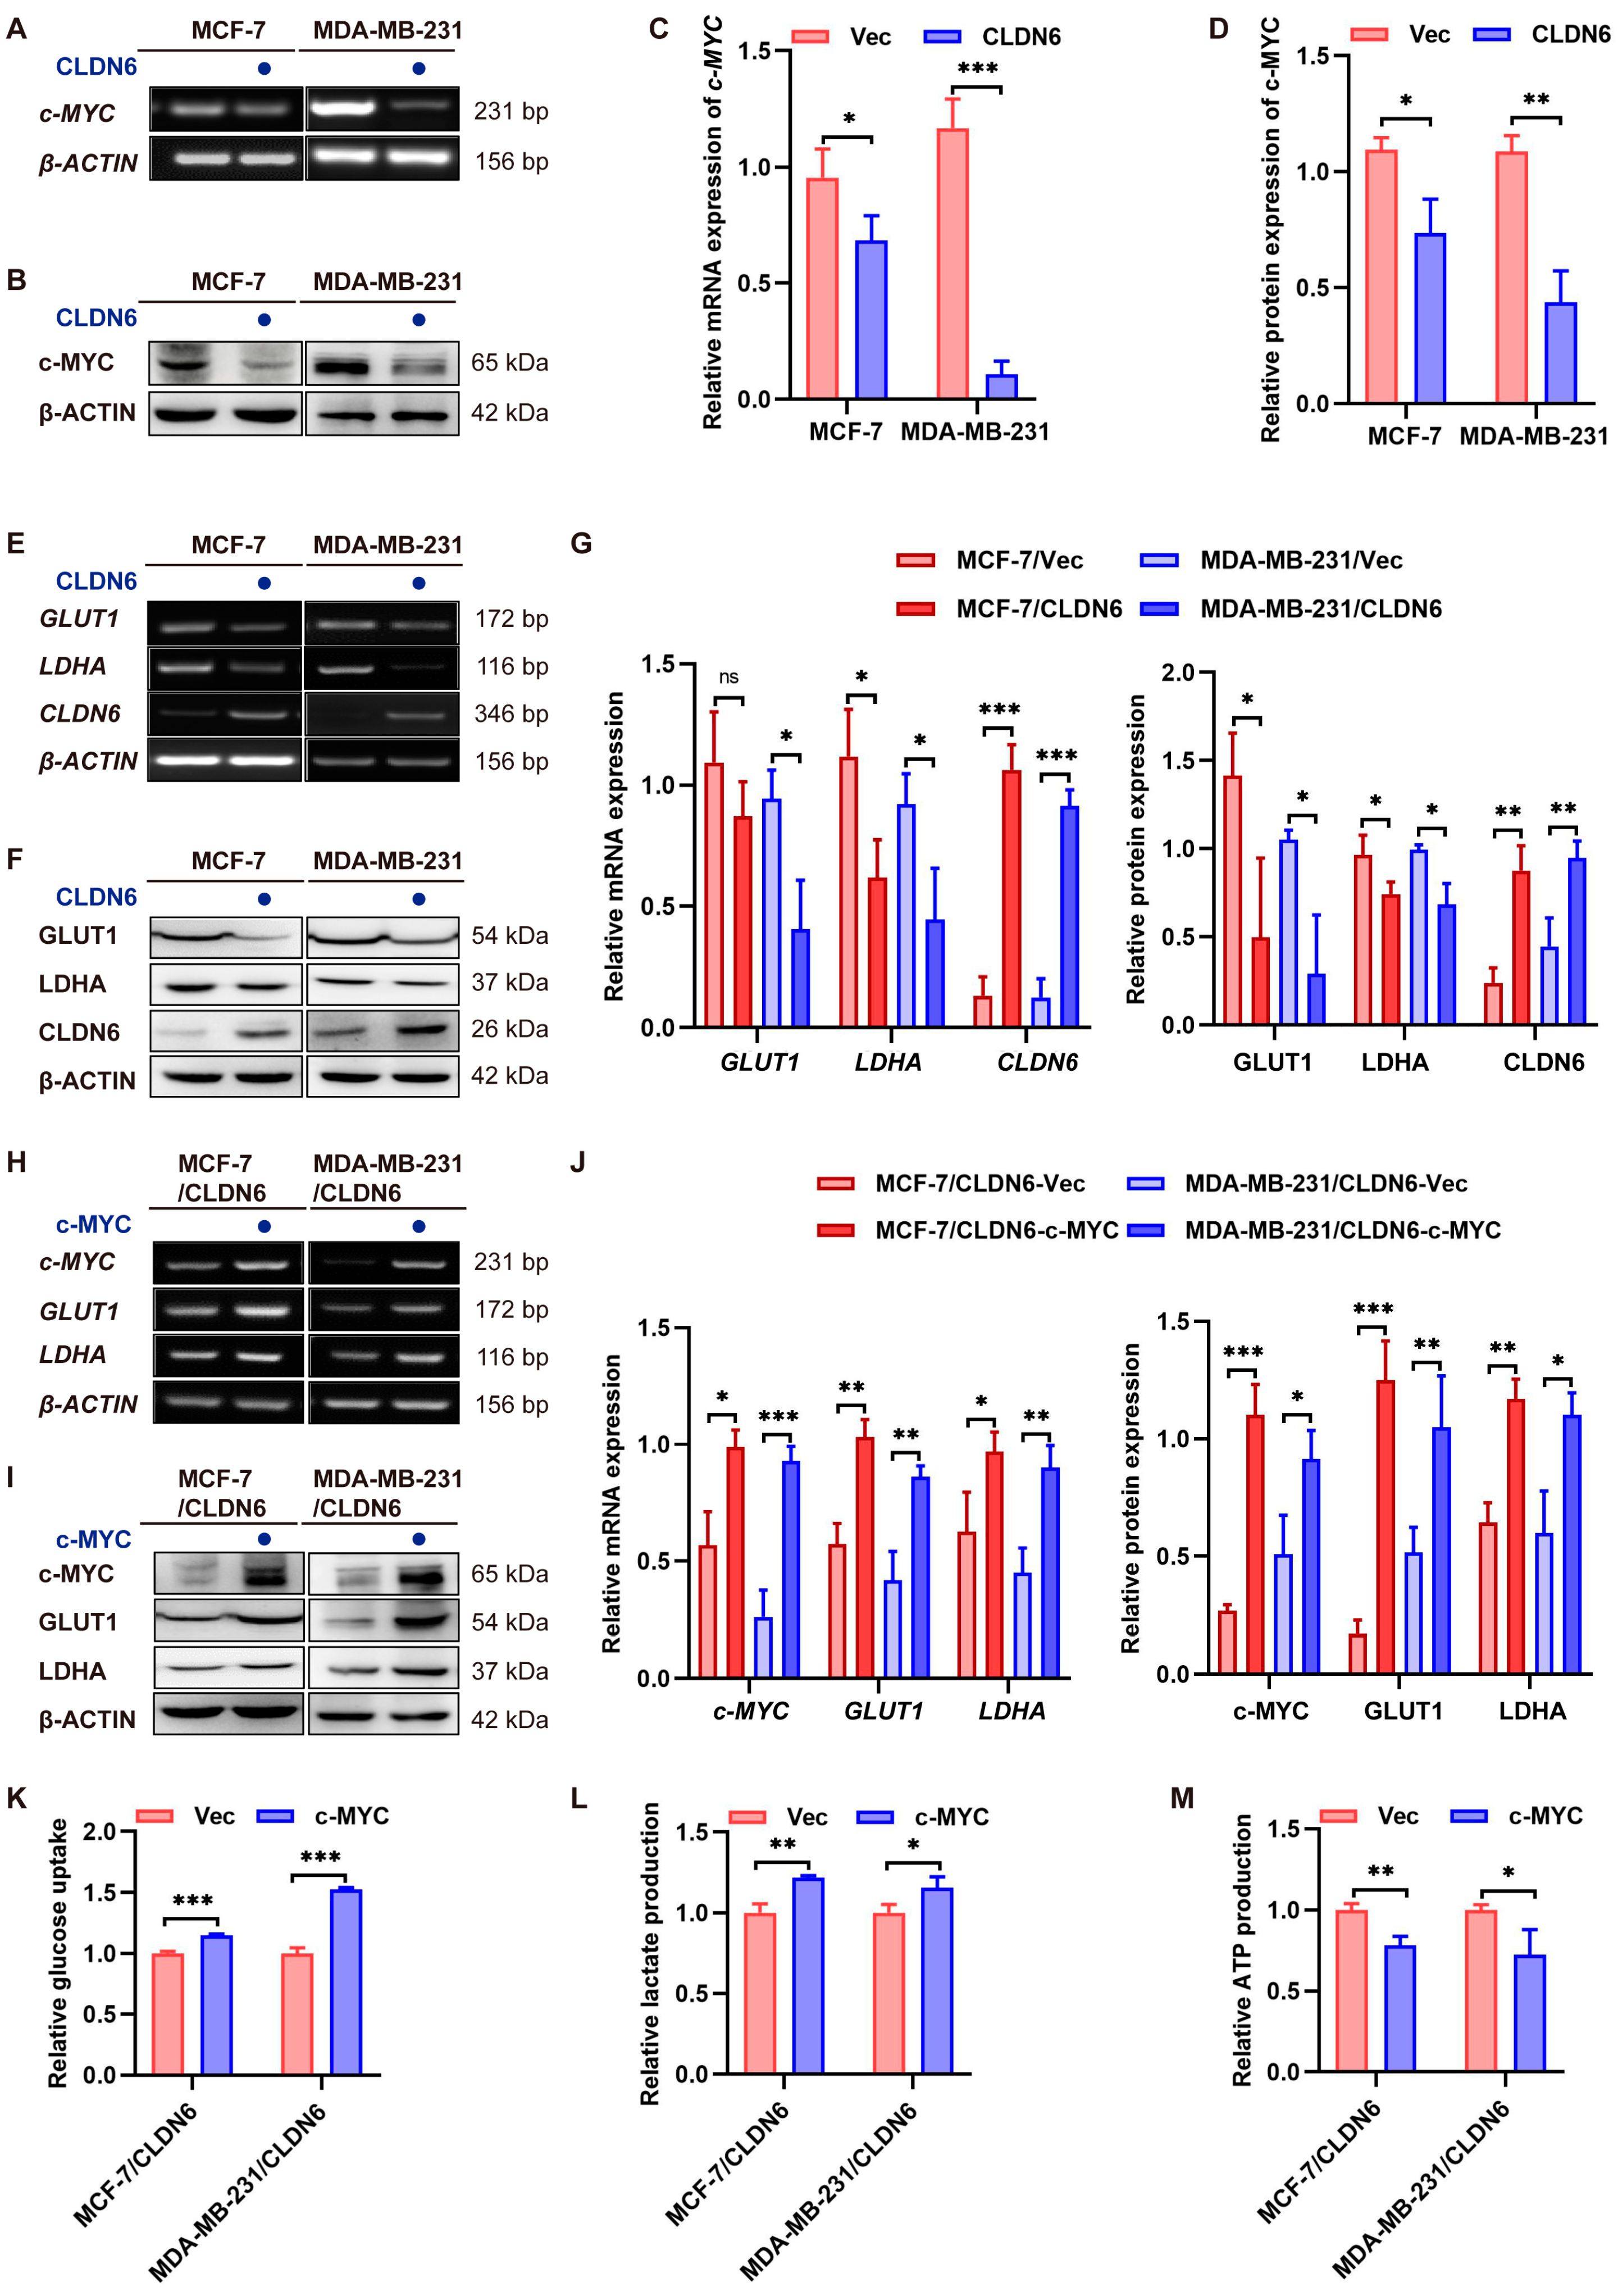 c–MYC overexpression.
c–MYC overexpression.
c–MYC overexpression. CLDN6 overexpression.
CLDN6 overexpression.
CLDN6 overexpression.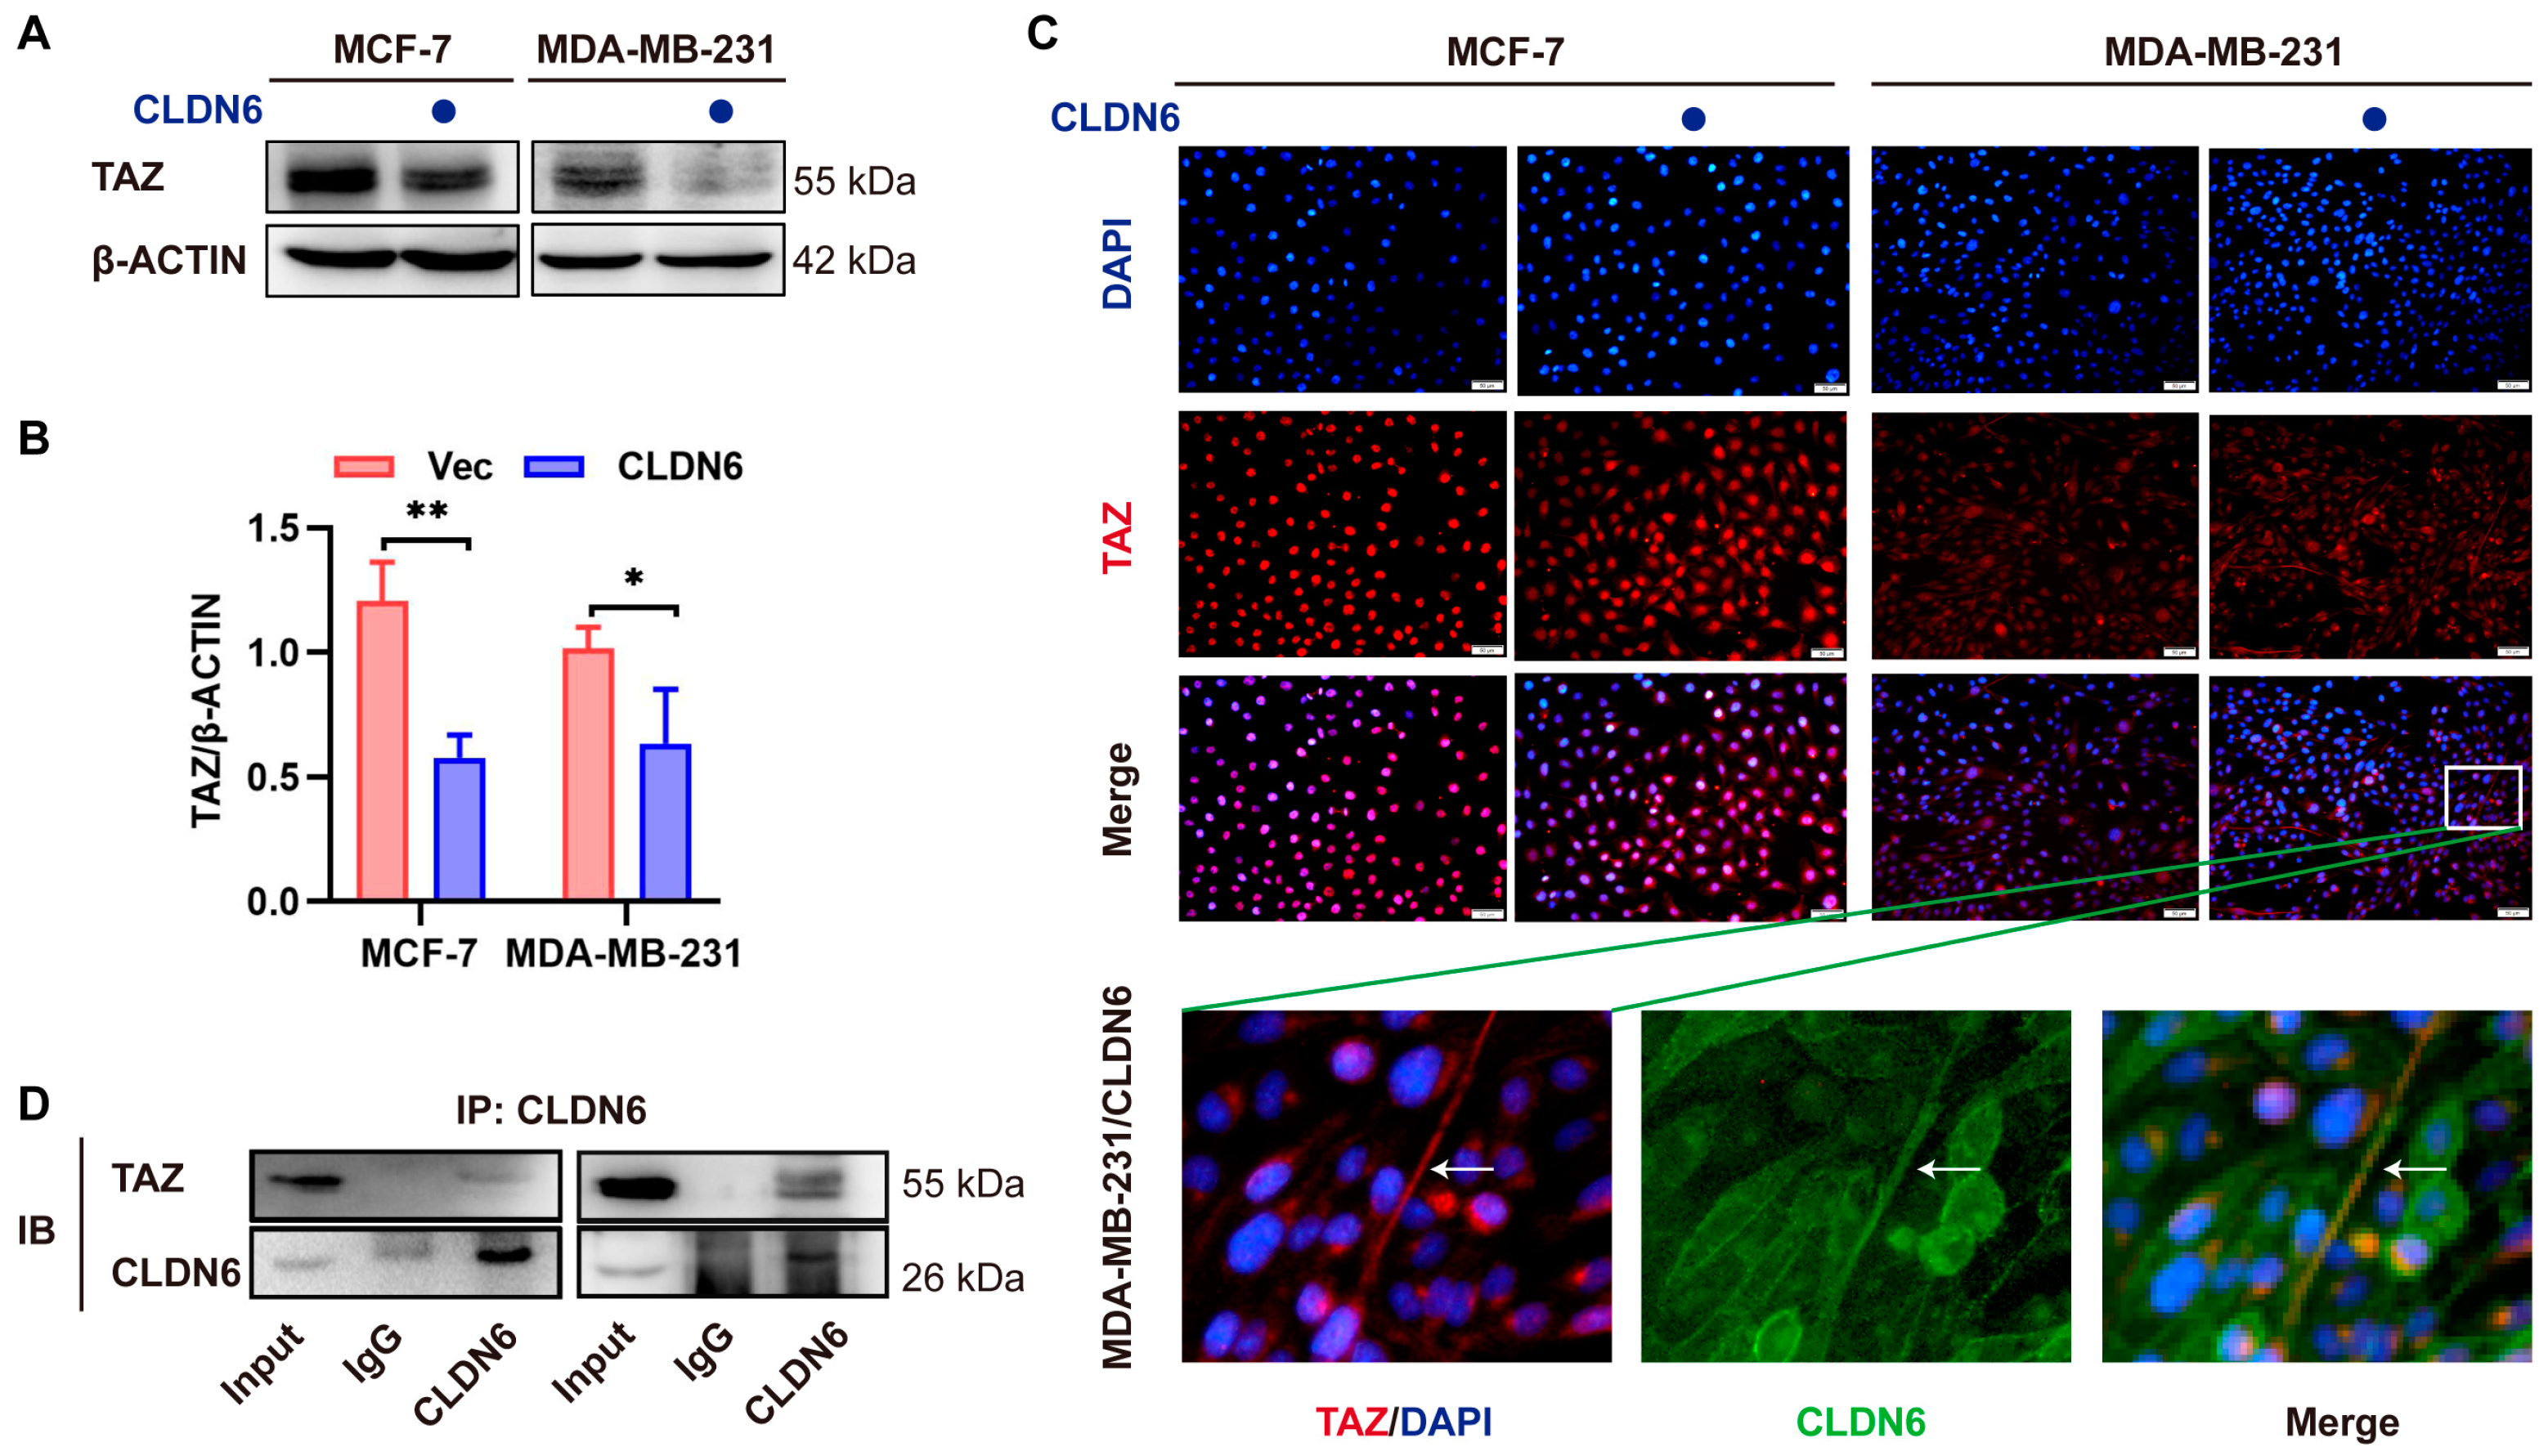 CLDN6 overexpression.
CLDN6 overexpression.
CLDN6 overexpression.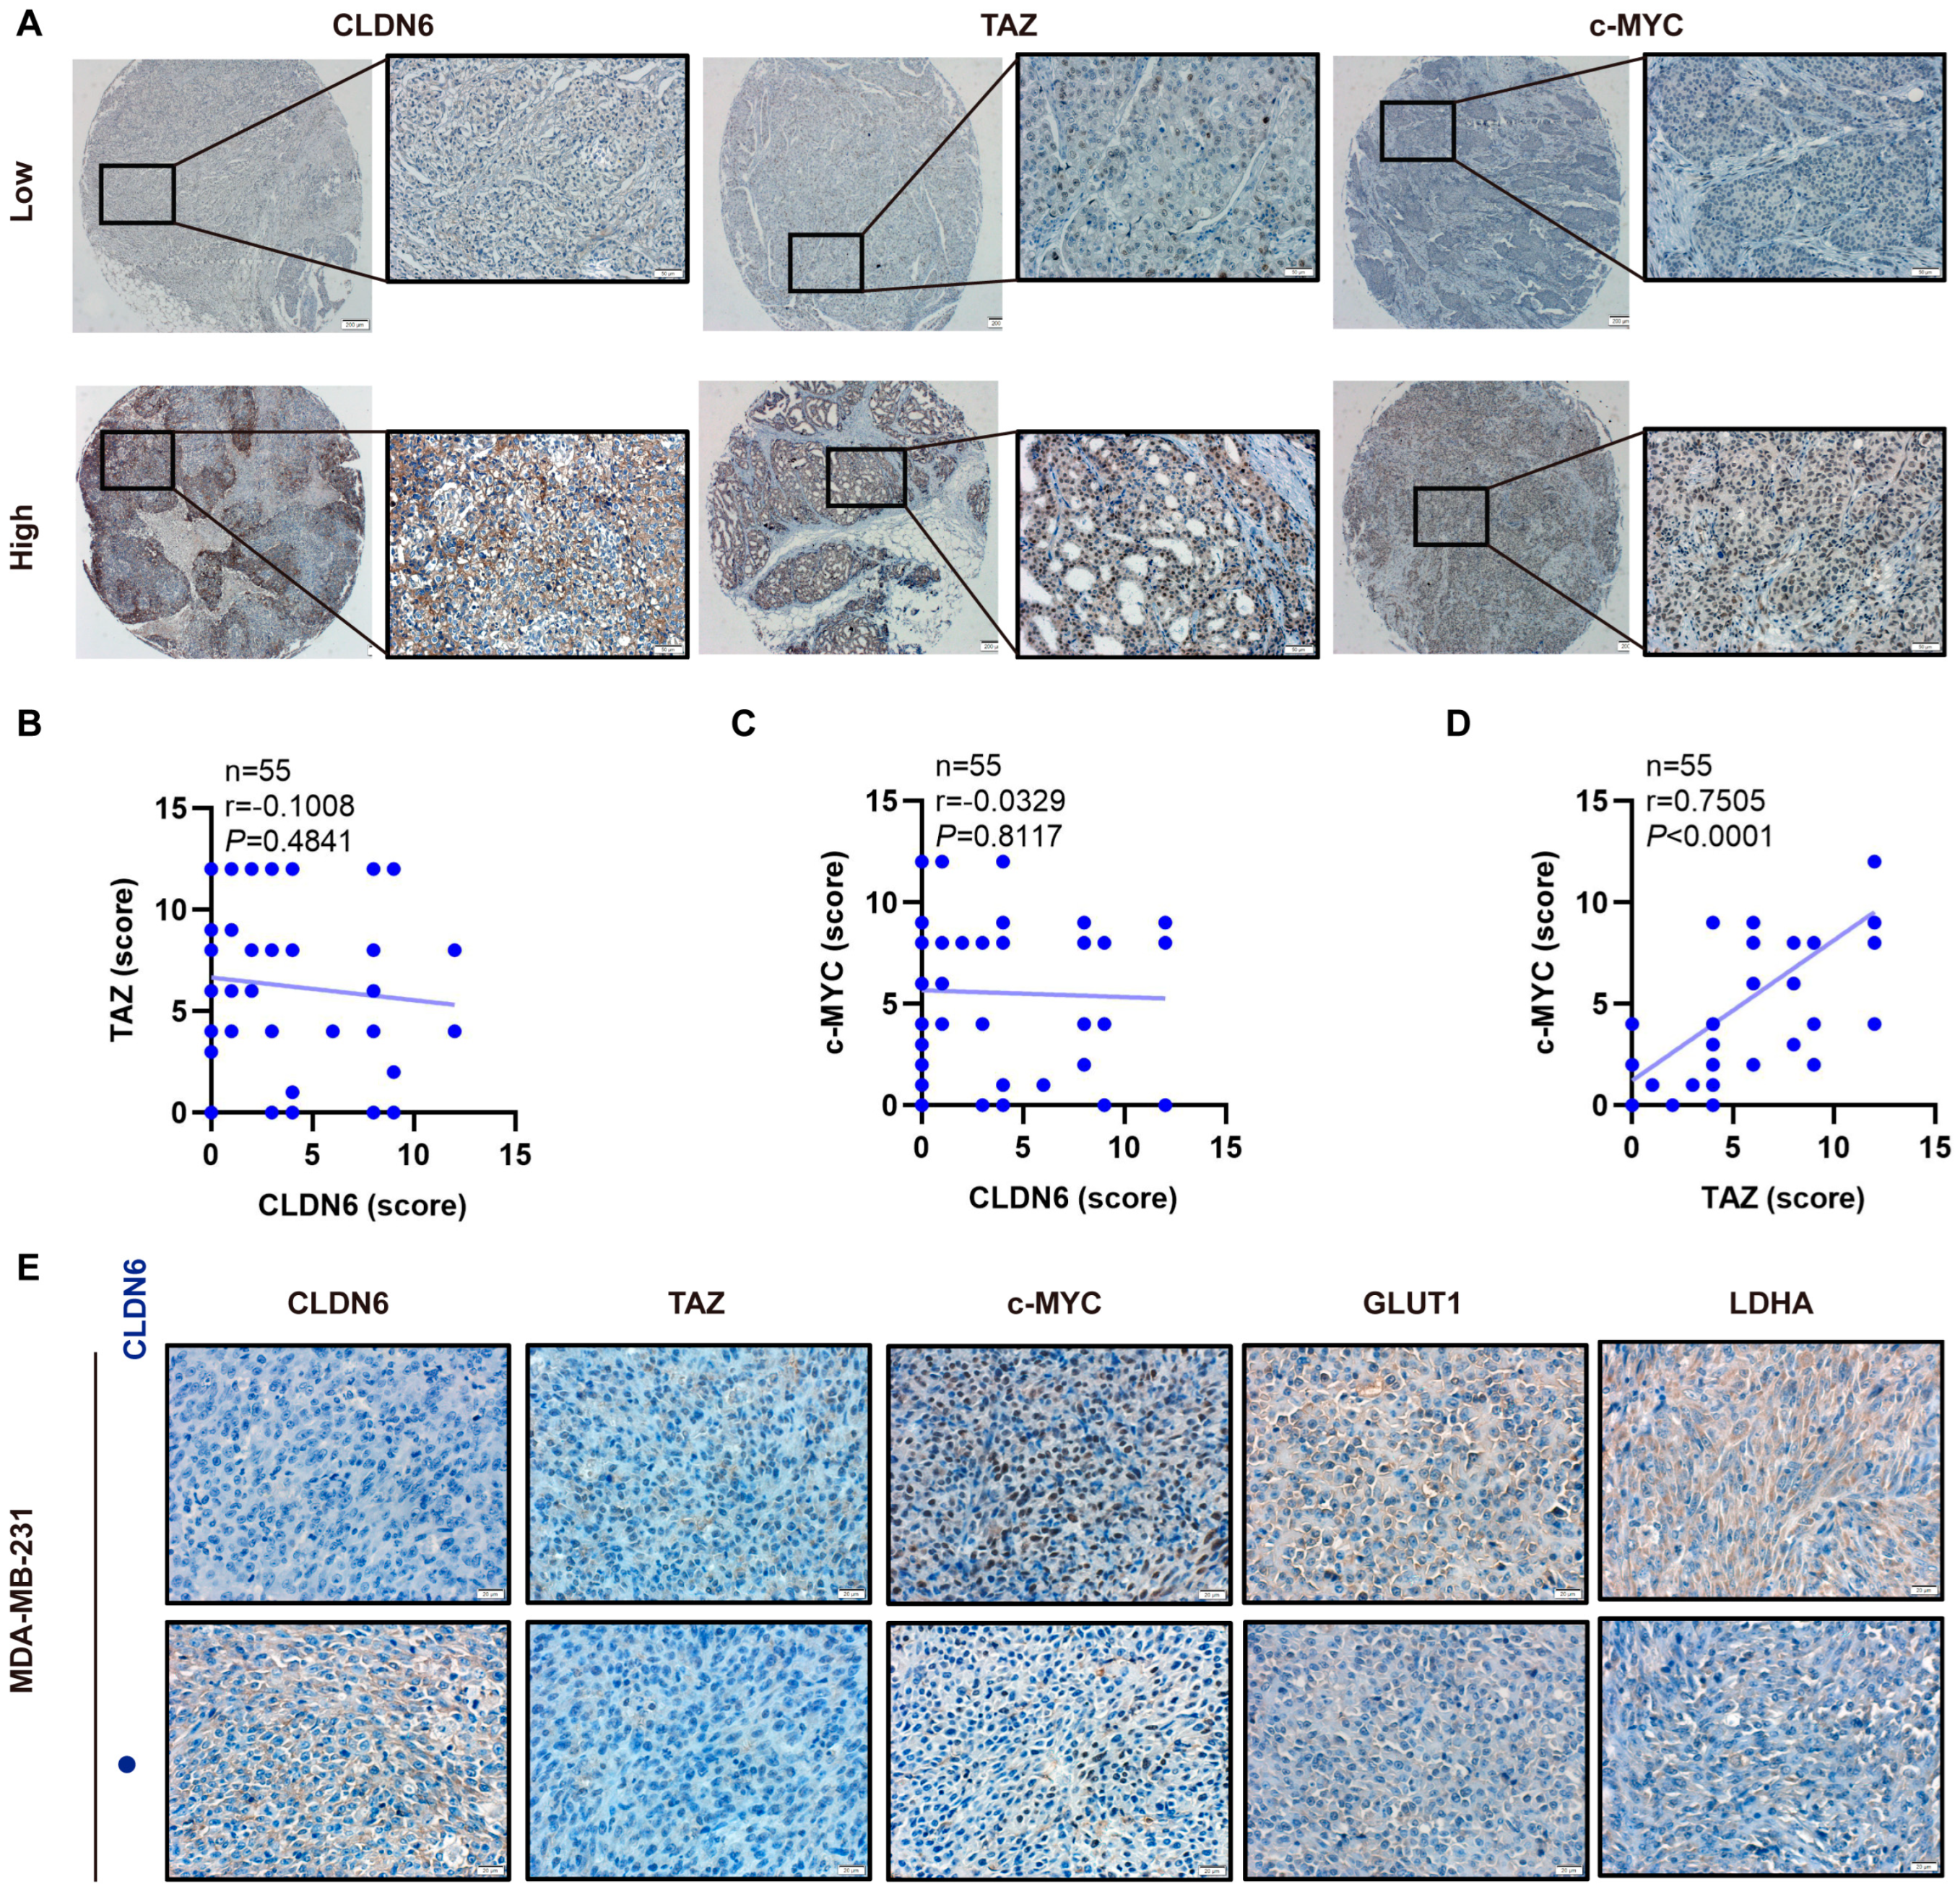

| Clinicopathologic Features | CLDN6 | TAZ | c–MYC | ||||||
|---|---|---|---|---|---|---|---|---|---|
| Low | High | p | Low | High | p | Low | High | p | |
| Age | 0.2048 | 0.1428 | 0.1517 | ||||||
| ≤57 years | 21 | 5 | 11 | 15 | 13 | 13 | |||
| >57 years | 19 | 10 | 18 | 11 | 20 | 9 | |||
| Tumor size | 0.6504 | 0.5509 | 0.4277 | ||||||
| ≤3 cm | 24 | 10 | 19 | 15 | 19 | 15 | |||
| >3 cm | 16 | 5 | 10 | 11 | 14 | 7 | |||
| Lymph node | 0.2164 | 0.3777 | 0.0364 * | ||||||
| Negative | 22 | 11 | 19 | 14 | 20 | 7 | |||
| Positive | 18 | 4 | 10 | 12 | 13 | 15 | |||
| Pathology grade | 0.8257 | 0.8984 | 0.3217 | ||||||
| I–II | 20 | 7 | 14 | 13 | 18 | 9 | |||
| II–III | 20 | 8 | 15 | 13 | 15 | 13 | |||
| Tumor stage | 0.1523 | 0.8984 | 0.6596 | ||||||
| 0–IIA | 18 | 10 | 15 | 13 | 16 | 12 | |||
| IIB–III | 22 | 5 | 14 | 13 | 17 | 10 | |||
Publisher’s Note: MDPI stays neutral with regard to jurisdictional claims in published maps and institutional affiliations. |
© 2021 by the authors. Licensee MDPI, Basel, Switzerland. This article is an open access article distributed under the terms and conditions of the Creative Commons Attribution (CC BY) license (https://creativecommons.org/licenses/by/4.0/).
Share and Cite
Qu, H.; Qi, D.; Wang, X.; Dong, Y.; Jin, Q.; Wei, J.; Quan, C. CLDN6 Suppresses c–MYC–Mediated Aerobic Glycolysis to Inhibit Proliferation by TAZ in Breast Cancer. Int. J. Mol. Sci. 2022, 23, 129. https://doi.org/10.3390/ijms23010129
Qu H, Qi D, Wang X, Dong Y, Jin Q, Wei J, Quan C. CLDN6 Suppresses c–MYC–Mediated Aerobic Glycolysis to Inhibit Proliferation by TAZ in Breast Cancer. International Journal of Molecular Sciences. 2022; 23(1):129. https://doi.org/10.3390/ijms23010129
Chicago/Turabian StyleQu, Huinan, Da Qi, Xinqi Wang, Yuan Dong, Qiu Jin, Junyuan Wei, and Chengshi Quan. 2022. "CLDN6 Suppresses c–MYC–Mediated Aerobic Glycolysis to Inhibit Proliferation by TAZ in Breast Cancer" International Journal of Molecular Sciences 23, no. 1: 129. https://doi.org/10.3390/ijms23010129
APA StyleQu, H., Qi, D., Wang, X., Dong, Y., Jin, Q., Wei, J., & Quan, C. (2022). CLDN6 Suppresses c–MYC–Mediated Aerobic Glycolysis to Inhibit Proliferation by TAZ in Breast Cancer. International Journal of Molecular Sciences, 23(1), 129. https://doi.org/10.3390/ijms23010129