
MicroRNA 630 Represses NANOG Expression through Transcriptional and Post-Transcriptional Regulation in Human Embryonal Carcinoma Cells


Abstract
:1. Introduction
2. Results
2.1. Activation of PKC Upregulates MIR630 Expression
2.2. MIR630 Is a Strong Candidate Repressor of Pluripotency Genes
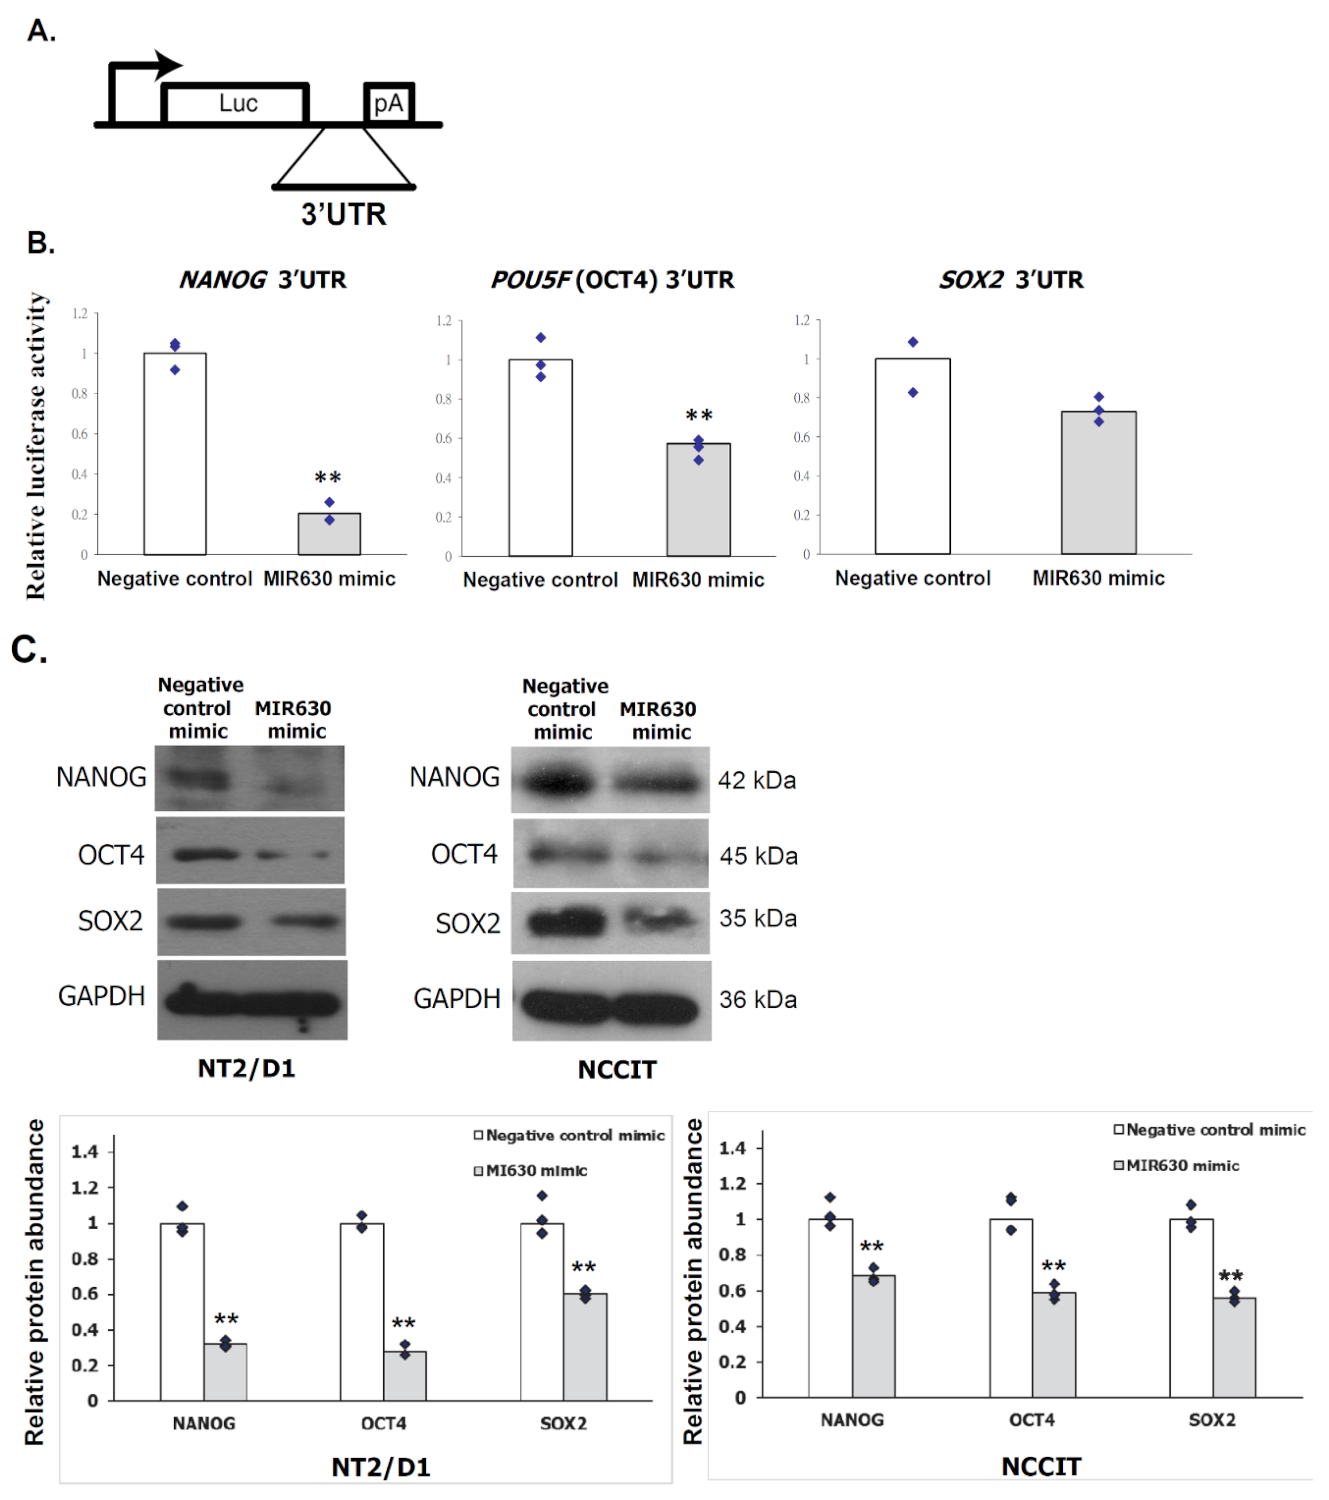
2.3. Ectopic MIR630 Targets NANOG, POU5F1 (OCT4), and SOX2 3′UTR Reporters
2.4. MIR630 Targets the Putative Binding Sites in the 3′UTR of NANOG
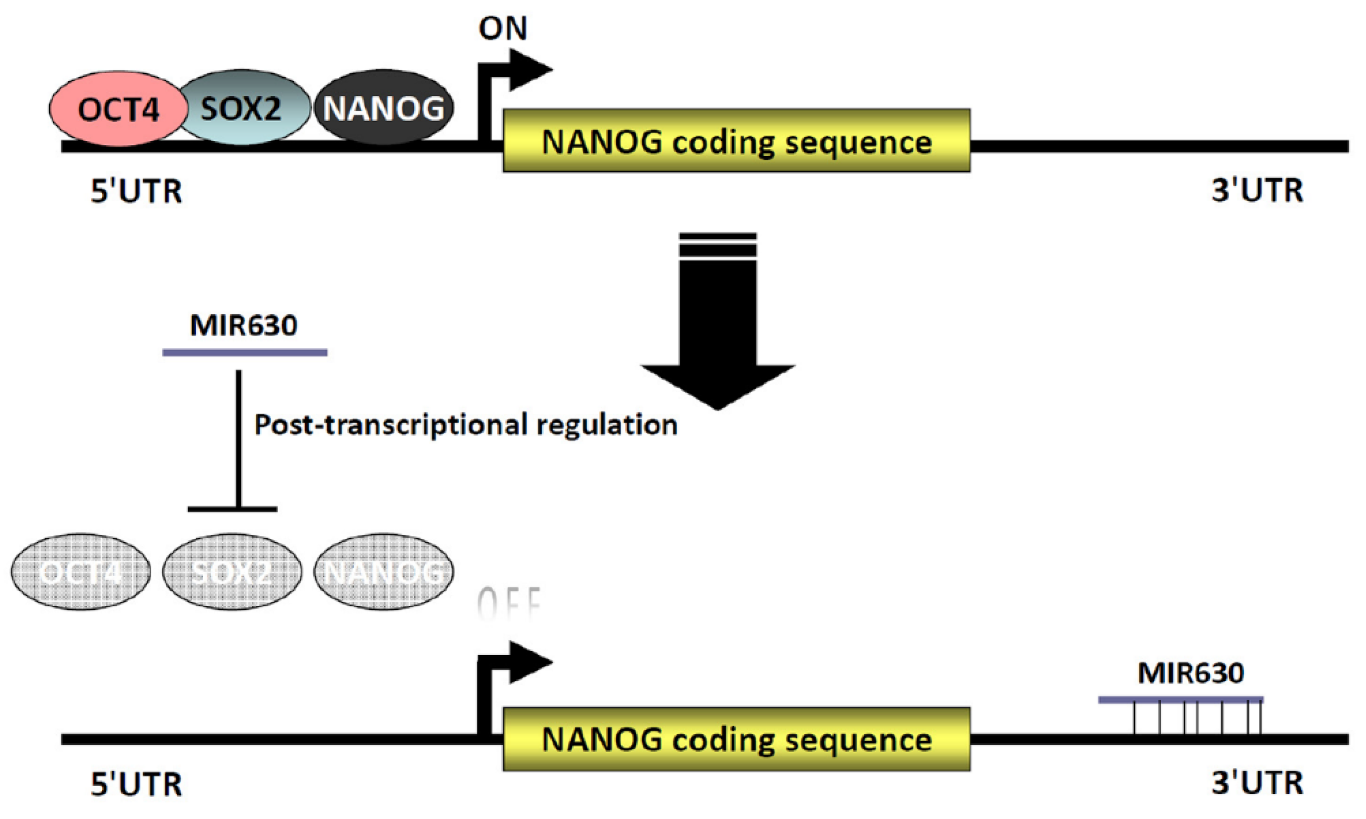
2.5. MIR630 Inhibits NANOG Transcription via Direct Repression of OCT4, SOX2, and NANOG Expression in NT2/D1 Cells
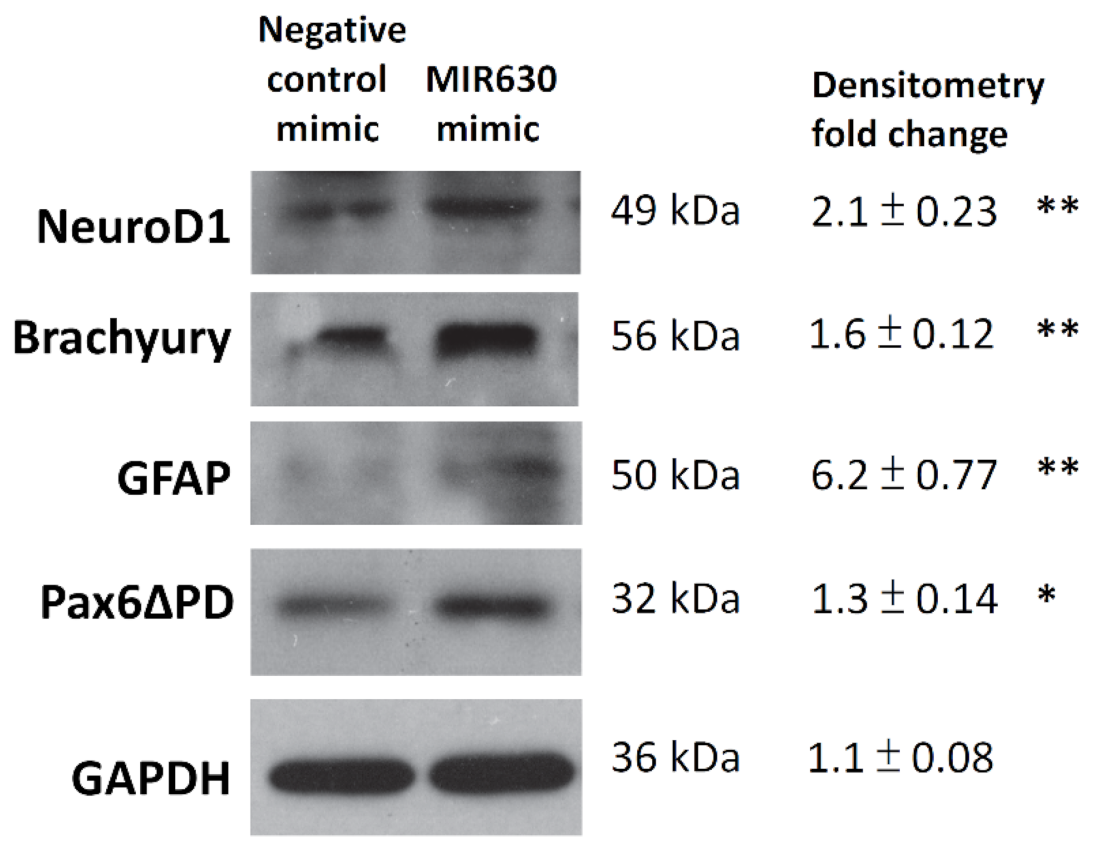
2.6. MIR630 Mediates the Expression of Differentiation Markers in NT2/D1 Cells
3. Discussion
4. Materials and Methods
4.1. Cell Line and Cell Culture
4.2. MicroRNA Microarray Analysis
4.3. Reverse Transcription-Quantitative Polymerase Chain Reaction (RT-qPCR)
4.4. MicroRNA Luciferase Reporter Assay
4.5. Site-Directed Mutagenesis of the 3′UTR-Luciferase Reporter Vectors
4.6. Preparation of Cell Lysate and Western Blot Analysis
4.7. Statistical Analysis
Supplementary Materials
Author Contributions
Funding
Institutional Review Board Statement
Informed Consent Statement
Data Availability Statement
Conflicts of Interest
References
- Boiani, M.; Scholer, H.R. Regulatory networks in embryo-derived pluripotent stem cells. Nat. Rev. Mol. Cell Biol. 2005, 6, 872–881. [Google Scholar] [CrossRef]
- Rodda, D.J.; Chew, J.-L.; Lim, L.-H.; Loh, Y.-H.; Wang, B.; Ng, H.-H.; Robson, P. Transcriptional Regulation of Nanog by OCT4 and SOX2. J. Biol. Chem. 2005, 280, 24731–24737. [Google Scholar] [CrossRef] [Green Version]
- Hyslop, L.; Stojkovic, M.; Armstrong, L.; Walter, T.; Stojkovic, P.; Przyborski, S.; Herbert, M.; Murdoch, A.; Strachan, T.; Lako, M. Downregulation of NANOG induces differentiation of human embryonic stem cells to extraembryonic lineages. Stem. Cells 2005, 23, 1035–1043. [Google Scholar] [CrossRef] [PubMed]
- Kashyap, V.; Rezende, N.C.; Scotland, K.B.; Shaffer, S.M.; Persson, J.L.; Gudas, L.J.; Mongan, N.P. Regulation of stem cell pluripotency and differentiation involves a mutual regulatory circuit of the NANOG, OCT4, and SOX2 pluripotency transcription factors with polycomb repressive complexes and stem cell microRNAs. Stem. Cells Dev. 2009, 18, 1093–1108. [Google Scholar] [CrossRef] [PubMed]
- Meng, H.M.; Zheng, P.; Wang, X.Y.; Liu, C.; Sui, H.M.; Wu, S.J.; Zhou, J.; Ding, Y.Q.; Li, J.M. Overexpression of nanog predicts tumor progression and poor prognosis in colorectal cancer. Cancer Biol. Ther. 2010, 9, 295–302. [Google Scholar] [CrossRef] [PubMed] [Green Version]
- Hart, A.H.; Hartley, L.; Parker, K.; Ibrahim, M.; Looijenga, L.H.; Pauchnik, M.; Chow, C.W.; Robb, L. The pluripotency homeobox gene NANOG is expressed in human germ cell tumors. Cancer 2005, 104, 2092–2098. [Google Scholar] [CrossRef]
- Ezeh, U.I.; Turek, P.J.; Reijo, R.A.; Clark, A.T. Human embryonic stem cell genes OCT4, NANOG, STELLAR, and GDF3 are expressed in both seminoma and breast carcinoma. Cancer 2005, 104, 2255–2265. [Google Scholar] [CrossRef] [PubMed]
- Chiou, S.H.; Yu, C.C.; Huang, C.Y.; Lin, S.C.; Liu, C.J.; Tsai, T.H.; Chou, S.H.; Chien, C.S.; Ku, H.H.; Lo, J.F. Positive correlations of Oct-4 and Nanog in oral cancer stem-like cells and high-grade oral squamous cell carcinoma. Clin. Cancer Res. Off. J. Am. Assoc. Cancer Res. 2008, 14, 4085–4095. [Google Scholar] [CrossRef] [PubMed] [Green Version]
- Zhang, S.; Balch, C.; Chan, M.W.; Lai, H.C.; Matei, D.; Schilder, J.M.; Yan, P.S.; Huang, T.H.; Nephew, K.P. Identification and characterization of ovarian cancer-initiating cells from primary human tumors. Cancer Res. 2008, 68, 4311–4320. [Google Scholar] [CrossRef] [Green Version]
- Bussolati, B.; Bruno, S.; Grange, C.; Ferrando, U.; Camussi, G. Identification of a tumor-initiating stem cell population in human renal carcinomas. FASEB J. 2008, 22, 3696–3705. [Google Scholar] [CrossRef]
- Ye, F.; Zhou, C.; Cheng, Q.; Shen, J.; Chen, H. Stem-cell-abundant proteins Nanog, Nucleostemin and Musashi1 are highly expressed in malignant cervical epithelial cells. BMC Cancer 2008, 8, 108. [Google Scholar] [CrossRef] [Green Version]
- Grubelnik, G.; Bostjancic, E.; Pavlic, A.; Kos, M.; Zidar, N. NANOG expression in human development and cancerogenesis. Exp. Biol. Med. 2020, 245, 456–464. [Google Scholar] [CrossRef] [PubMed] [Green Version]
- Chu, W.K.; Dai, P.M.; Li, H.L.; Pao, C.C.; Chen, J.K. Nanog expression is negatively regulated by Protein Kinase C activities in human cancer cell lines. Carcinogenesis 2013, 34, 1497–1509. [Google Scholar] [CrossRef] [Green Version]
- Wang, Y.; Medvid, R.; Melton, C.; Jaenisch, R.; Blelloch, R. DGCR8 is essential for microRNA biogenesis and silencing of embryonic stem cell self-renewal. Nat Genet. 2007, 39, 380–385. [Google Scholar] [CrossRef] [PubMed]
- Kanellopoulou, C.; Muljo, S.A.; Kung, A.L.; Ganesan, S.; Drapkin, R.; Jenuwein, T.; Livingston, D.M.; Rajewsky, K. Dicer-deficient mouse embryonic stem cells are defective in differentiation and centromeric silencing. Genes Dev. 2005, 19, 489–501. [Google Scholar] [CrossRef] [PubMed] [Green Version]
- Murchison, E.P.; Partridge, J.F.; Tam, O.H.; Cheloufi, S.; Hannon, G.J. Characterization of Dicer-deficient murine embryonic stem cells. Proc. Natl. Acad. Sci. USA 2005, 102, 12135–12140. [Google Scholar] [CrossRef] [PubMed] [Green Version]
- Boyer, L.A.; Lee, T.I.; Cole, M.F.; Johnstone, S.E.; Levine, S.S.; Zucker, J.P.; Guenther, M.G.; Kumar, R.M.; Murray, H.L.; Jenner, R.G.; et al. Core transcriptional regulatory circuitry in human embryonic stem cells. Cell 2005, 122, 947–956. [Google Scholar] [CrossRef] [Green Version]
- Loh, Y.H.; Wu, Q.; Chew, J.L.; Vega, V.B.; Zhang, W.; Chen, X.; Bourque, G.; George, J.; Leong, B.; Liu, J.; et al. The Oct4 and Nanog transcription network regulates pluripotency in mouse embryonic stem cells. Nat. Genet. 2006, 38, 431–440. [Google Scholar] [CrossRef]
- Lakshmipathy, U.; Love, B.; Goff, L.A.; Jornsten, R.; Graichen, R.; Hart, R.P.; Chesnut, J.D. MicroRNA expression pattern of undifferentiated and differentiated human embryonic stem cells. Stem. Cells Dev. 2007, 16, 1003–1016. [Google Scholar] [CrossRef] [Green Version]
- Schoeftner, S.; Scarola, M.; Comisso, E.; Schneider, C.; Benetti, R. An Oct4-pRb axis, controlled by MiR-335, integrates stem cell self-renewal and cell cycle control. Stem. Cells 2013, 31, 717–728. [Google Scholar] [CrossRef] [PubMed]
- Cittelly, D.M.; Finlay-Schultz, J.; Howe, E.N.; Spoelstra, N.S.; Axlund, S.D.; Hendricks, P.; Jacobsen, B.M.; Sartorius, C.A.; Richer, J.K. Progestin suppression of miR-29 potentiates dedifferentiation of breast cancer cells via KLF4. Oncogene 2013, 32, 2555–2564. [Google Scholar] [CrossRef] [PubMed] [Green Version]
- Rehmsmeier, M.; Steffen, P.; Hochsmann, M.; Giegerich, R. Fast and effective prediction of microRNA/target duplexes. RNA 2004, 10, 1507–1517. [Google Scholar] [CrossRef] [Green Version]
- Miranda, K.C.; Huynh, T.; Tay, Y.; Ang, Y.S.; Tam, W.L.; Thomson, A.M.; Lim, B.; Rigoutsos, I. A pattern-based method for the identification of MicroRNA binding sites and their corresponding heteroduplexes. Cell 2006, 126, 1203–1217. [Google Scholar] [CrossRef] [Green Version]
- Das, S.; Jena, S.; Kim, E.M.; Zavazava, N.; Levasseur, D.N. Transcriptional Regulation of Human NANOG by Alternate Promoters in Embryonic Stem Cells. J. Stem. Cell Res. Ther. 2012, 1 (Suppl. 10), 009. [Google Scholar] [CrossRef] [Green Version]
- Kim, J.; Lauderdale, J.D. Analysis of Pax6 expression using a BAC transgene reveals the presence of a paired-less isoform of Pax6 in the eye and olfactory bulb. Dev. Biol. 2006, 292, 486–505. [Google Scholar] [CrossRef] [Green Version]
- Lin, W.N.; Luo, S.F.; Lin, C.C.; Hsiao, L.D.; Yang, C.M. Differential involvement of PKC-dependent MAPKs activation in lipopolysaccharide-induced AP-1 expression in human tracheal smooth muscle cells. Cell Signal 2009, 21, 1385–1395. [Google Scholar] [CrossRef]
- Kurie, J.M.; Brown, P.; Salk, E.; Scheinberg, D.; Birrer, M.; Deutsch, P.; Dmitrovsky, E. Cooperation between retinoic acid and phorbol esters enhances human teratocarcinoma differentiation. Differentiation 1993, 54, 115–122. [Google Scholar] [CrossRef] [PubMed]
- Schulze-Osthoff, K.; Ferrari, D.; Riehemann, K.; Wesselborg, S. Regulation of NF-kappa B activation by MAP kinase cascades. Immunobiology 1997, 198, 35–49. [Google Scholar] [CrossRef]
- Lopez-Romero, P.; Gonzalez, M.A.; Callejas, S.; Dopazo, A.; Irizarry, R.A. Processing of Agilent microRNA array data. BMC Res. Notes 2010, 3, 18. [Google Scholar] [CrossRef] [Green Version]


| Upregulated miRNA | Fold of Change | Downregulated miRNA | Fold of Change |
|---|---|---|---|
| hsa-miR-630 | 28.41 | hsa-miR-183 | 0.44 |
| hsa-miR-335-3p | 21.86 | hsa-miR-4286 | 0.47 |
| hsa-miR-335-5p | 17.10 | hsa-miR-512-3p | 0.51 |
| hsa-miR-29b-1* | 7.44 | hsa-miR-520c-3p | 0.54 |
| hsa-miR-365 | 4.52 | hsa-miR-720 | 0.59 |
| hsa-miR-146a | 4.40 | hsa-miR-1280 | 0.59 |
| hsa-miR-1973 | 4.26 | hsa-miR-1260 | 0.65 |
| hsa-miR-9 | 4.19 | hsa-miR-1274b_v16.0 | 0.66 |
| hsa-miR-222 | 4.00 | hsa-miR-1260b | 0.71 |
| hsa-miR-29b | 3.91 | hsa-miR-19b-1* | 0.72 |
| hsa-miR-4299 | 3.77 | hsa-miR-517a | 0.74 |
| hsa-miR-129-3p | 3.65 | hsa-miR-20b | 0.78 |
| hsa-miR-1290 | 3.64 | hsa-miR-367 | 0.79 |
| hsa-miR-29c | 3.50 | hsa-miR-551b | 0.80 |
| hsa-miR-23a | 3.45 | hsa-miR-302c* | 0.81 |
| hsa-miR-221 | 3.37 | hsa-miR-18b | 0.81 |
| hsa-miR-2861 | 3.22 | hsa-miR-19b | 0.82 |
| hsa-miR-361-3p | 3.05 | hsa-miR-20a | 0.84 |
| hsa-miR-135b | 2.94 | hsa-miR-34a | 0.85 |
| hsa-miR-423-5p | 2.94 | hsa-miR-124 | 0.86 |
| Gene | 3′UTR Position | Target Site | Minimum Free Energy (MFE) | Target Prediction Program |
|---|---|---|---|---|
| NANOG | 124–158 | 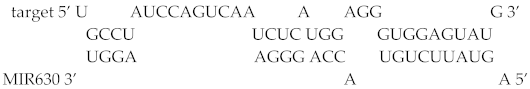 | −19.4 kcal/mol | RNAhybrid |
| NANOG | 254–277 | 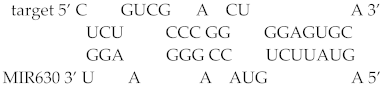 | −21.7 kcal/mol | RNAhybrid |
| NANOG | 570–605 |  | −26.7 kcal/mol | RNAhybrid |
| NANOG | 930–952 | 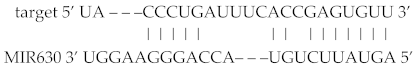 | −22.2 kcal/mol (Folding energy) | RNA22 |
| POU5F1 (OCT4) | 9–33 |  | −23.4 kcal/mol | RNAhybrid |
| SOX2 | 278–301 | 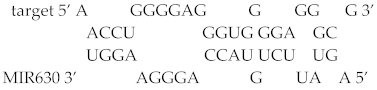 | −21.4 kcal/mol | RNAhybrid |
Publisher’s Note: MDPI stays neutral with regard to jurisdictional claims in published maps and institutional affiliations. |
© 2021 by the authors. Licensee MDPI, Basel, Switzerland. This article is an open access article distributed under the terms and conditions of the Creative Commons Attribution (CC BY) license (https://creativecommons.org/licenses/by/4.0/).
Share and Cite
Chu, W.-K.; Hung, L.-M.; Hou, C.-W.; Chen, J.-K. MicroRNA 630 Represses NANOG Expression through Transcriptional and Post-Transcriptional Regulation in Human Embryonal Carcinoma Cells. Int. J. Mol. Sci. 2022, 23, 46. https://doi.org/10.3390/ijms23010046
Chu W-K, Hung L-M, Hou C-W, Chen J-K. MicroRNA 630 Represses NANOG Expression through Transcriptional and Post-Transcriptional Regulation in Human Embryonal Carcinoma Cells. International Journal of Molecular Sciences. 2022; 23(1):46. https://doi.org/10.3390/ijms23010046
Chicago/Turabian StyleChu, Wing-Keung, Li-Man Hung, Chun-Wei Hou, and Jan-Kan Chen. 2022. "MicroRNA 630 Represses NANOG Expression through Transcriptional and Post-Transcriptional Regulation in Human Embryonal Carcinoma Cells" International Journal of Molecular Sciences 23, no. 1: 46. https://doi.org/10.3390/ijms23010046
APA StyleChu, W.-K., Hung, L.-M., Hou, C.-W., & Chen, J.-K. (2022). MicroRNA 630 Represses NANOG Expression through Transcriptional and Post-Transcriptional Regulation in Human Embryonal Carcinoma Cells. International Journal of Molecular Sciences, 23(1), 46. https://doi.org/10.3390/ijms23010046