Article

InDels Identification and Association Analysis with Spike and Awn Length in Chinese Wheat Mini-Core Collection

National Key Facility for Crop Gene Resources and Genetic Improvement, Institute of Crop Science, Chinese Academy of Agricultural Sciences, Beijing 100081, China
*
Authors to whom correspondence should be addressed.
These authors contributed equally to this work.
Int. J. Mol. Sci. 2022, 23(10), 5587; https://doi.org/10.3390/ijms23105587
Submission received: 15 April 2022 / Revised: 12 May 2022 / Accepted: 13 May 2022 / Published: 17 May 2022
(This article belongs to the Special Issue Recent Advances in Plant Molecular Science in China 2022)

Abstract

:
Diversity surveys of germplasm are important for gaining insight into the genomic basis for crop improvement; especially InDels, which are poorly understood in hexaploid common wheat. Here, we describe a map of 89,923 InDels from exome sequencing of 262 accessions of a Chinese wheat mini-core collection. Population structure analysis, principal component analysis and selective sweep analysis between landraces and cultivars were performed. Further genome-wide association study (GWAS) identified five QTL (Quantitative Trait Loci) that were associated with spike length, two of them, on chromosomes 2B and 6A, were detected in 10 phenotypic data sets. Assisted with RNA-seq data, we identified 14 and 21 genes, respectively that expressed in spike and rachis within the two QTL regions that can be further investigated for candidate genes discovery. Moreover, InDels were found to be associated with awn length on chromosomes 5A, 6B and 4A, which overlapped with previously reported genetic loci B1 (Tipped 1), B2 (Tipped 2) and Hd (Hooded). One of the genes TaAGL6 that was previously shown to affect floral organ development was found at the B2 locus to affect awn length development. Our study shows that trait-associated InDels may contribute to wheat improvement and may be valuable molecular markers for future wheat breeding

1. Introduction

Common wheat (Triticum aestivum L.) is a leading cereal as a staple food for more than 35% of the world’s population. China is the largest wheat producer and consumer in the world, with more than 23 million hm2 of planting area in 2020. Over the past half a century, the total output of common wheat in China has increased from 20 million tons to 134.25 million tons, while the total sown area reduced from about 25 million hectares to 23 million hectares (http://www.stats.gov.cn, accessed on 3 March 2022). Therefore, the increase in yield per unit area was the principal contribution to the increase in total production. The systematic breeding of wheat based on Chinese landraces and introduced foreign cultivars has helped greatly in Chinese wheat improvement [1,2,3].
From more than 23,090 wheat accessions stored in Chinese GeneBank that were collected across wheat growing regions in China, a mini-core collection of 262 Chinese wheat accessions, representing the genetic diversity of Chinese wheat, was constructed by phenotyping and SSR genotyping [4]. The collection consisted of 157 Chinese landraces (CL) and 105 cultivars, including 88 modern Chinese cultivars (MCC) and 17 introduced modern cultivars (IMC) [5]. Significant phenotypic differences were detected between CL and MCC [5]. Using SNP markers, 6.7% of the wheat genome was found to fall in selection sweeps between landraces and cultivars and genes known for yield improvement were identified using genome wide gene association study [5]. In plants, SNPs, rather than insertions/deletions (InDels), were commonly used to identify genomic variations that affect observable phenotypes.
Abundant evidence demonstrated that genetic variations caused by InDels play a large role in phenotypic variances that affect a series of important agronomic and quality traits in crops. For example, in a genome-wide association study (GWAS) with salt tolerance in 182 wild soybean accessions, a 7-bp deletion in the promoter of GsERD15B (early responsive to dehydration 15B) that significantly affected salt tolerance in soybean [6] was identified. GWAS of maize drought tolerance at the seedling stage also identified 83 genetic variants, involving 42 candidate genes [7]. The peak GWAS signal showed that the natural variation in ZmVPP1, encoding a vacuolar-type H+ pyrophosphatase, contributes most significantly to the trait, which is caused by a 366-bp insertion in the promoter that contains three MYB cis elements critical for drought tolerance [7]. In another case, a 1-kb insertion in the upstream of the barley HvAACT1 gene coding region enhanced Aluminum tolerance by increasing its expression and altering the location of expression to the root tips [8]. Despite many studies using SNPs in wheat, the distribution and population genetic characteristics of InDel variants in wheat have not been systematically studied.
The development of sequencing and assembly technology has shifted the limits of the reference genome in wheat research and breeding [9], greatly promoting researches in wheat evolution, domestication, selection, adaptation and genetic locus underlying traits development [10,11,12,13,14]. A genome-wide InDel-based study on the molecular basis of agronomic traits is still needed, especially for identifying novel QTL (Quantitative Trait Loci) other than those classical ones. Recently, 287 wheat accessions were used to identify 76,952 InDels. These InDels caused a frame shift in 2083 genes, including Ppd-D1 and GS5-1 and 182 rice homologs that have been functionally studied, demonstrating that InDels can impact on important functional genes [5]. The frequency of these frameshift InDels in modern cultivars (0.22) was significantly higher than that in landraces (0.17), suggesting that they were under artificial selection. With the release of the latest version (v2.1) of the wheat reference genome [15], further study on the effect of InDels on the population characteristics and phenotype of wheat should provide new insights into wheat evolution and breeding.
Wheat spike architecture is one of the important agronomic traits. Unripe spikes significantly contribute to photosynthesis and are the closer source of assimilates to caryopses, contributing to grain filling and thousand grain weight [16,17,18]. Morphological variations in spike shape (square or speltoid), length, and compactness are correlated with grain size and spikelet number per spike. Modifying spike morphology can increase grain number and size, thus improving yield [19]. Spike length affects compactness and biomass. In wheat, the domestication gene Q, TB1 homolog, AP2 transcription factor WFZP, and TaHOX4 all affect inflorescence architecture and development [20,21,22,23]. To identify genetic loci associated with spike length, a large-scale GWAS identified 26 QTL associated with spike length [13]. Another 39 QTL related to spike length were identified among the Chinese wheat mini-core collection [5]. These QTL provide a basis for further discovery of spike determinant genes. Awn is another key spike morphological feature. Awns play important roles in seed dispersal and crop production. The awns of wheat carry the abilities of photosynthesis and carbon exchange [24]. Up to date, three loci B1 (Tipped 1), B2 (Tipped 2), and Hd (Hooded) were reported as dominant suppressors for awn development [24,25]. At least one of them, B1, can be attributed to InDels for their origination [26].
Here, we describe a map of InDel variation containing 89,923 InDels derived from exome sequencing of 262 Chinese wheat mini-core accessions, which we studied regarding their divergence and selection between landraces and cultivars. The effect of InDels on population structure, principal components, and selective sweeps was observed. Further GWAS identified novel genetic loci associated with spike and awn length. Our study shows that trait associated InDels may contribute to wheat improvement and may be valuable molecular markers for future wheat breeding.

2. Results

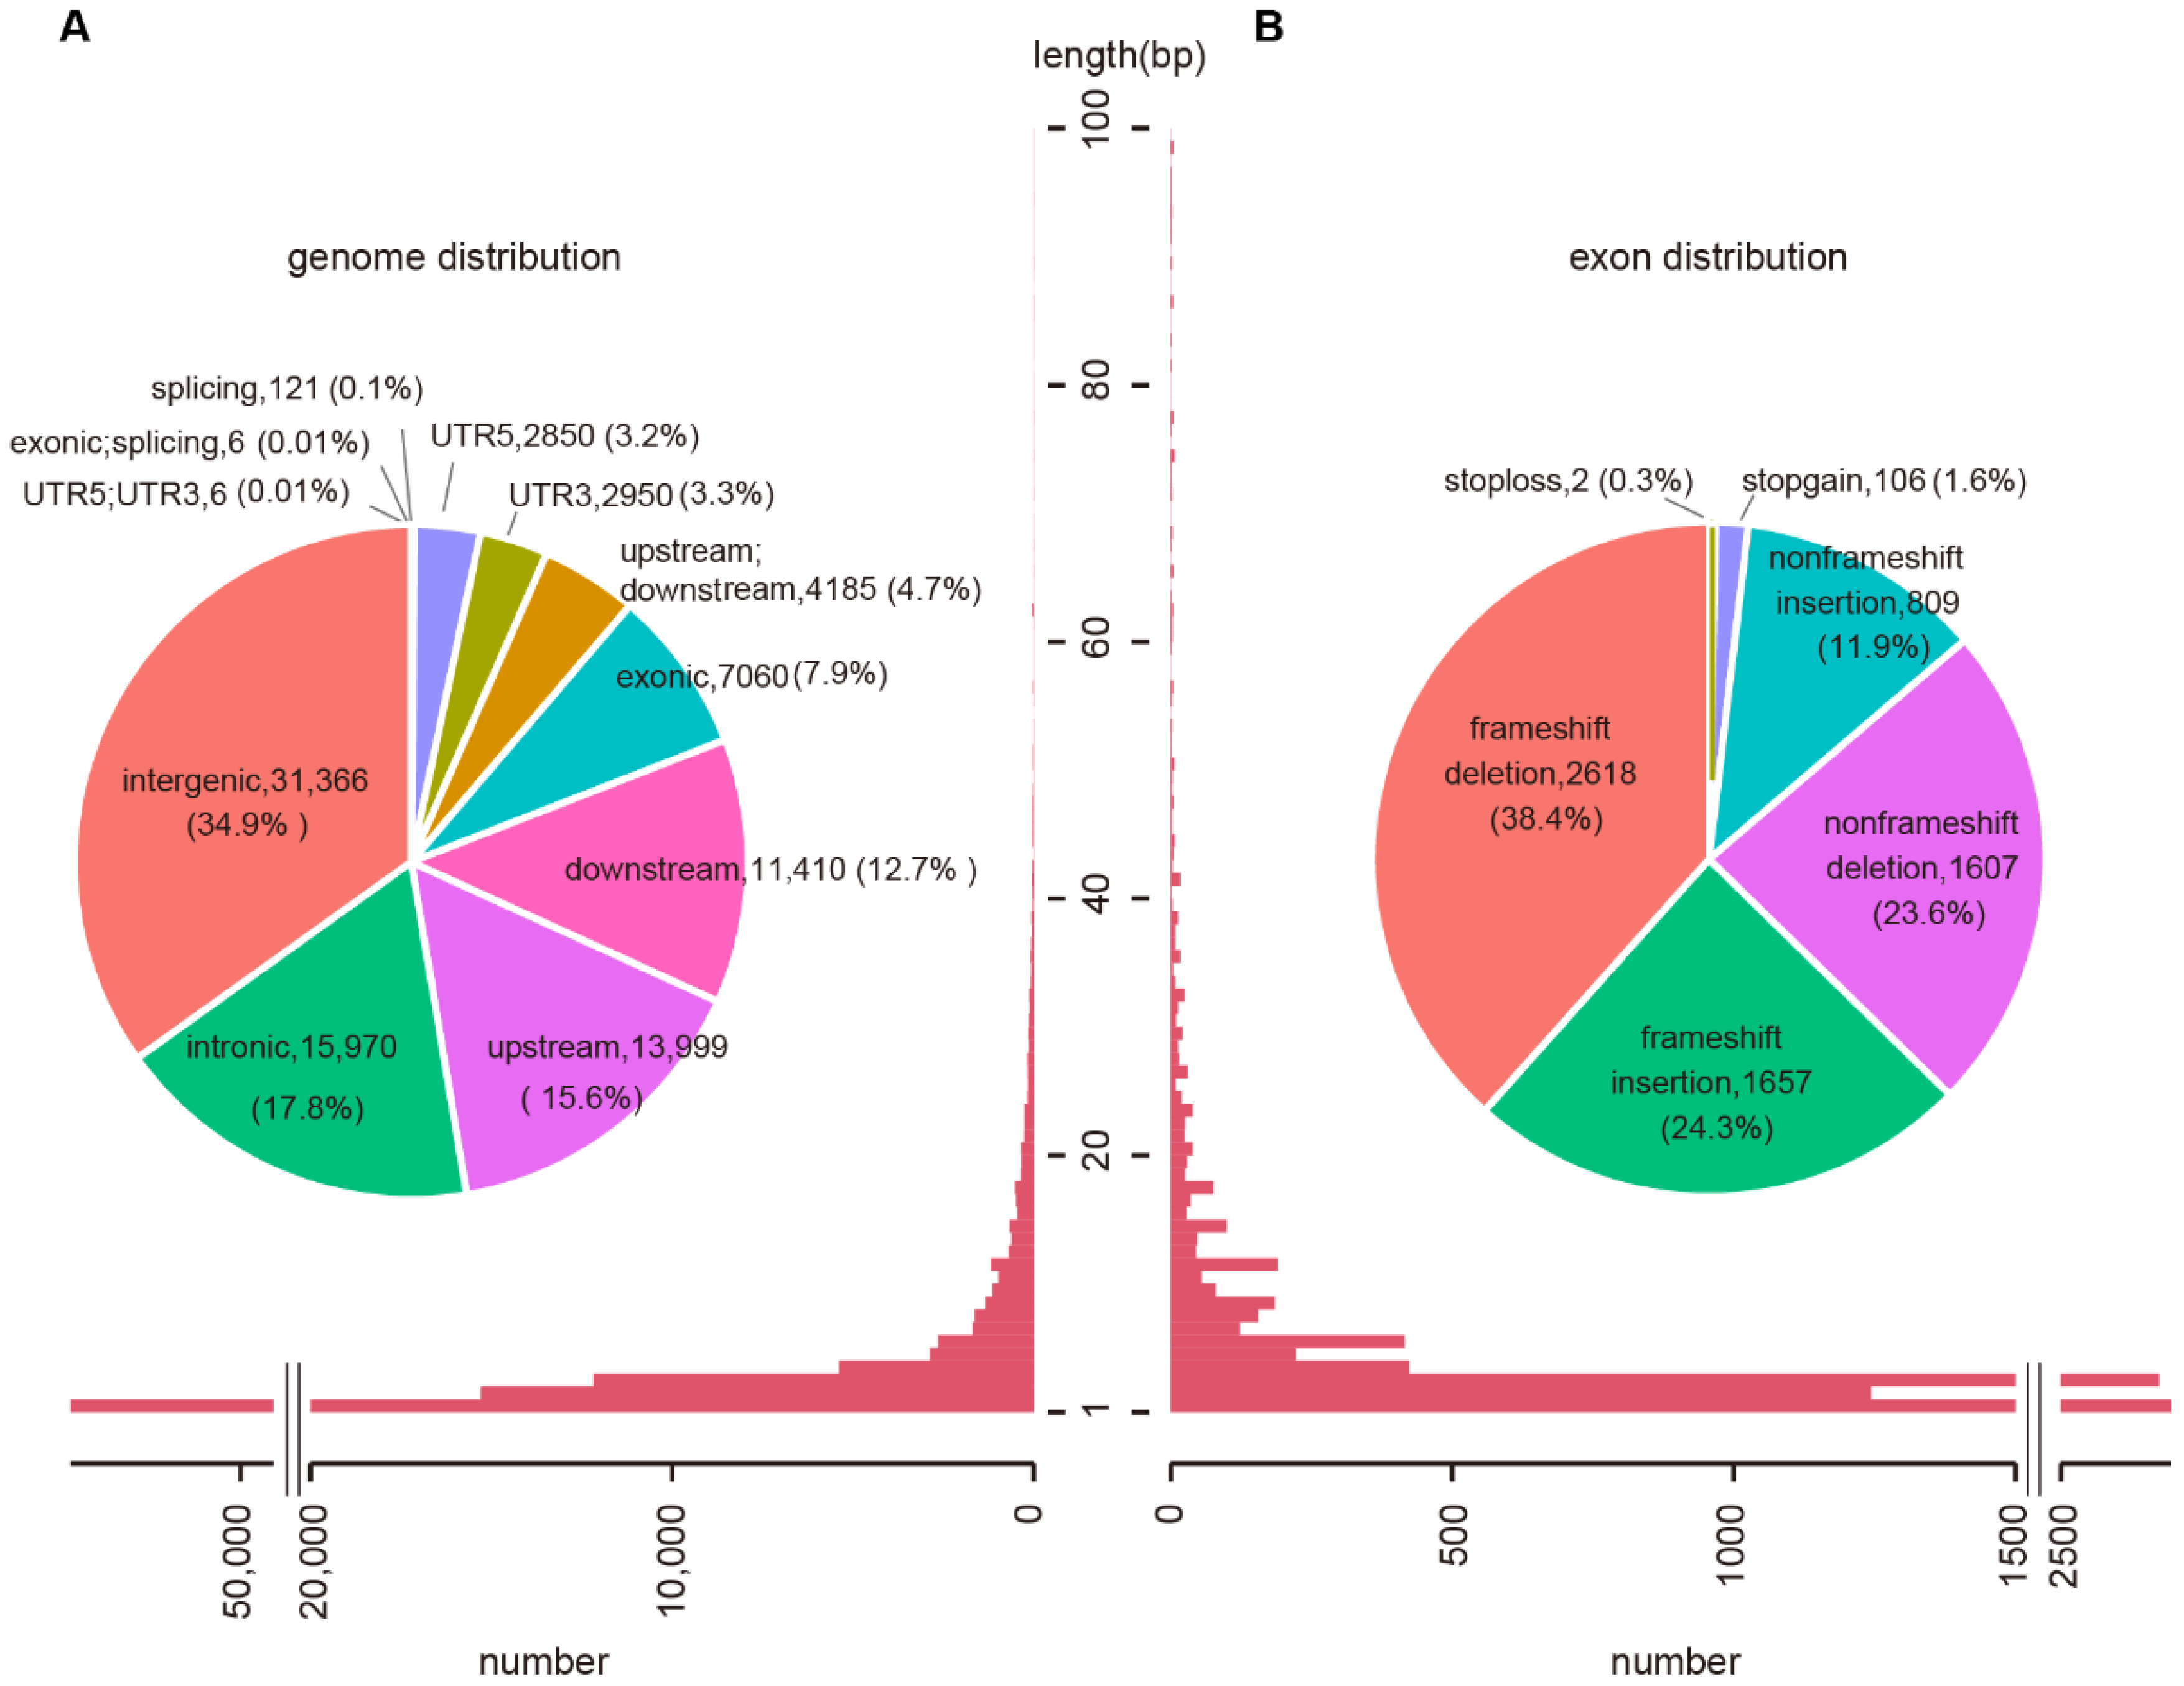
2.1. Genomic Features of Wheat InDels

From 287 exome-sequenced wheat accessions, a total of 983,262 SNPs and 76,952 short InDels were identified with minor allele frequency (MAF) ≥ 0.05 and the missing rate ≤ 0.2% using the IWGSC wheat genome assembly RefSeq v1.0 [5,9]. Here, we re-analyzed the InDels using the newly released IWGSC wheat reference genome v2.1 [15]. A total of 89,923 InDels were identified using the Genome Analysis Toolkit (GATK) protocol with similar selection parameters. These InDels were mainly located in intergenic regions (34.9%), followed by introns (17.8%), upstream (15.6%), downstream (12.7%), and exons (7.9%; Figure 1A). The average size of InDels was 4.58 base pairs (bp), of which 96% ranged from 1 to 20 bp. Only 0.27% InDels were longer than 100 bp.
The length distribution of InDels was decreased when the length of InDels was increasing (Figure 1A). Although the length of InDels in coding regions (CDS) tend to be a multiple of 3 that may not cause frameshift, 62.7% InDels caused frameshift mutations. Among them, 38.4% were deletions and 24.3% were insertions (Figure 1B; Supplemental Table S1). The number of InDels with a base number of 3 or multiple of 3 was much higher in genic regions (23.6%) than those in intergenic regions (11.0%), indicating purified selection of InDels in genic regions.
Among 18,445 InDels located in 5 kb upstream of genes, we identified 10,039 InDels with cis-regulatory elements present nearby (≤50 bp). These InDels potentially affected 403 transcription factor binding sites, including ARF, AGL, NAC, and SPL (Supplemental Table S2), totaling 6167 genes, such as TGW6, GS5-3, Ghd7, Glu-A3 (Figure S1A; Supplemental Table S3). InDels in UTRs, exons and in splicing regions often caused gene reading frame changes or amino acid loss. We analyzed these types of InDel and found that they affected 6002 genes, including important ones such as ARF12, GIF1, Vrn1, GS3, GW7, and Ppd1 (Figure S1B; Supplemental Table S4). Cis-elements and gene structure associated InDels affected a total of 11,140 genes, of which 4125 were in the A subgenome, 4664 in the B subgenome, and 2351 in the D subgenome (Figure S1C).
The distribution of InDels along chromosomes was uneven (an average of 7.3 InDels per Mb with the maximum ones up to 121 InDels per Mb), with a higher density in the distal regions of chromosomes than that in the vicinity of the centromeres (Figure S2). This distribution feature was consistent with the distribution of SNP along chromosomes [14], probably due to higher recombination frequency at the outermost chromosomal regions than those near the centromeres [27]. The number of InDels in homoeologue groups was proportional to the length of chromosomes. For example, length of chromosomes in homologue groups 1 were B > A > D, the corresponding InDel numbers were also B > A > D (Figure S2), and so was InDel densities (Figure S2). Such an observation may be caused by tandem repeats and TE amplification (the main reason for a chromosome becoming longer) in these regions.

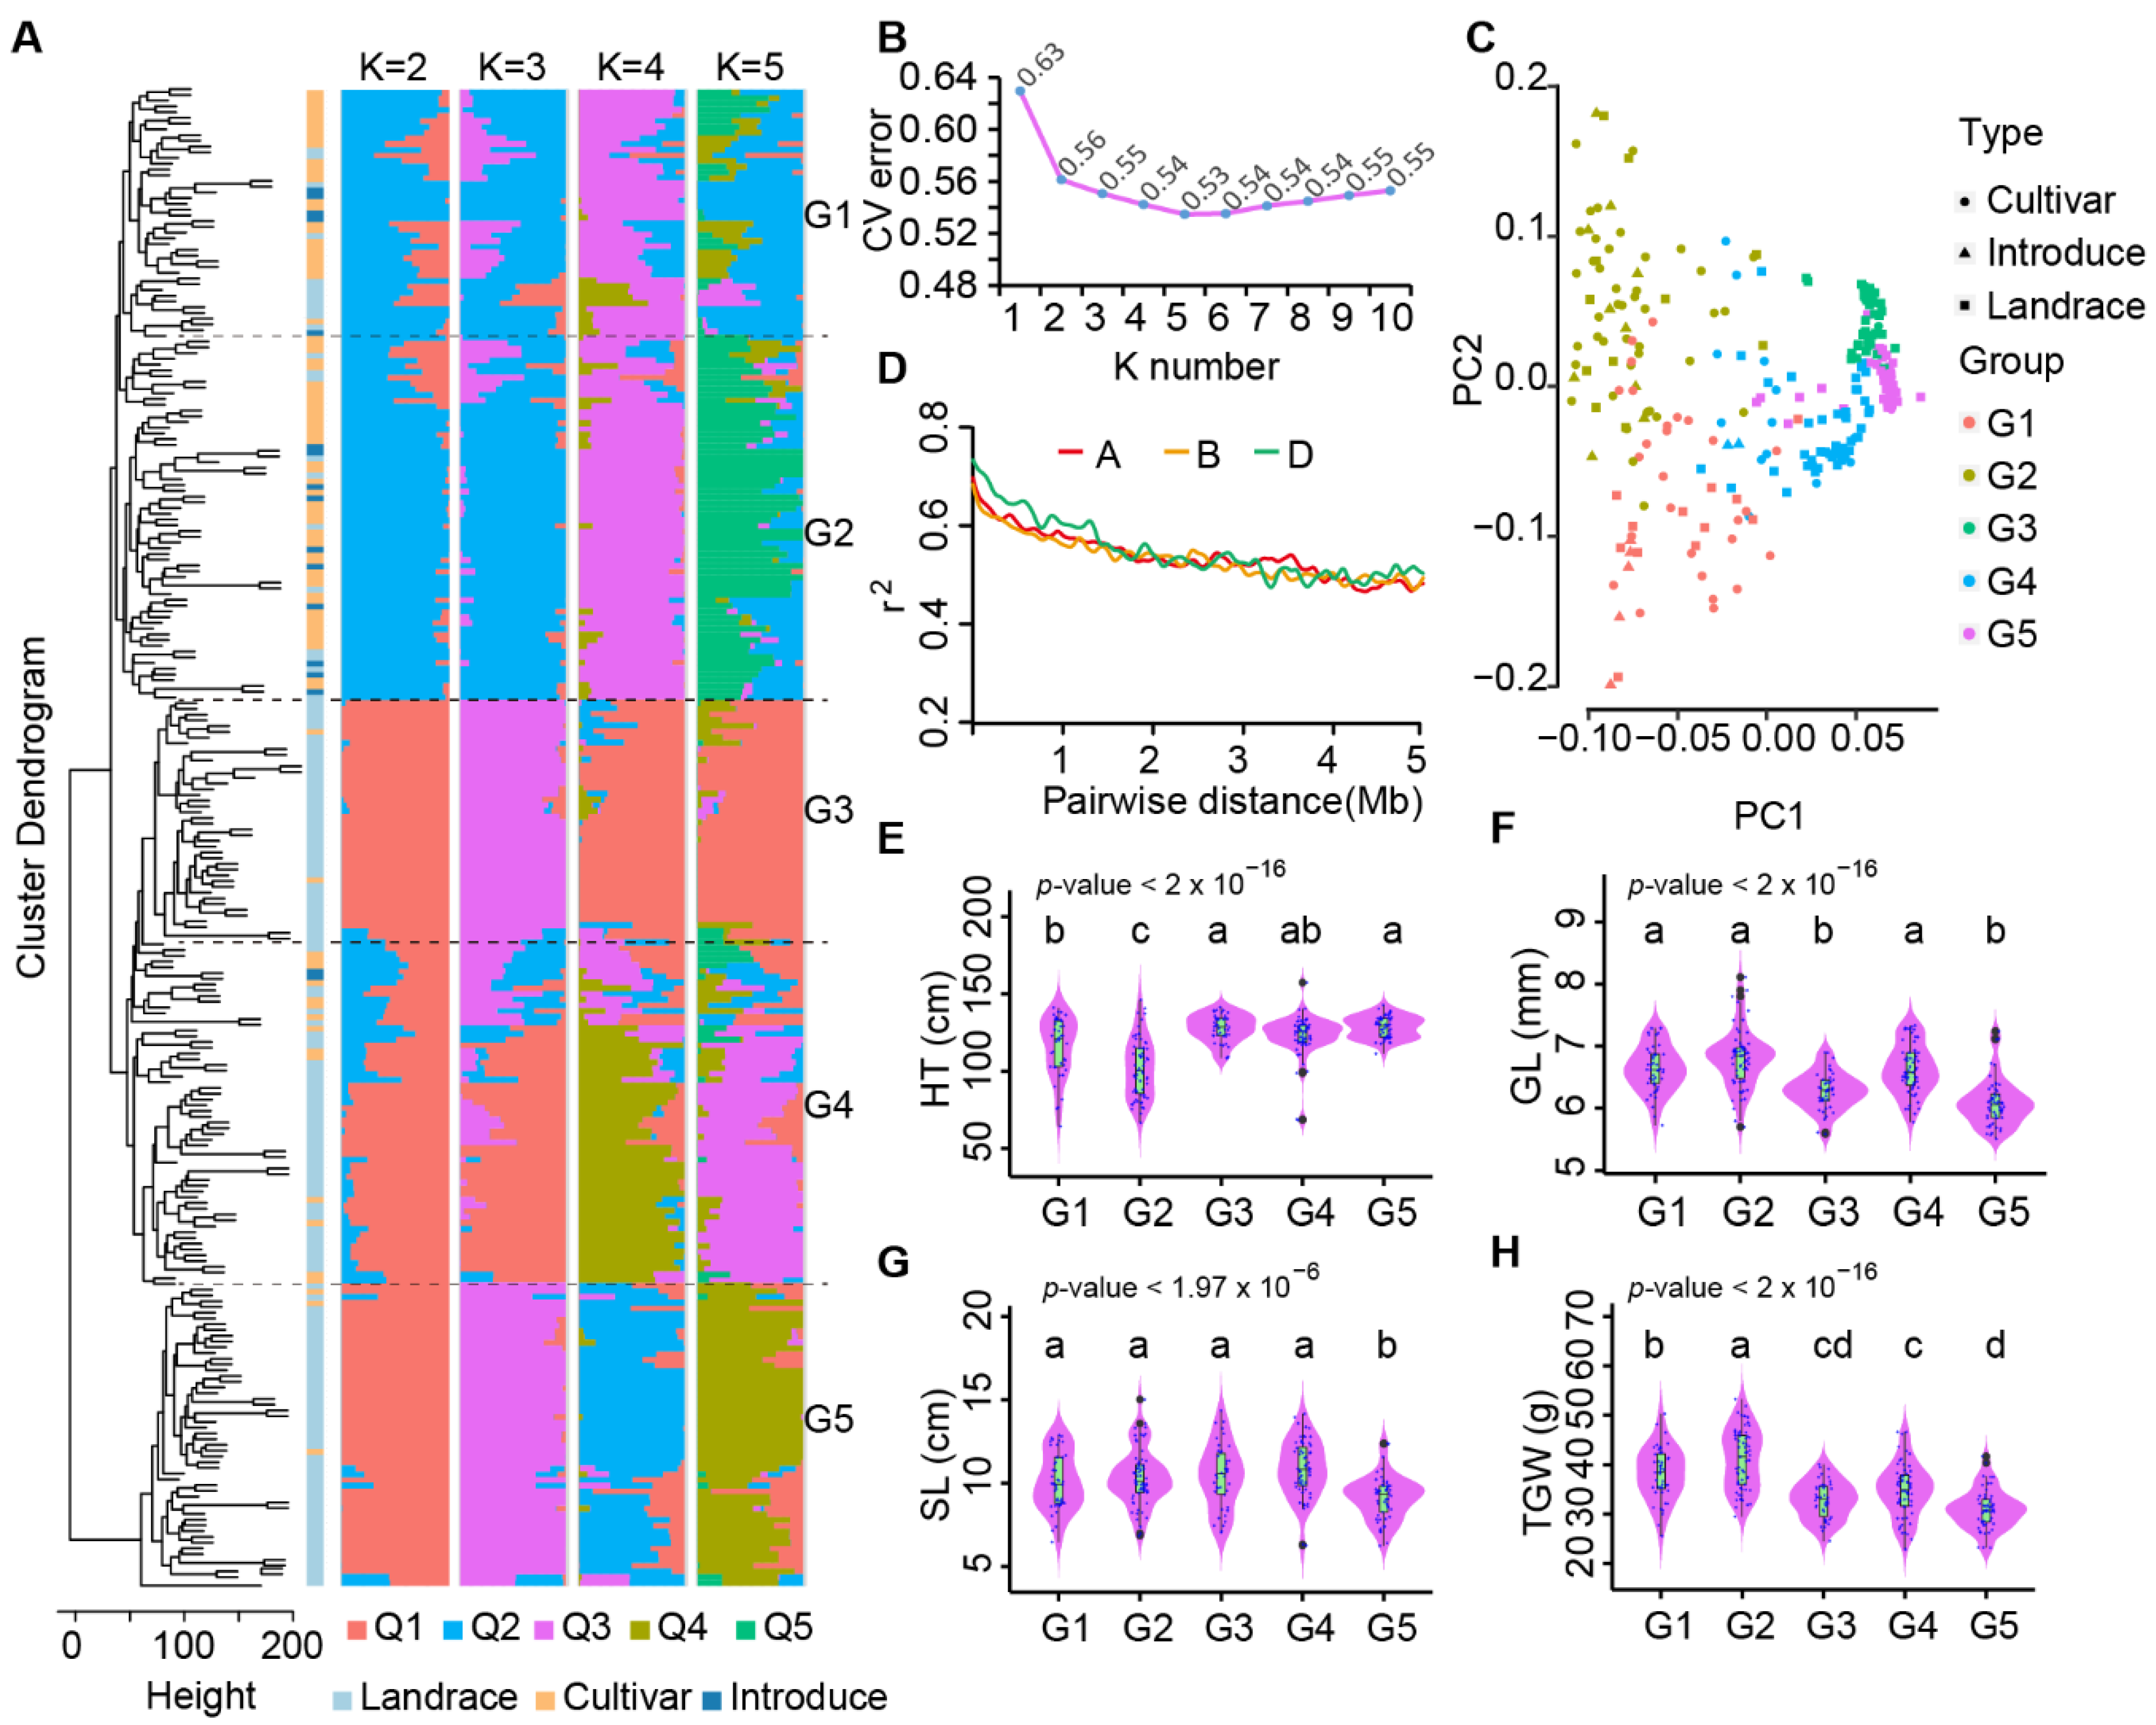
2.2. Population Structure of Chinese Mini-Core Collection Based on InDels

Cluster dendrogram and population structure analysis using InDel data showed Chinese mini-core collection were divided into several subpopulations according to different clustering levels and the number of subpopulations (K) in structure analysis (Figure 2A). The cross validation (CV) error analysis showed that the CV error between subpopulations had no drastic changes when K ≥ 2, and CV error reached the minimum value (0.53) when K = 5 (Figure 2B). Following K = 5, Chinese mini-core collection was classified into five subpopulations (G1–5) that was different from the previous study based on SNPs (Li et al., 2022). Among the five groups, G1 and G2 consisted of 64.5% modern cultivars, 14.0% introduced modern cultivars and 21.5% landraces, while G3, G4 and G5 consisted of significantly more landraces, up to 86.5%, with percentages of cultivars at 12.3% for modern cultivars and 1.29% for introduced cultivars (Supplemental Table S5). The coordinated presence of G1–5 in PCA was consistent with the results from the cluster dendrogram and population structure analysis (Figure 2C). In addition, a slow LD decay curve line was observed, comparable to that derived from SNP markers [13,14] (Figure 2D).
We then analyzed phenotype variance and found significant differences among subpopulations (Figure 2E–H). For plant height, the G2 group, which included well-known accessions such as the Yangmai158, Zhengmai9023, Yannong15 and Xiaoyan6 varieties, was significantly shorter in plant height than the other four groups. The average plant height of G3, G4 and G5 were all at the same level (Figure 2E). For spike length, the G5 group, including landraces Baimangmai, Lanhuamai, and Youmangbaifu, was significantly shorter than those of the other groups. Thus, InDels are useful markers for analyzing wheat population structures to present the characteristics and phenotypic distinctions.

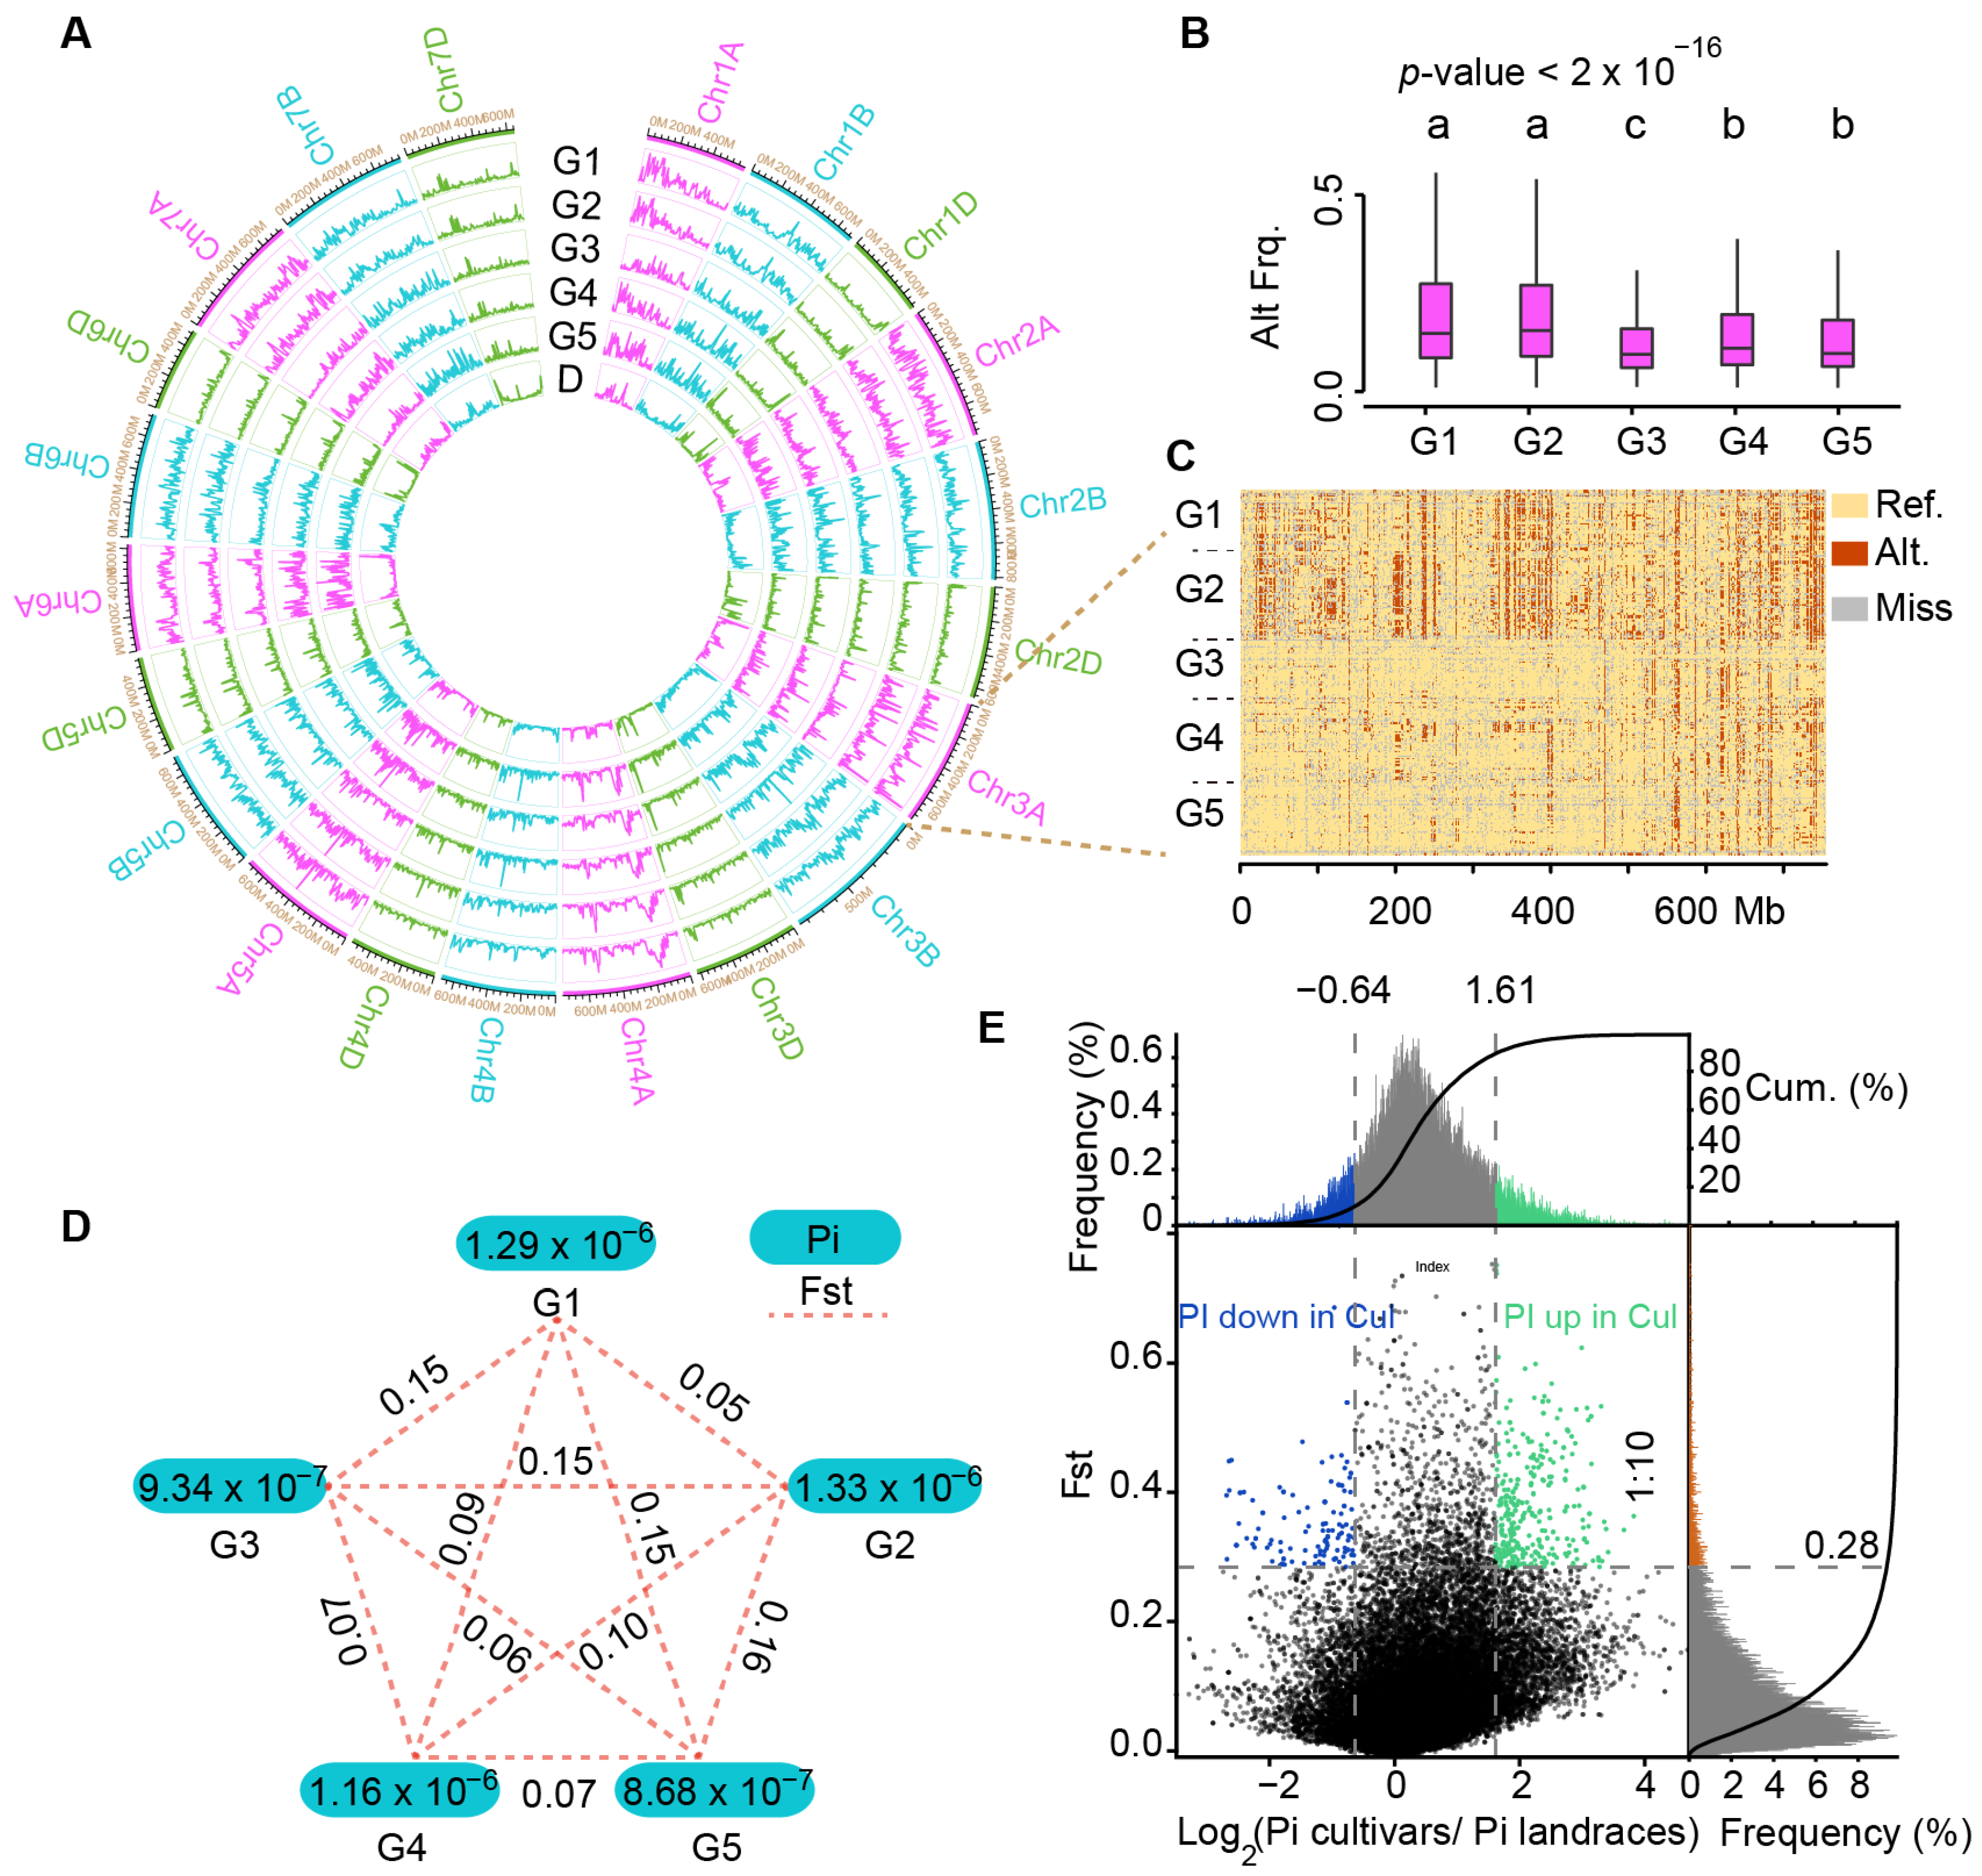
2.3. Estimation of Molecular Diversity of Chinese Mini-Core Collection Accession Using InDel Markers

Alternate allele frequency analysis showed significant differences between subgroups (p < 2 × 10⁻¹⁶). The alternate allele frequencies of G1 (0.20) and G2 (0.20) were higher than those of G3 (0.12), G4 (0.15) and G5 (0.15) (Figure 3A,B). Chromosome 3A was then used as an example to clearly illustrate this distinction. As shown in Figure 3C, G1 and G2 showed a visibly higher alternate allele (0.19 and 0.20) frequency than G3 (0.09), 4 (0.11), and 5 (0.11) in a long chromosome region (about 1–550 Mb) in Chr3A that included several important functionally known genes in wheat, such as TaMFT-A1 for seed germination [28], TaGI1 for photoperiodic flowering [29]), TaFT2 for flowering time [30] and TaGS5-A1 for thousand-kernel weight [31]. Additional homologs to functionally characterized rice genes included Gn1 (CKX2) for spikelet number determination [32], SRS3 for grain length [33], and TGW6 for grain weight and increased yield [34]. The observations indicated that these loci may be selected during breeding, which was supported by the presence of 11 selection sweeps from landraces to cultivars and nine pedigree-based haplotype blocks with cumulative length, 60 Mb, as shown by [14].
We subsequently used InDels to calculate nucleotide diversity (π) and fixation index (Fst) among accessions of the Chinese mini-core collection. The results showed that G3 (9.34 × 10⁷) and G5 (8.68 × 10⁷) groups showed slightly lower levels of nucleotide diversity than others (Figure 3D). By π and Fst, G1 and G2 could be grouped together, while G3, G4 and G5 formed as a second group (Figure 3D), consistent with the results of the cluster dendrogram (Figure 2A), population structure (Figure 2A), and SNP variation frequency (Figure 3B). In fact, G1 and G2 contained 79.5% cultivars (called G1,2 group), while the remaining three groups (G3, G4, and G5, hence G3–5 group) represented 86.5% of landraces. The π ratio (πG1,2G2–4) and Fst (tiled every 200 kb in 1Mb window) was calculated between G1,2 group and G3–5 group, which revealed genomic diversity signatures along the 21 chromosomes (Figure 3E). A total of 284 Mb and 134.2 Mb highly divergent chromosome fragments were identified for G1,2 and G3–5, respectively. Interestingly, the cultivar-enriched G1,2 group had higher nucleotide diversity in 284 Mb selected regions that that of G3–5, while it was vice versa in the 134.2 Mb regions. In both cases, only a few percent were derived from the D subgenome while the remaining were from the A and B subgenomes (Supplemental Tables S6 and S7), indicating that A and B subgenomes are more diverse than the D subgenome, consistent with the observation from regular SNPs.

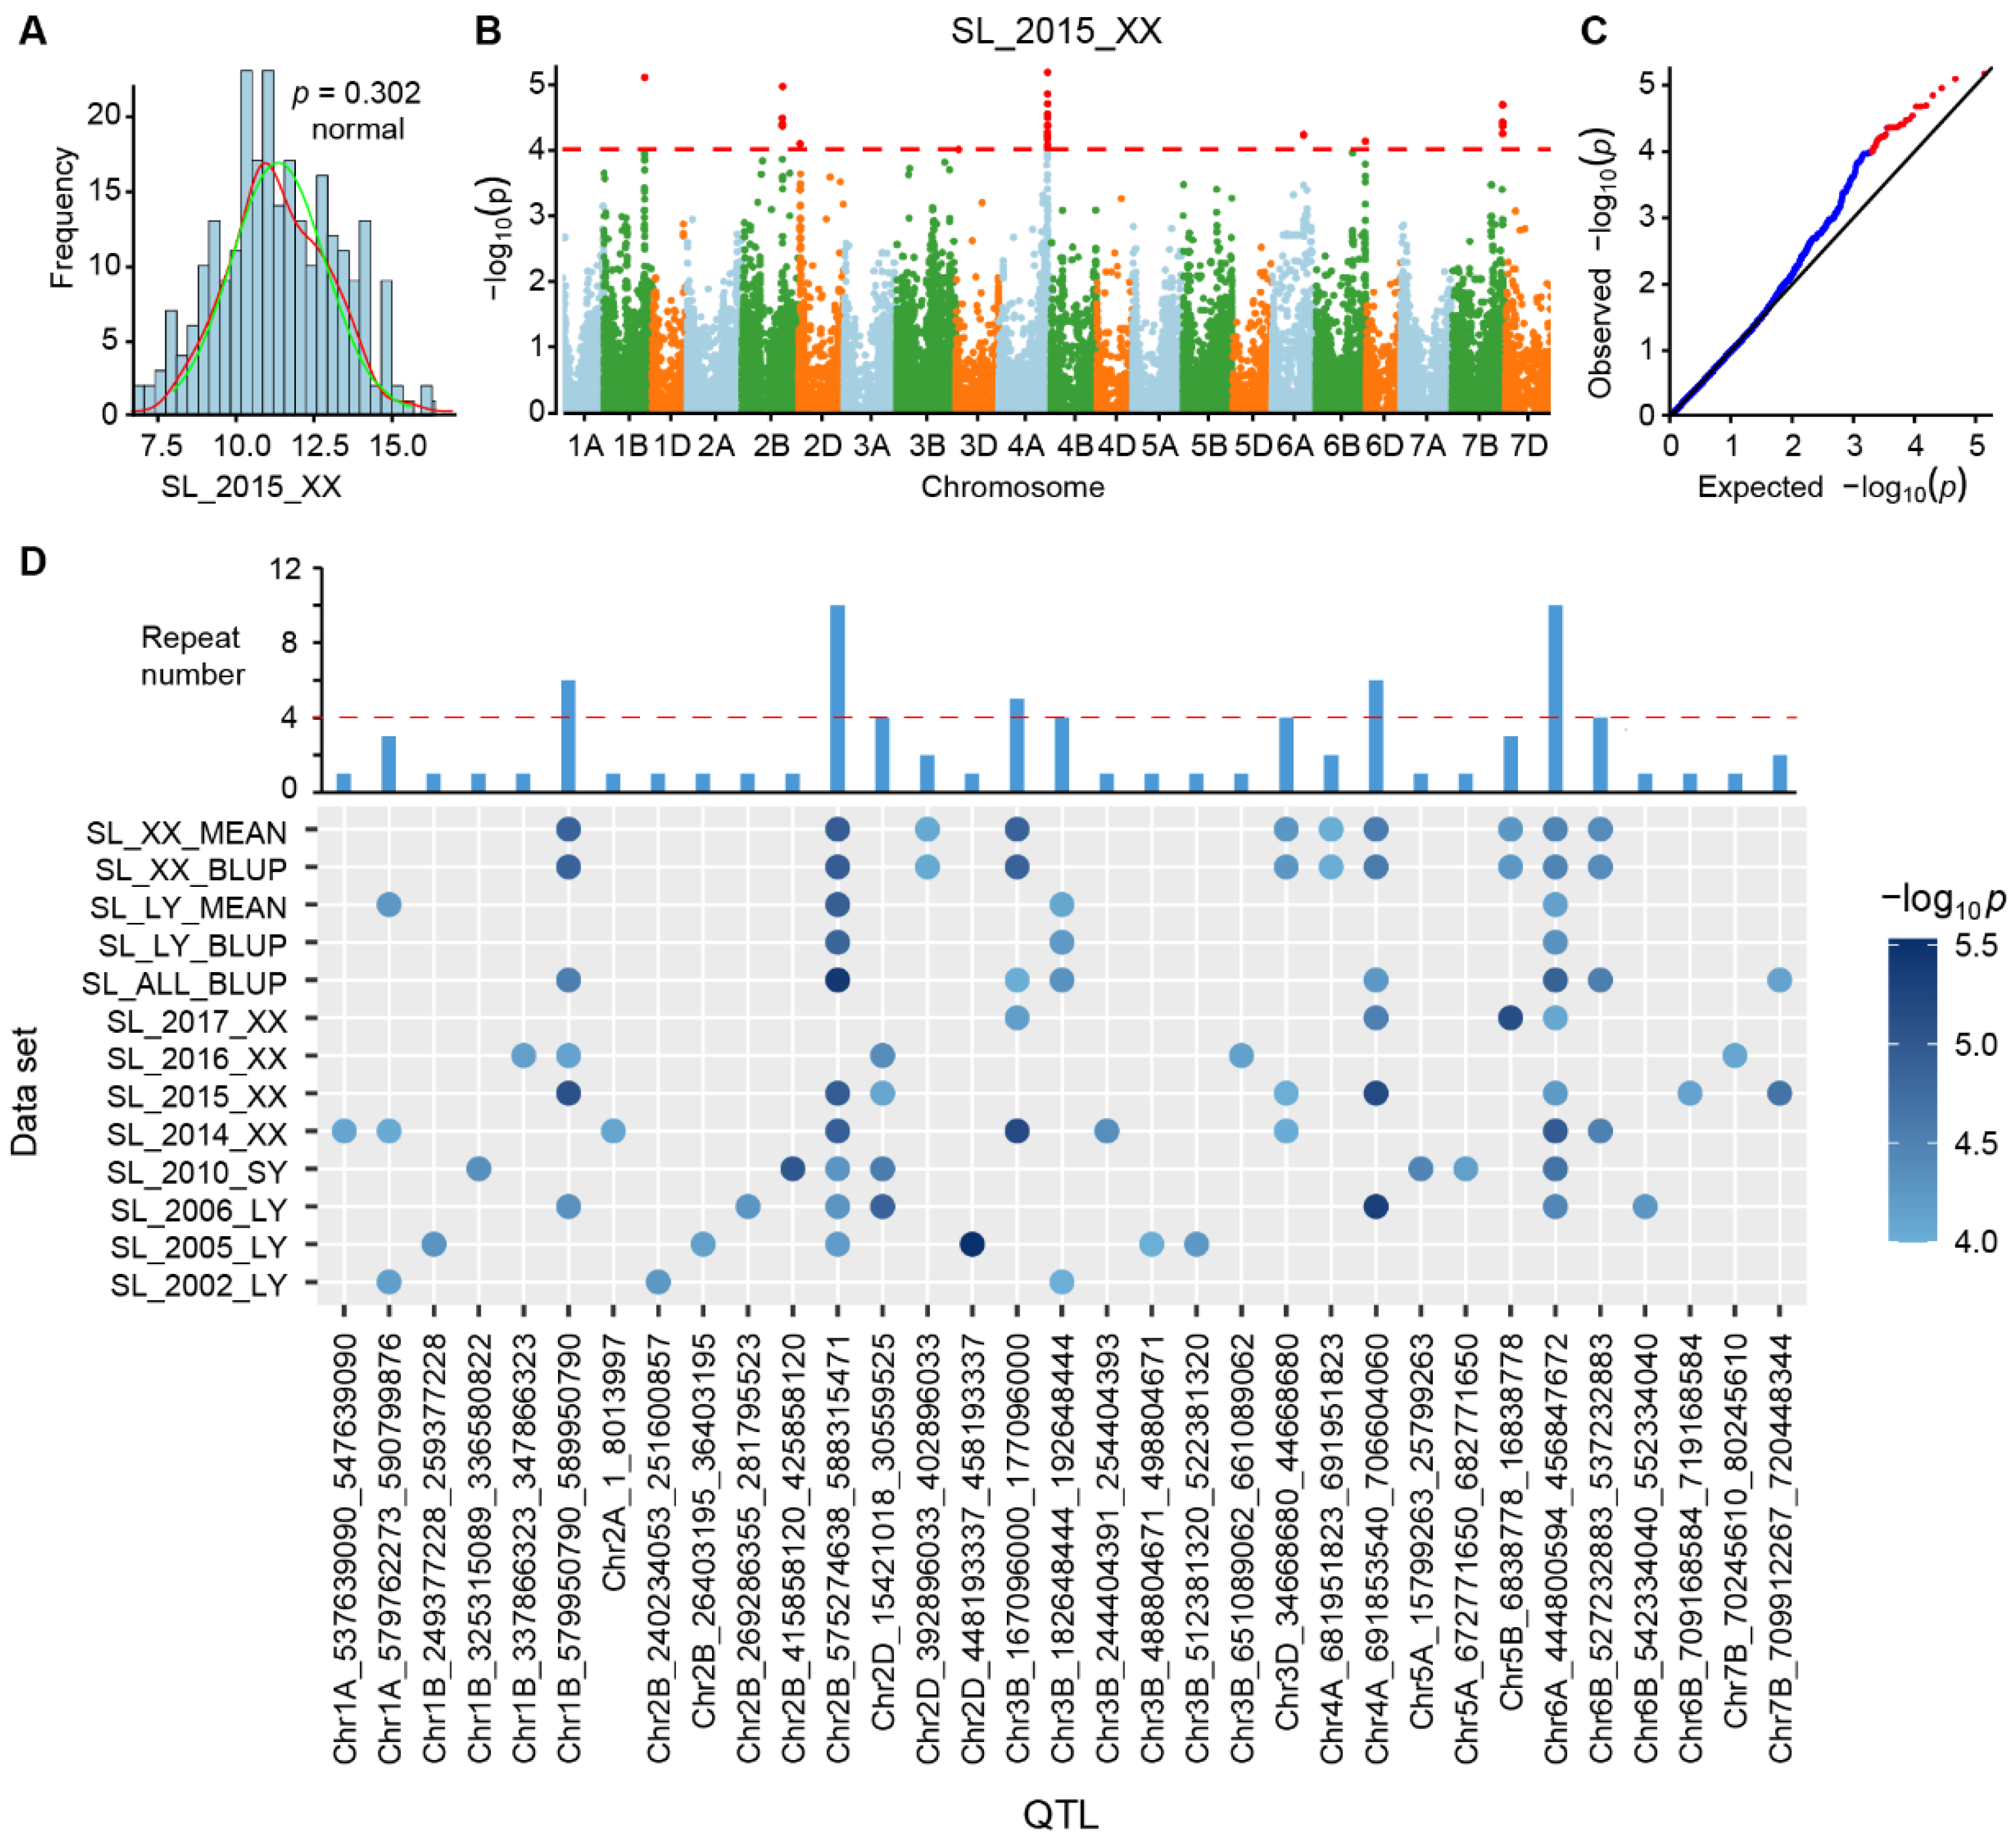
2.4. InDel-Based Genome-Wide Association Study (GWAS) on Wheat Spike Length

As indicated by the cluster dendrogram and population structure, which indicate that accessions in the Chinese mini-core collection can be divided into five subpopulations, we applied the first five PCs for GWAS using the mixed linear model against 13 sets of trait values for spike length traits (including the BLUP and mean values) in the Genome-wide Efficient Mixed Model Association (GEMMA) toolkit. The phenotypic data of spike length conformed to a normal distribution (Figure 4A). A total of 87 significant (p-value < 1.0 × 10⁴) InDels were identified to be associated with spike length (Figure 4B) [35]. Quantile-quantile (QQ) plot of the data showed an acceptable separation of the observed from the expected (Figure 4C). Due to the strong linkage disequilibrium in common wheat genome, significant InDels with adjacent distances less than 5Mb were incorporated into the same GWAS-derived QTL. A total of 33 GWAS-derived QTL were identified, of which 15 overlapped with reported QTL (Figure 4D and Supplemental Table S8). Five of the QTL were replicated more than four times in different environments (Figure 4D). A total of 3236 genes were located in GWAS-derived QTL, 334 of which were known genes (Supplemental Table S9), including several for spike length, such as OsER1 [36]. GO enrichment analysis showed that these genes were significantly enriched in GO:0010455-positive regulation of the cell fate process (p-value = 6.77 × 10⁶), GO:0016998-cell wall macromolecule catabolic process (p-value = 1.32 × 10⁵), and GO:0045493-xylan catabolic process (p-value = 1.87 × 10⁵) (Figure S3), suggesting their potential effect on cell wall development.
We then scrutinized the top 2 GWAS-derived QTL (Chr2B:575274638-588315471 and Chr6A:444800594-456847672) that were detected in ten environments. On Chromosome 2B, the highest peak marker was InDel:583315471 with −log10p = 5.42, and overlapped with a reported spike length QTL, Chr2B_578399456 (Figure S4A, Supplemental Table S8). Accessions with the deletion genotype for the peak InDel:Chr2B_583315471 had a significantly shorter spike than those with the reference genotype in cultivars (Figure S4B). Moreover, InDel:Chr2B_583315471 was located in a stable LD block that spanned 4.98 Mb from 581,531,948 to 586,515,317 and contained 14 genes expressing in spike (TPM more than 1 in spike) (Figure S4C,D; Supplemental Table S9). These genes were considered as candidates contributing to the effect of the QTL Chr2B:575274638-588315471. On Chromosome 6A, the sole peak (−log10p = 4.97) at the middle was located in a LD block (from 450,071,383 to 455,065,356) (Figure S5A,B). Accessions represented by peak InDel: Chr6A_450503278 showed significant differences in spike length (p < 0.05) in both landraces and cultivars (Figure S5C). The LD block harboring peak InDel contained 21 genes expressed (TPM > 1) in spike (Figure S5D). These genes were considered as candidate genes contributing to the effect of the QTL Chr6A:444800594-456847672 (Figure S5D; Supplemental Table S9) that can be further verified.

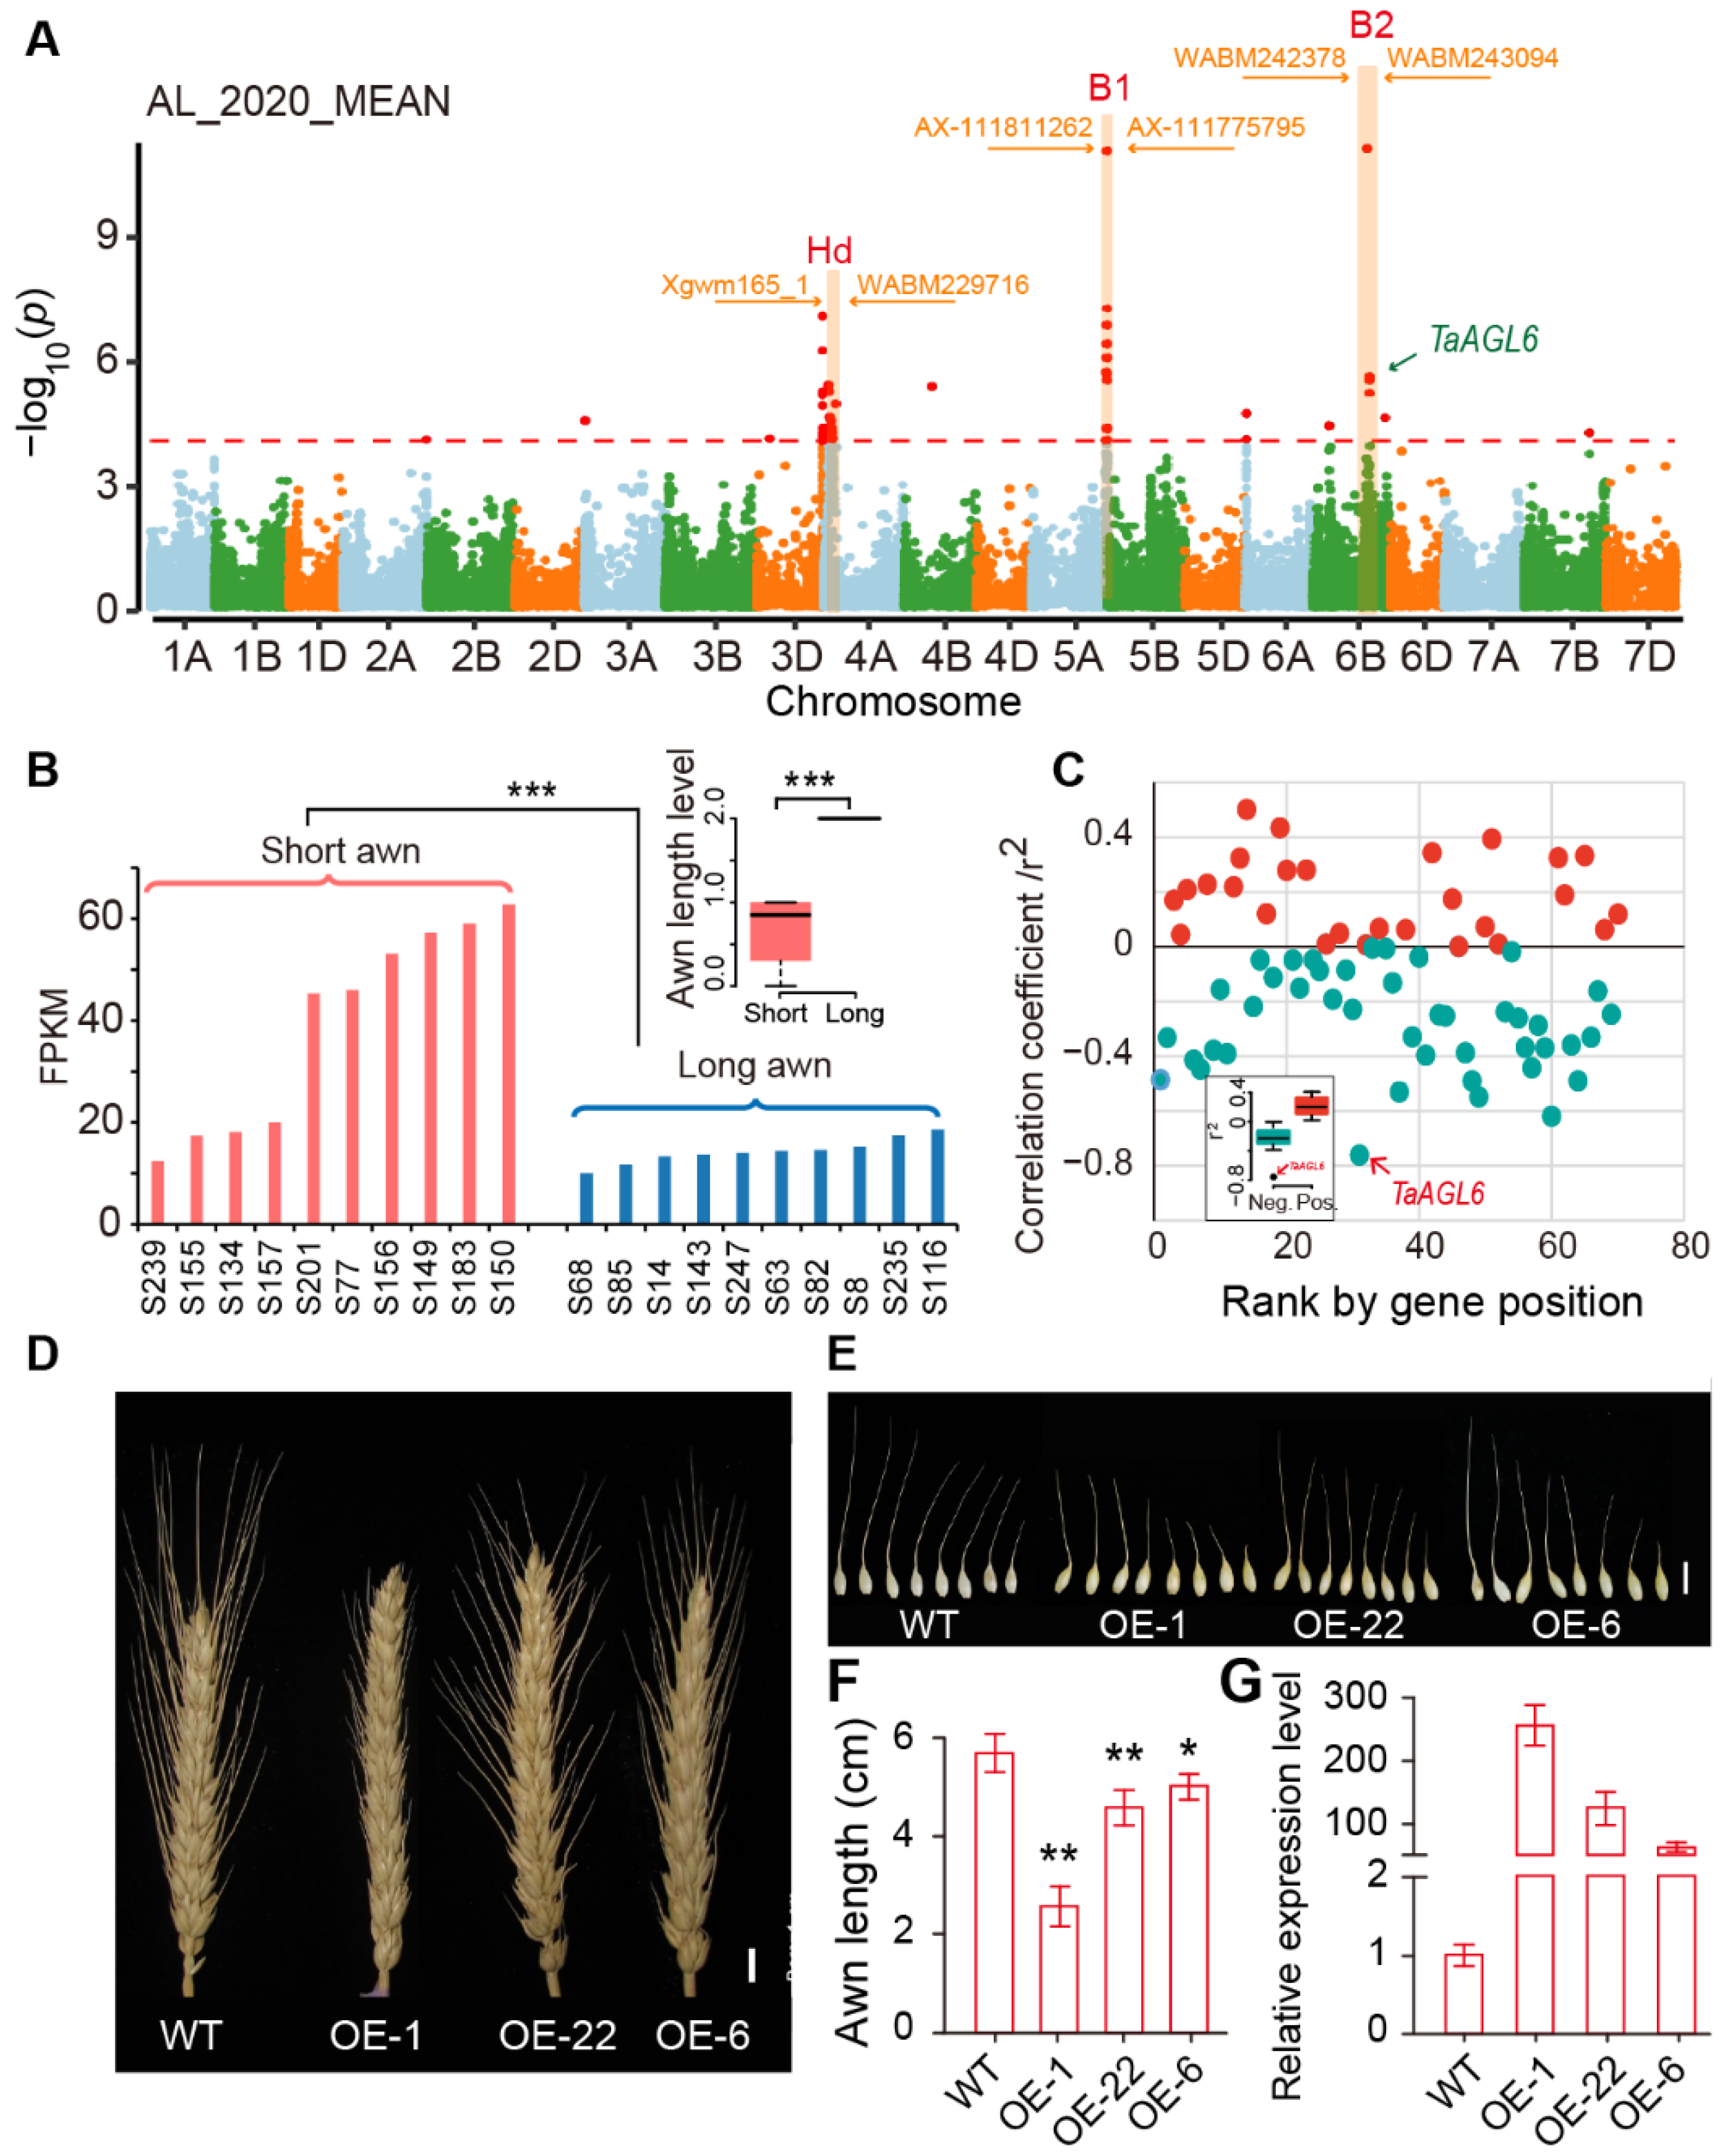
2.5. Identification of an Awn Inhibitor at the Tipped 2 (B2) Locus by GWAS

Awns are stiff, bristle-like structures extending from the tip of floret lemma in wheat and are selected during domestication and breeding due to their contribution to drought resistance and yield [37]. We investigated major peaks associated with awn length and identified three major peaks on chromosomes 5A, 6B, and 4A, respectively, which overlapped with previously reported B1 (Tipped 1), B2 (Tipped 2) and Hd (Hooded) QTL that were known as dominant suppressors for awn development [24,25] (Figure 5A; Supplemental Table S8). B1 has recently been cloned as a C2H2 transcription factor with an EAR domain of transcription repression functions [26,38,39,40]. The most significant (−log10p = 12.85) InDel in the B1 locus in our study was Chr5A_700804911, located at 19.8 kb upstream of this C2H2 gene.
We then focused on the B2 locus on chromosome 6B for which the causal gene has not been cloned. We examined the genes which fell within 5-Mb distance of the significant InDels (−log10p = 11.06 of peak InDel). Genetically, B2 is one of the three awn suppressors. Thus, we studied the RNA-seq data that generated from young spikes and compared with their expression patterns between two pools with 10 long-awned and 10 awnless accessions, respectively (Figure 5B). We identified TraesCS6B03G0828100, the wheat MADS-box 6 gene (TaAGL6), as an outlier that was most negatively correlated with awn length (r2 = −0.76) (Figure 5C). Importantly, TaAGL6 was expressed at high levels in young inflorescences of awnletted accessions, while its expression was low in long-awned accessions (Figure 5B), consistent with its genetic role as a dominant repressor for awn development [25]. We then overexpressed TaAGL6 in cv. Fielder and found that awns in transgenic plants were significantly reduced in length (Figure 5D–G), strongly suggesting TaAGL6 as a candidate gene for the B2 locus.

3. Discussion

3.1. InDel Diversity Was Comparable between Wheat Cultivars and Landraces

Common wheat originated in the Fertile Crescent of the Middle East. Chinese landraces are a branch in the process of world wheat dispersal and may be low in diversity relative to the accessions in the world as a whole. In contrast, modern Chinese cultivars have integrated extensive genetic germplasm from a wide range of resources, including international varieties, making them more diverse relative to landraces. Since the beginning of wheat breeding in China, introduced cultivars, such as Mentana, Funo, and Abbondana from Italy, Early Premium from US, and Lovrin 10 from Europe, as well as cultivars from CIMMYT, were widely used as founder parents [3]. Here, in our study, at the InDel level, we found that the diversity of cultivars was indeed comparable to that of landraces (Figure 2C and Figure 3D). This result is consistent with reported diversity between landraces and cultivars at the SNP level [5,14], suggesting that breeding activities were important for self-pollination crops such as wheat with increased diversity and had greatly expanded the genetic basis of modern Chinese cultivars. Similar trends of expanded genetic basis in cultivars were also observed in the international wheat collection, as reported elsewhere [41].

3.2. InDels Are Effective Supplements to the Analysis of Population Genetic Variation

The second-generation sequencing technologies perform large-scale sequencing, allowing the detection of large-scale mutations. Among the mutations detected, SNPs are the largest in number and most widely used in population research [42], evolutionary domestication analysis [10,43], genome-wide association analysis [44], and QTL localization [45]; however, they do not represent the whole variation of the genome. InDel, as a small fragment of variation, can cause direct damage to gene coding functions or gene regulatory regions. A large number of insertions/deletions as well as large fragment structural variants (CNV, SV, Pvals) also have a wide range of biological significance and population structure characteristics in the genome [46,47,48]. Some of them can directly affect the phenotype of crops [49,50]. However, due to the limitation of technology and cost, these variants have not been used as widely and extensively as SNPs in functional genome research. In Arabidopsis, Liu et al. (2021) developed InDelEnsembler to detect large InDels in 1047 Arabidopsis whole-genome sequencing data and discovered novel phenotypic InDels of size > 50 bp that cannot be found in previous studies [51]. In wheat, due to the extremely large size of wheat genome, it is very difficult to find large InDels in the whole genome, let alone discover InDels directly affecting the phenotypes. Here, although we did not identify InDels on the causal genes, we indeed found that the population structure and genetic diversity reflected by InDels were consistent with SNP results, indicating that InDels can also be well used in the study of wheat population structure. By comparing the correlational analysis results of InDels and SNPs, we found that 36% of the QTL in spike length and 71% of the QTL in awn length were also detected by SNPs. These well-known loci overlapped with QTL that were detectable mostly in multi-environments, demonstrating the utility of InDels for GWAS research and in novel loci determination. Moreover, Chinese wheat mini-core collection can be divided into two groups, either by InDel or SNP, representing landraces and cultivars, respectively [5]. However, with the increase in the number of population components, InDels can help dissect them into additional groups, as shown by differences in their phenotypes, demonstrating that InDels can provide extra genetic information related to phenotypes and agricultural traits. Although InDels at genic regions, such as transcription factor binding sites, may cause more severe biological effects, their presence in the genome is far lower than the SNP variations. InDels are thus supplemental to SNPs, not replacing SNPs in diversity analyses.

3.3. InDels Associated with Awn Length Traits

Wheat awns carry the abilities of photosynthesis and carbon exchange, which are responsible for yield in certain conditions [24,52]. At present, many QTL related to awn development have been mapped in rice, such as An-1, An-2, An-4, An-6, An-7, An-8, An-9, and An-10 [53,54]. However, it is difficult to clone the genes in these QTL. Only the genes in An-1 and An-2 have been cloned [53,54], and some other awn-related genes have also been reported, such as RAE2, OsYABBY and OsETT2 [55,56].
In wheat, B1 (Tipped 1), B2 (Tipped 2) and Hd (Hooded) have been known as genetic loci for awn development as early as 1940 [57]. However, the gene underlying B1 has not been cloned until recently as a C2H2 transcription factor with an EAR domain of transcription repression functions [26,38,39,40]. Sequence polymorphisms in the B1 coding region were not observed in diverse wheat germplasm, whereas a nearby polymorphism was highly predictive of awn suppression [38]. Here, the B1 locus has been mapped by a peak InDel with a high p-value (−log10p = 12.85), demonstrating the validity of our InDel analysis in some way. Additional 28 significant InDels in the region may help in further mining the functional variations in the gene.
The causal genes for B2 and Hd are still unknown. One of the main reasons for the difficulty in cloning wheat awn genes is the large LD interval at these regions. InDels extended the polymorphic intervals. Thus, besides SNPs, InDels further facilitate final causal gene identification. By referring to the experience of B1 cloning and the negative correlation between gene expression levels and awn phenotypes, we identified TaAGL6 as a candidate causal gene for the B2 locus. Our work therefore demonstrates the significance of InDels in wheat population studies and in the application of InDels in wheat breeding.

4. Materials and Methods

4.1. Sampling and Phenotyping

Two hundred and sixty-two (262) accessions from the Chinese mini-core collection were as described previously [5]. Phenotyping of spike length (SL) was investigated in eight environments, namely 2002, 2005 and 2006, at Luoyang in Henan province, 2010 at Shunyi District, Beijing, and 2014, 2015, 2016 and 2017 at Xinxiang in Henan province. Awn length were determined using a grading standard: zero stands for no awn;1 means that the awn length is less than or equal to 4cm; 2 means that the awn grows more than 4cm. All accessions were planted in an experimental field in Beijing with an arrangement order design including three replicates.

4.2. Sequence Capturing and Sequencing

Total genomic DNA from seedling was extracted with a Plant DNA Mini Kit (Aidlab Biotech, Beijing, China). The exon capture array designed by Jordan et al. was used, and the probes were obtained from Roche NimbleGen (http://www.nimblegen].com/products/seqcap/ez/designs/, accessed on 1 May 2021); the exon capture procedure is the same as that published by Jordan et al. [58]. The Illumina HiSeq X-ten platform was used to generate 46.66 billion paired-end reads with 150-bp read length.

4.3. Sequence Quality Checking and Filtering

The original data of the next-generation sequencing carried the adapter sequence that was added when the library was built. It is necessary to remove adapter contamination and low-quality value bases (both ends of the reads) and reads containing low quality values above a threshold level before data processing. In this study, reads with the following conditions were deleted: those containing n greater than 10%, those with the number of bases of phred quality < 5 accounting for more than 50%, and those with a length less than 120 bp.

4.4. Sequence Alignment and InDel Detection

The filtered raw data were aligned to the newest reference genome RefSeq v2.1 [15] using BWA (Burrows–Wheeler Aligner, Version: 0.7.17-r1188) software, with parameters: ‘mem-t 4-k 32-M’ [59]. Samtools (Version: 1.9) was used to convert the alignment results from the SAM file format to the BAM file format [60]. The low-quality reads of the alignment results were removed: (1) the quality value was greater than 10; (2) the mismatch was less than 5; (3) the PCR redundancy was removed; (4) the multiple alignments (≥2 hits). Subsequently, InDel calling was performed with the Genome Analysis Toolkit (GATK, version v4.0) by the HaplotypeCaller method [61]. Finally, variations that passed the quality filter (recommended parameters in GATK: -filter “QD < 2.0” --filter-name “QD2” \-filter “QUAL < 30.0” --filter-name “QUAL30”\-filter “FS > 200.0” --filter-name “FS200” \-filter “ReadPosRankSum < −20.0” --filter- name “ReadPosRankSum-20”) and met a miss ratio ≤ 0.3 and MAF ≥ 0.03 in the population were further used for phasing genotypes and imputing ungenotyped markers using Beagle(Version:4.1) software [62]. Finally, InDels that met a miss ratio ≤ 0.2 and MAF ≥ 0.05 in the population were used in the remaining analyses. Variation annotation was performed using the ANNOVAR (Version: 2013-05-20) software package based on the reference genome RefSeq v2.1 gene annotation information [63]. Here, the term “upstream” and “downstream” is defined, respectively, as the 2-kb region from the starting codon ATG or 2-kb away from the stop codon. If a variant is located in both downstream and upstream regions (possibly for two different genes), then the “upstream, downstream” will be printed in the output.

4.5. Population Genetics Analysis

Cluster analysis among materials used Hierarchical Clustering. Population structure was calculated by the Expectation Maximization algorithm (EM) based on ADMIXTURE software [64]. The number of populations from 2 to 5 (genetic clusters K) were assumed in the calculation process, and 10,000 iterations were used for each estimation. Plink (v1.90b6.10) software was used to perform Principal Component Analysis (PCA) and Linkage disequilibrium (LD) coefficient (r2) calculations with parameters ‘--bfile --pca’ and ‘- -ld-window-r2 0 --ld-window 99,999 --ld-window-kb 1000′ [65]. To reduce the impact of environmental differences at different experimental sites on GWAS, we performed Best Linear Unbiased Prediction (BLUP) on the phenotypic data using R lme4 package (Version:3.2.2). A sliding-window approach (500 kb windows sliding in 200 kb steps) was applied to quantify polymorphism levels (π, pairwise nucleotide variation as a measure of variability), and genetic differentiation (Fst) among sub-groups by vcftools software [66].

4.6. GWAS Analysis

Only InDels with MAF ≥ 0.05 and missing rate ≤ 0.2 in the population were used in the GWAS. An association analysis was performed using the genome-wide efficient mixed-model association (GEMMA) software package [67]. The population structure was represented by the first five principal components as fixed effects. In addition to the spike length value of eight environments, BLUP and MEAN values were applied to GWAS analysis. XX_BLUP: Best linear unbiased prediction (BLUP) value of phenotypic data collected from Xinxiang in 2014, 2015, 2016, 2017. XX_MEAN: Mean value of phenotypic data collected from Xinxiang in 2014, 2015, 2016, 2017. LY_BLUP: Best linear unbiased prediction (BLUP) value of phenotypic data collected from Luoyang in 2002, 2005 and 2006. LY_MEAN: Mean value of phenotypic data collected from Luoyang in 2002, 2005 and 2006. ALL_BLUP: BLUP value of phenotypic data collected from Xinxiang (2014, 2015, 2016, 2017), Luoyang (2002, 2005, 2006) and Shunyi (2010). BLUP was used to calculate the breeding values with lme4 packages in R.

4.7. Construction of TaAGL6 Overexpression Transgenic Lines

The construction method of TaAGL6 overexpression transgenic lines refers to Kong et al. Briefly, the pUbi:TaAGL6 construct was developed from the full-length ORF of TaAGL6 with a 6× myc tag at the N terminal. It was then cloned into the reconstructed binary vector pCAMBIA3300 containing the maize ubiquitin promoter [68].

4.8. Statistical Analysis

The R language comes with its own function, two-tailed Student’s t-test (Performs one and two sample t-test on vectors of data), which is used to perform statistical analysis of differences. The significance level was set at p = 0.05 (*), 0.01 (**) and 0.001 (***) in the whole context. In the GWAS analysis, the p-value was calculated with GAMMA. Reference [69] is cited in the supplementary materials.

Supplementary Materials

The following supporting information can be downloaded at: https://www.mdpi.com/article/10.3390/ijms23105587/s1.

Author Contributions

Conceptualization, L.M., S.L. and A.L.; methodology, Z.W., Z.D. and D.C.; software, Z.W., Z.D. and M.F.; validation, X.K., F.W. and S.L.; data analysis, Z.W. and R.L.; formal analysis, Z.W., Z.D., Y.C. and J.G.; resources, X.Z. and C.H.; writing—original draft preparation, Z.W; writing—review and editing, A.L., L.M., P.Z. and S.L.; visualization, Z.W., Z.D., G.S. and R.L.; supervision, L.M., A.L. and S.G.; project administration, A.L. and L.M.; funding acquisition, A.L. and L.M. All authors have read and agreed to the published version of the manuscript.

Funding

This work was supported by the National Natural Science Foundation of China (#31971930 & #32172050 to L.A.), Hebei Natural Science Foundation (C2021205013), and The Agricultural Science and Technology Innovation Program (CAAS-ZDRW202002, CAAS-ZDRW202201).

Institutional Review Board Statement

Not applicable.

Informed Consent Statement

Not applicable.

Data Availability Statement

The exome sequence data has been submitted to NCBI under the project number PRJNA550304 and is available upon the publication of the manuscript [5].

Conflicts of Interest

The authors declare no conflict of interest.

References

  1. He, Z.H.; Rajaram, S.; Xin, Z.Y.; Huang, G.Z. A History of Wheat Breeding in China; International Maize and Wheat Improvement Center: Mexico City, Mexico, 2001. [Google Scholar]
  2. Jin, S.B. Chinese Wheat Varieties and Their Pedigrees; Agricultural Publishing House: Beijing, China, 1983. [Google Scholar]
  3. Zhuang, Q. Chinese Wheat Improvement and Pedigrees Analysis; Agricultural Publishing House: Beijing, China, 2003. [Google Scholar]
  4. Hao, C.Y.; Dong, Y.S.; Wang, L.F.; You, G.X.; Zhang, H.N.; Ge, H.M.; Jia, J.Z.; Zhang, X.Y. Genetic diversity and construction of core collection in Chinese wheat genetic resources. Chin. Sci. Bull. 2008, 53, 1518–1526. [Google Scholar] [CrossRef] [Green Version]
  5. Li, A.; Hao, C.; Wang, Z.; Geng, S.; Jia, M.; Wang, F.; Han, X.; Kong, X.; Yin, L.; Tao, S.; et al. Wheat breeding history reveals synergistic selection of pleiotropic genomic sites for plant architecture and grain yield. Mol. Plant 2022, 15, 504–519. [Google Scholar] [CrossRef]
  6. Jin, T.; Sun, Y.; Shan, Z.; He, J.; Wang, N.; Gai, J.; Li, Y. Natural variation in the promoter of GsERD15B affects salt tolerance in soybean. Plant Biotechnol. J. 2021, 19, 1155–1169. [Google Scholar] [CrossRef] [PubMed]
  7. Wang, X.; Wang, H.; Liu, S.; Ferjani, A.; Li, J.; Yan, J.; Yang, X.; Qin, F. Genetic variation in ZmVPP1 contributes to drought tolerance in maize seedlings. Nat. Genet. 2016, 48, 1233–1241. [Google Scholar] [CrossRef] [PubMed]
  8. Miho, F.; Yokosho, K.; Yamaji, N.; Saisho, D.; Yamane, M.; Takahashi, H.; Sato, K.; Nakazono, M. Acquisition of aluminium tolerance by modification of a single gene in barley. Nat. Commun. 2012, 3, 713. [Google Scholar] [CrossRef]
  9. IWGSC. Shifting the limits in wheat research and breeding using a fully annotated reference genome. Science 2018, 361, eaar7191. [Google Scholar] [CrossRef] [Green Version]
  10. Pont, C.; Leroy, T.; Seidel, M.; Tondelli, A.; Duchemin, W.; Armisen, D.; Lang, D.; Bustos-Korts, D.; Goue, N.; Balfourier, F.; et al. Tracing the ancestry of modern bread wheats. Nat. Genet. 2019, 51, 905–911. [Google Scholar] [CrossRef]
  11. He, F.; Pasam, R.; Shi, F.; Kant, S.; Keeble-Gagnere, G.; Kay, P.; Forrest, K.; Fritz, A.; Hucl, P.; Wiebe, K.; et al. Exome sequencing highlights the role of wild-relative introgression in shaping the adaptive landscape of the wheat genome. Nat. Genet. 2019, 51, 896–904. [Google Scholar] [CrossRef]
  12. Juliana, P.; Montesinos-Lopez, O.A.; Crossa, J.; Mondal, S.; Perez, L.G.; Poland, J.; Huerta-Espino, J.; Crespo-Herrera, L.; Govindan, V.; Dreisigacker, S.; et al. Integrating genomic-enabled prediction and high-throughput phenotyping in breeding for climate-resilient bread wheat. Theor. Appl. Genet. 2019, 132, 177–194. [Google Scholar] [CrossRef] [Green Version]
  13. Pang, Y.; Liu, C.; Wang, D.; St Amand, P.; Bernardo, A.; Li, W.; He, F.; Li, L.; Wang, L.; Yuan, X.; et al. High-Resolution Genome-wide Association Study Identifies Genomic Regions and Candidate Genes for Important Agronomic Traits in Wheat. Mol. Plant 2020, 13, 1311–1327. [Google Scholar] [CrossRef]
  14. Hao, C.; Jiao, C.; Hou, J.; Li, T.; Liu, H.; Wang, Y.; Zheng, J.; Liu, H.; Bi, Z.; Xu, F.; et al. Resequencing of 145 Landmark Cultivars Reveals Asymmetric Sub-genome Selection and Strong Founder Genotype Effects on Wheat Breeding in China. Mol. Plant 2020, 13, 1733–1751. [Google Scholar] [CrossRef] [PubMed]
  15. Zhu, T.; Wang, L.; Rimbert, H.; Rodriguez, J.C.; Deal, K.R.; De Oliveira, R.; Choulet, F.; Keeble-Gagnère, G.; Tibbits, J.; Rogers, J.; et al. Optical maps refine the bread wheat Triticum aestivum cv. Chinese Spring genome assembly. Plant J. 2021, 107, 303–314. [Google Scholar] [CrossRef] [PubMed]
  16. Sharma, S.N.; Sain, R.S.; Sharma, R.K. Genetics of spike length in durum wheat. Euphytica 2003, 130, 155–161. [Google Scholar] [CrossRef]
  17. Sanchez-Bragado, R.; Molero, G.; Reynolds, M.P.; Araus, J.L. Relative contribution of shoot and ear photosynthesis to grain filling in wheat under good agronomical conditions assessed by differential organ delta C-13. J. Exp. Bot. 2014, 65, 5401–5413. [Google Scholar] [CrossRef] [PubMed] [Green Version]
  18. Sanchez-Bragado, R.; Molero, G.; Reynolds, M.P.; Araus, J.L. Photosynthetic contribution of the ear to grain filling in wheat: A comparison of different methodologies for evaluation. J. Exp. Bot. 2016, 67, 2787–2798. [Google Scholar] [CrossRef] [PubMed]
  19. Guo, Z.F.; Zhao, Y.S.; Roder, M.S.; Reif, J.C.; Ganal, M.W.; Chen, D.J.; Schnurbusch, T. Manipulation and prediction of spike morphology traits for the improvement of grain yield in wheat. Sci. Rep. 2018, 8, 14435. [Google Scholar] [CrossRef]
  20. Faris, J.D.; Fellers, J.P.; Brooks, S.A.; Gill, B.S. A bacterial artificial chromosome contig spanning the major domestication locus Q in wheat and identification of a candidate gene. Genetics 2003, 164, 311–321. [Google Scholar] [CrossRef]
  21. Sormacheva, I.; Golovnina, K.; Vavilova, V.; Kosuge, K.; Watanabe, N.; Blinov, A.; Goncharov, N.P. Q gene variability in wheat species with different spike morphology. Genet. Resour. Crop Evol. 2015, 62, 837–852. [Google Scholar] [CrossRef]
  22. Dixon, L.E.; Greenwood, J.R.; Bencivenga, S.; Zhang, P.; Cockram, J.; Mellers, G.; Ramm, K.; Cavanagh, C.; Swain, S.M.; Boden, S.A. TEOSINTE BRANCHED1 Regulates Inflorescence Architecture and Development in Bread Wheat (Triticum aestivum). Plant Cell 2018, 30, 563–581. [Google Scholar] [CrossRef] [Green Version]
  23. Li, Y.; Li, L.; Zhao, M.; Guo, L.; Guo, X.; Zhao, D.; Batool, A.; Dong, B.; Xu, H.; Cui, S.; et al. Wheat FRIZZY PANICLE activates VERNALIZATION1-A and HOMEOBOX4-A to regulate spike development in wheat. Plant Biotechnol. J. 2021, 19, 1141–1154. [Google Scholar] [CrossRef]
  24. Niu, J.Q.; Zheng, S.S.; Shi, X.L.; Si, Y.Q.; Tian, S.Q.; He, Y.L.; Ling, H.Q. Fine mapping and characterization of the awn inhibitor B1 locus in common wheat (Triticum aestivum L.). Crop J. 2020, 8, 613–622. [Google Scholar] [CrossRef]
  25. Yoshioka, M.; Iehisa, J.C.M.; Ohno, R.; Kimura, T.; Enoki, H.; Nishimura, S.; Nasuda, S.; Takumi, S. Three dominant awnless genes in common wheat: Fine mapping, interaction and contribution to diversity in awn shape and length. PLoS ONE 2017, 12, e0176148. [Google Scholar] [CrossRef] [PubMed] [Green Version]
  26. DeWitt, N.; Guedira, M.; Lauer, E.; Sarinelli, M.; Tyagi, P.; Fu, D.L.; Hao, Q.Q.; Murphy, J.P.; Marshall, D.; Akhunova, A.; et al. Sequence-based mapping identifies a candidate transcription repressor underlying awn suppression at the B1 locus in wheat. New Phytol. 2020, 225, 326–339. [Google Scholar] [CrossRef] [Green Version]
  27. Barton, A.B.; Pekosz, M.R.; Kurvathi, R.S.; Kaback, D.B. Meiotic recombination at the ends of chromosomes in Saccharomyces cerevisiae. Genetics 2008, 179, 1221–1235. [Google Scholar] [CrossRef] [Green Version]
  28. Lei, L.; Zhu, X.; Wang, S.; Zhu, M.; Carver, B.F.; Yan, L. TaMFT-A1 is associated with seed germination sensitive to temperature in winter wheat. PLoS ONE 2013, 8, e73330. [Google Scholar] [CrossRef] [PubMed] [Green Version]
  29. Zhao, X.Y.; Liu, M.S.; Li, J.R.; Guan, C.M.; Zhang, X.S. The wheat TaGI1, involved in photoperiodic flowering, encodes an Arabidopsis GI ortholog. Plant Mol. Biol. 2005, 58, 53–64. [Google Scholar] [CrossRef] [PubMed]
  30. Li, C.; Dubcovsky, J. Wheat FT protein regulates VRN1 transcription through interactions with FDL2. Plant J. 2008, 55, 543–554. [Google Scholar] [CrossRef] [Green Version]
  31. Wang, S.; Yan, X.; Wang, Y.; Liu, H.; Cui, D.; Chen, F. Haplotypes of the TaGS5-A1 Gene Are Associated with Thousand-Kernel Weight in Chinese Bread Wheat. Front. Plant Sci. 2016, 7, 783. [Google Scholar] [CrossRef] [Green Version]
  32. Li, S.; Zhao, B.; Yuan, D.; Duan, M.; Qian, Q.; Tang, L.; Wang, B.; Liu, X.; Zhang, J.; Wang, J.; et al. Rice zinc finger protein DST enhances grain production through controlling Gn1a/OsCKX2 expression. Proc. Natl. Acad. Sci. USA 2013, 110, 3167–3172. [Google Scholar] [CrossRef] [Green Version]
  33. Deng, Z.Y.; Liu, L.T.; Li, T.; Yan, S.; Kuang, B.J.; Huang, S.J.; Yan, C.J.; Wang, T. OsKinesin-13A is an active microtubule depolymerase involved in glume length regulation via affecting cell elongation. Sci. Rep. 2015, 5, 9457. [Google Scholar] [CrossRef] [Green Version]
  34. Ishimaru, K.; Hirotsu, N.; Madoka, Y.; Murakami, N.; Hara, N.; Onodera, H.; Kashiwagi, T.; Ujiie, K.; Shimizu, B.; Onishi, A.; et al. Loss of function of the IAA-glucose hydrolase gene TGW6 enhances rice grain weight and increases yield. Nat. Genet. 2013, 45, 707–711. [Google Scholar] [CrossRef] [PubMed]
  35. Schierenbeck, M.; Alqudah, A.M.; Lohwasser, U.; Tarawneh, R.A.; Simón, M.R.; Börner, A. Genetic dissection of grain architecture-related traits in a winter wheat population. BMC Plant Biol. 2021, 21, 417. [Google Scholar] [CrossRef] [PubMed]
  36. Zhang, Y.; Li, S.; Xue, S.; Yang, S.; Huang, J.; Wang, L. Phylogenetic and CRISPR/Cas9 Studies in Deciphering the Evolutionary Trajectory and Phenotypic Impacts of Rice ERECTA Genes. Front. Plant Sci. 2018, 9, 473. [Google Scholar] [CrossRef] [PubMed]
  37. Sanchez-Bragado, R.; Kim, J.W.; Rivera-Amado, C.; Molero, G.; Araus, J.L.; Savin, R.; Slafer, G.A. Are awns truly relevant for wheat yields? A study of performance of awned/awnless isogenic lines and their response to source-sink manipulations. Field Crop Res. 2020, 254, 107827. [Google Scholar] [CrossRef]
  38. Huang, D.Q.; Zheng, Q.; Melchkart, T.; Bekkaoui, Y.; Konkin, D.J.F.; Kagale, S.; Martucci, M.; You, F.M.; Clarke, M.; Adamski, N.M.; et al. Dominant inhibition of awn development by a putative zinc-finger transcriptional repressor expressed at the B1 locus in wheat. New Phytol. 2020, 225, 340–355. [Google Scholar] [CrossRef] [Green Version]
  39. Wurschum, T.; Jahne, F.; Phillips, A.L.; Langer, S.M.; Longin, C.F.H.; Tucker, M.R.; Leiser, W.L. Misexpression of a transcriptional repressor candidate provides a molecular mechanism for the suppression of awns by Tipped 1 in wheat. J. Exp. Bot. 2020, 71, 3428–3436. [Google Scholar] [CrossRef] [Green Version]
  40. Wang, D.Z.; Yu, K.; Jin, D.; Sun, L.H.; Chu, J.F.; Wu, W.Y.; Xin, P.Y.; Gregova, E.; Li, X.; Sun, J.Z.; et al. Natural variations in the promoter of Awn Length Inhibitor 1 (ALI-1) are associated with awn elongation and grain length in common wheat. Plant J. 2020, 101, 1075–1090. [Google Scholar] [CrossRef]
  41. Balfourier, F.; Bouchet, S.; Robert, S.; De Oliveira, R.; Rimbert, H.; Kitt, J.; Choulet, F.; Appels, R.; Feuillet, C.; Keller, B.; et al. Worldwide phylogeography and history of wheat genetic diversity. Sci. Adv. 2019, 5, eaav0536. [Google Scholar] [CrossRef] [Green Version]
  42. Juliana, P.; Poland, J.; Huerta-Espino, J.; Shrestha, S.; Crossa, J.; Crespo-Herrera, L.; Toledo, F.H.; Govindan, V.; Mondal, S.; Kumar, U.; et al. Improving grain yield, stress resilience and quality of bread wheat using large-scale genomics. Nat. Genet. 2019, 51, 1530–1539. [Google Scholar] [CrossRef]
  43. Lu, K.; Wei, L.; Li, X.; Wang, Y.; Wu, J.; Liu, M.; Zhang, C.; Chen, Z.; Xiao, Z.; Jian, H.; et al. Whole-genome resequencing reveals Brassica napus origin and genetic loci involved in its improvement. Nat. Commun. 2019, 10, 1154. [Google Scholar] [CrossRef] [Green Version]
  44. Ma, Z.; He, S.; Wang, X.; Sun, J.; Zhang, Y.; Zhang, G.; Wu, L.; Li, Z.; Liu, Z.; Sun, G.; et al. Resequencing a core collection of upland cotton identifies genomic variation and loci influencing fiber quality and yield. Nat. Genet. 2018, 50, 803–813. [Google Scholar] [CrossRef] [PubMed]
  45. Jamann, T.M.; Balint-Kurti, P.J.; Holland, J.B. QTL mapping using high-throughput sequencing. Methods Mol. Biol. 2015, 1284, 257–285. [Google Scholar] [CrossRef] [PubMed]
  46. Qin, P.; Lu, H.; Du, H.; Wang, H.; Chen, W.; Chen, Z.; He, Q.; Ou, S.; Zhang, H.; Li, X.; et al. Pan-genome analysis of 33 genetically diverse rice accessions reveals hidden genomic variations. Cell 2021, 184, 3542–3558.e3516. [Google Scholar] [CrossRef]
  47. Kou, Y.; Liao, Y.; Toivainen, T.; Lv, Y.; Tian, X.; Emerson, J.J.; Gaut, B.S.; Zhou, Y. Evolutionary Genomics of Structural Variation in Asian Rice (Oryza sativa) Domestication. Mol. Biol. Evol. 2020, 37, 3507–3524. [Google Scholar] [CrossRef] [PubMed]
  48. Yu, H.; Lin, T.; Meng, X.; Du, H.; Zhang, J.; Liu, G.; Chen, M.; Jing, Y.; Kou, L.; Li, X.; et al. A route to de novo domestication of wild allotetraploid rice. Cell 2021, 184, 1156–1170.e1114. [Google Scholar] [CrossRef]
  49. Alonge, M.; Wang, X.; Benoit, M.; Soyk, S.; Pereira, L.; Zhang, L.; Suresh, H.; Ramakrishnan, S.; Maumus, F.; Ciren, D.; et al. Major Impacts of Widespread Structural Variation on Gene Expression and Crop Improvement in Tomato. Cell 2020, 182, 145–161.e123. [Google Scholar] [CrossRef]
  50. Zhang, Z.; Mao, L.; Chen, H.; Bu, F.; Li, G.; Sun, J.; Li, S.; Sun, H.; Jiao, C.; Blakely, R.; et al. Genome-Wide Mapping of Structural Variations Reveals a Copy Number Variant That Determines Reproductive Morphology in Cucumber. Plant Cell 2015, 27, 1595–1604. [Google Scholar] [CrossRef] [Green Version]
  51. Liu, D.X.; Rajaby, R.; Wei, L.L.; Zhang, L.; Yang, Z.Q.; Yang, Q.Y.; Sung, W.K. Calling large indels in 1047 Arabidopsis with IndelEnsembler. Nucleic Acids Res. 2021, 49, 10879–10894. [Google Scholar] [CrossRef]
  52. Vervelde, G. The agricultural value of awns in cereals. Neth. J. Agric. Sci. 1953, 1, 2–10. [Google Scholar] [CrossRef]
  53. Luo, J.; Liu, H.; Zhou, T.; Gu, B.; Huang, X.; Shangguan, Y.; Zhu, J.; Li, Y.; Zhao, Y.; Wang, Y.; et al. An-1 encodes a basic helix-loop-helix protein that regulates awn development, grain size, and grain number in rice. Plant Cell 2013, 25, 3360–3376. [Google Scholar] [CrossRef] [Green Version]
  54. Gu, B.; Zhou, T.; Luo, J.; Liu, H.; Wang, Y.; Shangguan, Y.; Zhu, J.; Li, Y.; Sang, T.; Wang, Z.; et al. An-2 Encodes a Cytokinin Synthesis Enzyme that Regulates Awn Length and Grain Production in Rice. Mol. Plant 2015, 8, 1635–1650. [Google Scholar] [CrossRef] [PubMed]
  55. Bessho-Uehara, K.; Wang, D.R.; Furuta, T.; Minami, A.; Nagai, K.; Gamuyao, R.; Asano, K.; Angeles-Shim, R.B.; Shimizu, Y.; Ayano, M.; et al. Loss of function at RAE2, a previously unidentified EPFL, is required for awnlessness in cultivated Asian rice. Proc. Natl. Acad. Sci. USA 2016, 113, 8969–8974. [Google Scholar] [CrossRef] [PubMed] [Green Version]
  56. Toriba, T.; Hirano, H.Y. The DROOPING LEAF and OsETTIN2 genes promote awn development in rice. Plant J. 2014, 77, 616–626. [Google Scholar] [CrossRef] [PubMed]
  57. Watkins, A.; Ellerton, S. Variation and genetics of the awn inTriticum. J. Genet. 1940, 40, 243–270. [Google Scholar] [CrossRef]
  58. Jordan, K.W.; Wang, S.; Lun, Y.; Gardiner, L.-J.; MacLachlan, R.; Hucl, P.; Wiebe, K.; Wong, D.; Forrest, K.L.; Sharpe, A.G.; et al. A haplotype map of allohexaploid wheat reveals distinct patterns of selection on homoeologous genomes. Genome Biol. 2015, 16, 48. [Google Scholar] [CrossRef] [Green Version]
  59. Li, H.; Durbin, R. Fast and accurate short read alignment with Burrows-Wheeler transform. Bioinformatics 2009, 25, 1754–1760. [Google Scholar] [CrossRef] [Green Version]
  60. Li, H.; Handsaker, B.; Wysoker, A.; Fennell, T.; Ruan, J.; Homer, N.; Marth, G.; Abecasis, G.; Durbin, R.; 1000 Genome Project Data Processing Subgroup. The Sequence Alignment/Map format and SAMtools. Bioinformatics 2009, 25, 2078–2079. [Google Scholar] [CrossRef] [Green Version]
  61. McKenna, A.; Hanna, M.; Banks, E.; Sivachenko, A.; Cibulskis, K.; Kernytsky, A.; Garimella, K.; Altshuler, D.; Gabriel, S.; Daly, M.; et al. The Genome Analysis Toolkit: A MapReduce framework for analyzing next-generation DNA sequencing data. Genome Res. 2010, 20, 1297–1303. [Google Scholar] [CrossRef] [Green Version]
  62. Browning, B.L.; Zhou, Y.; Browning, S.R. A One-Penny Imputed Genome from Next-Generation Reference Panels. Am. J. Hum. Genet. 2018, 103, 338–348. [Google Scholar] [CrossRef] [Green Version]
  63. Wang, K.; Li, M.Y.; Hakonarson, H. ANNOVAR: Functional annotation of genetic variants from high-throughput sequencing data. Nucleic Acids Res. 2010, 38, e164. [Google Scholar] [CrossRef]
  64. Alexander, D.H.; Novembre, J.; Lange, K. Fast model-based estimation of ancestry in unrelated individuals. Genome Res. 2009, 19, 1655–1664. [Google Scholar] [CrossRef] [PubMed] [Green Version]
  65. Purcell, S.; Neale, B.; Todd-Brown, K.; Thomas, L.; Ferreira, M.A.R.; Bender, D.; Maller, J.; Sklar, P.; de Bakker, P.I.W.; Daly, M.J.; et al. PLINK: A tool set for whole-genome association and population-based linkage analyses. Am. J. Hum. Genet. 2007, 81, 559–575. [Google Scholar] [CrossRef] [PubMed] [Green Version]
  66. Danecek, P.; Auton, A.; Abecasis, G.; Albers, C.A.; Banks, E.; DePristo, M.A.; Handsaker, R.E.; Lunter, G.; Marth, G.T.; Sherry, S.T.; et al. The variant call format and VCFtools. Bioinformatics 2011, 27, 2156–2158. [Google Scholar] [CrossRef] [PubMed]
  67. Zhou, X.; Stephens, M. Genome-wide efficient mixed-model analysis for association studies. Nat. Genet. 2012, 44, 821–824. [Google Scholar] [CrossRef] [Green Version]
  68. Kong, X.; Wang, F.; Geng, S.; Guan, J.; Tao, S.; Jia, M.; Sun, G.; Wang, Z.; Wang, K.; Ye, X.; et al. The wheat AGL6-like MADS-box gene is a master regulator for floral organ identity and a target for spikelet meristem development manipulation. Plant Biotechnol. J. 2022, 20, 75–88. [Google Scholar] [CrossRef]
  69. Li, F.; Wen, W.; He, Z.; Liu, J.; Jin, H.; Cao, S.; Geng, H.; Yan, J.; Zhang, P.; Wan, Y.; et al. Genome-wide linkage mapping of yield-related traits in three Chinese bread wheat populations using high-density SNP markers. Theor. Appl. Genet. 2018, 131, 1903–1924. [Google Scholar] [CrossRef]
Figure 1. InDel annotation and size distribution. (A) InDel annotation (up) and length distribution in the wheat genome (down). (B) InDel annotation (up) and length distribution (down) in exons.
Ijms 23 05587 g001
Figure 2. Population structure of the Chinese wheat mini-core collection using InDels. (A) Cluster dendrogram (left) and STRUCTURE (right) analysis separated cultivars from landraces mainly. (B) The cross validation (CV) error between sub-populations. The CV error between sub-populations was the lowest when the population was divided into five sub-population. (C) Principal components analysis (PCA) plot for all accessions. (D) Decay of linkage disequilibrium (LD) in the three sub-genomes. (EH) Phenotypic differences between subpopulations. p-value for F statistics in ANOVA was marked in the upper left of the panel. The Tukey’s HSD test results were shown above the violin plot. There were significant differences between groups with different letters (p-value < 0.05).
Ijms 23 05587 g002
Figure 3. Molecular diversity of the Chinese mini-core collection. (A) Circle graph display of alternate allele frequency (G1–G5) and InDel density (D, density) in each sub-group. (B) Difference of alternate allele frequency among subgroups. p-value for F statistics in ANOVA was marked in the upper left. The Tukey’s HSD test results were depicted above the violin plot. There were significant differences between groups with different letters (p-value < 0.05). (C) Allele frequency of Chromosome 3A. (D) Dissection the molecular diversity of Chinese mini-core collection by subgroups. (E) Genomic diversity signatures. The top 10% of Fst and the two-tail top 10% of Pi were used as thresholds to identify distinct diversity segments between cultivars and landraces.
Ijms 23 05587 g003
Figure 4. GWAS-derived QTL for spike length. (A) Spike length distribution and normal distribution test results. The red line corresponds to the normal distribution of spike length. The green line corresponds to the estimated best-fit normal density curve. (B) Manhattan plot of significant InDels by GWAS. Dashed line indicates the significance threshold (−log10p = 4). (C) Quantile-Quantile plots of significant SNPs. (D) Duplicate information for GWAS-derived QTL. The top bar graph shows the number of repetitions, and the bottom dot graph shows the details of the detected environment.
Ijms 23 05587 g004
Figure 5. GWAS for wheat awn length and identification of TaAGL6 as a causal gene candidate for the B2 locus. (A) Whole genome Manhattan and QQ plots for loci significantly associated with awn length. Dashed line indicates the significance threshold (−log10p  = 4). The three orange shaded peaks were three awn-related loci Hd, B1 and B2. (B) TaAGL6 showed significant differential expression (*** p < 0.001) between 10 long-awned accessions and 10 awnletted/awnless accessions. Correlation analysis between gene expression levels and awn length in 20 accessions with inflorescence RNA-seq data as in (C) showing TaAGL6 having the smallest negative coefficient (r2 = −0.78). (DG) Overexpressing TaAGL6 in cv. “Fielder” led to awnletted spikes. OE-1, OE-22, and OE-5 are TaAGL6 overexpression lines. * p < 0.05, ** p < 0.01.
Ijms 23 05587 g005
Publisher’s Note: MDPI stays neutral with regard to jurisdictional claims in published maps and institutional affiliations.

