Article

Systematic Investigations on the Metabolic and Transcriptomic Regulation of Lactate in the Human Colon Epithelial Cells

1
State Key Laboratory of Magnetic Resonance and Atomic and Molecular Physics, Wuhan Institute of Physics and Mathematics, Innovation Academy for Precision Measurement Science and Technology, Chinese Academy of Sciences, Wuhan 430071, China
2
Department of Pediatrics, Division of Infectious Diseases, University of Florida College of Medicine, Gainesville, FL 32608, USA
3
University of Chinese Academy of Sciences, Beijing 100049, China
4
Optics Valley Laboratory, Wuhan 430074, China
5
Wuhan Botanical Garden, Chinese Academy of Sciences, Wuhan 430074, China
*
Authors to whom correspondence should be addressed.
Int. J. Mol. Sci. 2022, 23(11), 6262; https://doi.org/10.3390/ijms23116262
Submission received: 27 April 2022 / Revised: 19 May 2022 / Accepted: 31 May 2022 / Published: 2 June 2022
(This article belongs to the Special Issue The Effect of Probiotics on Gut Homeostasis Regulation 2.0)

Abstract

:
Lactate, primarily produced by the gut microbiota, performs as a necessary “information transmission carrier” between the gut and the microbiota. To investigate the role of lactate in the gut epithelium cell–microbiota interactions as a metabolic signal, we performed a combinatory, global, and unbiased analysis of metabolomic and transcriptional profiling in human colon epithelial cells (Caco-2), using a lactate treatment at the physiological concentration (8 mM). The data demonstrated that most of the genes in oxidative phosphorylation were significantly downregulated in the Caco-2 cells due to lactate treatment. Consistently, the levels of fumarate, adenosine triphosphate (ATP), and creatine significantly decreased, and these are the metabolic markers of OXPHOS inhibition by mitochondria dysfunction. The one-carbon metabolism was affected and the polyol pathway was activated at the levels of gene expression and metabolic alternation. In addition, lactate significantly upregulated the expressions of genes related to self-protection against apoptosis. In conclusion, lactate participates in gut–gut microbiota communications by remodeling the metabolomic and transcriptional signatures, especially for the regulation of mitochondrial function. This work contributes comprehensive information to disclose the molecular mechanisms of lactate-mediated functions in human colon epithelial cells that can help us understand how the microbiota communicates with the intestines through the signaling molecule, lactate.

1. Introduction

Lactate had been designated as a waste product of anaerobic glycolysis for nearly a century [1,2]. However, recent publications have demonstrated that lactate is an active molecule and plays a crucial role in multiple cellular processes including respiration regulation [3], immune response [4,5,6], neuronal memory allocation [7], and cancer growth [8,9]. In addition, lactate is a standard natural product of gut bacteria that is primarily fermented by the microbiome, such as lactic acid bacteria of the genera Lactobacillus and Bifidobacterium [10,11]. Lactate induces several modulations and profound impacts on various biological processes in the gut function [12,13] and diseases [14,15]. Previous studies have reported that lactate has bioactive capacities that act in at least three independent ways [16], including (1) modulating gene expression by the modification of histone deacetylase (HDAC) activity [17], (2) triggering different signaling pathways by GPR81 [18,19], and (3) inducing changes in metabolic pathways [20]. In addition, lactate-utilizing bacteria play a crucial role in modulating the colonic metabolome [21].
Lactate is also a metabolic product of the host cells. High levels of lactate are used similarly in the gut, being converted into acetate, propionate, or butyrate [22]. The concentration of lactate in the gut is still highly controversial, primarily due to different detection methods, the complicated gut microbiota environment, and the high turnover rate of lactate in the intestine [23]. The balance between production by bacteria and by host tissues, microbial utilization, and host absorption makes up the final fecal concentration of lactate. Though lactate can be found in fermented foods at levels from about 5 to 100 mM [24,25], less than 3 mM of lactate can be detected [26]. Bacteria utilize a large amount of the lactate via metabolite cross-feeding in a healthy colon, and this induces a low lactate level in fecal matter [21]. However, a high lactate level often occurs in the gut. The maximum level of 8.5 (5.0 to 14.9) mM of gut luminal lactate was measured using microanalysis in an ischemia model [27]. Significantly higher levels of lactic acid (mean 8·4 mM) have been shown in breastfed babies when compared with formula-fed babies (mean 1·7 mM) at the age of one month [28]. Lactate concentrations up to approximately 100 mM have been associated with ulcerative colitis [29,30]. Previous evidence suggested that lactate may alter the pro-inflammatory response at doses ranging from 10 to 20 mM (10 mM of lactate significantly decreased the amount of TNF mRNA after 4 h at the transcriptional level, and 20 mM of lactate was needed to suppress IL-6 at a pro-inflammatory level [31]). From the receptor aspect, the selectivity of GPR81 on lactate is within a wide range of 0.1–30.0 mM [32,33]. Collectively, different concentrations of lactate result in different biological effects in the gut. Therefore, it is important to investigate the function of lactate at the physiological concentration.
The integration of transcriptome and metabolome will yield more reasonable insights in revealing the molecular pathways leading to the phenotype under lactate exposure in human colon epithelial cells that are primarily used as a model of the intestinal epithelial barrier [34]. The role of lactate in the live system has been discussed widely. However, an understanding of the molecular mechanism is still rare in Caco-2 cells from the metabolic and transcription aspects, and the tools and critical players are only beginning to be elucidated. Transcriptomics is used to identify genes that are differently expressed in many disease models and to investigate the mechanism at a molecular level [35]. Information regarding transcriptome and metabolome has significantly contributed to many research areas such as cancer [36] and obesity [37]. Additionally, metabolomics offers a holistic approach to understanding the phenotype of an organism based on those metabolites that represent molecular endpoints of gene expression and cell activity [38]. In this study, to provide comprehensive information at the molecular level to understand how lactate affects the intestine, we employ a combination of an unbiased and global metabolic and a transcriptional approach to investigate the effects of lactate treatment on the function of Caco-2 cells at the physiological concentration (8 mM).

2. Results

2.1. The Effect of Lactate on Caco-2 Cells Growth

We selected the colon epithelial cells, since the colon harbors the highest diversity and density of microbiota in the gastrointestinal tract [39,40], including significant lactate producers, Bifidobacterium spp., and lactic acid bacteria such as Lactobacillus and Enterococcus spp [41]. To determine the nontoxic concentration of lactate on Caco-2 growth, a growth curve was made using the MTT assays. Compared with the control group, less than 50 mM of lactate had no impact on the Caco-2 cell growth, but 200 mM of lactate significantly inhibited the viability after 24 h of treatment (Figure 1, p < 0.0001). Another study reported that concentrations of lactate up to 20 mM did not affect cell growth [42].The physiological concentration in stool samples from healthy adults is approximately 8.5 mM [27,28], but concentrations up to 100 mM have been reported in gut disorders such as ulcerative colitis [43]. Therefore, we next investigated the effect of 8 mM of lactate treatment on the metabolomics and transcriptomics profiles of the Caco-2 cells.

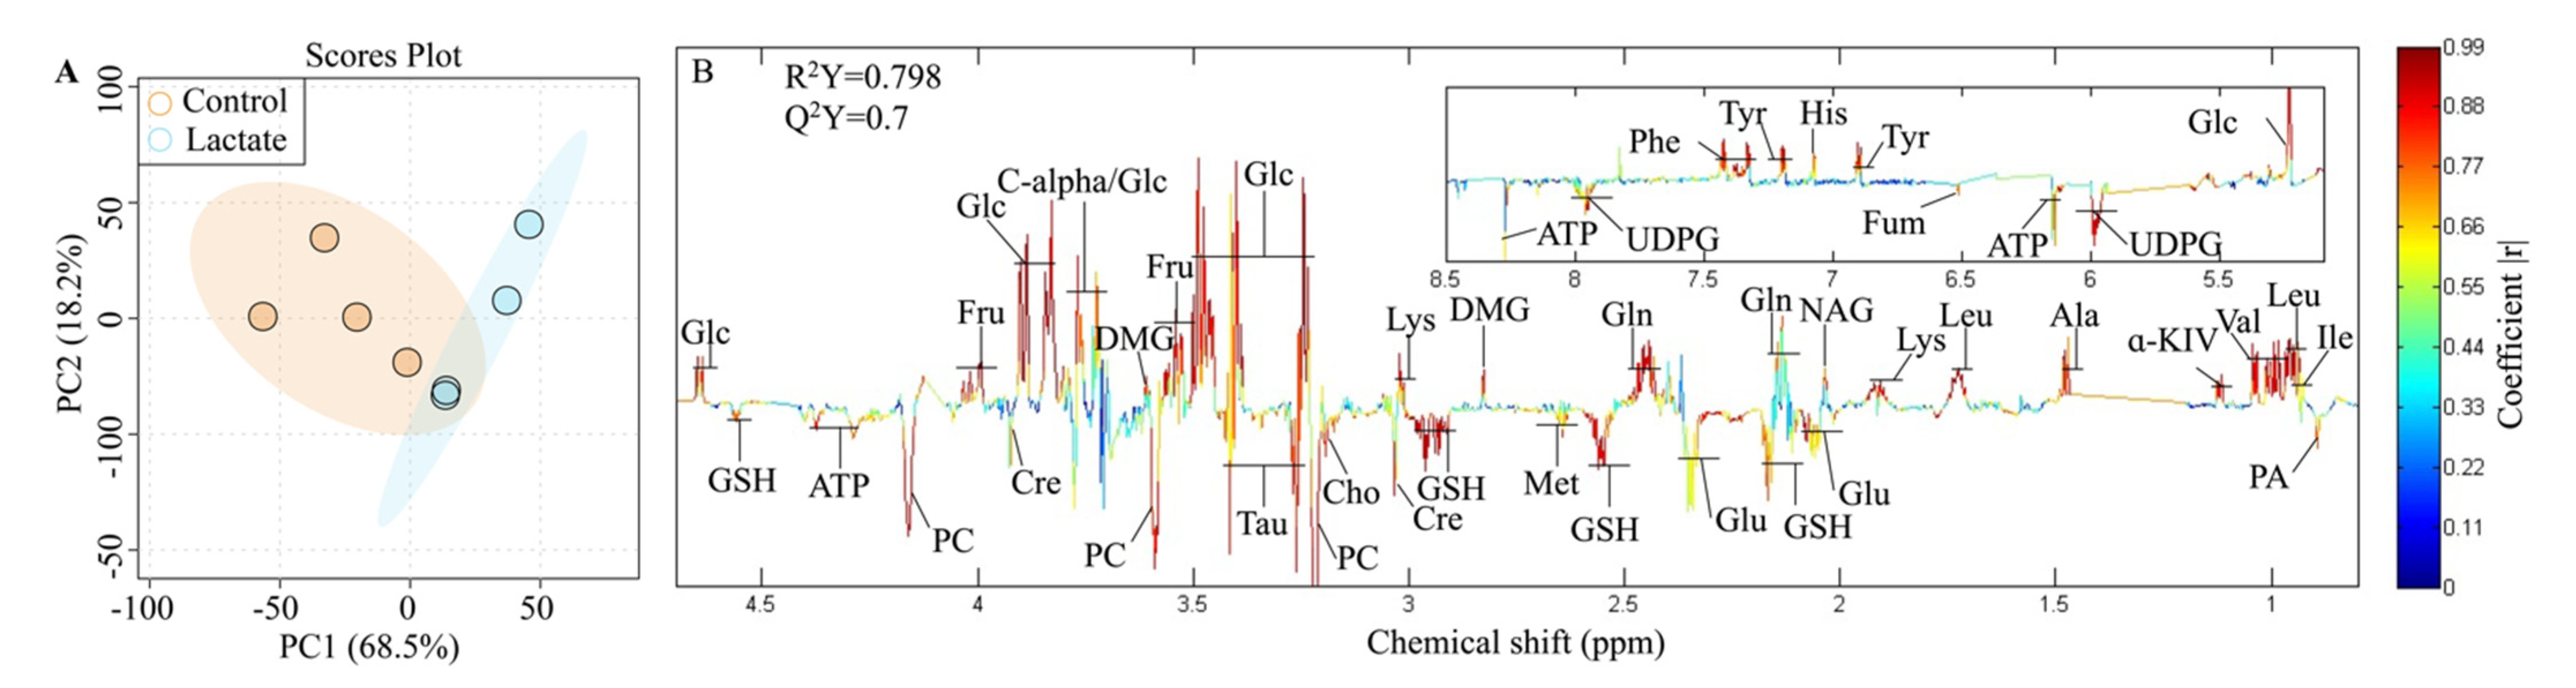
2.2. Metabolite Assignments for the 1H NMR Spectroscopy

The typical 1H NMR spectra of the cell extracts obtained from the control group are shown in Figure 2. Metabolite assignments were conducted as described in the literature [44] and confirmed using the two-dimensional NMR spectra. The spectra of the cell extraction were dominated by numerous metabolites, as shown by the metabolite key in Figure 2. The signals included amino acids (e.g., glutamine, valine, isoleucine, and leucine), sugars (e.g., glucose and fructose), a range of organic acids (e.g., lactate, fumaric acid, and succinate), and nucleotides (e.g., adenosine monophosphate, adenosine triphosphate, uridine 5′-monophosphate, and uridine-5′-diphosphate) in the low field between 5.00 ppm and 9.4 ppm. The NMR resonance assignments and proton chemical shifts and their diversity are listed for the identification of chemical structures of these metabolites in Table 1.

2.3. Significantly Changed Metabolites Detected by High-Resolution 1H NMR

Lactate plays a crucial role in rewiring the metabolic program in the gut. In our study, the PCA map showed two distinct clusters of the metabolome between lactate and the control treatment group, including 11 significantly decreased metabolites and 14 significantly increased metabolites, and there were no outliers outside of the 95% confidence interval (Figure 3A). Of these metabolites, the levels of fumarate, ATP, and creatine, which are the metabolic markers of mitochondria dysfunction, significantly reduced in Caco-2 cells with lactate treatment, compared with the control treatment (Figure 3B). Notably, lactate treatment induced an elevation in glucose, fructose and a reduction in glutathione (GSH) (Figure 3B), indicating an increase in glucose uptake and the activation of the polyol pathway. In addition, lactate treatment increased the levels of amino acids including leucine, lysine, phenylalanine, tyrosine, isoleucine, valine, and histidine in the cytosol (Figure 3B). Interestingly, the levels of methionine, taurine, choline, and phosphocholine were significantly reduced by the lactate treatment, while the level of dimethylglycine significantly increased, which are all linked with the one-carbon metabolism in the cell.

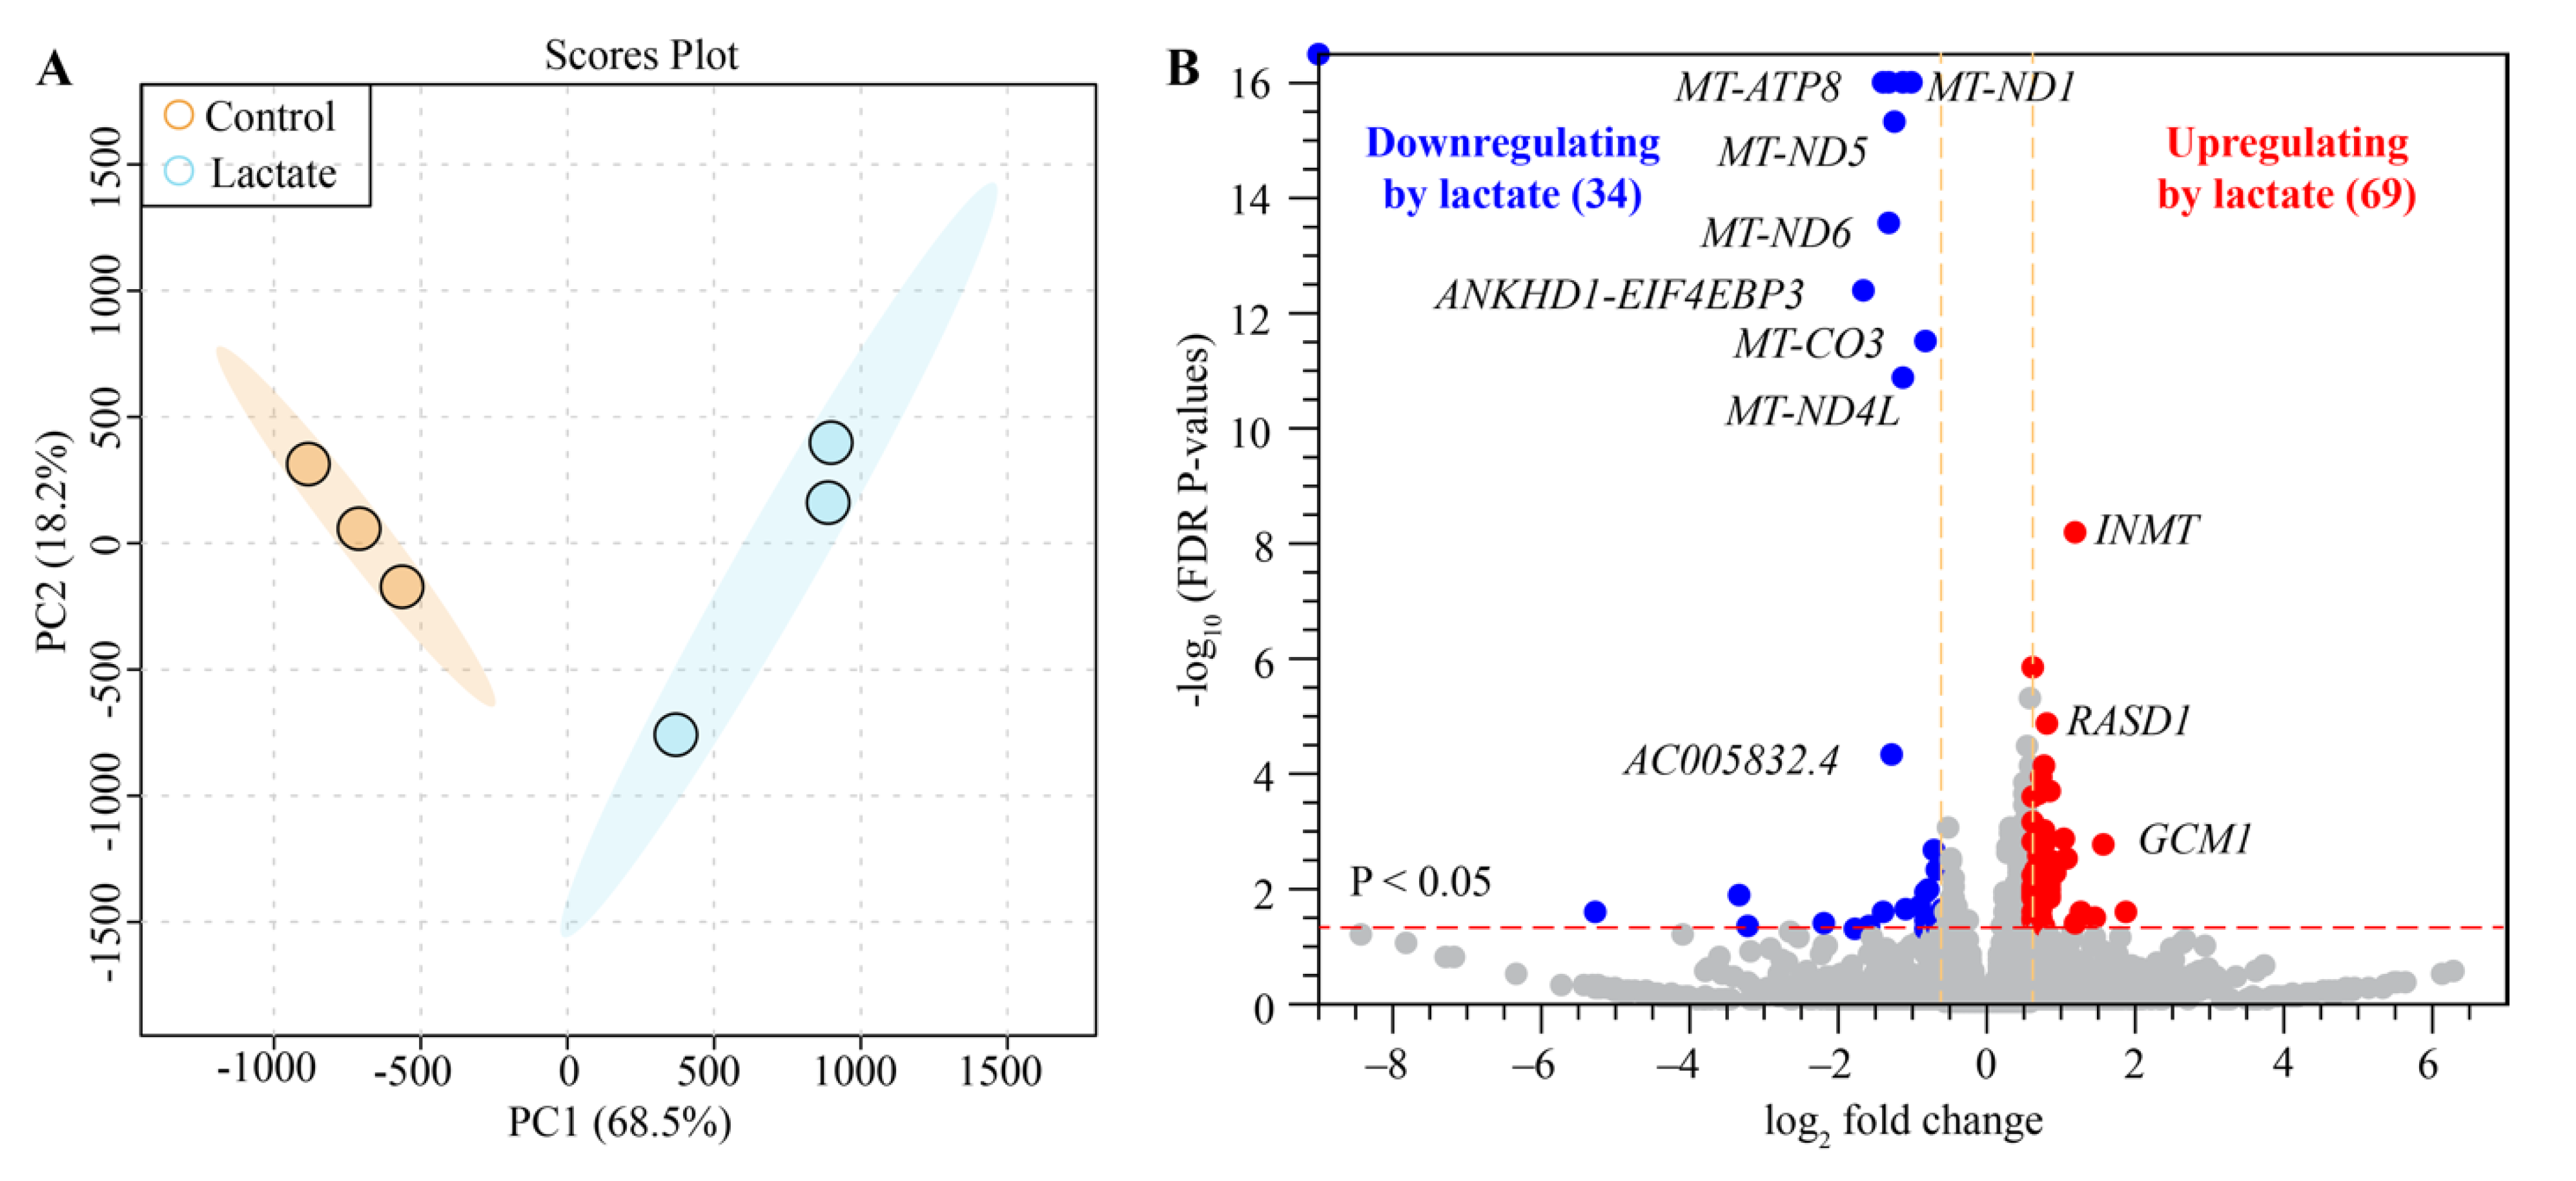
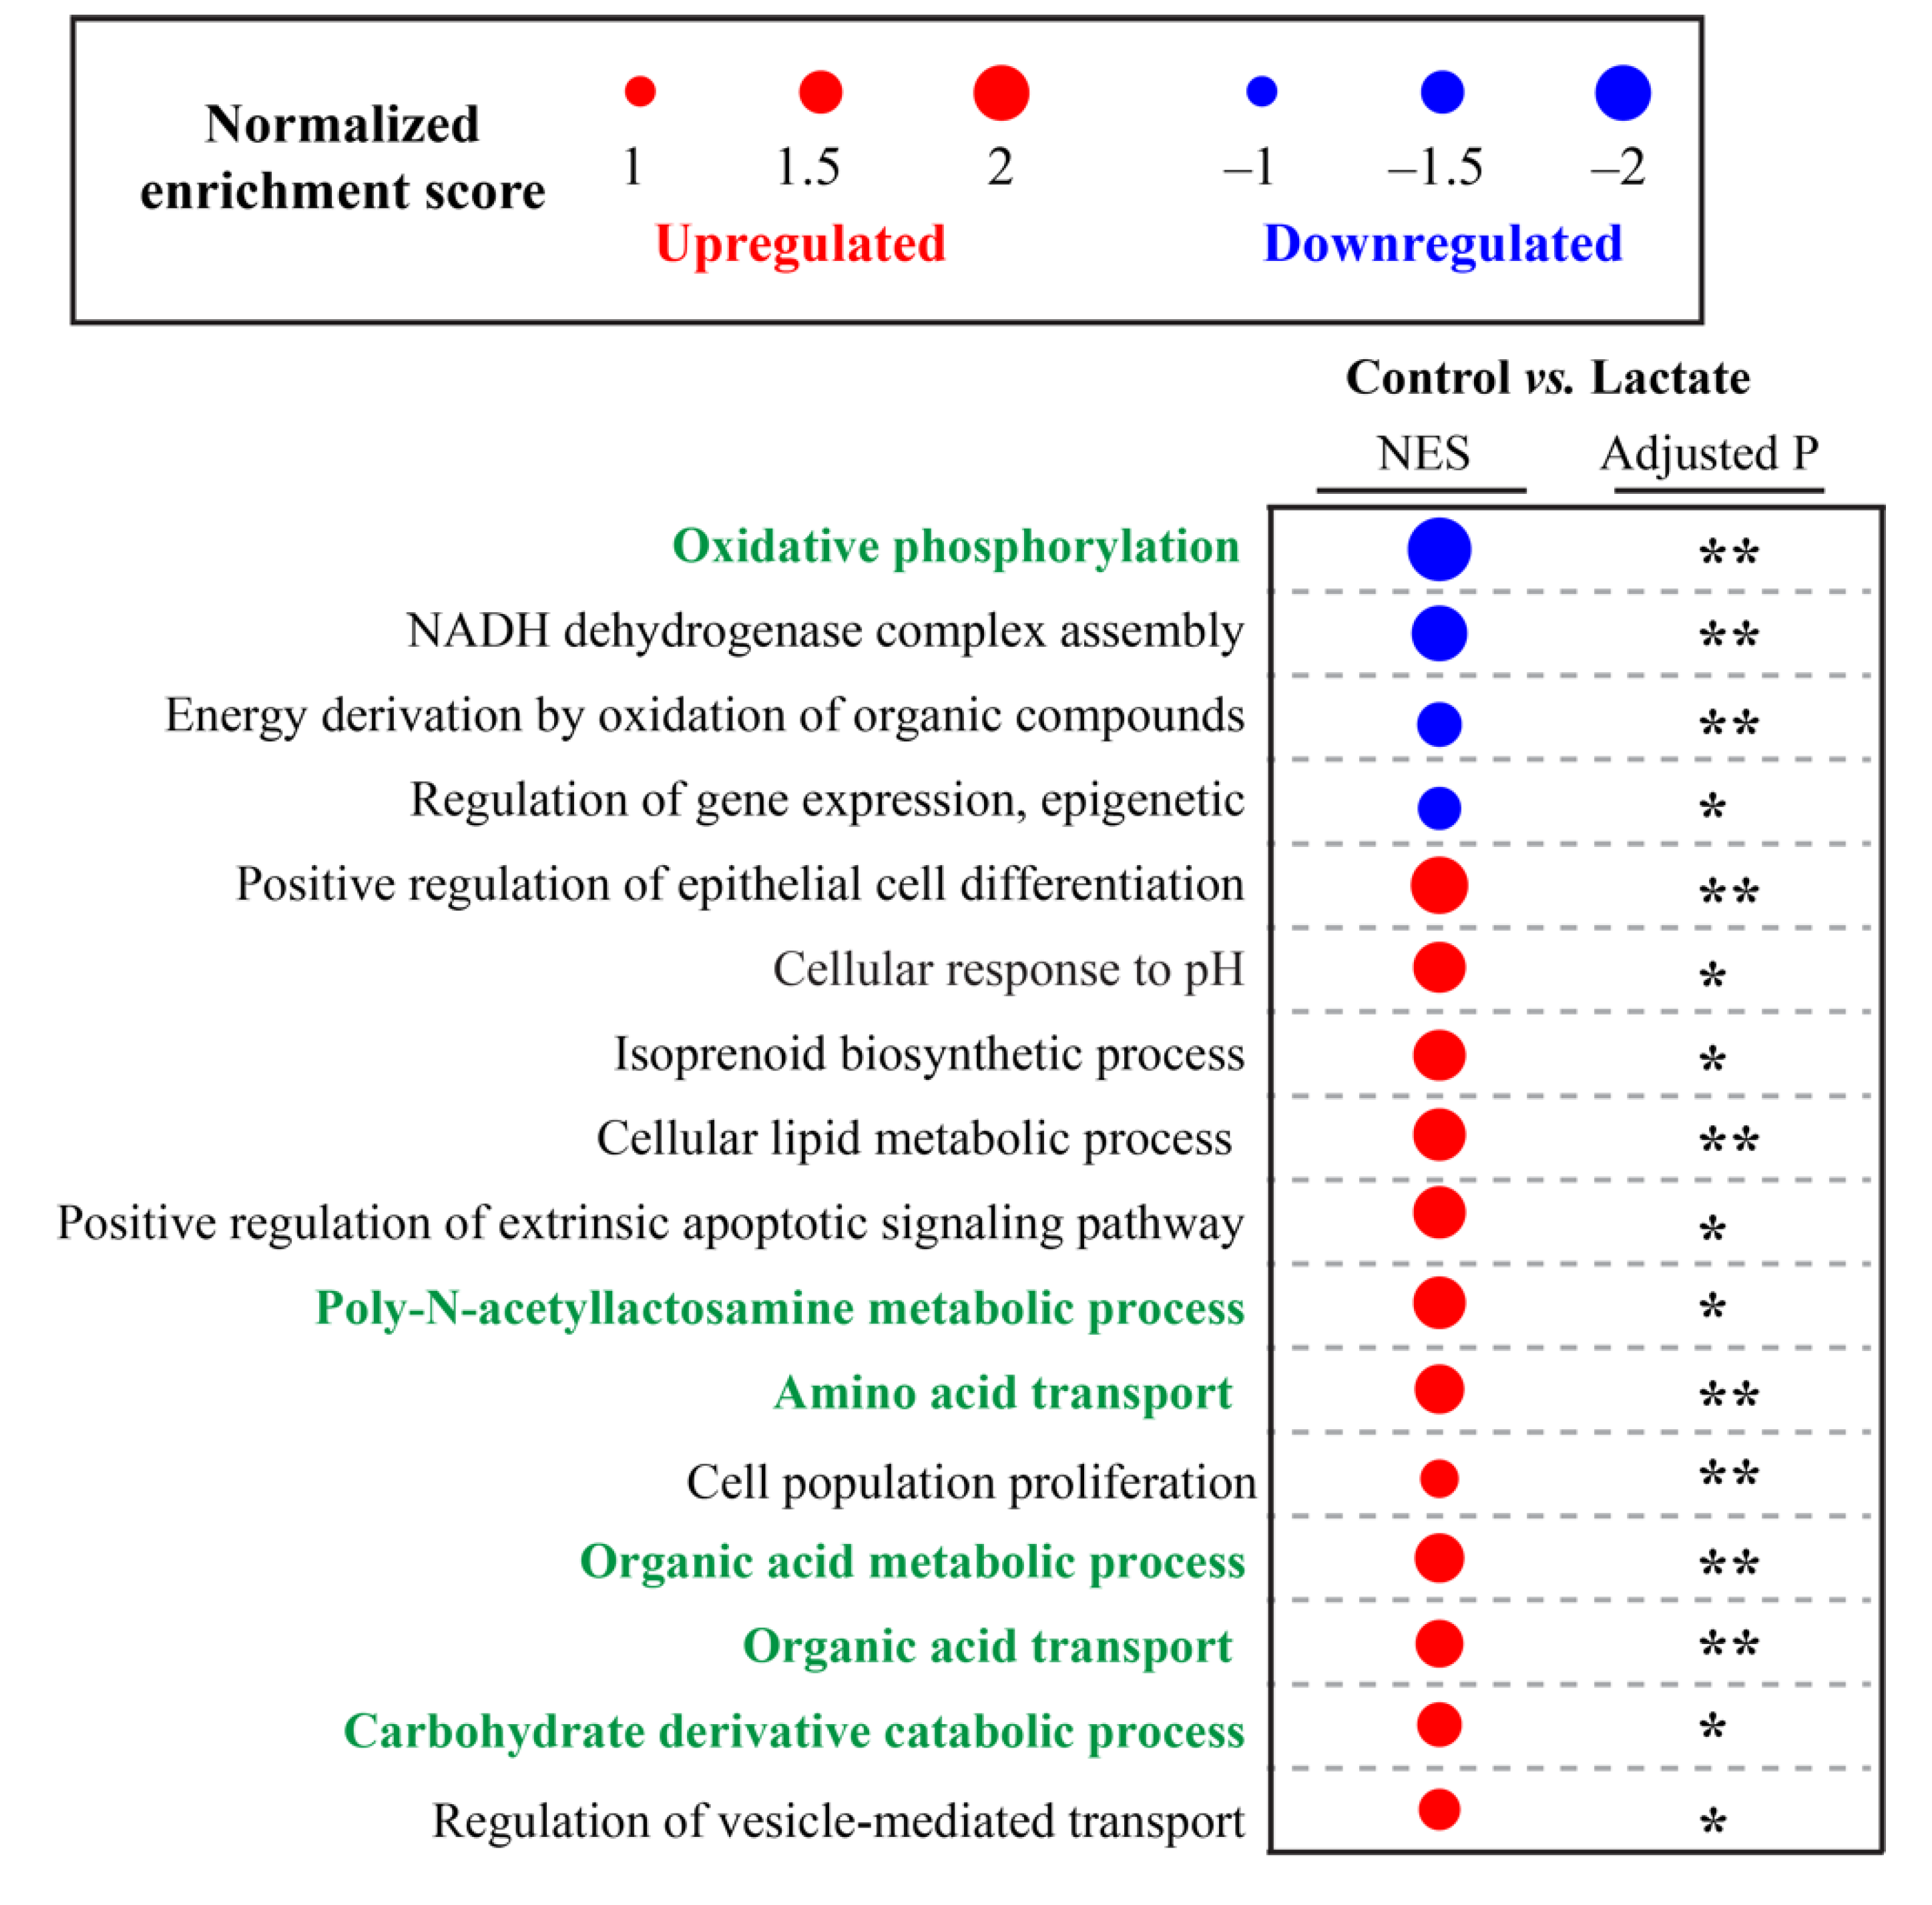
2.4. Lactate Modulated Transcriptome Signatures in Human Colon Epithelial Cells

We performed high-throughput RNA sequencing to determine the effects of lactate on the transcriptional program of Caco-2 cells. The PCA map showed two distinct clusters of the global transcriptome between the lactate and control treatments, and there were no outliers outside of the 95% confidence interval (Figure 4A). We identified 103 top genes that were significantly changed between the two groups. Of which, 34 were downregulated and 69 upregulated (FDR-corrected p < 0.05, absolute fold change ≥1.5) by the lactate treatment compared with the control treatment (Figure 4B).
The heatmap analysis further disclosed altered levels of specific genes between the lactate and control treatment under the major annotated pathways (Figure 5). mRNAs for organic acid transport and metabolism (e.g., SLC16A3, SLC7A8, and EPHX1) were significantly increased by the lactate treatment (Figure 5 and Figure 6, NES = 1.7445, adjusted p = 0.002), indicating that colon epithelial cells could quickly respond to and metabolize exogenous lactate.
Notably, mRNAs for oxidative phosphorylation (e.g., MT-ATP8, MT-ND6, MT-ND4, and MT-CO2) were significantly decreased by the lactate treatment (Figure 5 and Figure 6, NES = −2.3533, adjusted p = 0.0031), which is one of the most prominent roles of mitochondria; to produce the energy currency of the cell, ATP. Along with the downregulation of this process, we observed that lactate treatment significantly upregulated the mRNA expressions involved in phosphorus metabolism (e.g., ATP6V0C, DUSP5, ENTPD8, RPS6KA4, and FKBP8), organelle organization (e.g., RTKN, FOXA3, IFT27, and SERPINF2), and the response to organic substances (e.g., PTK7, SKIL, PPP3CA, and TOB1) (Figure 5). These results indicate that lactate could suppress the central function of mitochondria, oxidative phosphorylation, and further re-modulate these downstream processes. Interestingly, lactate treatment significantly activated the mRNA expressions associated with the vesicle-mediated transport (e.g., CHP1, EPN1, RAB11B, and ADRB1) (Figure 5 and Figure 6, NES = 1.417, adjusted p = 0.016) that occurs from within the cell via the endoplasmic reticulum and Golgi transport (e.g., protein transport) and functions in the endocytosis of material taken into the cell via scavenger receptors. The lactate treatment also significantly upregulated the mRNA expressions for the reproductive process, suggesting the potential role of lactate in epithelial cell proliferation and differentiation. Additionally, lactate treatment significantly enhanced the expression of genes linked to one-carbon metabolism (Figure 5, MAT1A and INMT), which provides the methyl donor in DNA methylation.
Next, we used the inBio DiscoverTM Database (https://inbio-discover.com/#login, accessed on 26 April 2022) to determine whether any genes altered by lactate treatment could be a potential target for known drugs and gastrointestinal diseases [45]. Figure 5 shows some genes for drug targets (PPP3CA, ADRB1, and BRD1). For example, the PPP3CA encoding protein phosphatase 3 catalytic subunit alpha is an important drug target for treating ulcerative colitis with FDA approved drugs (e.g., tacrolimus and cyclosporine), whose expression was upregulated by lactate treatment (Figure 5). Furthermore, some mRNAs associated with gastrointestinal diseases were downregulated by lactate treatment, including KLF4, MT-CO1, MT-CYB, MT-ND1, and EPC2, while others were upregulated by lactate treatment, including PTK7, CNOT9, FOXA3, SERPINF2, EPHX1, TOB1, and PAQR7. Of these genes, PTK (protein tyrosine kinase 2 betas) and KLF4 (Kruppel-like factor 4) are involved in colon cancer development.

3. Discussion

Reactive oxygen species (ROS), a class of reactive molecules and free radicals derived from molecular oxygen, are essential in mediating physiological and pathophysiological signal transduction. Approximately 90% of ROS are generated in the electron transport chain (ETC) of the mitochondria. ROS are generated endogenously as in the process of mitochondrial oxidative phosphorylation [46]. On a physiological level, 0.2–2% of the electrons in the ETC do not follow the standard transfer order but instead directly leak out of the ETC and interact with oxygen to produce superoxide or hydrogen peroxide. The amount determines the beneficial and harmful roles of ROS. A large amount of ROS can cause lipid peroxidation, DNA damage, protein oxidation, irreversible impairment of the mitochondria, insufficient ATP generation, and eventually, cell death. Previous research has indicated that the total cellular ROS levels were elevated after exposure to lactate [47,48,49]. A general perspective regarding the mechanisms of lactate-mediated ROS generation is provided if there exists a high pool of nicotinamide adenine dinucleotide (NADH) during the conversion of lactate to pyruvate that can enter the mitochondria and boost the electron transport chain and high ROS levels [49,50].
Oxidative phosphorylation is the metabolic pathway in which cells produce ATP by enzymes to oxidize nutrients. Cellular ATP generated by oxidative phosphorylation(OXPHOS)through the electron transport chain composed of transmembrane protein complexes (I-V), ubiquinone (Coenzyme Q), and cytochrome c in the cristae of mitochondria [51] is the source of energy for use and storage at the cellular level. Therefore, the reduced ATP production caused by lactate exposure observed in our study was a significant sign of reduced oxidative phosphorylation (Figure 7). In addition, creatine works as the acceptor of phosphate at the end of oxidative phosphorylation in the mitochondria [52]; this was also decreased. Fumarate produced from succinate during the electron transfer process in complex II was found at a low level in the lactate group. The reduction in ATP, creatine, and fumarate suggests a function inhibition of oxidative phosphorylation due to lactate treatment. Consistently, lactate significantly downregulated the levels of mRNAs for complex I (MT-ND1, MT-ND2, MT-ND4, MT-ND4L, MT-ND5, MT-ND6), complex Ⅲ (MT-CYB), complex Ⅳ (MT-CO1, MT-CO2, MT-CO3), and complex V (MT-ATP6, MT-ATP8, AC005832.4) (Figure 7 and Table S1).
The polyol pathway is known as an accessory glucose pathway that bypasses glycolysis [53]. Hyperglycemia is considered to activate the polyol pathway [54]. In our study, a higher glucose level occurred in the cell cytosol, which is supposed to be induced by the ROS signal pathway (Figure 7). There was no change in the expression of the glucose transporter, SLC2A4/GLUT4. However, the expression of RTN2 was significantly activated by the lactate treatment that plays a role in the translocation of SLC2A4/GLUT4 from intracellular membranes and facilitates the uptake of glucose into the cell. The expression of SLC2A4RG, known as a transcriptional regulator of the GLUT4 gene, was significantly upregulated by the lactate treatment. In addition, lactate might lead to a high pool of NADH followed by excessive ROS (Figure 7 and Table S1). It has been reported that cellular glucose uptake is stimulated by ROS [55]. Uridine diphosphate glucose (UDPG), a precursor of glycogen, was observed with a decreased level, suggesting that the glycogenesis in which glucose molecules are added to chains of glycogen for storage was also inhibited (Figure 7). In summary, glucose was shunted into the branching polyol pathway to counteract intracellular hyperglycemia.
Sorbitol, fructose, and NADH are the overall products of the polyol pathway [56]. Sorbitol accumulates in primary human monocytes and the human monocytic cell line, MonoMac6, by the stimulation of exogenous lactate [57]. In our study, sorbitol was undetected in our NMR spectra due to its low concentrations. However, we observed a significantly increased level of fructose due to lactate exposure. The change in fructose was approximately 30% of the change in glucose from the polyol pathway in the brain [58]. Similarly, in our study, lactate induced the change in fructose that was equal to 27% of the change in glucose in the Caco-2 cells. In addition, GSH is known to be consumed in the polyol pathway [59]. An increased accumulation of intracellular sorbitol in the polyol pathway [60] may cause toxicity to DNA due to an increase in the intracellular osmotic pressure [61]. Oxidative stress generated through the polyol pathway and aldose reductase competed with glutathione reductase for NADPH. This resulted in decreasing glutathione, as was observed in our study, and increasing intracellular oxidative stress [62].
Taken together, to counteract intracellular hyperglycemia, glucose was shunted into the branching polyol pathway, leading to fructose accumulation. The data indicated lactate-modulated fructose metabolism in human colon epithelial cells via the polyol pathway. However, a high glucose concentration may be toxic to endothelial cells due to apoptosis and the augmentation of oxidative stress [63]. The polyol pathway may contribute to the NADH/NAD+ redox imbalance in cells exposed to lactate.
The one-carbon metabolism, comprised of the methionine cycle, folate cycle and choline cycle, is central to cellular function, providing methyl groups for the synthesis of DNA, polyamines, amino acids, creatine, and phospholipids [64]. S-adenosyl-L-methionine (SAM) is the primary methyl donor and is important in regulating gene expression or repression [65]. Methionine adenosyltransferase (MAT) [66], controlled by the MAT1A gene, is an essential enzyme that catalyzes the formation of SAM. In our study, a lower level of methionine, the precursor of SAM, and a higher MAT1A expression indicated that a rapid generation of SAM was activated by lactate exposure. In addition, alterations in the one-carbon pathway metabolites, including increasing dimethylglycine and decreasing Cho, PC, and Tau, were observed. DNMT, responsible for the transfer of a methyl group from the universal methyl donor, S-adenosyl-L-methionine, to the five-position of cytosine residues in DNA, was not observed with any alternations in our study. However, INMT, known as indolethylamine-N-methyltransferase, plays a role in transferring one or more methyl groups from the methyl donor SAM to the substrates [67], which was overexpressed by a magnitude of 2.2 due to the lactate treatment. INMT is generally involved in the methylation of the tryptamine pathway that is associated with brain activity [68]. In addition, ZNF618 is a specific reader of 5hmC, an intermediate of DNA demethylation in vivo, and can co-localize with UHRF2. UHRF2 is essential in maintaining DNA methylation in differentiated cells and has been reported to play a crucial role in pooled DNA and histone binding [69]. Therefore, ZNF618 facilitates UHRF2 chromatin localization [70]. ZNF618 is among the novel candidate gene products associated with oxidative stress responses [71]. Histone deacetylase (HDAC) activity is a critical modulation pathway, and lactate is linked with endogenous inhibitors of HDAC and promotes changes in gene expression [17]. ZNF827 was reported to recruit nucleosome remodeling and the histone deacetylation complex. The depletion of ZNF827 was followed by the loss of cell viability [72]. Previous studies reported the capacity of lactate to inhibit the activity of HDAC only in very high concentrations (IC50 = 40 mM) [17,73,74]. However, in our study, a decreased level of ZNF827 was observed, suggesting that HDAC could be inhibited slightly with a lower concentration of lactate at 8 mM, though this might be not high enough to inhibit HDAC function. KLF4 has been reported to be upregulated by HDAC inhibitors [75]. However, a significantly decreased expression of KLF4 was observed without apparent changes in HDAC. The function of downregulated KLF4 is unknown, but it is supposed to be associated with the HDAC process. The other related transcriptional regulations on EPC2, BRD1, and TADA2B were also observed.
Mitochondrial ROS production and detoxification are tightly balanced. Shifting this balance enables ROS to activate intracellular signaling and induce cellular damage and cell death. Tauffenberger et al. disclosed that lactate promoted oxidative stress resistance through ROS signaling [47]. Lactate significantly enhances DNA damage repair [76], and incubating cells with lactate will lead to a less compact chromatin structure, facilitating DNA transcriptional machinery, and improving cell survival. Incubating cells with lactate for 24 h evoked a transcriptionally permissive chromatin conformational state and a significant upregulation of essential gene expressions involved in DNA (Figure 7). However, no significant difference was observed in the cell viability in the lactate-induced group, suggesting that some self-protection mechanism against apoptotic distress might exist.
Lactate has been demonstrated to activate TLR4 signaling, NF-κB transcriptional activity, and the expression of inflammatory genes in human U937 histiocytes. RTKN is a gene that encodes a scaffold protein that interacts with GTP-bound Rho proteins, mediating Rho signaling to activate NF-κB and it may confer increased resistance to cellular apoptosis in gastric tumorigenesis since NF-κB is known to protect cells against apoptosis [77]. Our study suggests that the upregulation of RTKN is responsible for the activation of NF-κB pathway followed by the lactate treatment. We also observed the significant upregulated genes involved in apoptotic protection, including CD3G, NOTUM, and PPP3CA in Caco-2 cells after the lactate treatment (Figure 7 and Table S1), suggesting that lactate is important for cells to be resistant to apoptosis.
A previous study discovered a novel apoptosis-resistant pathway that promoted both immune suppression and oncogenic cell proliferation by modulating the expression of the FOXO family [78], and these are suspected to promote tumor progression. In our study, accompanied with the self-protection against apoptotic activation, a list of mRNAs including Gcm1 [79], DHRS3 [40], DUSP5 [80], NBL1, EPN1, SLC9A3R2 [81], SLC35F2 [82], and FOXA3 [83] involved in the cell proliferation, were significantly increased by the lactate treatment. Solute carriers (SLCs), ranking second among membrane transport proteins in terms of abundance [84], play crucial roles in human physiology through processes such as the intake of amino acids in the intestine for cell growth [85]. SLC66A2 and the SLC7A8/SLC3A2 heterodimer function as an amino acid exchanger [86,87] whose expressions were both upregulated by the lactate treatment with an increased level of amino acids. However, these complicated mechanisms require further investigation.

4. Materials and Methods

4.1. Caco-2 Cells Culture and the Growth Curve

Caco-2 cells (ATCC #HTB-37) were maintained and cultured in Minimum Essential Medium (MEM) media supplemented with 20% fetal bovine serum, 1% of penicillin-streptomycin, 1× non-essential amino acid solution, and 10 mM of sodium pyruvate at 37 °C and 5% CO2.
After subculturing for 24 h, Caco-2 cells were cultured for an additional 24 h prior to treatment with different concentrations (0, 0.78, 3.12, 12.5, 50, 200 mM) of sodium DL-lactate (Sigma-Aldrich). The cell viability was determined using the 3-(4,5-dimethylthiazol-2-yl)-2,5-diphenyl-2H-tetrazolium bromide (MTT) assay as previously described [88].

4.2. RNA Sequencing (RNA-Seq)

The Caco-2 cells were treated with 8 mM sodium DL-lactate solution (Sigma-Aldrich) or 8 mM NaCl (control treatment) for 24 h. The total RNA was extracted using the RNeasy Plus Mini Kit (Qiagen). The 1 ng total RNA with 28S/18S >1 and RNA integrity numbers 7.1 to 9.3 were used for the RNA-Seq library construction. cDNA was synthesized using the SMART-Seq HT kit (Takara Bio). The RNA-Seq libraries were constructed with the Nextera DNA Flex Library Prep kit and the Nextera DNA Unique Dual Indexes Set A (Illumina). TapeStation completed the quality control of the libraries (checking the size distribution with an average fragment size of 600 bp when analyzed with a size range of 150–1500) and quantitative PCR (qPCR) assays (a beginning concentration of 2 nM and a final loading concentration of 300 pM). Finally, the libraries were sequenced on NovaSeq6000 (Illumina) at 2 × 150 bp, aiming for 50 million paired end reads per sample.
The RNA sequencing analysis was performed using the CLC genomics workbench (Qiagen 21.0.4). Data were normalized to reads per kilobase of transcript per million mapped reads (RPKM). A false discovery rate (FDR)-corrected p value < 0.05 was used as the criterion for significance. A principal component analysis (PCA) was performed to evaluate the outliers of the transcriptomes of all the samples (SIMCA 17.01). A gene set enrichment analysis (GSEA) was performed by iDEP V0.94 using the pre-ranked fgsea method [89]. Heat maps of the differentially expressed genes (DEGs) in the enriched pathways were constructed using supervised hierarchical clustering in Heatmapper [90].

4.3. Metabolism Sample Collection and Preparation

The cells were washed with 2 mL of water two times after the removal of medium and quenched with liquid N2. Then, cells were stored at −80 °C until they were extracted for the solution-state NMR experiments. The extraction steps were conducted according to the protocol described in the literature [91]. Briefly, 1 mL the extraction solution containing 80% methanol was added to the flask, and the cells were scrapped into a 2 mL EP tube followed by two sonicating and vortex cycles. The mixtures were then centrifuged at 12,000× g for 45 min at 4 °C, prior to collecting the supernatant. Methanol was removed using a spin vac, and then water was removed using a freeze-dryer. The dry extracts were stored at −80 °C until NMR detection was conducted.

4.4. NMR Experiment and Data Analysis

The extracts were reconstituted in 520 μL of phosphate buffer (0.1 M K2HPO4: NaH2PO4, in D2O, pD 7.4), and 500 μL of the sample was pipetted into a 5.0 mm NMR tube after the removal of any particulates by centrifugation (5 min, 12,000× g, 4 °C). The one-dimensional 1H NMR spectra were acquired at 25 °C using an 800 MHz Bruker Avance III NMR system (Bruker BioSpin, Ettlingen, Germany) equipped with a 5 mm TCI cryoprobe. The water-suppressed 1D-NOESY sequence was obtained using a 100 ms mixing time [92]. For each spectrum, 64 scans were collected using a 5 s relaxation delay, 120,190 points, and a 12 kHz sweep width. For assignment purposes, the two-dimensional 1H–1H J-resolved (J-Res), 1H–1H correlation (COSY), 1H–1H total correlation (TOCSY), 1H–13C heteronuclear single quantum coherence spectroscopy (HSQC), and 1H–13C heteronuclear multiple bond correlation spectroscopy (HMBC) spectra were acquired for a subset of samples.
The free induction decays were multiplied by a 0.3 Hz exponential window function, Fourier transformed, and manually corrected for phase and minor baseline distortions using Topspin 3.6.1 (Bruker BioSpin, Germany). The right peak of the doublet from lactate with a chemical shift at δ 1.32 was used as a reference. The 1H NMR spectra between 0.6 and 9.5 ppm were divided into 2793 spectral peaks with a uniform bucketing (bucket width = 0.002) method using the NMRPROCFLOW online software (https://nmrprocflow.org (accessed on 26 April 2022). The regions containing water (δ 4.65−5.0) were removed to avoid the effects of imperfect water suppression. Additionally, signals from DL-lactate (δ 1.2−1.46 and δ 4.08–4.12) were also excluded from the cell extraction spectra. A probabilistic quotient normalization method [93] was performed for the binning data prior to the multivariate analysis on the dataset scaled to the unit variance by use of MetaboAnalyst [94] (https://www.metaboanalyst.ca/ (accessed on 26 April 2022), a comprehensive platform dedicated to metabolomics data analysis via a user-friendly, web-based interface. The principal component analysis (PCA) was performed on the dataset to generate an overview of the metabolic effects of lactate exposure. Orthogonal projection to the latent structures discriminant analysis (O-PLS-DA) was subsequently performed on the dataset. A cross-validation method [95] and permutation test method [96] were used to certify the validity of the model.
The coefficient plots were generated from the back-transformed loadings incorporated with color-coded coefficients of the loadings plotted in MATLAB (The Mathworks Inc., Natwick, MA, USA, version 7.1) [97]. The loadings coefficients represent the weights of metabolites contributing to the separation between classes. The red color denotes significance in the differentiation between types, while the blue color indicates no value. Based on the number of samples included in each group, correlation coefficients greater than 0.878 were regarded as significant in the discrimination based on a 95% confidence limit.

5. Conclusions

In this study, we showed a comprehensive and integrated analysis that lactate modulates the functions in human colon epithelial cells including the inhibition of OXPHOS, the alternation of one-carbon, the activation of the polyol pathway, and cell self-protection against apoptosis, highlighting the multiple roles of lactate in gut–gut microbiota interactions as a signaling molecule. This entire work was based on a cell model in vitro. More thorough investigations are required in an in vivo model in the future.

Supplementary Materials

The following supporting information can be downloaded at: https://www.mdpi.com/article/10.3390/ijms23116262/s1.

Author Contributions

Conceptualization, J.L., C.L.; investigation, C.H., H.X., J.L.; writing—C.H.; writing (review and edit)—C.H., C.L., H.X., J.L., X.Z. and M.L.; supervision, C.L., J.L. All authors have read and agreed to the published version of the manuscript.

Funding

This project was funded by Wuhan Botanical Garden, Chinese Academy of Sciences, China, grant No. E2559901; National Major Scientific Research Equipment Development Project of China, Grant/Award Numbers: 81627901; National Major Scientific Research Equipment Development Project of China, Grant/Award Numbers: 21927801; National Major Scientific Research Equipment Development Project of China, Grant/Award Numbers: 22127801.

Institutional Review Board Statement

Not applicable.

Informed Consent Statement

Not applicable.

Data Availability Statement

Not applicable.

Acknowledgments

The authors would like to thank members of their laboratory for helpful and constructive advice.

Conflicts of Interest

The authors declare no conflict of interest.

Abbreviations

Caco-2Human colon epithelial cells;
NMRNuclear Magnetic Resonance;
HDACHistone deacetylase activity;
GPR81G protein-coupled receptor 81;
TNFTumor Necrosis Factor;
MTT3-(4,5-dimethylthiazol-2-yl)-2,5-diphenyl-2H-tetrazolium bromide;
PCAPrincipal component analysis;
OPLS-DAOrthogonal projection to the latent structures discriminant analysis;
SAMS-adenosyl-methionine;
ROSReactive oxygen species;
ETCElectron transport chain;
NADHNicotinamide adenine dinucleotide;
MATMethionine adenosyltransferase;
DMNTDNA methyltransferase;
UHRF2E3 ubiquitin-protein ligase;
SLCsSolute carriers;
DEGsDifferentially expressed genes;
NOESYNuclear Overhauser effect spectroscopy;
JRESJ-resolved spectroscopy;
1H−1H COSY1H−1H correlation spectroscopy;
1H−1H TOCSY1H−1H total correlation spectroscopy;
1H-13C HSQC1H-13C heteronuclear single quantum coherence spectroscopy;
1H-13C HMBC1H-13C heteronuclear multiple bond correlation spectroscopy;
OXPHOSOxidative phosphorylation;
PAPantothenate;
IleIsoleucine;
LeuLeucine;
ValValine;
α-KIVα-Keto-isovalerate;
α-KMVα-keto-beta-methyl-valerate;
LacLactate;
AlaAlanine;
ThrThreonine;
GluGlutamate;
GlnGlutamine;
NAGN-Acetyl-Glutamine;
SucSuccinate;
MetMethionine;
DMGDimethylglycine;
CreCreatine;
ChoCholine;
PCPhosphocholine;
GPCGlycerophosphocholine;
TauTaurine;
GSHGlutathione;
GlcGlucose;
FruFructose;
Gal-1-PGalactose-1-phosphate;
TyrTyrosine;
PhePhenylalanine;
FumFumaric acid;
NAD+Nicotinamide adenine dinucleotide;
FAFormate;
HisHistidine;
AMPAdenosine monophosphate;
ATPAdenosine triphosphate;
UMPUridine 5′-monophosphate;
UDPUridine-5′-diphosphate;
UDPGUDP Glucuronate;
UDP-N-AceUDP-N-acetylglucosamine.

References

  1. Gladden, L. Lactate metabolism: A new paradigm for the third millennium. J. Physiol. 2004, 558, 5–30. [Google Scholar] [CrossRef] [PubMed]
  2. Kristensen, M.; Albertsen, J.; Rentsch, M.; Juel, C. Lactate and force production in skeletal muscle. J. Physiol. 2005, 562, 521–526. [Google Scholar] [CrossRef]
  3. Brooks, G.A. Lactate as a fulcrum of metabolism. Redox Biol. 2020, 35, 101454. [Google Scholar] [PubMed]
  4. Husain, Z.; Huang, Y.; Seth, P.; Sukhatme, V.P. Tumor-derived lactate modifies antitumor immune response: Effect on myeloid-derived suppressor cells and NK cells. J. Immunol. Res. 2013, 191, 1486–1495. [Google Scholar] [CrossRef] [PubMed]
  5. Heim, C.E.; Bosch, M.E.; Yamada, K.J.; Aldrich, A.L.; Chaudhari, S.S.; Klinkebiel, D.; Gries, C.M.; Alqarzaee, A.A.; Li, Y.; Thomas, V.C. Lactate production by Staphylococcus aureus biofilm inhibits HDAC11 to reprogramme the host immune response during persistent infection. Nat. Microbiol. 2020, 5, 1271–1284. [Google Scholar] [CrossRef] [PubMed]
  6. Romero-Garcia, S.; Moreno-Altamirano, M.M.B.; Prado-Garcia, H.; Sánchez-García, F.J. Lactate contribution to the tumor microenvironment: Mechanisms, effects on immune cells and therapeutic relevance. Front. Immunol. 2016, 7, 52. [Google Scholar] [CrossRef] [Green Version]
  7. Korol, D.L.; Gardner, R.S.; Tunur, T.; Gold, P.E. Involvement of lactate transport in two object recognition tasks that require either the hippocampus or striatum. Behav. Neurosci. 2019, 133, 176. [Google Scholar] [CrossRef]
  8. Hirschhaeuser, F.; Sattler, U.G.; Mueller-Klieser, W. Lactate: A metabolic key player in cancer. Cancer Res. 2011, 71, 6921–6925. [Google Scholar] [CrossRef] [Green Version]
  9. Brown, T.P.; Bhattacharjee, P.; Ramachandran, S.; Sivaprakasam, S.; Ristic, B.; Sikder, M.O.F.; Ganapathy, V. The lactate receptor GPR81 promotes breast cancer growth via a paracrine mechanism involving antigen-presenting cells in the tumor microenvironment. Oncogene 2020, 39, 3292–3304. [Google Scholar]
  10. Matsuki, T.; Pédron, T.; Regnault, B.; Mulet, C.; Hara, T.; Sansonetti, P.J. Epithelial cell proliferation arrest induced by lactate and acetate from Lactobacillus casei and Bifidobacterium breve. PLoS ONE 2013, 8, e63053. [Google Scholar]
  11. Khodayar-Pardo, P.; Mira-Pascual, L.; Collado, M.; Martínez-Costa, C. Impact of lactation stage, gestational age and mode of delivery on breast milk microbiota. J. Perinatol. 2014, 34, 599–605. [Google Scholar] [CrossRef] [PubMed]
  12. Pham, V.T.; Lacroix, C.; Braegger, C.P.; Chassard, C. Lactate-utilizing community is associated with gut microbiota dysbiosis in colicky infants. Sci. Rep. 2017, 7, 11176. [Google Scholar] [CrossRef] [PubMed] [Green Version]
  13. Weaver, L.T. Breast and gut: The relationship between lactating mammary function and neonatal gastrointestinal function. Proc. Nutr. Soc. 1992, 51, 155–163. [Google Scholar] [CrossRef] [PubMed] [Green Version]
  14. Shan, B.; Ai, Z.; Zeng, S.; Song, Y.; Song, J.; Zeng, Q.; Liao, Z.; Wang, T.; Huang, C.; Su, D. Gut microbiome-derived lactate promotes to anxiety-like behaviors through GPR81 receptor-mediated lipid metabolism pathway. Psychoneuroendocrinology 2020, 117, 104699. [Google Scholar] [CrossRef] [PubMed]
  15. Phypers, B.; Pierce, J.T. Lactate physiology in health and disease. Contin. Educ. Anaesth. Crit. Care Pain 2006, 6, 128–132. [Google Scholar]
  16. Garrote, G.L.; Abraham, A.G.; Rumbo, M. Is lactate an undervalued functional component of fermented food products? Front. Microbiol. 2015, 6, 629. [Google Scholar] [CrossRef]
  17. Latham, T.; Mackay, L.; Sproul, D.; Karim, M.; Culley, J.; Harrison, D.J.; Hayward, L.; Langridge-Smith, P.; Gilbert, N.; Ramsahoye, B.H. Lactate, a product of glycolytic metabolism, inhibits histone deacetylase activity and promotes changes in gene expression. Nucleic Acids Res. 2012, 40, 4794–4803. [Google Scholar] [CrossRef] [Green Version]
  18. Brown, T.P.; Ganapathy, V. Lactate/GPR81 signaling and proton motive force in cancer: Role in angiogenesis, immune escape, nutrition, and Warburg phenomenon. Pharmacol. Ther. 2020, 206, 107451. [Google Scholar] [CrossRef]
  19. Roland, C.L.; Arumugam, T.; Deng, D.; Liu, S.H.; Philip, B.; Gomez, S.; Burns, W.R.; Ramachandran, V.; Wang, H.; Cruz-Monserrate, Z. Cell surface lactate receptor GPR81 is crucial for cancer cell survival. Cancer Res. 2014, 74, 5301–5310. [Google Scholar] [CrossRef] [Green Version]
  20. Ippolito, L.; Morandi, A.; Giannoni, E.; Chiarugi, P. Lactate: A metabolic driver in the tumour landscape. Trends Biochem. Sci. 2019, 44, 153–166. [Google Scholar] [CrossRef]
  21. Flint, H.J.; Duncan, S.H.; Scott, K.P.; Louis, P. Links between diet, gut microbiota composition and gut metabolism. Proc. Nutr. Soc. 2015, 74, 13–22. [Google Scholar] [CrossRef] [PubMed] [Green Version]
  22. Flint, H.J.; Scott, K.P.; Louis, P.; Duncan, S.H. The role of the gut microbiota in nutrition and health. Nat. Rev. Gastroenterol. Hepatol. 2012, 9, 577–589. [Google Scholar] [CrossRef] [PubMed]
  23. Brooks, G.A. The science and translation of lactate shuttle theory. Cell Metab. 2018, 27, 757–785. [Google Scholar] [CrossRef] [PubMed] [Green Version]
  24. Villamil, M.F.; Ordieres, A.M.; Blanco, P.T. Immobilized enzyme electrode for the determination of L-lactate in food samples. Anal. Chim. Acta 1997, 345, 37–43. [Google Scholar] [CrossRef]
  25. Shapiro, F.; Silanikove, N. Rapid and accurate determination of D-and L-lactate, lactose and galactose by enzymatic reactions coupled to formation of a fluorochromophore: Applications in food quality control. Food Chem. 2010, 119, 829–833. [Google Scholar] [CrossRef]
  26. Duncan, S.H.; Belenguer, A.; Holtrop, G.; Johnstone, A.M.; Flint, H.J.; Lobley, G.E. Reduced dietary intake of carbohydrates by obese subjects results in decreased concentrations of butyrate and butyrate-producing bacteria in feces. Appl. Environ. Microbiol. 2007, 73, 1073–1078. [Google Scholar] [CrossRef] [Green Version]
  27. Solligård, E.; Juel, I.S.; Spigset, O.; Romundstad, P.; Grønbech, J.E.; Aadahl, P. Gut luminal lactate measured by microdialysis mirrors permeability of the intestinal mucosa after ischemia. Shock 2008, 29, 245–251. [Google Scholar] [CrossRef]
  28. Ogawa, K.; Ben, R.A.; Pons, S.; de Paolo, M. Volatile fatty acids, lactic acid, and pH in the stools of breast-fed and bottle-fed infants. J. Pediatr. Gastroenterol. Nutr. 1992, 15, 248–252. [Google Scholar] [CrossRef]
  29. Vernia, P.; Caprilli, R.; Latella, G.; Barbetti, F.; Magliocca, F.M.; Cittadini, M. Fecal lactate and ulcerative colitis. Gastroenterology 1988, 95, 1564–1568. [Google Scholar] [CrossRef]
  30. Hove, H.; Nordgaard-Andersen, I.; Mortensen, P.B. Faecal DL-lactate concentration in 100 gastrointestinal patients. Scand. J. Gastroenterol. 1994, 29, 255–259. [Google Scholar] [CrossRef]
  31. Samuvel, D.J.; Sundararaj, K.P.; Nareika, A.; Lopes-Virella, M.F.; Huang, Y. Lactate boosts TLR4 signaling and NF-κB pathway-mediated gene transcription in macrophages via monocarboxylate transporters and MD-2 up-regulation. J. Immunol. Res. 2009, 182, 2476–2484. [Google Scholar] [CrossRef] [Green Version]
  32. Sun, S.; Li, H.; Chen, J.; Qian, Q. Lactic acid: No longer an inert and end-product of glycolysis. Physiology 2017, 32, 453–463. [Google Scholar] [CrossRef] [PubMed]
  33. Dienel, G.A. Brain lactate metabolism: The discoveries and the controversies. J. Cereb. Blood Flow Metab. 2012, 32, 1107–1138. [Google Scholar] [CrossRef] [PubMed] [Green Version]
  34. Wilson, G.; Hassan, I.; Dix, C.; Williamson, I.; Shah, R.; Mackay, M.; Artursson, P. Transport and permeability properties of human Caco-2 cells: An in vitro model of the intestinal epithelial cell barrier. J. Control. Release 1990, 11, 25–40. [Google Scholar] [CrossRef]
  35. Lowe, R.; Shirley, N.; Bleackley, M.; Dolan, S.; Shafee, T. Transcriptomics technologies. PLoS Comput. Biol. 2017, 13, e1005457. [Google Scholar] [CrossRef] [PubMed] [Green Version]
  36. Borgan, E.; Sitter, B.; Lingjærde, O.C.; Johnsen, H.; Lundgren, S.; Bathen, T.F.; Sørlie, T.; Børresen-Dale, A.-L.; Gribbestad, I.S. Merging transcriptomics and metabolomics-advances in breast cancer profiling. BMC Cancer 2010, 10, 628. [Google Scholar] [CrossRef] [Green Version]
  37. Viguerie, N.; Poitou, C.; Cancello, R.; Stich, V.; Clement, K.; Langin, D. Transcriptomics applied to obesity and caloric restriction. Biochimie 2005, 87, 117–123. [Google Scholar] [CrossRef]
  38. Kuehnbaum, N.L.; Britz-McKibbin, P. New advances in separation science for metabolomics: Resolving chemical diversity in a post-genomic era. Chem. Rev. 2013, 113, 2437–2468. [Google Scholar] [CrossRef]
  39. Manson, J.M.; Rauch, M.; Gilmore, M.S. The commensal microbiology of the gastrointestinal tract. GI Microbiota Regul. Immune Syst. 2008, 635, 15–28. [Google Scholar]
  40. Sumei, S.; Xiangyun, K.; Fenrong, C.; Xueguang, S.; Sijun, H.; Bin, B.; Xiaolei, S.; Yongjiu, T.; Kaichun, W.; Qingchuan, Z. Hypermethylation of DHRS3 as a Novel Tumor Suppressor Involved in Tumor Growth and Prognosis in Gastric Cancer. Front. Cell Dev. Biol 2021, 11. [Google Scholar] [CrossRef]
  41. Fraga, M.; Perelmuter, K.; Delucchi, L.; Cidade, E.; Zunino, P. Vaginal lactic acid bacteria in the mare: Evaluation of the probiotic potential of native Lactobacillus spp. and Enterococcus spp. strains. Antonie Van Leeuwenhoek 2008, 93, 71–78. [Google Scholar] [CrossRef] [PubMed]
  42. Dietl, K.; Renner, K.; Dettmer, K.; Timischl, B.; Eberhart, K.; Dorn, C.; Hellerbrand, C.; Kastenberger, M.; Kunz-Schughart, L.A.; Oefner, P.J. Lactic acid and acidification inhibit TNF secretion and glycolysis of human monocytes. J. Immunol. Res. 2010, 184, 1200–1209. [Google Scholar] [CrossRef] [PubMed]
  43. Belenguer, A.; Duncan, S.H.; Holtrop, G.; Anderson, S.E.; Lobley, G.E.; Flint, H.J. Impact of pH on lactate formation and utilization by human fecal microbial communities. Appl. Environ. Microbiol. 2007, 73, 6526–6533. [Google Scholar] [CrossRef] [PubMed] [Green Version]
  44. Kostidis, S.; Addie, R.D.; Morreau, H.; Mayboroda, O.A.; Giera, M. Quantitative NMR analysis of intra-and extracellular metabolism of mammalian cells: A tutorial. Anal. Chim. Acta 2017, 980, 1–24. [Google Scholar] [CrossRef]
  45. Li, T.; Wernersson, R.; Hansen, R.B.; Horn, H.; Mercer, J.; Slodkowicz, G.; Workman, C.T.; Rigina, O.; Rapacki, K.; Stærfeldt, H.H. A scored human protein–protein interaction network to catalyze genomic interpretation. Nat. Methods 2017, 14, 61–64. [Google Scholar] [CrossRef] [Green Version]
  46. Zhao, R.Z.; Jiang, S.; Zhang, L.; Yu, Z.B. Mitochondrial electron transport chain, ROS generation and uncoupling. Int. J. Mol. Med. 2019, 44, 3–15. [Google Scholar] [CrossRef] [Green Version]
  47. Tauffenberger, A.; Fiumelli, H.; Almustafa, S.; Magistretti, P.J. Lactate and pyruvate promote cellular stress resistance and longevity through ROS signaling. Cell Death Dis. 2019, 10, 542316. [Google Scholar] [CrossRef]
  48. Zelenka, J.; Dvořák, A.; Alán, L. L-lactate protects skin fibroblasts against aging-associated mitochondrial dysfunction via mitohormesis. Oxid. Med. Cell. Longev. 2015, 2015, 351698. [Google Scholar] [CrossRef] [Green Version]
  49. Galardo, M.N.; Regueira, M.; Riera, M.F.; Pellizzari, E.H.; Cigorraga, S.B.; Meroni, S.B. Lactate regulates rat male germ cell function through reactive oxygen species. PLoS ONE 2014, 9, e88024. [Google Scholar] [CrossRef] [Green Version]
  50. Vinogradov, A.D.; Grivennikova, V.G. Oxidation of NADH and ROS production by respiratory complex I. Biochim. Et Biophys. Acta (BBA)-Bioenerg. 2016, 1857, 863–871. [Google Scholar] [CrossRef]
  51. Nolfi-Donegan, D.; Braganza, A.; Shiva, S. Mitochondrial electron transport chain: Oxidative phosphorylation, oxidant production, and methods of measurement. Redox Biol. 2020, 37, 101674. [Google Scholar] [CrossRef] [PubMed]
  52. Balestrino, M.; Adriano, E. Creatine as a candidate to prevent statin myopathy. Biomolecules 2019, 9, 496. [Google Scholar] [CrossRef] [Green Version]
  53. Das, B.; Srivastava, S.K. Activation of aldose reductase from human tissues. Diabetes 1985, 34, 1145–1151. [Google Scholar] [CrossRef]
  54. González, R.G.; Barnett, P.; Aguayo, J.; Cheng, H.-M.; Chylack, L. Direct measurement of polyol pathway activity in the ocular lens. Diabetes 1984, 33, 196–199. [Google Scholar] [CrossRef] [Green Version]
  55. Liemburg-Apers, D.C.; Willems, P.H.; Koopman, W.J.; Grefte, S. Interactions between mitochondrial reactive oxygen species and cellular glucose metabolism. Arch. Toxicol. 2015, 89, 1209–1226. [Google Scholar] [CrossRef] [PubMed] [Green Version]
  56. Yan, L.J. Redox imbalance stress in diabetes mellitus: Role of the polyol pathway. Anim. Models Exp. Med. 2018, 1, 7–13. [Google Scholar] [CrossRef]
  57. Schenz, J.; Heilig, L.; Lohse, T.; Tichy, L.; Bomans, K.; Büttner, M.; Weigand, M.A.; Uhle, F. Extracellular Lactate Acts as a Metabolic Checkpoint and Shapes Monocyte Function Time Dependently. Front. Immunol. 2021, 12, 729209. [Google Scholar] [CrossRef]
  58. Hwang, J.J.; Jiang, L.; Hamza, M.; Dai, F.; Belfort-DeAguiar, R.; Cline, G.; Rothman, D.L.; Mason, G.; Sherwin, R.S. The human brain produces fructose from glucose. JCI Insight 2017, 2, e90508. [Google Scholar] [CrossRef] [PubMed]
  59. Barnett, P.A.; González, R.G.; Chylack, L.T., Jr.; Cheng, H.-M. The effect of oxidation on sorbitol pathway kinetics. Diabetes 1986, 35, 426–432. [Google Scholar] [CrossRef] [PubMed]
  60. Chandra, D.; Jackson, E.B.; Ramana, K.V.; Kelley, R.; Srivastava, S.K.; Bhatnagar, A. Nitric oxide prevents aldose reductase activation and sorbitol accumulation during diabetes. Diabetes 2002, 51, 3095–3101. [Google Scholar] [CrossRef] [Green Version]
  61. Kinoshita, J.H.; Merola, L.O.; Satoh, K.; Dikmak, E. Osmotic changes caused by the accumulation of dulcitol in the lenses of rats fed with galactose. Nature 1962, 194, 1085–1087. [Google Scholar] [PubMed]
  62. Tang, W.; Martin, K.A.; Hwa, J. Aldose reductase, oxidative stress, and diabetic mellitus. Front. Pharmacol. 2012, 3, 87. [Google Scholar] [CrossRef] [PubMed] [Green Version]
  63. Oyama, T.; Miyasita, Y.; Watanabe, H.; Shirai, K. The role of polyol pathway in high glucose-induced endothelial cell damages. Diabetes Res. Clin. Pract. 2006, 73, 227–234. [Google Scholar] [PubMed]
  64. Clare, C.E.; Brassington, A.H.; Kwong, W.Y.; Sinclair, K.D. One-carbon metabolism: Linking nutritional biochemistry to epigenetic programming of long-term development. Annu. Rev. Anim. Biosci. 2019, 7, 263–287. [Google Scholar] [PubMed]
  65. Chiang, P.K.; Gordon, R.K.; Tal, J.; Zeng, G.; Doctor, B.; Pardhasaradhi, K.; McCann, P.P. S-Adenosylmetliionine and methylation. FASEB J. 1996, 10, 471–480. [Google Scholar] [CrossRef] [PubMed] [Green Version]
  66. Ramani, K.; Mato, J.M.; Lu, S.C. Role of methionine adenosyltransferase genes in hepatocarcinogenesis. Cancers 2011, 3, 1480–1497. [Google Scholar] [CrossRef] [Green Version]
  67. Thompson, M.A.; Weinshilboum, R.M. Rabbit lung indolethylamine N-methyltransferase: cDNA and gene cloning and characterization. J. Biol. Chem. 1998, 273, 34502–34510. [Google Scholar] [CrossRef] [Green Version]
  68. Jacob, M.S.; Presti, D.E. Endogenous psychoactive tryptamines reconsidered: An anxiolytic role for dimethyltryptamine. Med. Hypotheses 2005, 64, 930–937. [Google Scholar]
  69. Pichler, G.; Wolf, P.; Schmidt, C.S.; Meilinger, D.; Schneider, K.; Frauer, C.; Fellinger, K.; Rottach, A.; Leonhardt, H. Cooperative DNA and histone binding by Uhrf2 links the two major repressive epigenetic pathways. J. Cell. Biochem. 2011, 112, 2585–2593. [Google Scholar] [CrossRef] [Green Version]
  70. Liu, Y.; Zhang, B.; Kuang, H.; Korakavi, G.; Lu, L.-Y.; Yu, X. Zinc finger protein 618 regulates the function of UHRF2 (Ubiquitin-like with PHD and ring finger domains 2) as a specific 5-hydroxymethylcytosine reader. J. Biol. Chem. 2016, 291, 13679–13688. [Google Scholar] [CrossRef] [Green Version]
  71. Engedal, N.; Žerovnik, E.; Rudov, A.; Galli, F.; Olivieri, F.; Procopio, A.D.; Rippo, M.R.; Monsurrò, V.; Betti, M.; Albertini, M.C. From oxidative stress damage to pathways, networks, and autophagy via microRNAs. Oxid. Med. Cell. Longev. 2018, 2018, 4968321. [Google Scholar] [CrossRef] [PubMed]
  72. Conomos, D.; Reddel, R.R.; Pickett, H.A. NuRD–ZNF827 recruitment to telomeres creates a molecular scaffold for homologous recombination. Nat. Struct. Mol. Biol. 2014, 21, 760–770. [Google Scholar] [PubMed]
  73. Schilderink, R.; Verseijden, C.; de Jonge, W.J. Dietary inhibitors of histone deacetylases in intestinal immunity and homeostasis. Front. Immunol. 2013, 4, 226. [Google Scholar]
  74. Belenguer, A.; Holtrop, G.; Duncan, S.H.; Anderson, S.E.; Calder, A.G.; Flint, H.J.; Lobley, G.E. Rates of production and utilization of lactate by microbial communities from the human colon. FEMS Microbiol. Ecol. 2011, 77, 107–119. [Google Scholar] [CrossRef] [PubMed] [Green Version]
  75. Kee, H.J.; Kook, H. Krüppel-like factor 4 mediates histone deacetylase inhibitor-induced prevention of cardiac hypertrophy. J. Mol. Cell. Cardiol. 2009, 47, 770–780. [Google Scholar] [CrossRef]
  76. Wagner, W.; Ciszewski, W.M.; Kania, K.D. L-and D-lactate enhance DNA repair and modulate the resistance of cervical carcinoma cells to anticancer drugs via histone deacetylase inhibition and hydroxycarboxylic acid receptor 1 activation. Cell Commun. Signal. 2015, 13, 36. [Google Scholar]
  77. Dolcet, X.; Llobet, D.; Pallares, J.; Matias-Guiu, X. NF-kB in development and progression of human cancer. Virchows Arch. 2005, 446, 475–482. [Google Scholar]
  78. Arjunan, P.; Meghil, M.M.; Pi, W.; Xu, J.; Lang, L.; El-Awady, A.; Sullivan, W.; Rajendran, M.; Rabelo, M.S.; Wang, T. Oral pathobiont activates anti-apoptotic pathway, promoting both immune suppression and oncogenic cell proliferation. Sci. Rep. 2018, 8, 16607. [Google Scholar]
  79. Kamejima, S.; Tatsumi, N.; Anraku, A.; Suzuki, H.; Ohkido, I.; Yokoo, T.; Okabe, M. Gcm1 is involved in cell proliferation and fibrosis during kidney regeneration after ischemia–reperfusion injury. Sci. Rep. 2019, 9, 7883. [Google Scholar]
  80. Wang, Z.; Reinach, P.S.; Zhang, F.; Vellonen, K.-S.; Urtti, A.; Turner, H.; Wolosin, J.M. DUSP5 and DUSP6 modulate corneal epithelial cell proliferation. Mol. Vis. 2010, 16, 1696. [Google Scholar]
  81. Hughes, T.K.; Wadsworth, M.H.; Gierahn, T.M.; Do, T.; Weiss, D.; Andrade, P.R.; Ma, F.; de Andrade Silva, B.J.; Shao, S.; Tsoi, L.C. Highly efficient, massively-parallel single-cell RNA-seq reveals cellular states and molecular features of human skin pathology. BioRxiv 2019, 689273. [Google Scholar] [CrossRef] [Green Version]
  82. Kotolloshi, R.; Hölzer, M.; Gajda, M.; Grimm, M.-O.; Steinbach, D. SLC35F2, a Transporter Sporadically Mutated in the Untranslated Region, Promotes Growth, Migration, and Invasion of Bladder Cancer Cells. Cells 2021, 10, 80. [Google Scholar] [CrossRef] [PubMed]
  83. Thanan, R.; Kaewlert, W.; Sakonsinsiri, C.; Chaiprasert, T.; Armartmuntree, N.; Muengsaen, D.; Techasen, A.; Klanrit, P.; Lert-Itthiporn, W.; Pinlaor, S. Opposing roles of FoxA1 and FoxA3 in intrahepatic cholangiocarcinoma progression. Int. J. Mol. Sci. 2020, 21, 1796. [Google Scholar] [CrossRef] [PubMed] [Green Version]
  84. Wu, Z.; Xu, J.; Liang, C.; Meng, Q.; Hua, J.; Wang, W.; Zhang, B.; Liu, J.; Yu, X.; Shi, S. Emerging roles of the solute carrier family in pancreatic cancer. Clin. Transl. Med. 2021, 11, e356. [Google Scholar] [CrossRef]
  85. Schumann, T.; König, J.; Henke, C.; Willmes, D.M.; Bornstein, S.R.; Jordan, J.; Fromm, M.F.; Birkenfeld, A.L. Solute carrier transporters as potential targets for the treatment of metabolic disease. Pharmacol. Rev. 2020, 72, 343–379. [Google Scholar] [CrossRef]
  86. Pramod, A.B.; Foster, J.; Carvelli, L.; Henry, L.K. SLC6 transporters: Structure, function, regulation, disease association and therapeutics. Mol. Aspects Med. 2013, 34, 197–219. [Google Scholar] [CrossRef] [Green Version]
  87. Guarch, M.E.; Font-Llitjós, M.; Murillo-Cuesta, S.; Errasti-Murugarren, E.; Celaya, A.M.; Girotto, G.; Vuckovic, D.; Mezzavilla, M.; Vilches, C.; Bodoy, S. Mutations in L-type amino acid transporter-2 support SLC7A8 as a novel gene involved in age-related hearing loss. Elife 2018, 7, e31511. [Google Scholar] [CrossRef]
  88. Bahuguna, A.; Khan, I.; Bajpai, V.K.; Kang, S.C. MTT assay to evaluate the cytotoxic potential of a drug. Bangladesh J. Pharmacol. 2017, 12, 115–118. [Google Scholar] [CrossRef]
  89. Korotkevich, G.; Sukhov, V.; Budin, N.; Shpak, B.; Artyomov, M.N.; Sergushichev, A. Fast gene set enrichment analysis. BioRxiv 2021, 060012. [Google Scholar] [CrossRef] [Green Version]
  90. Babicki, S.; Arndt, D.; Marcu, A.; Liang, Y.; Grant, J.R.; Maciejewski, A.; Wishart, D.S. Heatmapper: Web-enabled heat mapping for all. Nucleic Acids Res. 2016, 44, W147–W153. [Google Scholar] [CrossRef]
  91. Luo, Y.; Geng, N.; Zhang, B.; Chen, J.; Zhang, H. Effects of harvesting and extraction methods on metabolite recovery from adherently growing mammalian cells. Anal. Methods 2020, 12, 2491–2498. [Google Scholar] [CrossRef] [PubMed]
  92. Beckonert, O.; Keun, H.C.; Ebbels, T.M.; Bundy, J.; Holmes, E.; Lindon, J.C.; Nicholson, J.K. Metabolic profiling, metabolomic and metabonomic procedures for NMR spectroscopy of urine, plasma, serum and tissue extracts. Nat. Protoc. 2007, 2, 2692. [Google Scholar] [CrossRef] [PubMed]
  93. Dieterle, F.; Ross, A.; Schlotterbeck, G.; Senn, H. Probabilistic quotient normalization as robust method to account for dilution of complex biological mixtures. Application in 1H NMR metabonomics. Anal. Chem. 2006, 78, 4281–4290. [Google Scholar] [CrossRef] [PubMed]
  94. Pang, Z.; Chong, J.; Zhou, G.; de Lima Morais, D.A.; Chang, L.; Barrette, M.; Gauthier, C.; Jacques, P.-É.; Li, S.; Xia, J. MetaboAnalyst 5.0: Narrowing the gap between raw spectra and functional insights. Nucleic Acids Res. 2021, 49, W388–W396. [Google Scholar] [CrossRef]
  95. Trygg, J.; Wold, S. Orthogonal projections to latent structures (O-PLS). J. Chemom. 2002, 16, 119–128. [Google Scholar] [CrossRef]
  96. Lindgren, F.; Hansen, B.; Karcher, W.; Sjöström, M.; Eriksson, L. Model validation by permutation tests: Applications to variable selection. J. Chemom. 1996, 10, 521–532. [Google Scholar] [CrossRef]
  97. Cloarec, O.; Dumas, M.E.; Trygg, J.; Craig, A.; Barton, R.H.; Lindon, J.C.; Nicholson, J.K.; Holmes, E. Evaluation of the orthogonal projection on latent structure model limitations caused by chemical shift variability and improved visualization of biomarker changes in 1H NMR spectroscopic metabonomic studies. Anal. Chem. 2005, 77, 517–526. [Google Scholar] [CrossRef]
Figure 1. Determination of the cytotoxic activity of lactate on Caco-2 Cells using the MTT assay. N = 4, values are means ± SEM, *** p < 0.0001.
Ijms 23 06262 g001
Figure 2. Typical 1H NMR spectra from the cell extracts. Keys: PA, Pantothenate; Ile, Isoleucine; Leu, Leucine; Val, Valine; α-KIV, α-Keto-isovalerate; α-KMV, α-keto-beta-methyl-valerate; Lac, Lactate; Ala, Alanine; Thr, Threonine; Glu, Glutamate; Gln, Glutamine; NAG, N-Acetyl-Glutamine; Suc, Succinate; Met, Methionine; DMG, Dimethylglycine; Cre, Creatine; Cho, Choline; PC, Phosphocholine; GPC, Glycerophosphocholine; Tau, Taurine; GSH, Glutathione; Glc, Glucose; Fru, Fructose; Gal-1-p, Galactose-1-phosphate; Tyr, Tyrosine; Phe, Phenylalanine; Fum, Fumaric acid; NAD+, Nicotinamide adenine dinucleotide; FA, Formate; His, Histidine; AMP, Adenosine monophosphate; ATP, Adenosine triphosphate; UMP, Uridine 5′-monophosphate; UDP, Uridine-5′-diphosphate; UDPG, UDP Glucuronate; UDP-N-Ace, UDP-N-acetylglucosamine; C-alpha, The central carbon atom in amino acids.
Ijms 23 06262 g002
Figure 3. Differential metabolomics of the Caco-2 cells between the lactate and the control group. (A). Principal component analysis (PCA) scores of the complete metabolic profiles of all samples (N = 4). The light blue region is for the 95% confidence interval of the lactate treatment; the light orange portion is for the 95% confidence interval of the control group; and the light blue and orange dots are representative of the samples of the lactate and the control treatments, respectively. (B). Color-coded correlation coefficient loadings plots generated by comparing the spectra of the intracellular metabolites between the lactate and the control treatments.
Ijms 23 06262 g003
Figure 4. Comparison of the transcriptomes of the Caco-2 cells of the lactate and the control treatments. (A). Principal component analysis (PCA) scores of the complete expression profiles of all the samples (N = 3). The light blue region is for the 95% confidence interval of the lactate treatment; the light orange region is for the 95% confidence interval of the control group; and the light blue and orange dots are representative of the samples of the lactate and the control treatments, respectively. (B). Volcano plot showing the differentially expressed genes (DEGs) in the Caco-2 Cells of the lactate and the control treatments. The FDR-corrected p < 0.05; the absolute fold change >= 1.5. The blue dots are the downregulated DEGs, and the red dots are the upregulated DEGs caused by the lactate treatment. The gray dots are the genes with no difference in expression.
Ijms 23 06262 g004
Figure 5. Supervised heat maps of genes in the enriched gene sets. The gene set enrichment analyses determined that the enriched gene sets and were performed using supervised hierarchical clustering in Heatmapper including DEGs with an FDR-corrected p < 0.05 and fold change ≥1.5, upregulated (red) gene, and downregulated (green) gene in the lactate vs. the control treatments.
Ijms 23 06262 g005
Figure 6. Pathways significantly enriched in lactate treatment compared with control treatment. NES: normalized enrichment score. Negative NES (blue dot) shows downregulated pathways and positive NES (red dot) shows upregulated pathways in lactate treatment, green-highlighted pathways are significantly altered both at the metabolic and transcriptomic levels, * Adjusted p < 0.05, ** Adjusted p < 0.01.
Ijms 23 06262 g006
Figure 7. Metabolic and transcriptomic alternations of pathways under lactate exposure. Blue (downregulated) and red (upregulated) in the lactate vs. the control treatments.
Ijms 23 06262 g007
Table 1. 1H NMR assignment for the metabolites from the cell extracts.
NumberMetabolitesδ 1H (ppm) and MultiplicityAbbreviation
1Pantothenate0.893 (s), 0.927 (s)PA
2Isoleucine 0.937 (t), 1.264 (m), 1.46 (m), 1.007 (d), 1.97 (m)Ile
3Leucine 0.953 (d), 0.964 (d), 1.705 (m), 3.78 (t)Leu
4Valine0.989 (d), 1.04 (d), 2.259 (m)Val
5α-Keto-isovalerate1.12 (d), 3.01 (m)α-KIV
6α-keto-β-methyl-valerate0.883 (t), 1.088 (d)α-KMV
7Lactic acid 1.324 (d), 4.104 (q)Lac
8Alanine 1.477 (d), 3.774 (q)Ala
9Threonine1.325 (d), 4.247 (dd)Thr
10Glutamate2.339 (m), 2.052 (m), 2.117 (m), 3.759 (t)Glu
11Glutamine 2.453 (m), 2.153 (m), 3.769 (t)Gln
12N-Acetyl-L-Glutamine2.037 (s), 2.335 (t)NAG
13Succinate2.399 (s)Suc
14Methionine2.644 (t)Met
15Dimethylglycine2.827 (s)DMG
16Creatine3.032 (s), 3.926 (s)Cre
17Choline 3.193 (s)Cho
18Phosphocholine 3.218 (s)PC
19Glycerophosphocholine 3.227 (s)GPC
20Taurine 3.26 (t), 3.41 (t)Tau
21Glutathione 2.164 (m), 2.554 (m) 2.931 (dd), 2.975 (dd), 4.55 (m)GSH
22Glucose4.644 (d), 5.23 (d)Glc
23Fructose4.016 (m), 4.032 (m), 4.06 (m)Fru
24Galactose-1-phosphate5.452 (dd)Gal-1-P
25Tyrosine 6.899 (d), 7.192 (d)Tyr
26Phenylalanine 7.327 (m), 7.425 (m), 7.373 (m)Phe
27Fumaric acid 6.515 (s)Fum
28Nicotinamide adenine dinucleotide8.428 (s)NAD+
29Formate8.454 (s)FA
30Histidine7.073 (s), 7.826 (s)His
31Adenosine monophosphate8.607 (s), 8.269 (s), 6.147 (d)AMP
32Adenosine triphosphate8.533 (s), 8.269 (s), 6.147 (d)ATP
33Uridine 5’-monophosphate8.116 (d)UMP
34Uridine 5’-diphosphate7.99 (d), 5.968 (d)UDP
35UDP Glucuronate7.952 (d)UDPG
36UDP-N-acetylglucosamine7.946 (d)UDP-N-Ace
Note: s, singlet; d, doublet; t, triplet; q, quartet; m, multiplet; dd, doublet of doublet.
Publisher’s Note: MDPI stays neutral with regard to jurisdictional claims in published maps and institutional affiliations.

