Article

Inactivation of Osteoblast PKC Signaling Reduces Cortical Bone Mass and Density and Aggravates Renal Osteodystrophy in Mice with Chronic Kidney Disease on High Phosphate Diet

1
Service de Pédiatrie 1, Hôpital de Hautepierre, Hôpitaux Universitaires de Strasbourg, 67098 Strasbourg, France
2
Imagerie Préclinique—UF6237, Pôle d’Imagerie, Hôpitaux Universitaires de Strasbourg, 67098 Strasbourg, France
3
OMICARE, Centre de Recherche d’Immunologie et d’Hématologie, Fédération Hospitalo-Universitaire, 67085 Strasbourg, France
4
INSERM UMR_S 1109, Immuno-Rhumatologie Moléculaire, Centre de Recherche d’Immunologie et d’Hématologie, 67085 Strasbourg, France
5
Center for Pediatric and Adolescent Medicine, Division of Pediatric Nephrology, University of Heidelberg, 69120 Heidelberg, Germany
6
Pôle de Médecine et Chirurgie Bucco-Dentaires, Hôpitaux Universitaires de Strasbourg, 67091 Strasbourg, France
7
Medical Image Analysis Center (MIAC AG), 4051 Basel, Switzerland
8
Department of Craniofacial Development and Stem Cell Biology, Dental Institute, King’s College London, London SE1 9RT, UK
9
Groupe Méthodes en Recherche Clinique (GMRC), Hôpital Civil, Hôpitaux Universitaires de Strasbourg, 67000 Strasbourg, France
10
INSERM, UMR 1033, Université de Lyon, 69372 Lyon, France
11
Centre de Référence des Maladies Rénales Rares, Centre de Références des Maladies Rares du Calcium et du Phosphore, Hospices Civils de Lyon, 69500 Lyon, France
12
Plateforme GENOMAX, Laboratoire d’Immuno-Rhumatologie Moléculaire, INSERM UMR_S1109, LabEx Transplantex, Centre de Recherche d’Immunologie et d’Hématologie, Faculté de Médecine, FMTS, Université de Strasbourg, 67085 Strasbourg, France
13
INSERM Franco-Japanese Nextgen HLA Laboratory, 67085 Strasbourg, France
14
Laboratoire Central d’Immunologie, Plateau Technique de Biologie, Pôle de Biologie, Nouvel Hôpital Civil, 67091 Strasbourg, France
*
Author to whom correspondence should be addressed.
Int. J. Mol. Sci. 2022, 23(12), 6404; https://doi.org/10.3390/ijms23126404
Submission received: 6 May 2022 / Revised: 1 June 2022 / Accepted: 6 June 2022 / Published: 8 June 2022
(This article belongs to the Section Molecular Pathology, Diagnostics, and Therapeutics)

Abstract

:
Chronic kidney disease (CKD) frequently leads to hyperphosphatemia and hyperparathyroidism, mineral bone disorder (CKD-MBD), ectopic calcifications and cardiovascular mortality. PTH activates the osteoanabolic Gαs/PKA and the Gαq/11/PKC pathways in osteoblasts, the specific impact of the latter in CKD-MBD is unknown. We generated osteoblast specific Gαq/11 knockout (KO) mice and established CKD-MBD by subtotal nephrectomy and dietary phosphate load. Bone morphology was assessed by micro-CT, osteoblast function by bone planar scintigraphy at week 10 and 22 and by histomorphometry. Osteoblasts isolated from Gαq/11 KO mice increased cAMP but not IP3 in response to PTH 1-34, demonstrating the specific KO of the PKC signaling pathway. Osteoblast specific Gαq/11 KO mice exhibited increased serum calcium and reduced bone cortical thickness and mineral density at 24 weeks. CKD Gαq/11 KO mice had similar bone morphology compared to WT, while CKD Gαq/11-KO on high phosphate diet developed decreased metaphyseal and diaphyseal cortical thickness and area, as well as a reduction in trabecular number. Gαq/11-KO increased bone scintigraphic tracer uptake at week 10 and mitigated tracer uptake in CKD mice at week 22. Histological bone parameters indicated similar trends. Gαq/11-KO in osteoblast modulates calcium homeostasis, bone formation rate, bone morphometry, and bone mineral density. In CKD and high dietary phosphate intake, osteoblast Gαq/11/PKC KO further aggravates mineral bone disease.

1. Introduction

Chronic kidney disease (CKD) is highly prevalent and inevitably associated with the disorder of mineral and bone metabolism, CKD-MBD [1,2,3,4]. The pathophysiological interplay of CKD and mineral bone disorder [5] includes abnormalities of calcium, phosphorus, parathyroid hormone, fibroblast growth factor 23, and vitamin D. It results in osteodystrophy, an increased fracture risk and extra-osseous calcifications, including vascular calcifications and thus contributes to the exceedingly high cardiovascular morbidity and mortality in patients with CKD [6,7]. The histological changes of bone are driven by the degree of CKD and the associated alterations in hormone and mineral metabolism, as well as by the therapeutic interventions to control CKD-MBD. Secondary hyperparathyroidism (HPT) results in high bone turnover with increased osteoblast, osteoclast and osteocyte numbers, and osteitis fibrosis. Overshooting therapy with vitamin D sterols and calcium results in adynamic osteodystrophy, increasing the risks of hypercalcemia and extra-osseus calcifications [3,4,8]. Only a minority of patients with CKD have a largely normal bone morphology [9]. Even in the initial stages of CKD, bone impairment is prevalent and fracture risk is increased [10,11,12] despite a phosphate reduced diet and various pharmaceutical measures including native and active vitamin D, oral phosphate binders, and calcimimetic agents [13]. Therefore, novel therapeutic approaches are needed.
PTH plays a crucial role in bone, calcium, and phosphate homeostasis. In bone, PTH binds to the class B PTH/PTH-related peptide receptor, PTH1R, which belongs to the G protein-coupled receptors class II family and activates G proteins Gαs and Gαq/11 [14,15]. Gαs activates the adenylyl cyclase and increases intracellular cyclic AMP (cAMP), leading to protein kinase A activation, which phosphorylates target proteins. Gαq/11 activates phospholipase C, which leads to the generation of inositol 1,4,5-triphosphate (IP3), and diacylglycerol [16], an increase in intracellular calcium and consecutive activation of the PKC signaling pathway [14,17]. The effects of PKA activation and inactivation have been described in mice and in human genetic disorders, and demonstrated the role of PKA in the response of bone to PTH [18,19,20,21,22,23]. cAMP/PKA mediates the majority of PTH effects, including bone formation and bone resorption by increasing the expression of RANKL [18,19,24]. However, the role of PKC signaling is less clear [24]. In mice, genetic activation of bone Gαq or Gα11 results in severe osteoporosis with a decrease of both trabecular and cortical bone volume, and in case of Gαq, activation in dwarfism. The anabolic response to intermittent PTH treatment is absent [25,26]. Mice with a genetic variant of the PTH1R blocking PKC activation and maintaining PKA activation (DSEL mice) have a decreased trabecular bone volume but develop less bone alterations in response to continuous PTH administration or a low calcium diet, as compared to WT mice [27,28]. Ogata et al. established an osteoblastic specific knockout Gαq/11 mouse model, which yielded no alterations in bone structure at 8 weeks of life, but an increase anabolic response to intermittent PTH treatment [29]. In contrast, the intermittent administration of an analog of PTH, which was recently identified to activate PKC but not PLC and cAMP/PKA signaling, lead to an osteoanabolic effect [24], suggesting a selective, significant osteoanabolic action of PKC activation.
In view of the major clinical impact of CKD-MBD and the lack of specific therapeutic approaches improving bone disease, we studied the role of PKC modulation in mice with CKD. Therefore, we established an osteoblast specific Gαq/11 knockout, blocking the PKC signaling pathway in mice with normal renal function, CKD, high phosphate diet, and the combination of both.

2. Results

2.1. Experimental Results

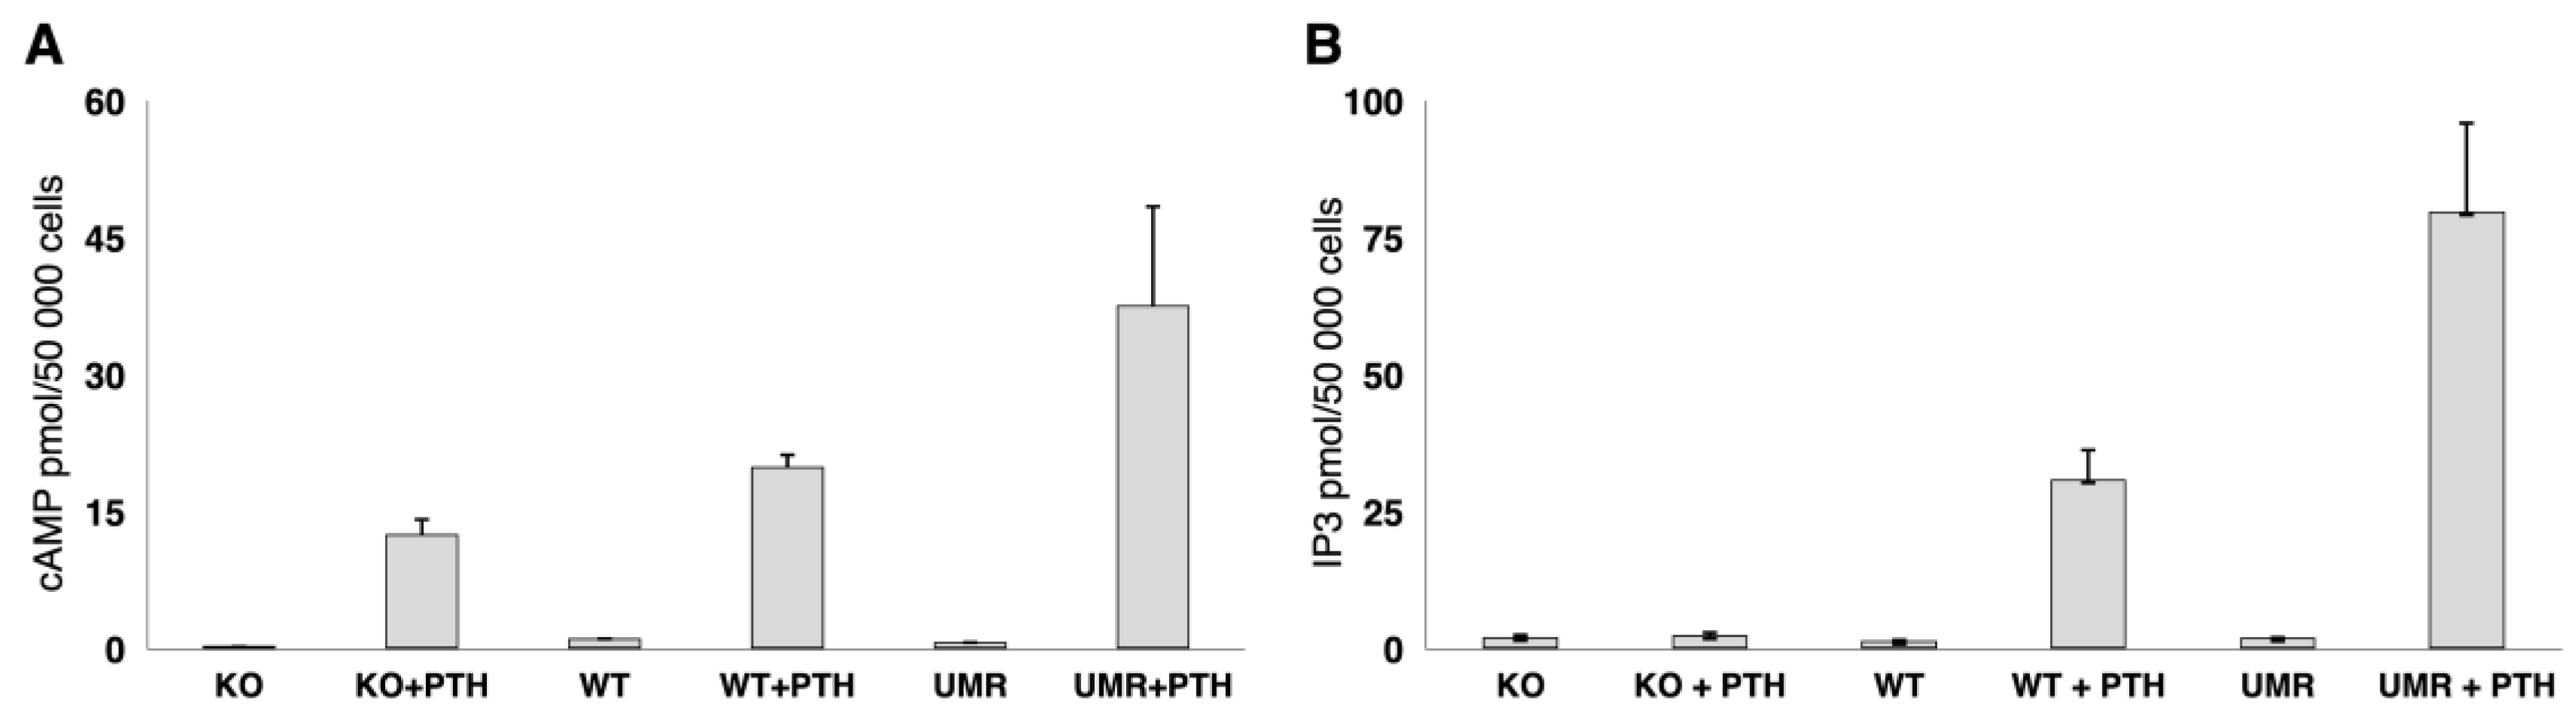
2.1.1. Osteoblast Gαq/11 Expression and PTH Response

Immunostainings demonstrated the absence of Gαq/11 protein in PTH stimulated osteoblasts isolated from Gαq/11 KO mice and the distinct abundance in osteoblasts from WT littermates (Figure 1).
Stimulation of the Gαq/11 KO osteoblasts with PTH increased PKA signalling dependent medium cAMP concentrations, whereas PKC signalling dependent IP3 stimulation was absent in the osteoblasts from KO mice. Osteoblasts from WT mice and immortalized osteoblast-like UMR106-01 cells have PTH induced cAMP and IP3 responses, providing evidence for the functional KO of PKC signalling in response to PTH stimulation in the Gαq/11- KO osteoblasts (Figure 2A,B).

2.1.2. Body Weight, Mortality, and Serum Biochemistry

  • Body Weight:
At week 10, baseline body weight was similar in the eight subgroups of mice; mean body weight was 24.3 ± 2.3 g. Baseline serum calcium concentrations were increased in Gαq/11 KO compared to WT mice (2.62 ± 0.1 versus 2.37 ± 0.1 mmol/L; p < 0.0001), whereas serum creatinine, urea, albumin, and phosphate were comparable.
At time of sacrifice (week 24), body weight was not different in Gαq/11-KO as compared to WT mice, and not different in Gαq/11-KOCKD versus WTCKD mice. Gαq/11-KOHP and Gαq/11-KOCKD-HP had a lower body weight compared to respective WTHP and WTCKD-HP mice (p = 0.033 and p = 0.010). Thus, the genetic KO of Gαq/11 reduced body weight in the context of high phosphate diet, but not in mice with CKD and in mice with normal renal function on standard diet (Table 1).
  • Mortality:
Overall mortality rate was 20%: 10% in WT, 11% in WTHP mice, 30% in Gαq/11-KO, 20% in Gαq/11-KOHP mice, 17% in WTCKD, 11% in WTCKD-HP, 8% in Gαq/11-KOCKD, and 43% in Gαq/11-KOCKD-HP.
  • Biochemistry:
Serum biochemistry at sacrifice was comparable between groups, except for CKD animals, which developed a marked increase in serum creatinine, urea, and phosphate concentrations. Serum phosphate was also increased in the non-CKD WTHP and Gαq/11-KOHP mice compared to respective WT and Gαq/11-KO mice on standard diet (p = 0.003 and p = 0.02, respectively) (Table 1). Serum calcium was increased in Gαq/11-KOHP mice compared to respective WTHP mice (p < 0.001). CKD and high phosphate diet both induced hyperparathyroidism, especially in mice with combined CKD and high phosphate diet. Serum PTH was increased in CKD mice, with dietary phosphate load, and the combination of both by 4-, 2-, and 24-fold compared to controls, the genotype had no effect (Table 1).

2.1.3. Bone Morphology (µCT)

At week 24, femur length was similar in all groups (Table 2). CKD decreased femur cortical and trabecular total mineral density (TMD) in WT mice (p = 0.0002/0.001 for diaphyseal/metaphyseal cortical TMD and p = 0.05 for trabecular TMD). High phosphate diet in WT mice with normal renal function decreased trabecular TMD (p = 0.01/0.02). In WTCKD-HP mice cortical area but not TMD was increased compared to WT mice (p = 0.04 for diaphysis and p = 0.05 for metaphysis).
Mice with osteoblast Gαq/11-KO had decreased cortical TMD both in the diaphysis and metaphysis (p = 0.0004/p = 0.04), as well as a reduced cortical thickness in the diaphysis (p = 0.006) compared to WT mice (Figure 3, Table 2), while the Gαq/11-KO had no effect in CKD mice. In contrast, in CKD mice on high phosphate diet, the osteoblast Gαq/11-KO resulted in a lower diaphyseal and metaphyseal cortical thickness and area compared to WTCKD-HP mice (p = 0.0001/0.01/0.001/0.001); the trabecular number was lower and the trabecular spacing increased (p = 0.008/0.003). In non-CKD mice on high phosphate diet, the Gαq/11-KO mice decreased metaphyseal cortical area compared to WTHP mice (p = 0.04) (p = 0.006/0.05). Irrespective of the genotype, mice with CKD on high phosphate diet developed medullar and soft tissue ectopic calcifications.

2.1.4. Bone Planar Scintigraphy Analysis

At week 10, Gαq/11-KO mice (n = 35) had an increased tracer uptake activity compared to WT mice (p = 0.002; Table 3).
At week 22, WTCKD and WTCKD-HP mice had an increased osteoblast activity compared to WT controls (p < 0.0001/0.007). Gαq/11-KO did not modify tracer uptake in mice with normal renal functional and standard diet, but mitigated the CKD induced increase in tracer uptake in the Gαq/11-KOCKD mice compared to WTCKD mice (p = 0.049). In mice on high phosphate diet and the combination of high phosphate diet and CKD, the Gαq/11KO did not modify tracer uptake.

2.1.5. Bone Histomorphometry

Bone histomorphometric indices of the left femurs did not differ with genotype, CKD status, or the diet. Only in mice with CKD and high phosphate diet BV/TV was increased in WTCKD-HP and Gαq/11-KOCKD-HP compared to WT and Gαq/11-KO mice (p = 0.032 and p = 0.009, respectively). The number of bone trabecula was increased in WTCKD-HP as compared to WT mice (p = 0.02).
No statistically significant differences were found between WT and Gαq/11-KO mice with or without CKD in vertebra, but Gαq/11-KO mice tended to have higher values in formations parameters, i.e., osteoid parameters, osteoblast surface, and mineral apposition rate (Table 4).

3. Discussion

Chronic kidney disease is prevalent in the aging population, and on top of aging related loss of bone mass, CKD-MBD accelerates the loss of bone mass and strength, increases the risk of bone fracture rates, and results in physical disability [30]. Current therapeutic options are insufficient; hyperparathyroidism and hyperphosphatemia are prevalent [31,32]. A recent study demonstrated bone anabolic effects with selective PKC activation [24]. To assess the role of osteoblast PKC signaling in CKD and associated hyperphosphatemia, we now established a mouse model of osteoblast specific Gαq/11-KO. In these KO mice, PKA activation through PTH was maintained, while PKC activation was absent, as shown by the in vitro response of osteoblasts to PTH isolated from WT and Gαq/11-KO mice. These mice were exposed to CKD, high phosphate, and the combination of both. Femur bones were analyzed by micro-CT and planar scintigraphy, reflecting bone formation activity, and the vertebrae by quantitative histomorphometry.
Under physiological conditions, Gαq/11 KO mice developed a lower cortical TMD and a lower cortical thickness until 24 weeks of life, despite increased phosphate tracer uptake at 10 weeks of age, and comparable bone formation activity at week 22 of life. Due to technical shortcomings, dynamic histomorphometry was assessed in only four groups (four mice per group) and suggested a trend towards increased bone formation parameters in mice with Gαq/11-KO, which aligns with the scintigraphic findings at week 10. Gαq/11 KO increased bone formation and turnover, while the decreased cortical bone thickness and bone mineral density in CT suggests increased cortical bone resorption by osteoclasts. To prove this notion, a respective bone histology analysis is needed, however could not be accomplished in this study due to insufficient preservation of the bones.
Our results differ from previous studies in mice with osteoblast specific PKC KO, in which no difference in cortical and trabecular structures were found. However, we studied the mice at the age at 24 weeks and not young mice at 12 weeks of life as done in the previous study [29]. It was found that 10-week -old DSEL mice predominantly developed trabecular alterations and only minor cortical changes [28,33]. PKC activation in osteoblasts had been shown to decrease trabecular and cortical bone volume [25,26,34]. Intermittent administration of a PTH analog, which was recently identified to selectively activate PKC, led to an osteoanabolic effect [24]. We now demonstrate that PKC KO in osteoblasts decreases cortical bone thickness and mineral density.
In additions to previous studies, we now assessed the impact of Gαq/11-KO in mice with CKD. CKD increased bone tracer uptake, i.e., bone formation rate, a finding related to the associated and untreated hyperparathyroidism, which increases bone turn over in mice [35] and humans [36]. Consistent with this, cortical and trabecular bone TMD were decreased compared to WT control mice, which again was a finding in line with clinical findings in humans [37,38]. The Gαq/11-KO in CKD mice reduced tracer uptake on scintigraphy, i.e., bone formation rate, but none of the micro-CT derived bone parameters. In the presence of high phosphate intake, Gαq/11-KO, however, reduced cortical bone thickness, bons area, and trabecular bone number, i.e., further aggravated renal osteodystrophy of CKD. Of note, body weight and biochemical findings, including renal function parameters and serum PTH, did not differ between Gαq/11-KO and WT mice with CKD and high phosphate diet, indicating that the differences in bone morphology were specific to the functional changes caused by the Gαq/11-KO.
The deleterious effect of high phosphate intake on CKD-MBD and associated cardiovascular disease had repeatedly been demonstrated [39]. We now demonstrated that high phosphate intake worsened CKD-MBD induced renal osteodystrophy in case of osteoblast Gαq/11 KO. These mice developed pronounced hyperparathyroidism, increased serum calcium, and phosphate levels and consequently ectopic calcifications in bone marrow and soft tissues, i.e., a severe phenotype of CKD-MBD, known to be associated with poor prognosis in humans [40].
High phosphate diet also induced hyperparathyroidism in mice with normal renal function and a decrease in trabecular bone thickness and mineral density, untoward effects that were prevented by Gαq/11-KO in osteoblasts. Interestingly, in Gαq/11-KO mice the high phosphate diet even increased cortical thickness and mineral density.
Bone planar scintigraphy in CKD has limitations since knowledge on the impact of CKD on tracer bone uptake and elimination is limited. In humans, severe CKD leads to a decrease in scintigraphic tracer elimination, and uptake of the tracer in soft tissue, which may result in false estimates of bone disease. Late imaging has been proposed to solve this issue [41,42,43]. Still, bone radionuclide imaging has been shown in patients on dialysis to be correlated with histomorphometric dynamic parameters [44,45,46].
In summary, we demonstrated that osteoblast specific KO of Gαq/11-PKC signaling reduced bone mass and bone mineral density under physiological conditions. Renal osteodystrophy was aggravated in CKD mice with Gαq/11-KO together with high dietary phosphate intake, a condition frequently found in patients with CKD-MBD. Future studies should now address the putative therapeutic potential of specific modulation of specific osteoblast’s Gαq/11-protein signaling in mice with CKD and low and high phosphate diet, e.g., by novel PTH analog selectively activating PKC [24].

4. Materials and Methods

4.1. Mice

Male mice in a mixed C57BL6/N genetic background were used for the experiment. Animals were housed in standard conditions with individually ventilated, temperature-controlled cages (SealSafe 1291H, Tecniplast, Buguggiate, Italy) with environmental enrichment and 12 h light/dark cycle and ad libitum access to food and water. The osteoblast specific Gαq/11 knockout mice were generated by crossing global-deleted Gnα11 mice (Gnα11−/−) with Gnαq gene flanked with loxP (Gnαqfl/fl) mice provided by Professor S. Offermanns [47] with specific osteocalcine promoter-Cre mice (Oc-Cre+/−) provided by Professor T.L.Clemens [48].
Intercrosses resulted in the generation of osteoblast specific double knockout mice (KO): Oc-Cre+/−; Gnαqfl/fl; Gnα11−/−. Control mice (WT) used in this study had Oc−/−; Gnαqfl/fl and Gnα11+/+ genotype, respectively. Genomic DNA was isolated from the tails of the mice, according to the manufacturer’s instructions (Qiagen, Hilden, Germany) and the genetic background of the mice were assessed by standard PCR with specific primers and followed by electrophoresis. The presence or absence of Gnα11 allele was determined using the upstream primer 5’-AGC ATG CTG TAA GAC CGT AG-3’ and downstream primer 5’-GCC CCT TGT ACA GAT GGC AG-3’ or the upstream primer 5′-GAC TAG TGA GACGTG CTA CTT CC-3′ and downstream primer 5’-CAG GGG TAG GTG ATG ATT GTGC-3,’ respectively. The presence of Gnαqfl/fl was determined using the following primers 5’-GAC TAG TGA GACGTG CTA CTT CC-3’ and 5’- CAG GGG TAG GTG ATG ATT GTGC-3′. The presence or absence of the Oc-Cre transgene was determined with Cre-specific primers (5’-CAA ATA GCC CTG GCA GAT-3’ and 5’-TGA AAG GGA CAT CTT CC-3’).
q/11 KO and WT mice underwent a two-step 5/6 nephrectomy procedure to establish stable CKD (KOCKD and WTCKD) as previously described [35,49,50,51]. Briefly, at the age of 10 weeks cortical electrocautery was applied to the right kidney, 2 weeks later the left kidney was removed. All other animals underwent sham surgery. CKD mice with a serum urea below 15 mmol/L were excluded from subsequent analyses.
Animals were randomized to either standard diet (WT, KO, KOCKD, and WTCKD), or high phosphate diet (0.5 or 1% phosphate, both from Altromin, Lage, Germany) (WTHP, KOHP, KOCKD-HP, and WTCKD-HP). Each group included 7 to 12 animals according to the genotype, CKD status, and diet. Body weight was recorded weekly for all mice. Blood samples were taken and bone planar scintigraphies were performed prior to surgery at 10 weeks of age, and at the end of the experiment at 22 weeks of age. Bone μCT was performed ex-vivo. To assess bone formation, calcein (Sigma, Saint-Louis, MO, USA 20 mg/kg) was injected subcutaneously 7 days and demeclocyclin (Sigma, Saint-Louis, MO, USA 50 mg/kg) two days before sacrifice. All surgical and imaging procedures were performed under gaseous anesthesia (isoflurane 5% for induction followed by isoflurane 1.5 to 2% pushed by air), on a warmed table and in imaging cells, respectively. At 24 weeks of age, mice were anesthetized with ketamine/xylazine (100 mg/kg, 20 mg/kg) and blood was collected via cardiac puncture. Through the same puncture needle NaCl 0.9% was infused followed by 4% formaldehyde to perfuse and fix the organs. After dissection, femurs and vertebras were immersed in 4% formaldehyde. All animal experiments were performed according to the EU regulations for animal experimentation. The project was approved by local authorities (Regierungspräsidium Karlsruhe, Karlsruhe, Germany; Nr.35-9185.81 G-12/12).

4.2. Cells Cultures

Osteoblast-like cells were isolated from long bones of 6 weeks old male mice (n = 4). After removal of the muscle and soft tissue, the bones were washed with sterile PBS and cut longitudinally into 1 mm long fragments. The fragments were incubated in 6-well plates (Falcon) in αMEM Medium (Lonza, Verviers, Belgium) supplemented with 10% FBS (Lonza, Verviers, Belgium), 1% penicillin/streptomycin (Biochrom, Berlin, Germany), and 5 mM glutamin (Biochrom, Berlin, Germany) for 21 days (humidified incubator, 37 °C, 5% CO2) to allow cell outgrowth. Media was exchanged weekly. After reaching confluency, the cells were trypsinized and sub-cultured in 1:4 ratio. For immunostaining, cells were plated onto coverslips in 24 well plates. The commercial rat osteosarcoma cell line (UMR 106, American Type Culture Collection ATCC, Manassas, VA, RRID:CVCL 3617) was used as control.

4.3. Immunostaining

For immunostaining, cells were fixed in 4% paraformaldehyde (PFA) for 10 min at room temperature, permeabilized (0.1% TritonX in PBS) for 3 min, washed 2 times with PBS, and blocked (1% horse serum in PBS) for 30 min at room temperature.
Coverslips were incubated with anti-G protein alpha q/11 antibody (rabbit polyclonal, Abcam, 1/100 in PBS) overnight at 4 °C in a humified chamber. After three washing steps with PBS, secondary antibody (anti-rabbit, AlexaFluor 594, 1/1000 in PBS) was added for 1 h. If the second staining was performed, after washing with PBS, the slides were blocked again and incubated with PTHR1 antibody (mouse monoclonal, antibodies online, Aachen, Germany, 1/100 in PBS) for 1 h. After further washing steps, the secondary antibody was added for 1 h (anti-mouse, AlexaFluor 488, 1/1000). The coverslips were washed, mounted for immunofluorescence, and visualized with DMI 4000B microscope (Leica, Mannheim, Germany).

4.4. Cyclic AMP and IP3 Assay

The cells were plated on coverslips (Marienfeld, Lauda-Königshofen, Germany) in 24-well plates (Falcon) and grown for 24 h to sub-confluence in the αMEM Medium (Lonza, Verviers, Belgium). After an overnight starvation, cells were incubated with and without PTH1-34 (Bachem CA, USA) in serum-free medium for 15 min for determination of cellular cAMP and IP3. For cyclicAMP and IP3 quantification, ELISA were used (Direct cAMP ELISA kit, Enzo Life Sciences, INC. Famingdale, USA and IP3 ELISA kit, Antibodies online, Aachen, Germany) according to manufacturer’s instructions.

4.5. Blood Chemistry Analysis

Blood was sampled under anesthesia, at 10 weeks of age, by puncture of the mandibular vein (maximal blood volume 0.2 mL) and again at sacrifice by intracardiac puncture and transferred to heparinized tubes. After centrifugation (1500 G for 1 min, Statspin, IDEXX, Westbrock, CT, USA), plasma was aliquoted and analyzed either on the same day or frozen at −80 °C. Plasma urea, creatinine, calcium, albumin, and phosphate were measured using a veterinary analyzer based on dry-slides technologies (VetTest, IDEXX, Westbrock, CT, USA). Intact PTH was measured by ELISA (Mouse PTH 1-84 Elisa kit, Immunotopics international, San Diego, CA, USA).

4.6. Micro-CT Analysis

Right femurs were scanned using a GE Locus SP (GE Healthcare, Waukesha, USA). The specimens were immobilized using cotton gauze, immersed in an alcohol solution, and scanned using an X-ray tube voltage of 80 kVp and a tube current of 80 μA. An aluminum filter (0.05 mm) was used to adjust the energy distribution of the X-ray source. The reconstructed imaging volume was made of cubic voxels of 7 × 7 × 7 μm3. Visualization and analysis were performed using MicroView (v 2.2, GE Healthcare, Waukesha, WI, USA), bone measurements using the Advanced Bone module. The specimens were characterized further by building three-dimensional isosurface renderings, generated by the marching cubes method. Cortical parameters were determined at 1700 μm distance of the distal growth plate (in diaphysis) and right over the growth plate (in metaphysis) using a cylindric region of interest (ROI) of 300 × 300 × 300 μm3 on which an automatic cortical threshold was applied. For trabecular parameters, a manual ROI was drawn adjacent to the endocortical boundary, right over the distal growth plate and with an extension of 180 μm. Trabecular separation, thickness, and numbers were calculated using 3D calculations (sphere fitting method). The plate–rod characteristics were estimated by the structure model index (SMI), and anisotropy degree was defined by the length of the longest divided by the shortest mean intercept length. Bone density was assessed by tissue mineral density.

4.7. Bone Planar Scintigraphy Analysis

Bone scintigraphy analyses were performed at week 10, prior to the surgical interventions, and again at week 22, i.e., 2 weeks prior to sacrifice. Osteoblast activity was quantified by bone planar scintigraphy as described elsewhere [52]. Following the manufacturer’s recommendations and good practices, 134 ± 24 MBq of 99mTc-hydroxymethylene diphosphonate (HMDP) (CIS bio international, Gif-sur-Yvette, France) was prepared. The latter was administered under gaseous anesthesia through tail venous injection, after weighing animal. After 150 ± 53 min, pinhole whole-body acquisitions (15 min) with a window of 140 keV ± 10% were performed.

4.8. Histomorphometric Analysis

Decalcified left femurs were embedded in paraffin, and non-decalcified lumbar vertebrae were fixed, dehydrated, and embedded in methyl methacrylate. Longitudinal femur and transversal vertebra 8 µm-thick sections were obtained with a microtome (Polycut S, Leica, Heidelberg, Germany) and stained with a Goldner’s trichrome. ROI was selected from 250 to 1250 μm of the femur growth distal plate and analyzed together with all vertebrae. Identifications of osteoid and calcified tissue in vertebra were assessed using an automatic image analyzer (analyzer Morpho Expert, Explora Nova, La Rochelle, France) [53]. Dynamic parameter, i.e., mineral apposition rate was assessed from unstained 8 μm-thick sections examined under fluorescent light microscopy. Vertebra analysis was only performed in the four mice groups with standard diet.

4.9. Statistical Analysis

Results are expressed as mean ± standard deviation. Normality of the distribution was assessed by a Shapiro-Wilk test and a Q-Q plot. Gaussian continuous variables were analyzed using linear regression models including a three-way interaction between genotype, CKD, and diet. Comparisons between subgroups of interest (according to genotype but also influence of CKD, of diet, and the combination of CKD and diet) were performed using linear contrasts in the regression model. For non-gaussian variables we used Wilcoxon non-parametric test. Difference between groups were considered significant when p was <0.05. All the analyses were performed using R software. R Core Team. R: A language and environment for statistical computing. R Foundation for Statistical Computing, Vienna, Austria.

Author Contributions

Conceptualization: C.P.S., P.C., A.Z., F.S. (Franz Schaefer) and M.F.; methodology: C.P.S., A.Z., P.C. and M.F.; software: A.Z. and P.C.; validation: G.A.-K., A.S., A.Z., P.C., S.B. and G.B.; formal analysis: F.S. (François Severac), S.R., G.B., C.P.S. and A.Z.; investigation: A.Z., M.B., B.S., S.R., A.S. and C.H.; resources: U.H., F.S. (Franz Schaefer), C.P.S., P.C., A.S., G.B., J.B. and S.B., C.H.; data curation: A.Z. and P.C.; writing—original draft preparation: C.P.S., A.Z., writing—review and editing: C.P.S., P.C., G.B., G.A.-K., J.B. and M.B.; visualization: A.Z. and C.P.S.; supervision: P.C., C.P.S. and G.B. All authors have read and agreed to the published version of the manuscript.

Funding

For the publication fee we acknowledge financial support by Deutsche Forschungsgemeinschaft within the funding programme “Open Access Publikationskosten” as well as by Heidelberg University.

Institutional Review Board Statement

The animal study protocol was approved by the Institutional Review Board: Regierungspräsidium Karlsruhe, Germany; Nr.35-9185.81 G-12/12.

Informed Consent Statement

Not applicable.

Data Availability Statement

Data supporting reported results can be asked to the authors.

Acknowledgments

The authors gratefully acknowledge the help and expertise of the pharmacy technicians from the department of Pharmacy UF 6377 Radiopharmacy of Strasbourg’s University Hospitals.

Conflicts of Interest

The authors declare no conflict of interest.

References

  1. Drueke, T.B. Hyperparathyroidism in Chronic Kidney Disease. In Endotext; De Groot, L.J., Chrousos, G., Dungan, K., Feingold, K.R., Grossman, A., Hershman, J.M., Koch, C., Korbonits, M., McLachlan, R., New, M., et al., Eds.; MDText.com, Inc.: South Dartmouth, MA, USA, 2000. [Google Scholar]
  2. Hruska, K.A.; Choi, E.T.; Memon, I.; Davis, T.K.; Mathew, S. Cardiovascular risk in chronic kidney disease (CKD): The CKD-mineral bone disorder (CKD-MBD). Pediatr. Nephrol. 2010, 25, 769–778. [Google Scholar] [CrossRef] [PubMed] [Green Version]
  3. Hruska, K.A.; Sugatani, T.; Agapova, O.; Fang, Y. The chronic kidney disease—Mineral bone disorder (CKD-MBD): Advances in pathophysiology. Bone 2017, 100, 80–86. [Google Scholar] [CrossRef] [PubMed]
  4. Moe, S.; Drueke, T.; Cunningham, J.; Goodman, W.; Martin, K.; Olgaard, K.; Ott, S.; Sprague, S.; Lameire, N.; Eknoyan, G.; et al. Definition, evaluation, and classification of renal osteodystrophy: A position statement from Kidney Disease: Improving Global Outcomes (KDIGO). Kidney Int 2006, 69, 1945–1953. [Google Scholar] [CrossRef] [PubMed] [Green Version]
  5. Cozzolino, M.; Urena-Torres, P.; Vervloet, M.G.; Brandenburg, V.; Bover, J.; Goldsmith, D.; Larsson, T.E.; Massy, Z.A.; Mazzaferro, S.; CKD-MBD Working Group of ERA-EDTA. Is chronic kidney disease-mineral bone disorder (CKD-MBD) really a syndrome? Nephrol. Dial. Transpl. 2014, 29, 1815–1820. [Google Scholar] [CrossRef] [PubMed] [Green Version]
  6. Foley, R.N. Clinical epidemiology of cardiovascular disease in chronic kidney disease. J. Ren. Care 2010, 36 (Suppl. 1), 4–8. [Google Scholar] [CrossRef] [PubMed]
  7. Stevens, L.A.; Djurdjev, O.; Cardew, S.; Cameron, E.C.; Levin, A. Calcium, phosphate, and parathyroid hormone levels in combination and as a function of dialysis duration predict mortality: Evidence for the complexity of the association between mineral metabolism and outcomes. J. Am. Soc. Nephrol. 2004, 15, 770–779. [Google Scholar] [CrossRef] [PubMed] [Green Version]
  8. Bacchetta, J.; Harambat, J.; Cochat, P.; Salusky, I.B.; Wesseling-Perry, K. The consequences of chronic kidney disease on bone metabolism and growth in children. Nephrol. Dial. Transpl. 2012, 27, 3063–3071. [Google Scholar] [CrossRef] [Green Version]
  9. Ziolkowska, H.; Paniczyk-Tomaszewska, M.; Debinski, A.; Polowiec, Z.; Sawicki, A.; Sieniawska, M. Bone biopsy results and serum bone turnover parameters in uremic children. Acta Paediatr. 2000, 89, 666–671. [Google Scholar] [CrossRef]
  10. Denburg, M.R.; Kumar, J.; Jemielita, T.; Brooks, E.R.; Skversky, A.; Portale, A.A.; Salusky, I.B.; Warady, B.A.; Furth, S.L.; Leonard, M.B. Fracture Burden and Risk Factors in Childhood CKD: Results from the CKiD Cohort Study. J. Am. Soc. Nephrol. 2016, 27, 543–550. [Google Scholar] [CrossRef] [Green Version]
  11. Leonard, M.B. A structural approach to skeletal fragility in chronic kidney disease. Semin. Nephrol. 2009, 29, 133–143. [Google Scholar] [CrossRef] [Green Version]
  12. Drueke, T.B.; Massy, Z.A. Changing bone patterns with progression of chronic kidney disease. Kidney Int. 2016, 89, 289–302. [Google Scholar] [CrossRef] [PubMed] [Green Version]
  13. Palmer, S.C.; Mavridis, D.; Johnson, D.W.; Tonelli, M.; Ruospo, M.; Strippoli, G.F.M. Comparative Effectiveness of Calcimimetic Agents for Secondary Hyperparathyroidism in Adults: A Systematic Review and Network Meta-analysis. Am. J. Kidney Dis. 2020, 76, 321–330. [Google Scholar] [CrossRef] [PubMed]
  14. Bastepe, M.; Turan, S.; He, Q. Heterotrimeric G proteins in the control of parathyroid hormone actions. J. Mol. Endocrinol. 2017, 58, R203–R224. [Google Scholar] [CrossRef] [PubMed] [Green Version]
  15. Juppner, H.; Abou-Samra, A.B.; Freeman, M.; Kong, X.F.; Schipani, E.; Richards, J.; Kolakowski, L.F., Jr.; Hock, J.; Potts, J.T., Jr.; Kronenberg, H.M.; et al. A G protein-linked receptor for parathyroid hormone and parathyroid hormone-related peptide. Science 1991, 254, 1024–1026. [Google Scholar] [CrossRef]
  16. Cheloha, R.W.; Gellman, S.H.; Vilardaga, J.P.; Gardella, T.J. PTH receptor-1 signalling-mechanistic insights and therapeutic prospects. Nat. Rev. Endocrinol. 2015, 11, 712–724. [Google Scholar] [CrossRef] [Green Version]
  17. Swarthout, J.T.; D’Alonzo, R.C.; Selvamurugan, N.; Partridge, N.C. Parathyroid hormone-dependent signaling pathways regulating genes in bone cells. Gene 2002, 282, 1–17. [Google Scholar] [CrossRef]
  18. Hsiao, E.C.; Boudignon, B.M.; Chang, W.C.; Bencsik, M.; Peng, J.; Nguyen, T.D.; Manalac, C.; Halloran, B.P.; Conklin, B.R.; Nissenson, R.A. Osteoblast expression of an engineered Gs-coupled receptor dramatically increases bone mass. Proc. Natl. Acad. Sci. USA 2008, 105, 1209–1214. [Google Scholar] [CrossRef] [Green Version]
  19. Hsiao, E.C.; Boudignon, B.M.; Halloran, B.P.; Nissenson, R.A.; Conklin, B.R. Gs G protein-coupled receptor signaling in osteoblasts elicits age-dependent effects on bone formation. J. Bone Min. Res. 2010, 25, 584–593. [Google Scholar] [CrossRef] [Green Version]
  20. Kao, R.S.; Abbott, M.J.; Louie, A.; O’Carroll, D.; Lu, W.; Nissenson, R. Constitutive protein kinase A activity in osteocytes and late osteoblasts produces an anabolic effect on bone. Bone 2013, 55, 277–287. [Google Scholar] [CrossRef] [Green Version]
  21. Saggio, I.; Remoli, C.; Spica, E.; Cersosimo, S.; Sacchetti, B.; Robey, P.G.; Holmbeck, K.; Cumano, A.; Boyde, A.; Bianco, P.; et al. Constitutive expression of Gsalpha(R201C) in mice produces a heritable, direct replica of human fibrous dysplasia bone pathology and demonstrates its natural history. J. Bone Min. Res. 2014, 29, 2357–2368. [Google Scholar] [CrossRef] [Green Version]
  22. Weinstein, L.S.; Gejman, P.V.; Friedman, E.; Kadowaki, T.; Collins, R.M.; Gershon, E.S.; Spiegel, A.M. Mutations of the Gs alpha-subunit gene in Albright hereditary osteodystrophy detected by denaturing gradient gel electrophoresis. Proc. Natl. Acad. Sci. USA 1990, 87, 8287–8290. [Google Scholar] [CrossRef] [PubMed] [Green Version]
  23. Weinstein, L.S.; Shenker, A.; Gejman, P.V.; Merino, M.J.; Friedman, E.; Spiegel, A.M. Activating mutations of the stimulatory G protein in the McCune-Albright syndrome. N. Engl. J. Med. 1991, 325, 1688–1695. [Google Scholar] [CrossRef] [PubMed]
  24. He, Y.; Li, M.; Tong, G.; Meng, Y.; Hao, S.; Hu, S.; Yan, W.; Yang, D. hPTH(3-34)(29-34) selectively activated PKC and mimicked osteoanabolic effects of hPTH(1-34). Bone 2020, 135, 115326. [Google Scholar] [CrossRef] [PubMed]
  25. Dela Cruz, A.; Mattocks, M.; Sugamori, K.S.; Grynpas, M.D.; Mitchell, J. Reduced trabecular bone mass and strength in mice overexpressing Galpha11 protein in cells of the osteoblast lineage. Bone 2014, 59, 211–222. [Google Scholar] [CrossRef]
  26. Ogata, N.; Kawaguchi, H.; Chung, U.I.; Roth, S.I.; Segre, G.V. Continuous activation of G alpha q in osteoblasts results in osteopenia through impaired osteoblast differentiation. J. Biol. Chem. 2007, 282, 35757–35764. [Google Scholar] [CrossRef] [Green Version]
  27. Guo, J.; Chung, U.I.; Kondo, H.; Bringhurst, F.R.; Kronenberg, H.M. The PTH/PTHrP receptor can delay chondrocyte hypertrophy in vivo without activating phospholipase C. Dev. Cell 2002, 3, 183–194. [Google Scholar] [CrossRef] [Green Version]
  28. Guo, J.; Liu, M.; Yang, D.; Bouxsein, M.L.; Thomas, C.C.; Schipani, E.; Bringhurst, F.R.; Kronenberg, H.M. Phospholipase C signaling via the parathyroid hormone (PTH)/PTH-related peptide receptor is essential for normal bone responses to PTH. Endocrinology 2010, 151, 3502–3513. [Google Scholar] [CrossRef] [Green Version]
  29. Ogata, N.; Shinoda, Y.; Wettschureck, N.; Offermanns, S.; Takeda, S.; Nakamura, K.; Segre, G.V.; Chung, U.I.; Kawaguchi, H. G alpha(q) signal in osteoblasts is inhibitory to the osteoanabolic action of parathyroid hormone. J. Biol. Chem. 2011, 286, 13733–13740. [Google Scholar] [CrossRef] [Green Version]
  30. Cohen-Solal, M.; Funck-Brentano, T.; Ureña Torres, P. Bone fragility in patients with chronic kidney disease. Endocr. Connect. 2020, 9, R93–R101. [Google Scholar] [CrossRef] [Green Version]
  31. Borzych, D.; Rees, L.; Ha, I.S.; Chua, A.; Valles, P.G.; Lipka, M.; Zambrano, P.; Ahlenstiel, T.; Bakkaloglu, S.A.; Spizzirri, A.P.; et al. The bone and mineral disorder of children undergoing chronic peritoneal dialysis. Kidney Int. 2010, 78, 1295–1304. [Google Scholar] [CrossRef] [Green Version]
  32. Rastogi, A.; Bhatt, N.; Rossetti, S.; Beto, J. Management of Hyperphosphatemia in End-Stage Renal Disease: A New Paradigm. J. Ren. Nutr. 2021, 31, 21–34. [Google Scholar] [CrossRef] [PubMed]
  33. Guo, J.; Liu, M.; Yang, D.; Bouxsein, M.L.; Saito, H.; Galvin, R.J.; Kuhstoss, S.A.; Thomas, C.C.; Schipani, E.; Baron, R.; et al. Suppression of Wnt signaling by Dkk1 attenuates PTH-mediated stromal cell response and new bone formation. Cell Metab. 2010, 11, 161–171. [Google Scholar] [CrossRef] [PubMed] [Green Version]
  34. Dela Cruz, A.; Grynpas, M.D.; Mitchell, J. Elevated Galpha11 expression in osteoblast lineage cells promotes osteoclastogenesis and leads to enhanced trabecular bone accrual in response to pamidronate. Am. J. Physiol. Endocrinol. Metab. 2016, 310, E811–E820. [Google Scholar] [CrossRef] [PubMed] [Green Version]
  35. Nikolov, I.G.; Joki, N.; Nguyen-Khoa, T.; Ivanovski, O.; Phan, O.; Lacour, B.; Drueke, T.B.; Massy, Z.A.; Dos Reis, L.M.; Jorgetti, V.; et al. Chronic kidney disease bone and mineral disorder (CKD-MBD) in apolipoprotein E-deficient mice with chronic renal failure. Bone 2010, 47, 156–163. [Google Scholar] [CrossRef] [PubMed]
  36. Mac Way, F.; Lessard, M.; Lafage-Proust, M.H. Pathophysiology of chronic kidney disease-mineral and bone disorder. Jt. Bone Spine 2012, 79, 544–549. [Google Scholar] [CrossRef] [PubMed]
  37. Aleksova, J.; Ng, K.W.; Jung, C.; Zeimer, H.; Dwyer, K.M.; Milat, F.; MacIsaac, R.J. Bone health in chronic kidney disease-mineral and bone disorder: A clinical case seminar and update. Intern. Med. J. 2018, 48, 1435–1446. [Google Scholar] [CrossRef]
  38. Babayev, R.; Nickolas, T.L. Can one evaluate bone disease in chronic kidney disease without a biopsy? Curr. Opin. Nephrol. Hypertens. 2014, 23, 431–437. [Google Scholar] [CrossRef]
  39. Bacchetta, J.; Bernardor, J.; Garnier, C.; Naud, C.; Ranchin, B. Hyperphosphatemia and Chronic Kidney Disease: A Major Daily Concern Both in Adults and in Children. Calcif. Tissue Int. 2021, 108, 116–127. [Google Scholar] [CrossRef]
  40. Iseri, K.; Dai, L.; Chen, Z.; Qureshi, A.R.; Brismar, T.B.; Stenvinkel, P.; Lindholm, B. Bone mineral density and mortality in end-stage renal disease patients. Clin. Kidney J. 2020, 13, 307–321. [Google Scholar] [CrossRef]
  41. de Jonge, F.A.; Pauwels, E.K.; Hamdy, N.A. Scintigraphy in the clinical evaluation of disorders of mineral and skeletal metabolism in renal failure. Eur. J. Nucl. Med. 1991, 18, 839–855. [Google Scholar] [CrossRef]
  42. Fogelman, I.; Bessent, R.G.; Turner, J.G.; Citrin, D.L.; Boyle, I.T.; Greig, W.R. The use of whole-body retention of Tc-99m diphosphonate in the diagnosis of metabolic bone disease. J. Nucl. Med. 1978, 19, 270–275. [Google Scholar] [PubMed]
  43. Park-Holohan, S.J.; Blake, G.M.; Fogelman, I. Quantitative studies of bone using (18)F-fluoride and (99m)Tc-methylene diphosphonate: Evaluation of renal and whole-blood kinetics. Nucl. Med. Commun. 2001, 22, 1037–1044. [Google Scholar] [CrossRef] [PubMed]
  44. Enevoldsen, L.H.; Heaf, J.; Hojgaard, L.; Zerahn, B.; Hasbak, P. Increased technetium-99 m hydroxy diphosphonate soft tissue uptake on bone scintigraphy in chronic kidney disease patients with secondary hyperparathyroidism: Correlation with hyperphosphataemia. Clin. Physiol. Funct. Imaging 2017, 37, 131–136. [Google Scholar] [CrossRef] [PubMed]
  45. Frost, M.L.; Compston, J.E.; Goldsmith, D.; Moore, A.E.; Blake, G.M.; Siddique, M.; Skingle, L.; Fogelman, I. (18)F-fluoride positron emission tomography measurements of regional bone formation in hemodialysis patients with suspected adynamic bone disease. Calcif. Tissue Int. 2013, 93, 436–447. [Google Scholar] [CrossRef] [Green Version]
  46. Messa, C.; Goodman, W.G.; Hoh, C.K.; Choi, Y.; Nissenson, A.R.; Salusky, I.B.; Phelps, M.E.; Hawkins, R.A. Bone metabolic activity measured with positron emission tomography and [18F]fluoride ion in renal osteodystrophy: Correlation with bone histomorphometry. J. Clin. Endocrinol. Metab. 1993, 77, 949–955. [Google Scholar]
  47. Wettschureck, N.; Rutten, H.; Zywietz, A.; Gehring, D.; Wilkie, T.M.; Chen, J.; Chien, K.R.; Offermanns, S. Absence of pressure overload induced myocardial hypertrophy after conditional inactivation of Galphaq/Galpha11 in cardiomyocytes. Nat. Med. 2001, 7, 1236–1240. [Google Scholar] [CrossRef]
  48. Zhang, M.; Xuan, S.; Bouxsein, M.L.; von Stechow, D.; Akeno, N.; Faugere, M.C.; Malluche, H.; Zhao, G.; Rosen, C.J.; Efstratiadis, A.; et al. Osteoblast-specific knockout of the insulin-like growth factor (IGF) receptor gene reveals an essential role of IGF signaling in bone matrix mineralization. J. Biol. Chem. 2002, 277, 44005–44012. [Google Scholar] [CrossRef] [Green Version]
  49. Davies, M.R.; Lund, R.J.; Mathew, S.; Hruska, K.A. Low turnover osteodystrophy and vascular calcification are amenable to skeletal anabolism in an animal model of chronic kidney disease and the metabolic syndrome. J. Am. Soc. Nephrol. 2005, 16, 917–928. [Google Scholar] [CrossRef] [Green Version]
  50. Nikolov, I.G.; Joki, N.; Nguyen-Khoa, T.; Guerrera, I.C.; Maizel, J.; Benchitrit, J.; Machado dos Reis, L.; Edelman, A.; Lacour, B.; Jorgetti, V.; et al. Lanthanum carbonate, like sevelamer-HCl, retards the progression of vascular calcification and atherosclerosis in uremic apolipoprotein E-deficient mice. Nephrol. Dial. Transpl. 2012, 27, 505–513. [Google Scholar] [CrossRef]
  51. Gagnon, R.F.; Gallimore, B. Characterization of a mouse model of chronic uremia. Urol. Res. 1988, 16, 119–126. [Google Scholar] [CrossRef]
  52. Zaloszyc, A.; Schmitt, C.P.; Sayeh, A.; Higel, L.; Gros, C.I.; Bornert, F.; Aubertin-Kirch, G.; Dillenseger, J.P.; Goetz, C.; Constantinesco, A.; et al. Frequent, quantitative bone planar scintigraphy for determination of bone anabolism in growing mice. PeerJ 2021, 9, e12355. [Google Scholar] [CrossRef] [PubMed]
  53. Parfitt, A.M.; Drezner, M.K.; Glorieux, F.H.; Kanis, J.A.; Malluche, H.; Meunier, P.J.; Ott, S.M.; Recker, R.R. Bone histomorphometry: Standardization of nomenclature, symbols, and units. Report of the ASBMR Histomorphometry Nomenclature Committee. J. Bone Min. Res. 1987, 2, 595–610. [Google Scholar] [CrossRef] [PubMed]
Figure 1. Immunostaining of PTH1R and Gαq/11. Osteoblasts isolated from bone of wild type mice (left figure) and from bone of Gαq/11 knockout mice incubated with PTH1-34 for one hour, were stained for PTH1R (green) and Gαq/11 protein (i red). On the right, osteoblasts from Gαq/11 -KO mice express PTH1R but not Gαq/11. Total magnification: ×630.
Ijms 23 06404 g001
Figure 2. (A) cAMP and (B) IP3 response to PTH1-34 in WT, in Gαq/11 knockout osteoblasts and in immortalized UMR osteoblasts WT and Gαq/11-KO osteoblasts and UMR osteoblasts were stimulated with PTH 1-34 for 15 min and cellular cAMP and IP3 response was quantified. While PKA mediated cAMP response was still present in the Gαq/11-KO osteoblasts, the Gαq/11/PKC mediated induction of IP3 was abolished in the Gαq/11-KO osteoblasts.KO = Gαq/11 knockout osteoblasts; WT = wild type osteoblasts; UMR = immortalized osteoblast-like UMR106-01 cells; +PTH = incubation with PTH1-34.
Ijms 23 06404 g002
Figure 3. Micro-CT views of mouse femurs (WT on the left and KO on the right) in 3 perpendicular planes of section. A yellow ROI placed on the magnified long axis section delineates the area in which cortical thickness was measured. Cortical thickness was decreased in Gαq/11-KO mice compared to WT mice at Week 24.
Ijms 23 06404 g003
Table 1. Body weight and serum biochemistry in the eight groups of mice at time of sacrifice (week 24). Comparisons were performed according to the genotype, the influence of CKD, of the diet, and the combination of CKD and diet. Mean values and standard deviations are given, superscripts indicate significant difference to the indicated group, findings in Gαq/11-KO mice significantly different to respective WT mice are given in bold (p < 0.05). WT = Wild type mice, KO = Gαq/11 knockout mice, WTCKD = wild type mice with CKD, KOCKD = Gαq/11 knockout mice with CKD, WTHP = wild type mice with high phosphate diet, KOHP = Gαq/11 knockout mice with high phosphate diet, WTCKD-HP = wild type mice with CKD and high phosphate diet, KOCKD-HP = Gαq/11 knockout mice with CKD and high phosphate diet.
WT aKO bWTCKD cKOCKD dWTHP eKOHP fWTCKD-HP gKOCKD-HP
Body weight (g)30.6 ± 2.629.3 ± 2.127.4 ± 1.628.7 ± 2.233.2 ± 2.8 a30.7 ± 3.4 e28.6 ± 2.125.0 ± 2.7 b,g
Creatinine (g/L)0.70 ± 0.30.73 ± 0.22.01 ± 0.7 a2.67 ± 0.9 b1.08 ± 0.30.95 ± 0.33.06 ± 0.7 a2.69 ± 0.7 b
Urea (mmol/L)7.0 ± 0.66.9 ± 1.121.9 ± 3.1 a24.9 ± 6.4 b7.0 ± 1.07.7 ± 2.216.3 ± 2.3 a17.7 ± 3.0 b
Albumine (g/L)22.9 ± 2.120.6 ± 2.121.2 ± 2.621.5 ± 2.920.5 ± 4.420.1 ± 3.022.8 ± 2.221.9 ± 2.5
Calcium (mmol/L)2.36 ± 0.12.37 ± 0.12.53 ± 0.12.64 ± 0.04 b2.10 ± 0.3 a2.42 ± 0.2 e2.57 ± 0.2 a2.64 ± 0.2 b
Phosphate (mmol/L)0.98 ± 0.21.03 ± 0.11.35 ± 0.3 a1.41 ± 0.4 b1.78 ± 0.3 a1.67 ± 0.2 b1.62 ± 0.08 a1.99 ± 0.5 b
PTH (ng/L)54 ± 3770 ± 25106 ± 95173 ± 108 b229 ± 155 a293 ± 170 b1907 ± 1099 a1687 ± 789.1 b
Table 2. Bone parameters of right femurs extracted from micro-CT acquisitions ex vivo. Comparisons were performed according to the genotype, the influence of CKD, of the diet, and the combination of CKD and diet. Superscript symbols indicate significant difference to the corresponding group (p < 0.05), findings in Gαq/11 KO mice significantly different to respective WT mice are given in bold. WT = wild type mice, KO = Gαq/11 knockout mice, WTCKD = wild type mice with CKD, KOCKD = Gαq/11 knockout mice with CKD, WTHP = wild type mice with high phosphate diet, KOHP = Gαq/11 knockout mice with high phosphate diet, WTCKD-HP = wild type mice with CKD and high phosphate diet, KOCKD-HP = Gαq/11 knockout mice with CKD and high phosphate diet, Ct = cortical, TMD = total mineral density, Th = thickness, Ar = area, BV = bone volume, TV = total volume, Tb = trabecular, N = number, Sp = spacing, DA = degree of anisotropy, SMI = structure model index.
WT aKO bWTCKD cKOCKD dWTHP eKOHP fWTCKD-HP gKOCKD-HP
n = 6n = 10n = 9n = 6n = 8n = 10n = 7n = 9
Femoral length (mm)16.0 ± 0.2 15.9± 0.315.9 ± 0.216.1 ± 0.3 16.1 ± 0.2 15.8 ± 0.3 16.2 ± 0.1 15.7 ± 0.3
Cortical parameters (Diaphysis)
Ct.TMD (mg/cc)1269 ± 621144 ± 79 a1131 ± 47 a1159 ± 371202 ± 611202 ± 49 b1214 ± 941174 ± 70
Ct.Th (μm)197 ± 141179 ± 15 a191 ± 12183 ± 13195 ± 10194 ± 17 b209 ± 105179 ± 16 g
Ct.Ar (mm2)0.83 ± 0.060.77 ± 0.060.79 ± 0.040.80 ± 0.080.85 ± 0.060.82 ± 0.060.90 ± 0.07 a0.73 ± 0.09 g
Cortical parameters (Metaphysis)
Ct.TMD (mg/cc)1142 ± 421059 ± 59 a993 ± 70 a1031 ± 481089 ± 601091 ± 271029 ± 122 a1067 ± 75
Ct.Th (μm)158 ± 12141 ± 17159 ± 14146 ± 5171 ± 16156 ± 17169 ± 17148 ± 29 g
Ct.Ar (mm2)0.76 ± 0.050.72 ± 0.070.80 ± 0.040.73 ± 0.030.89 ± 0.06 a0.80 ± 0.06 e0.86 ± 0.12 a0.72 ± 0.16 g
Trabecular parameters
Tb TMD (mg/cc)765 ± 76733 ± 90690 ± 49 a712 ± 37679 ± 54 a7116 ± 41729 ± 102754 ± 61
BV/TV (%)9.1 ± 1.610.3 ± 2.79.6 ± 1.911.6 ± 2.67.6 ± 1.97.9 ± 1.79.5 ± 3.07.8 ± 4.4
Tb.Th (μm)28.1 ± 3.127.4 ± 3.125.4 ± 2.228.4 ± 3.023.3 ± 3.6 a25.0 ± 2.326.2 ± 4.627.9 ± 4.9
Tb.N (/mm)3.2 ± 0.33.7 ± 0.83.8 ± 0.84.1 ± 0.63.3 ± 0.73.2 ± 0.53.7 ± 112.6 ± 1.0 b,g
Tb.Sp (μm)283 ± 29256 ± 62248 ± 54221 ± 38295 ± 66298 ± 51272 ± 103394 ± 143 b,g
DA1.20 ± 0.061.30 ± 0.151.15 ± 0.071.26 ± 0.101.18 ± 0.061.20 ± 0.061.22 ± 0.111.21 ± 0.06
SMI2.32 ± 0.182.00 ± 0.312.46 ± 0.212.12 ± 0.632.77 ± 0.48 a2.43 ± 0.26 b2.49 ± 0.582.36 ± 0.31
Table 3. Bone scintigraphic index at week 10 and 22. Comparisons were performed according to the genotype, the influence of CKD, of the diet, and the combination of CKD and diet. Superscript symbols indicate significant difference to the corresponding group, findings in Gαq/11 KO mice significantly different to respective WT mice are given in bold (p < 0.05). WT = wild type mice, KO = Gαq/11 knockout mice, WTCKD = wild type mice with CKD, KOCKD = Gαq/11 knockout mice with CKD, WTHP = wild type mice with high phosphate diet, KOHP = Gαq/11 knockout mice with high phosphate diet, WTCKD-HP = wild type mice with CKD and high phosphate diet, KOCKD-HP = Gαq/11 knockout mice with CKD and high phosphate diet.
Scintigraphic Index at Week 10 (Counts·s−1·Pixel−1·MBq−1·g−1 × 10⁵)Scintigraphic Index at Week 22 (Counts·s−1·Pixel−1·MBq−1·g−1 × 10⁵)
WT a11.75 ± 0.61 (n = 33)6.47 ± 1.55 (n = 9)
KO b14.80 ± 0.70 (n = 35) a16.19 ± 1.63 (n = 7)
WTCKD c 6.28 ± 0.83 (n = 13) a
KOCKD d 12.10 ± 1.19 (n = 10) b,c
WTHP e 5.31 ± 1.46 (n = 6)
KOHP f 12.00 ± 2.19 (n = 8)
WTCKD-HP g 5.60 ± 0.74 (n = 7) a
KOCKD-HP h 10.11 ± 1.52 (n = 9) b
Table 4. Bone parameters from non-decalcified lumbar vertebrae. WT = wild type mice, KO = Gαq/11 knockout mice, WTCKD = wild type mice with CKD, KOCKD = Gαq/11 knockout mice with CKD, BV/TV = bone volume/tissue volume, BS/BV = bone surface/bone volume, OV/BV = osteoid volume/bone volume, OS/BS = osteoid surface/bone surface, Ob.S/BS = osteoblast surface per bone surface), MAR = mineral apposition rate. n = four mice per group; Superscript symbols indicate significant difference to corresponding group, findings in Gαq/11-KO mice significantly different to respective WT mice are given in bold (p < 0.05).
WTKOWTCKDKOCKD
BV/TV(%)26.9 ± 5.524.7 ± 4.225.9 ± 3.232.2 ± 14.6
BS/BV(%)4.0 ± 0.44.8 ± 0.53.8 ± 0.63.6 ± 1.2
Trabecular Thickness (µm)50.2 ± 5.142.0 ± 4.454.1 ± 7.463.3 ± 30.3
Trabecular Number5.3 ± 0.75.9 ± 0.54.9 ± 0.95.1 ± 0.7
Trabecular Separation (µm)139.0 ± 28.0139.4 ± 28.0157.9 ± 38.9134.4 ± 38.8
OV/BV (%)2.8 ± 1.74.6 ± 1.43.1 ± 2.44.2 ± 1.4
OS/BS(%)11.1 ± 4.222.1 ± 9.514.8 ± 7.418.7 ± 3.8
Ob.S/BS (%)23.0 ± 3.031.9 ± 8.620.8 ± 11.529.5 ± 5.5
MAR (µm/d)1.7 ± 0.32.1 ± 0.41.5 ± 0.31.6 ± 0.4
Mineralizing Surface (%)7.0 ± 3.012.9 ± 6.64.1 ± 3.68.5 ± 3.3
Publisher’s Note: MDPI stays neutral with regard to jurisdictional claims in published maps and institutional affiliations.

