Article

Comparative Transcriptome Analysis Reveals That WSSV IE1 Protein Plays a Crucial Role in DNA Replication Control

Institute of Marine Sciences and Guangdong Provincial Key Laboratory of Marine Biotechnology, Shantou University, Shantou 515063, China
*
Author to whom correspondence should be addressed.
These authors contributed equally to this work.
Int. J. Mol. Sci. 2022, 23(15), 8176; https://doi.org/10.3390/ijms23158176
Submission received: 17 June 2022 / Revised: 19 July 2022 / Accepted: 22 July 2022 / Published: 25 July 2022
(This article belongs to the Section Molecular Microbiology)

Abstract

:
For DNA viruses, the immediate-early (IE) proteins are generally essential regulators that manipulate the host machinery to support viral replication. Recently, IE1, an IE protein encoded by white spot syndrome virus (WSSV), has been demonstrated to function as a transcription factor. However, the target genes of IE1 during viral infection remain poorly understood. Here, we explored the host target genes of IE1 using RNAi coupled with transcriptome sequencing analysis. A total of 429 differentially expressed genes (DEGs) were identified from penaeid shrimp, of which 284 genes were upregulated and 145 genes were downregulated after IE1 knockdown. GO and KEGG pathway enrichment analysis revealed the identified DEGs are significantly enriched in the minichromosome maintenance (MCM) complex and DNA replication, indicating that IE1 plays a critical role in DNA replication control. In addition, it was found that Penaeus vannamei MCM complex genes were remarkably upregulated after WSSV infection, while RNAi-mediated knockdown of PvMCM2 reduced the expression of viral genes and viral loads at the early infection stage. Finally, we demonstrated that overexpression of IE1 promoted the expression of MCM complex genes as well as cellular DNA synthesis in insect High-Five cells. Collectively, our current data suggest that the WSSV IE1 protein is a viral effector that modulates the host DNA replication machinery for viral replication.

1. Introduction

White spot syndrome virus (WSSV) is a large, rod-shaped, enveloped, and double-stranded circular DNA virus that belongs to the genus Whispovirus in the family Nimaviridae [1]. It infects a wide range of economic crustaceans such as shrimp, crayfish, lobster, and crab. Although WSSV has a broad host range, it exhibits the strongest pathogenicity and virulence in penaeid shrimp and causes a cumulative mortality of up to 100% within 10 days after the onset of disease in cultured shrimp [2]. First occurring in 1992, WSSV has emerged as a major pathogen that affects shrimp sustainable production worldwide. Over the past three decades, considerable progress has been made in elucidating the biology and pathogenesis of WSSV (i.e., virion genome and proteome, and viral entry and replication mechanisms) [3,4,5,6], as well as the host innate immunity against the virus (i.e., humoral and cellular immunity) [7,8]. However, there are currently no effective treatment strategies to prevent and control the rapid spread and outbreak of the viral disease. Therefore, this underscores the need for exploring the mechanisms of the WSSV–host interactions, which may contribute to new therapeutic avenues for controlling this viral disease in shrimp aquaculture.
As a DNA virus, WSSV genes are expressed following three temporal phases: immediate-early (IE), early (E), and late (L) [9]. IE genes are the first class of viral genes expressed after primary infection or reactivation of latent infection. They solely utilize the host cellular transcription and translation machinery for expression, but do not depend on any de novo synthesized viral proteins. An increasing number of studies have shown that the IE genes’ encoded products are generally regulatory proteins that initiate viral replication and/or modulate cellular functions to aid viral replication [10,11,12]. Hence, functional analysis of IE proteins is believed to be critical for understanding the virus–host interactions. Thus far, twenty-one IE genes have been identified from the WSSV genome [13,14,15]. One of WSSV IE genes, IE1, has attracted the most attention in the past decade. It has been shown that the IE1 gene has a strong promoter activity and maintains a high expression level throughout the virus life cycle [15]. The reason for this may be that IE1 could hijack various host transcription factors (e.g., STAT, NF-κB, AP-1, kruppel-like factor, YY1, etc.) to enhance its expression [16,17,18,19,20,21]. On the other hand, the biological functions of the IE1 protein have been extensively studied recently. For instance, IE1 was demonstrated to act as a transcription factor with transactivation, dimerization, and DNA-binding activity [22]. Moreover, several studies reported that IE1 could bind to many host cellular proteins such as the retinoblastoma protein (Rb) [23], STAT [19], JNK [18], β-catenin [24], Chibby [25], and prophenoloxidase (proPO) [26], thereby hijacking cellular functions or suppressing the host immunity to promote virus multiplication. The foregoing data indicate that IE1 is a multifunctional regulator that is critical for WSSV pathogenesis.
The whiteleg shrimp, Penaeus vannamei, is one of the most commonly farmed shrimp species around the world, which accounts for more than 80% of the global shrimp production. In the present study, we used P. vannamei as a model to explore the host target genes of IE1 during WSSV infection using RNAi coupled with high-throughput RNA sequencing (RNA-Seq). A total of 429 differentially expressed genes (DEGs) after IE1 knockdown were identified in WSSV-challenged shrimp. Bioinformatic analysis showed that the identified DEGs are mainly enriched in minichromosome maintenance (MCM) complex and DNA replication. In addition, we demonstrated that P. vannamei MCM complex genes were upregulated upon WSSV infection, while knockdown of PvMCM2 suppressed the viral genes’ expression and viral replication at the early infection stage. Moreover, we found that overexpression of IE1 promoted the expression of MCM complex genes and cellular DNA synthesis in High-Five cells. Our current data reveal that IE1 is a viral effector involved in DNA replication control, which provides novel insight into the virus–host interactions.

2. Results

2.1. De Novo Assembly and Unigene Annotation

In this study, we applied RNAi and RNA-seq techniques to explore the target genes of IE1 during WSSV infection. As shown in Figure 1A, shrimp were separately injected with the dsRNA-IE1 and the control dsRNA-EGFP, followed by WSSV challenge. The qPCR and Western blot results showed that IE1 expression significantly decreased in dsRNA-IE1-injected shrimp compared with the control dsRNA-EGFP group (Figure 1B,C), indicating a successful knockdown of IE1 during virus infection. For transcriptome sequencing, three biological replicates per group were prepared and used for RNA extraction and Illumina sequencing. As shown in Table S1, a total of 259,589,838 raw reads were generated from the above six cDNA libraries, and 254,552,182 clean reads were obtained after quality control. Next, the clean reads were mapped to P. vannamei genome, which led to the identification of a total of 18,652 unigenes and 24,404 transcripts, respectively. Finally, the unigenes/transcripts were searched against six functional databases, NR, Swiss-Prot, Pfam, COG, GO, and KEGG. The result showed that a total of 15,794 unigenes and 21,077 transcripts were annotated, which represented about 84.68% and 86.37% of the total, respectively (Table S2).

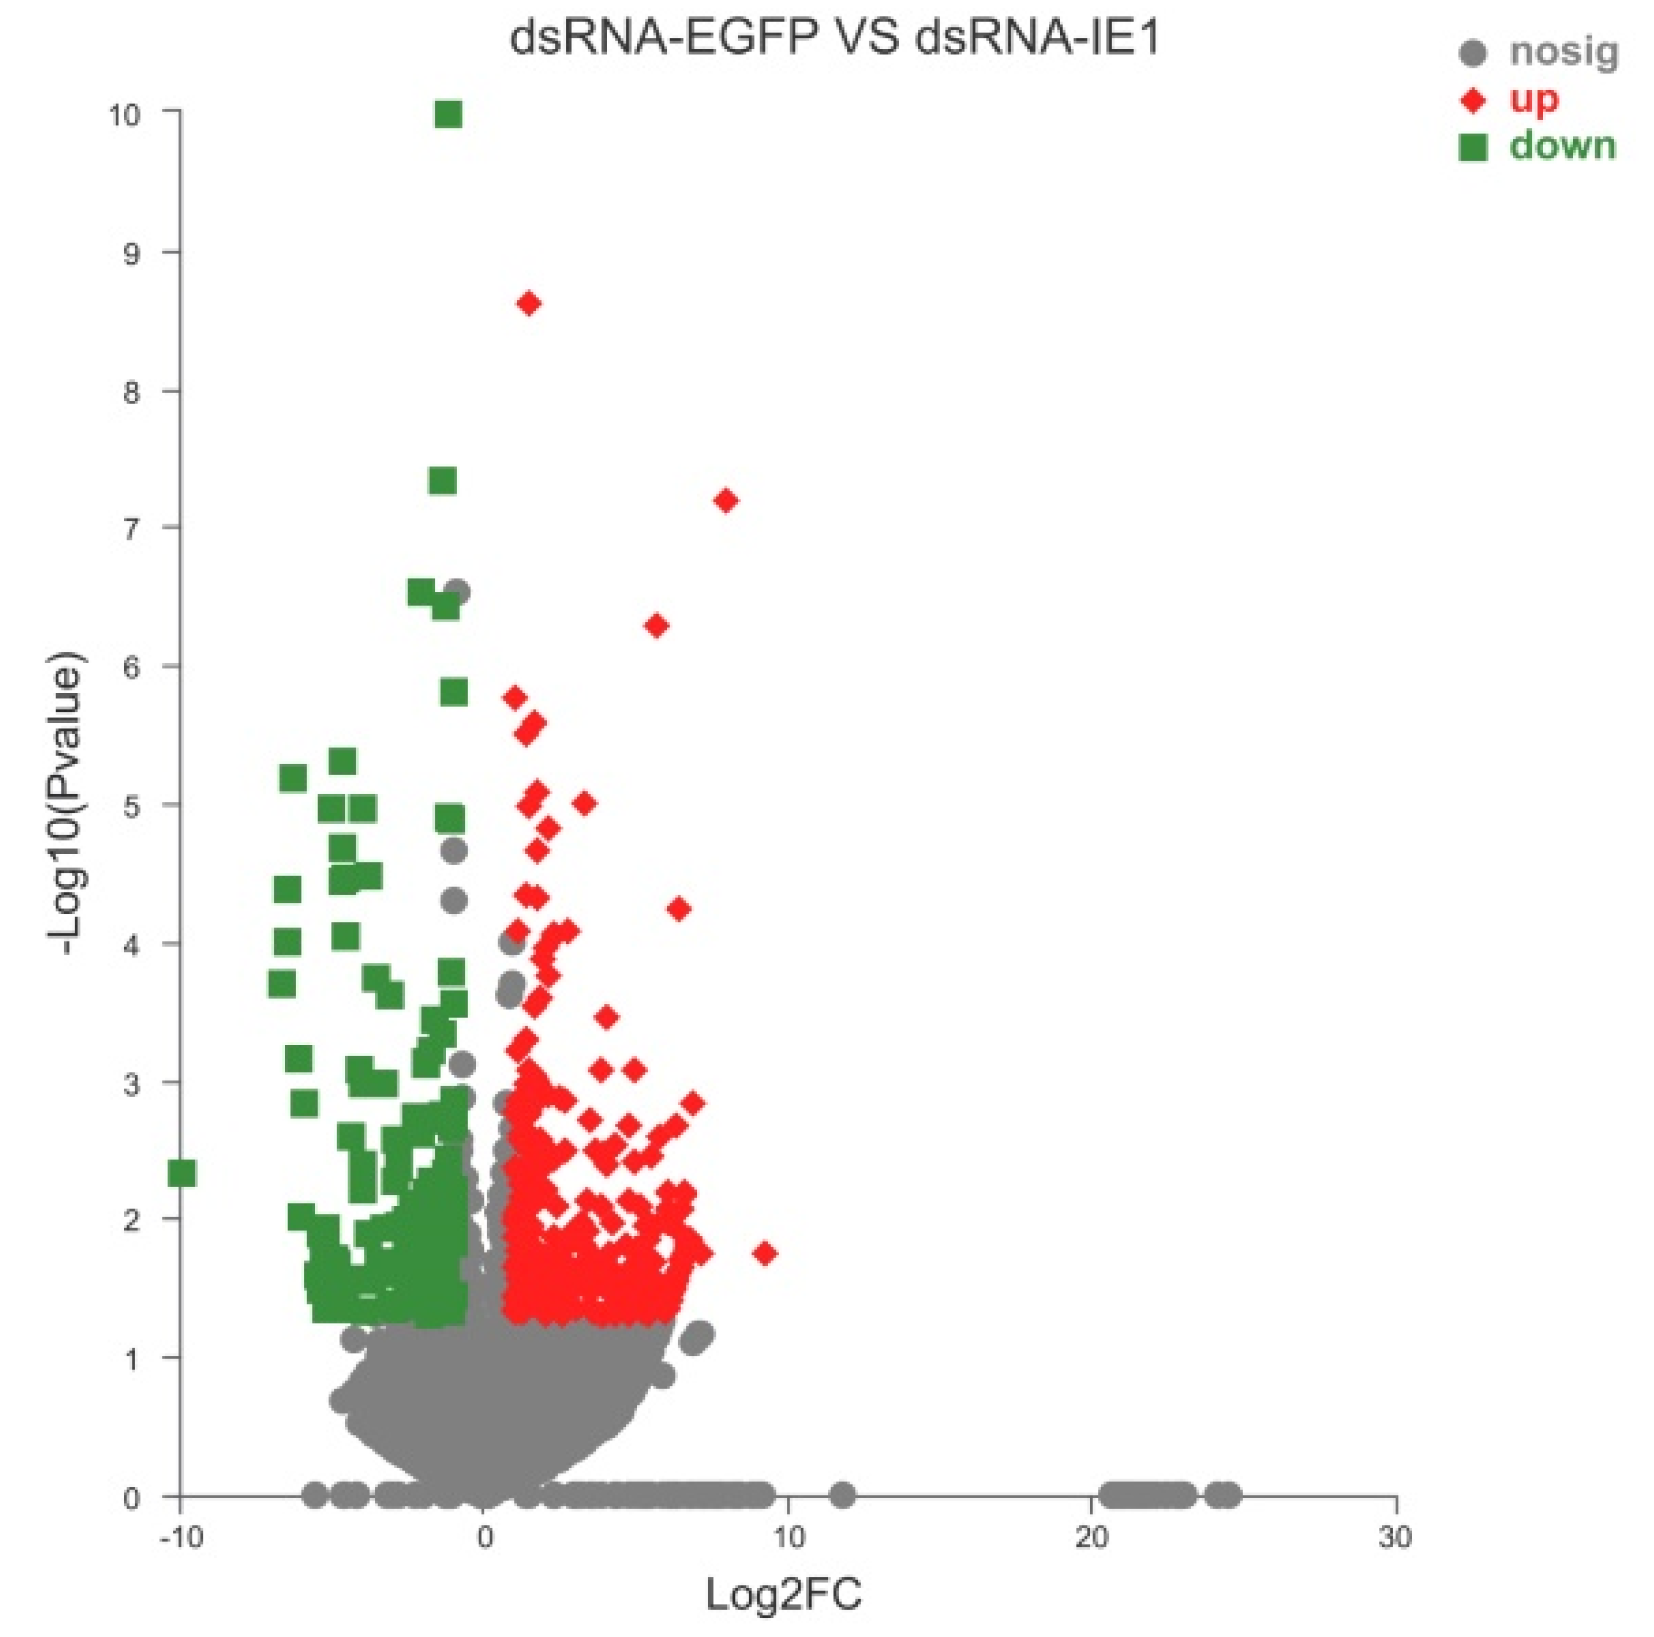
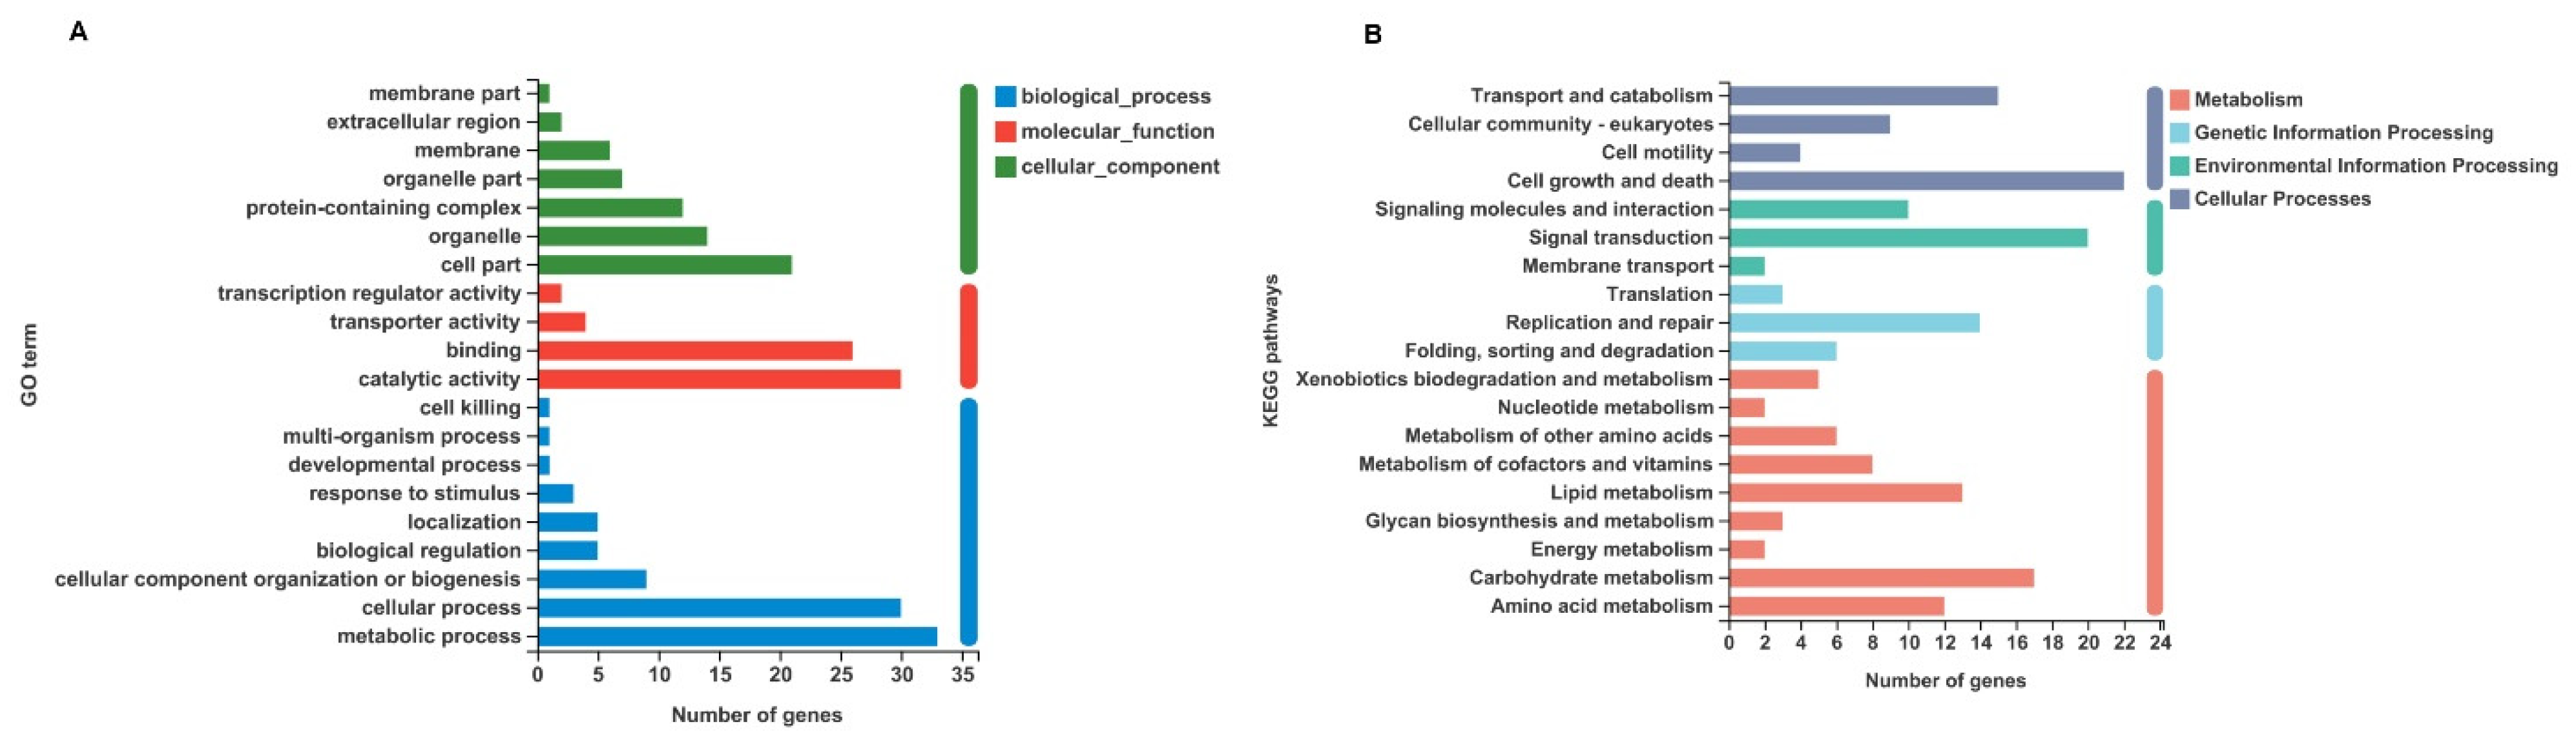
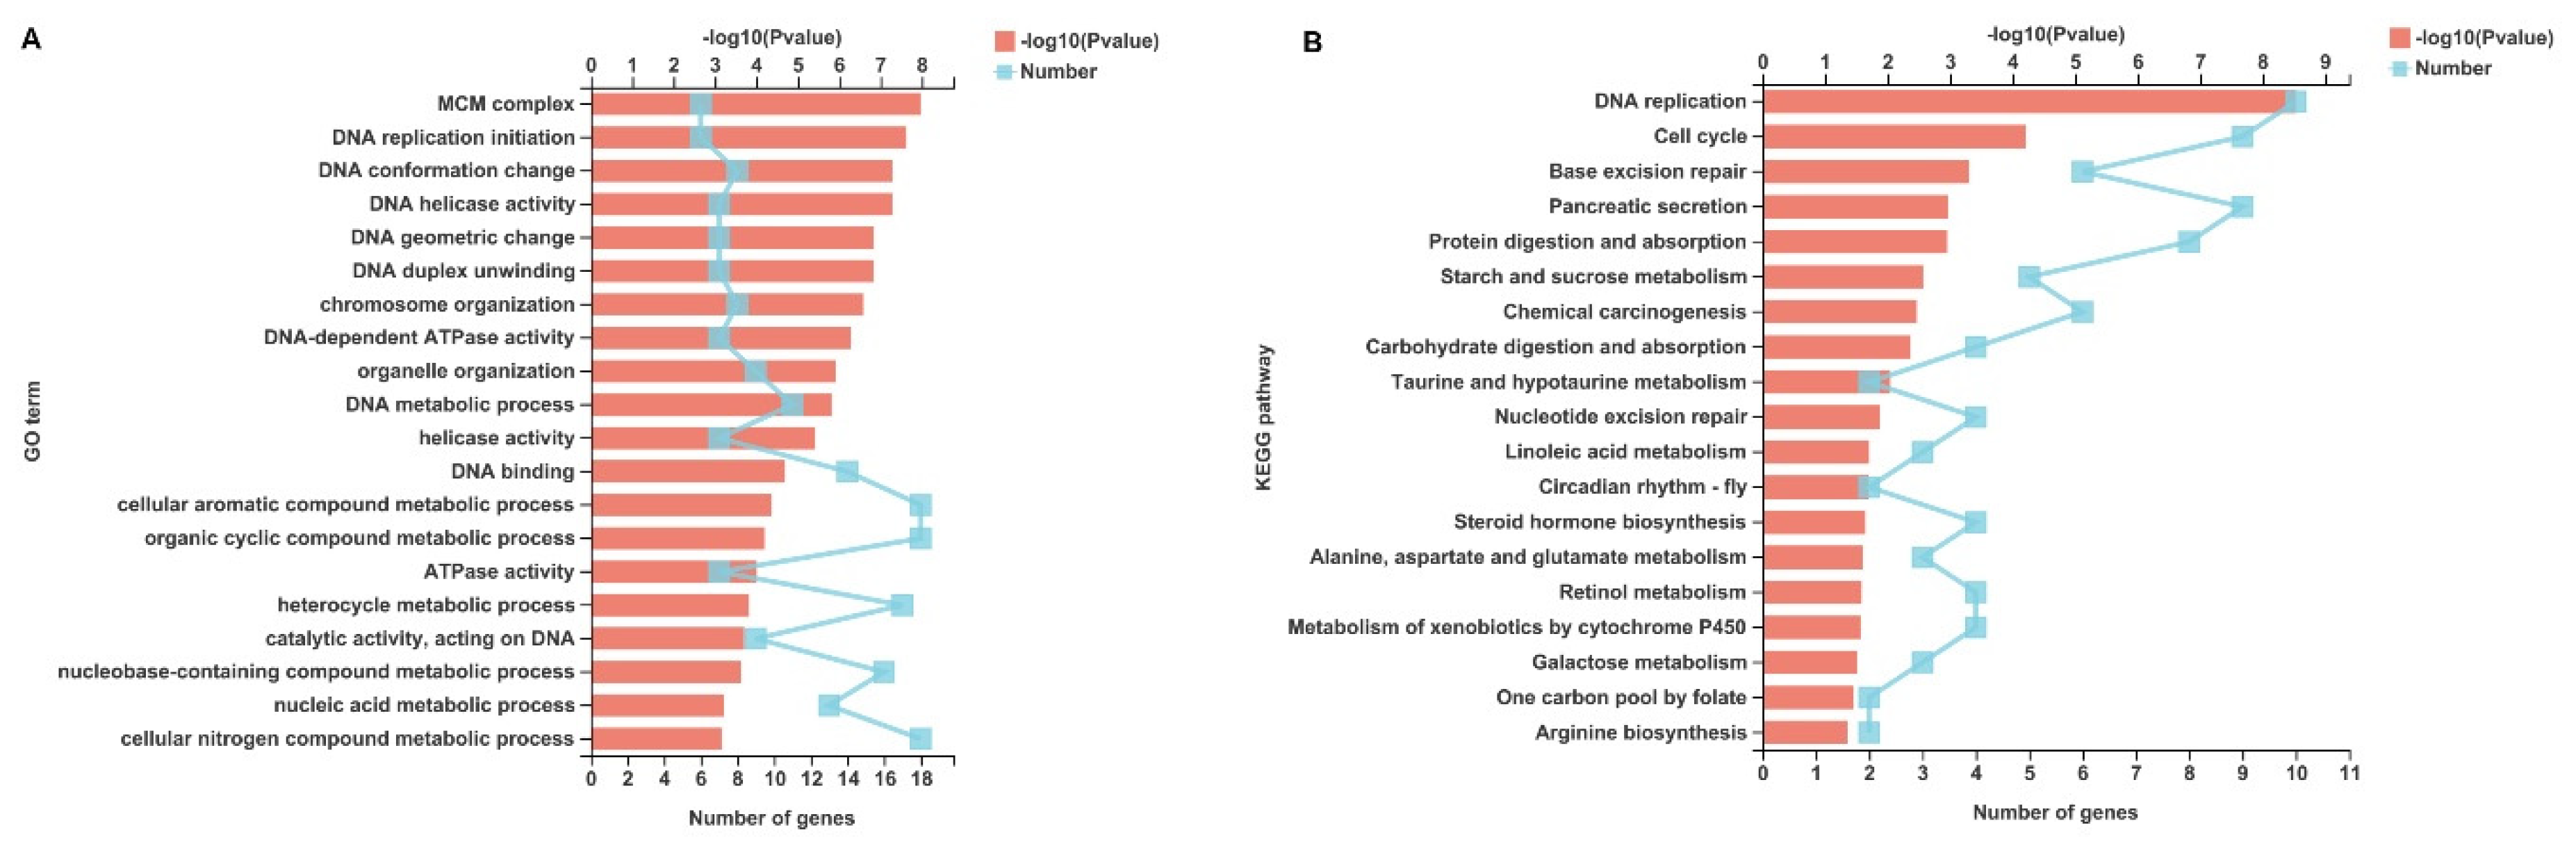
2.2. Identification and Functional Classification Analysis of DEGs

Among the unigenes identified, unigenes with p < 0.05, |log2FC| ≥ 1, and fold change ≥2 or ≤0.5 were considered to be DEGs. Based on this criterion, a total of 429 DEGs were identified, of which 284 genes were upregulated (e.g., caspase8, chorion peroxidase, heme-binding protein 1, etc.) and 145 genes were downregulated (e.g., MCM2, MCM3, MCM4, MCM5, MCM7, etc.) after IE1 knockdown (Figure 2 and Table S3). To determine the biological functions of the DEGs identified, GO and KEGG pathway annotation analysis were performed. In the GO annotation analysis, the identified DEGs were classified into three categories: biological process, molecular function, and cellular component (Figure 3A). For biological process, the identified DEGs are mainly involved in the metabolic process and cellular process. In terms of cellular component and molecular function, most of the DEGs are localized in cell parts and organelles with catalytic activity and binding. In addition, the KEGG pathway annotation analysis showed that the majority of the DEGs are implicated in cell growth and death, signal transduction, and carbohydrate metabolism (Figure 3B). Furthermore, the DEGs were further subjected to GO and KEGG pathway enrichment analysis. The results showed that the most significantly enriched GO term of the DEGs was the MCM complex (Figure 4A), while DNA replication was the most significantly enriched signaling pathway (Figure 4B). Given that the MCM complex is a conserved component of the DNA replication system in all eukaryotes [27], these data indicate that IE1 might control DNA replication by modulating the MCM complex.

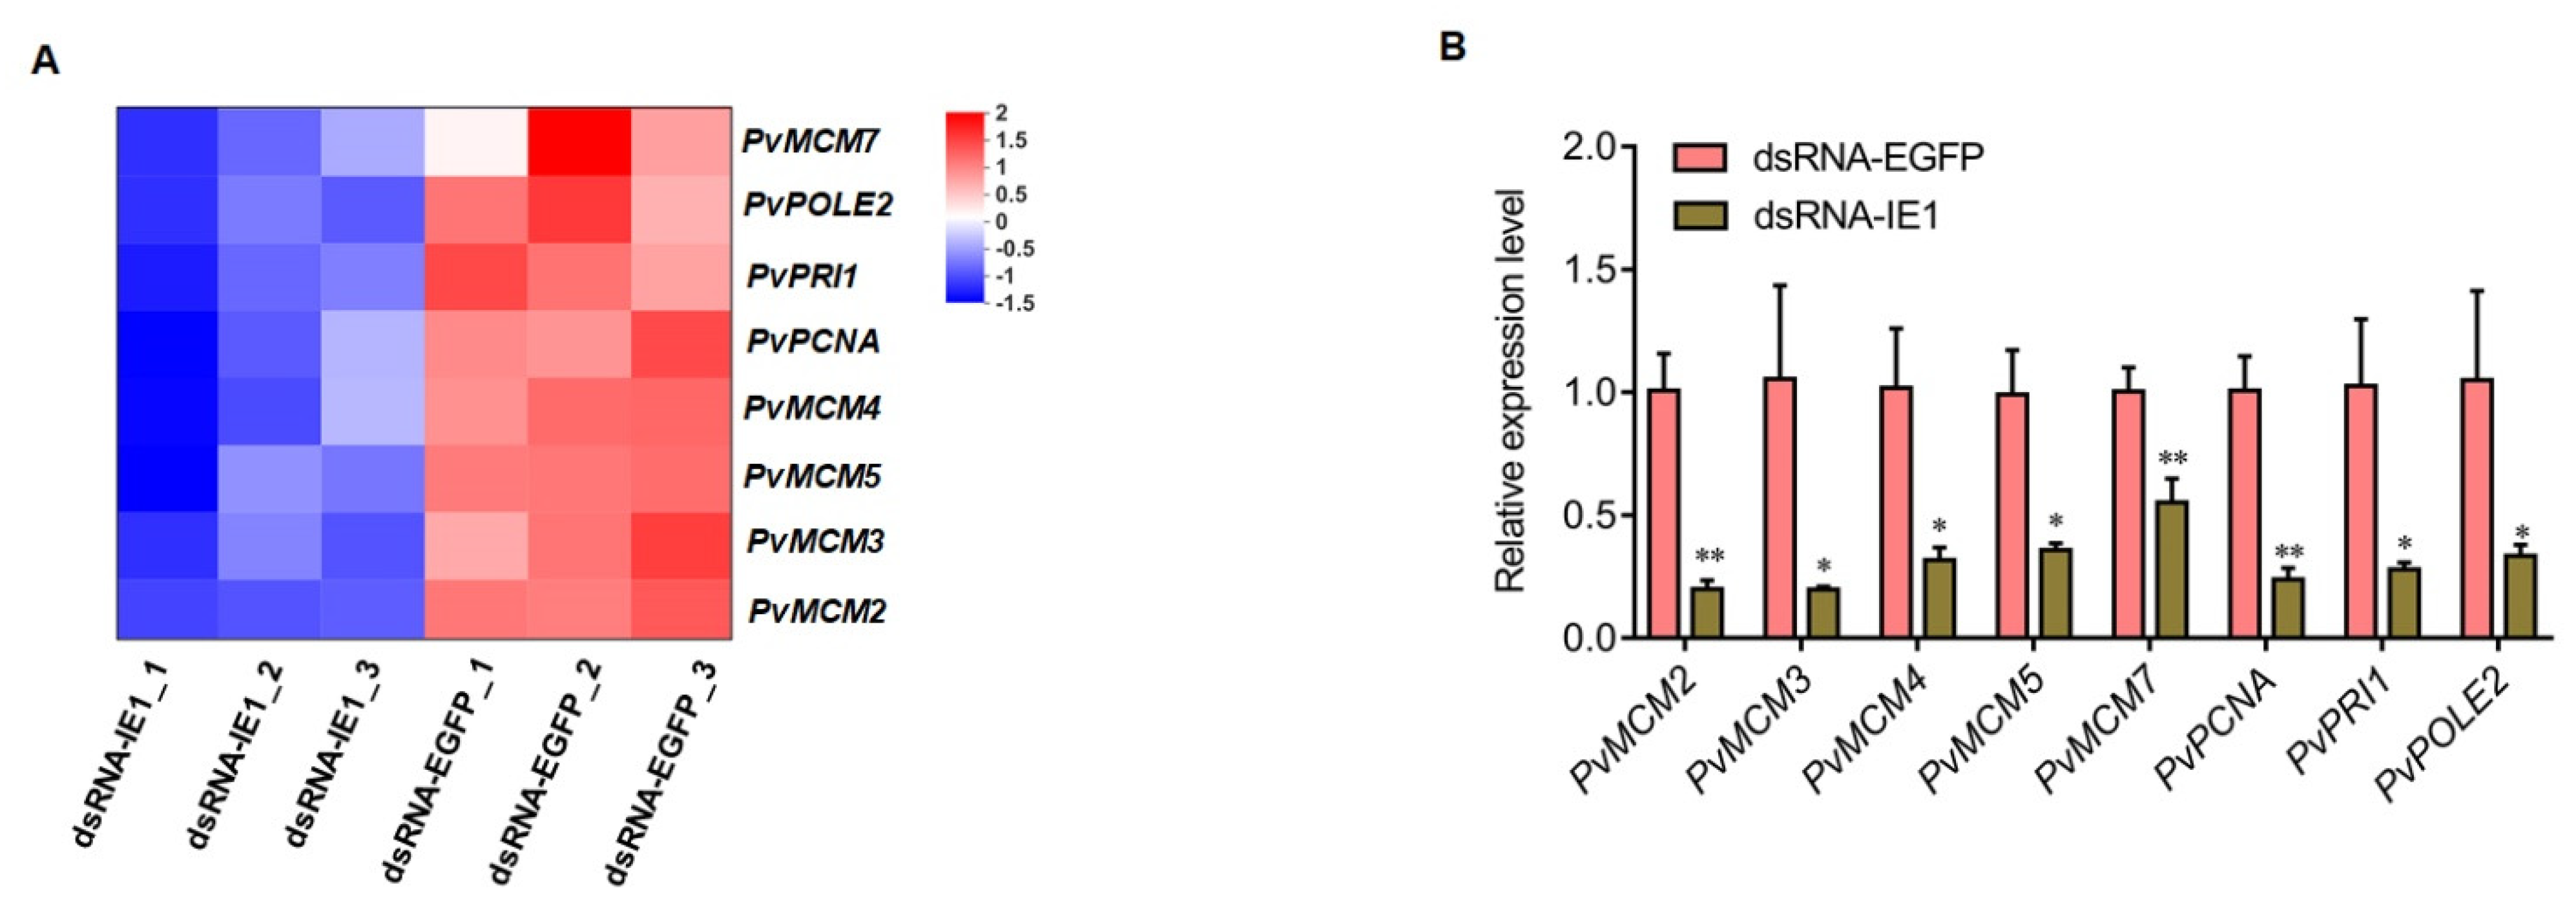
2.3. Validation of RNA-Seq Results by qPCR Analysis

In order to substantiate the reliability of transcriptome data, eight DEGs related to DNA replication were chosen for qPCR validation. These genes were PvMCM2, PvMCM3, PvMCM4, PvMCM5, PvMCM7, proliferating cell nuclear antigen (PvPCNA), DNA primase small subunit (PvPRI1), and DNA polymerase epsilon subunit 2 (PvPOLE2). In the transcriptome sequencing analysis, these DNA replication factors were significantly downregulated in IE1-silenced shrimp compared with the control (Figure 5A). Similarly, the qPCR results confirmed that these genes also showed significant decreased expression after IE1 knockdown (Figure 5B). Therefore, the qPCR results were generally consistent with the transcriptome data, indicating the accuracy of the transcriptome data.

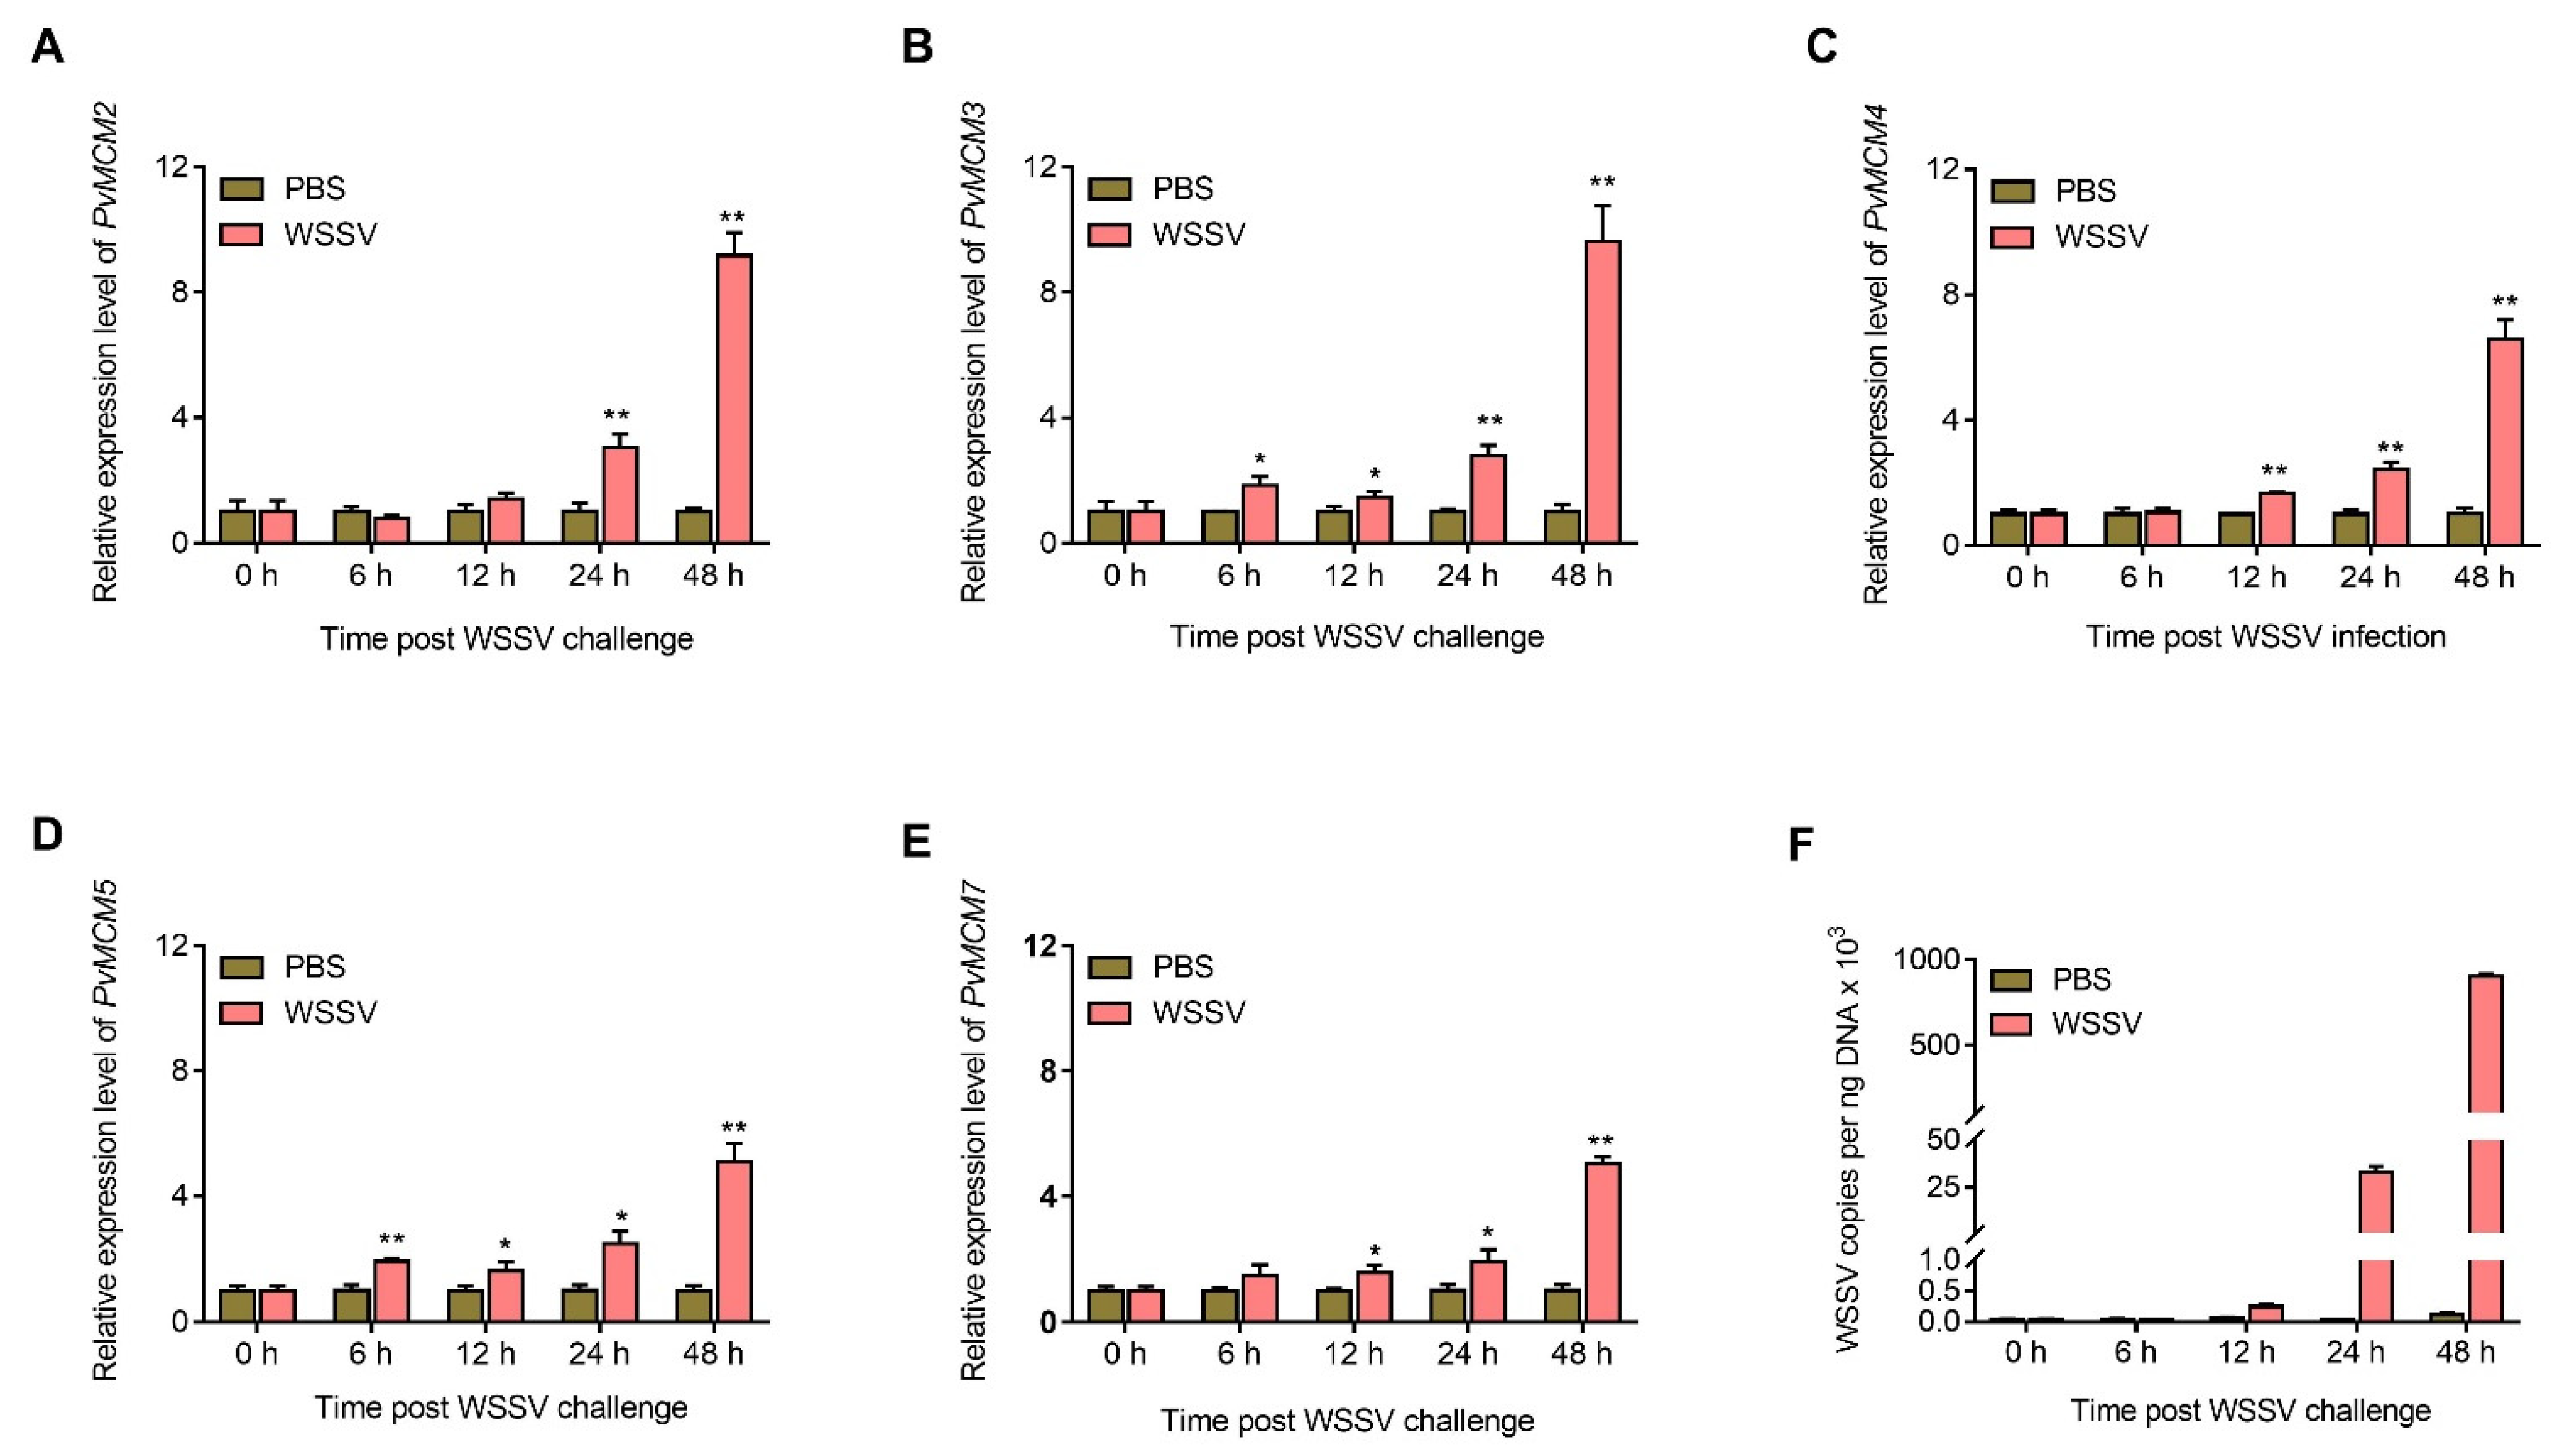
2.4. P. Vannamei MCM Complex Genes Are Upregulated after WSSV Challenge

The above results suggest that the MCM complex might have critical roles in WSSV infection. Therefore, to address this, the mRNA expression profiles of P. vannamei MCM complex genes (i.e., PvMCM2, PvMCM3, PvMCM4, PvMCM5, and PvMCM7) in hemocytes post WSSV challenge were detected using qPCR analysis in this study. As indicated in Figure 6A–E, compared with the PBS control, the transcript levels of the analyzed MCM complex genes generally started to upregulate at 12 h, and increased sharply at 24 h and 48 h after WSSV infection. In particular, the mRNA expression of PvMCM2, PvMCM3, PvMCM4, PvMCM5, and PvMCM7 was increased by approximately 9.1, 9.6, 6.5, 5.1, and 5.0 fold at 48 h post viral infection, respectively. Meanwhile, the replication of the WSSV genome during infection was evaluated by measuring the viral loads. The result showed that WSSV genome replication started at 12 h post infection, and rapidly replicated from 24 h to 48 h (Figure 6F). Thus, these results suggest that the mRNA expression of MCM complex genes is closely correlated to WSSV genome replication.

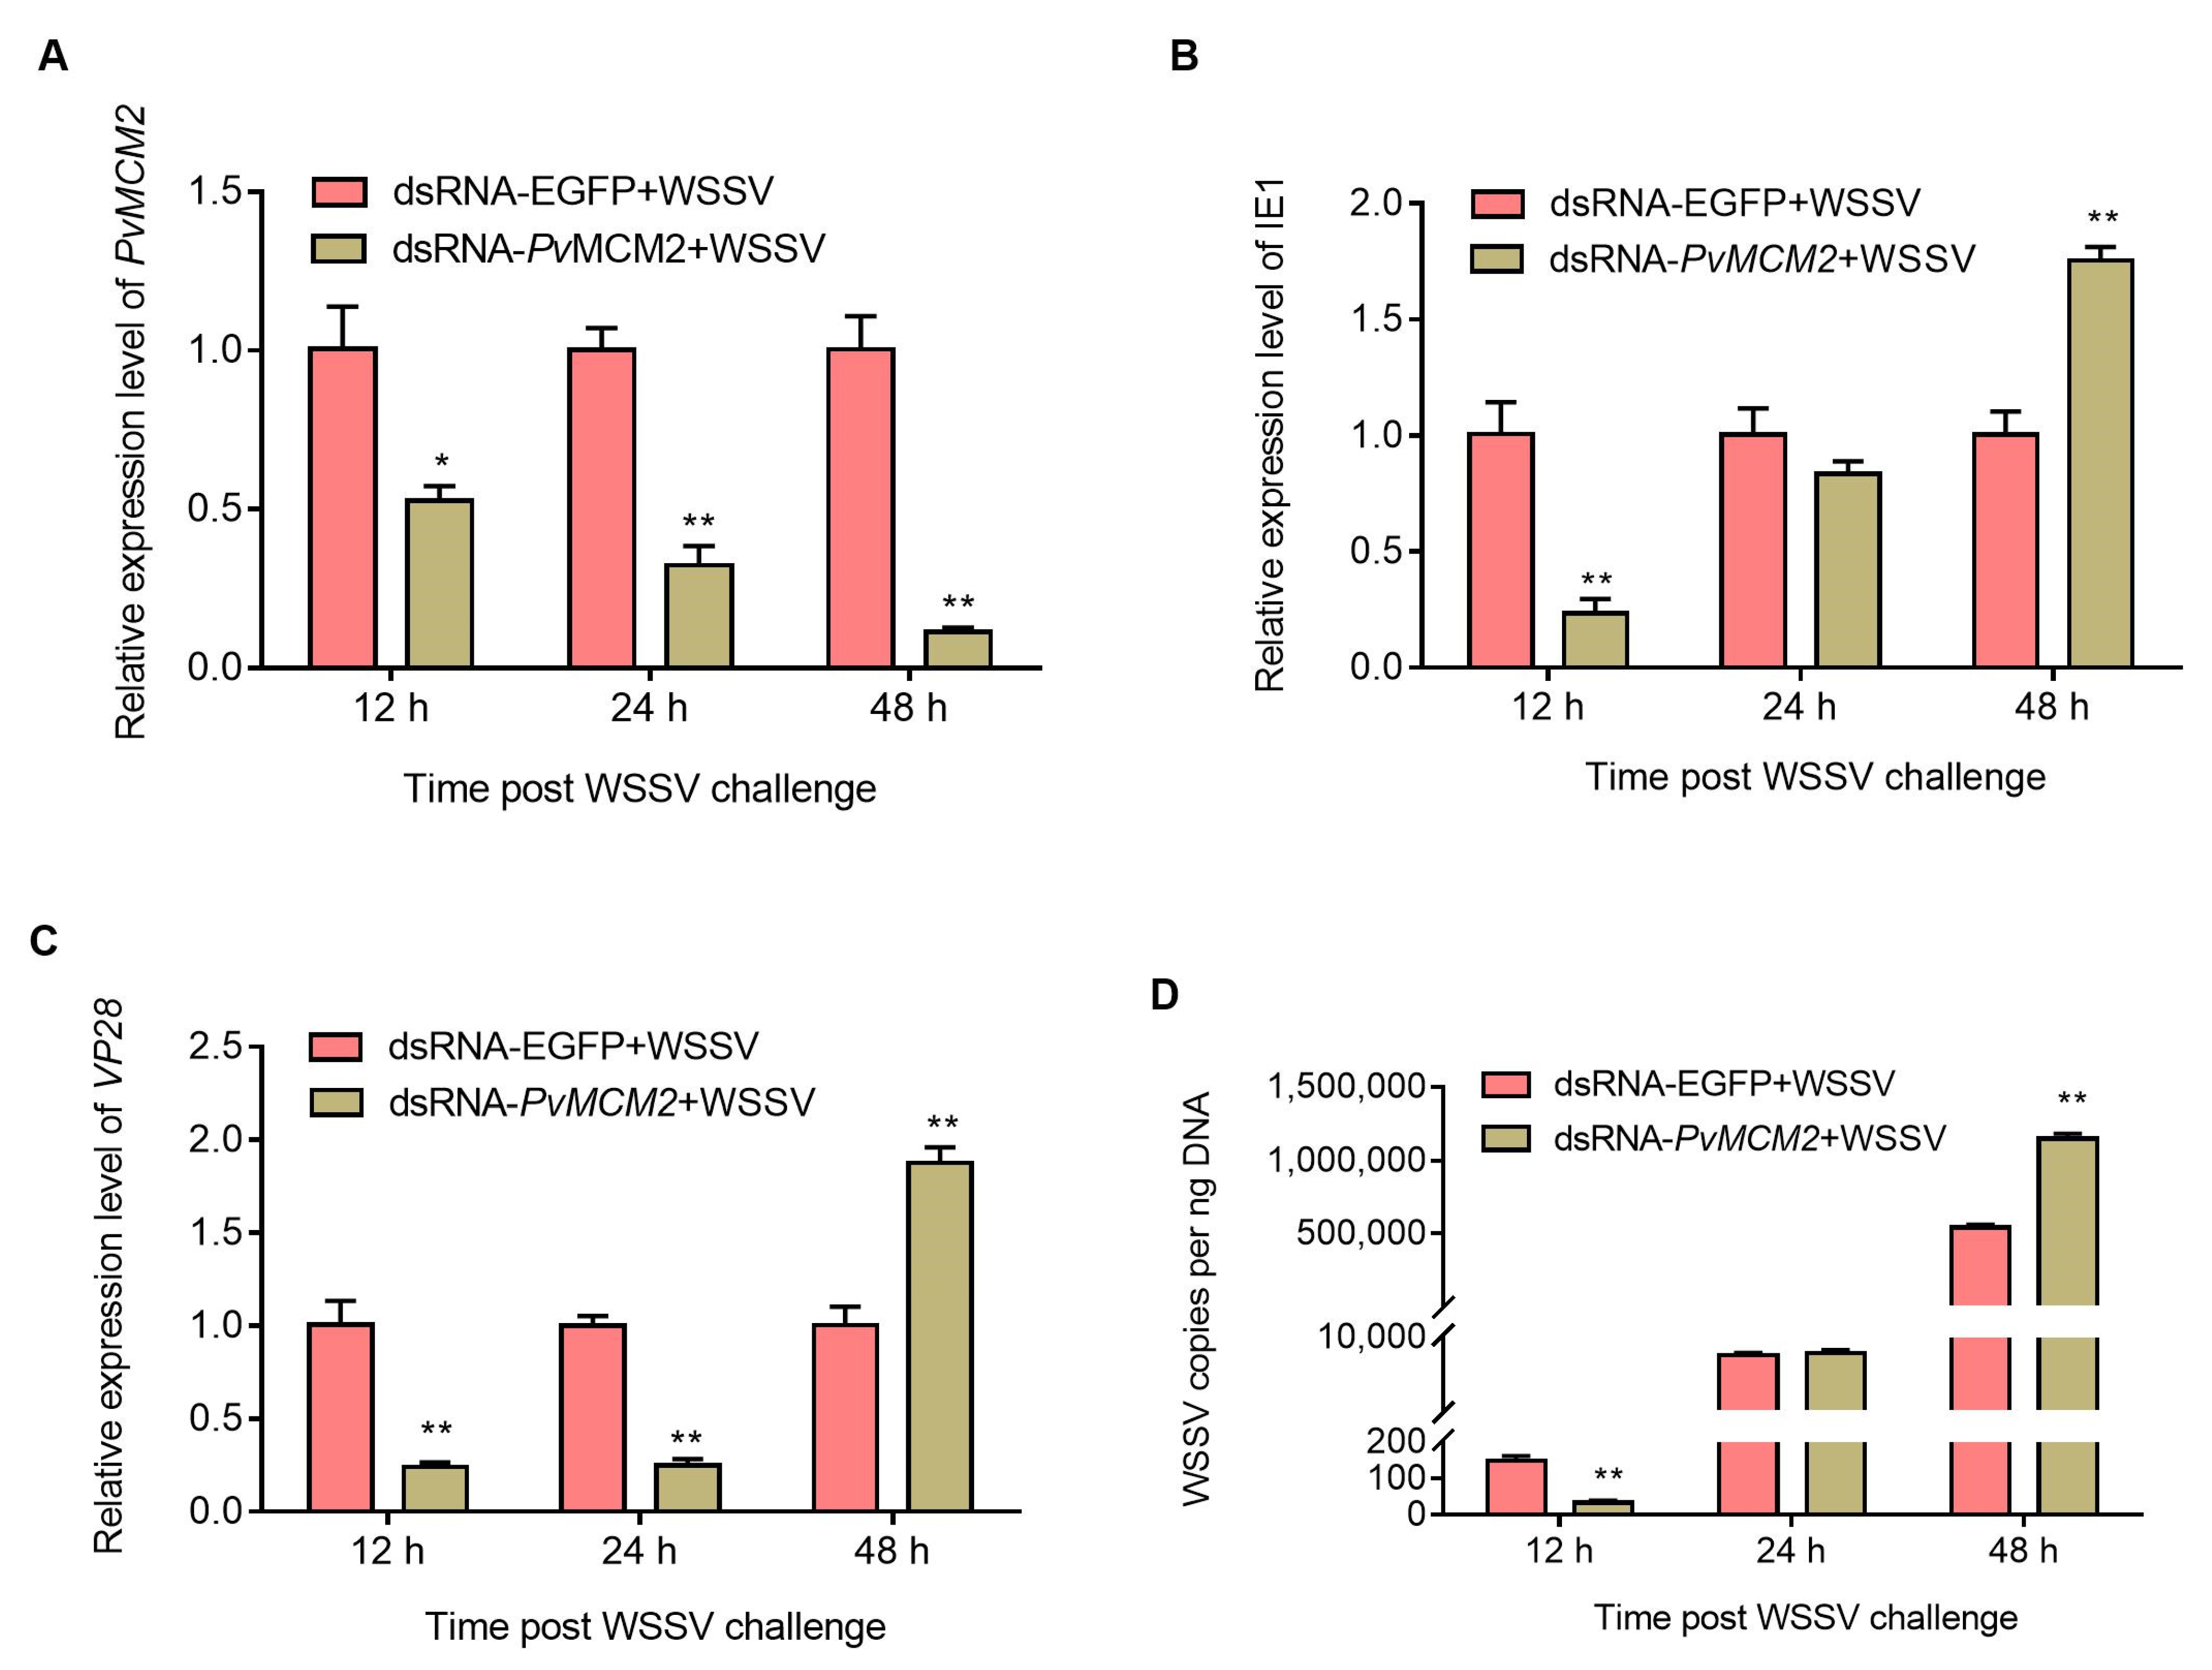
2.5. P. vannamei MCM Complex Enhances WSSV Replication at the Early Infection Stage

To further figure out the role of the P. vannamei MCM complex in WSSV infection, RNAi assay was performed. In this study, we selected PvMCM2 for RNAi analysis as it is one of the MCM complex genes that showed the most increased expression post WSSV infection (Figure 6). First, shrimp were injected with dsRNA-PvMCM2 or dsRNA-EGFP, followed by WSSV challenge. The qPCR result showed that the mRNA expression of PvMCM2 in dsRNA-PvMCM2-injected shrimp was reduced by about 47%, 67%, and 88% at 12, 24, and 48 h post WSSV infection, respectively, compared with the dsRNA-EGFP group (Figure 7A). This result indicated that PvMCM2 was effectively silenced under WSSV infection. Subsequently, we continued to examine the mRNA expression of WSSV genes (i.e., the immediate-early gene IE1 and late gene VP28) and viral loads after PvMCM2 knockdown. As shown in Figure 7B–D, compared with the dsRNA-EGFP-injected control group, the mRNA expression of IE1 and VP28 as well as viral loads in PvMCM2-depleted shrimp were significantly downregulated at the early infection stage (12 h), but upregulated at the late infection period (48 h). Taken together, these data suggest that the P. vannamei MCM complex contributes to WSSV replication in the early stage of viral infection.

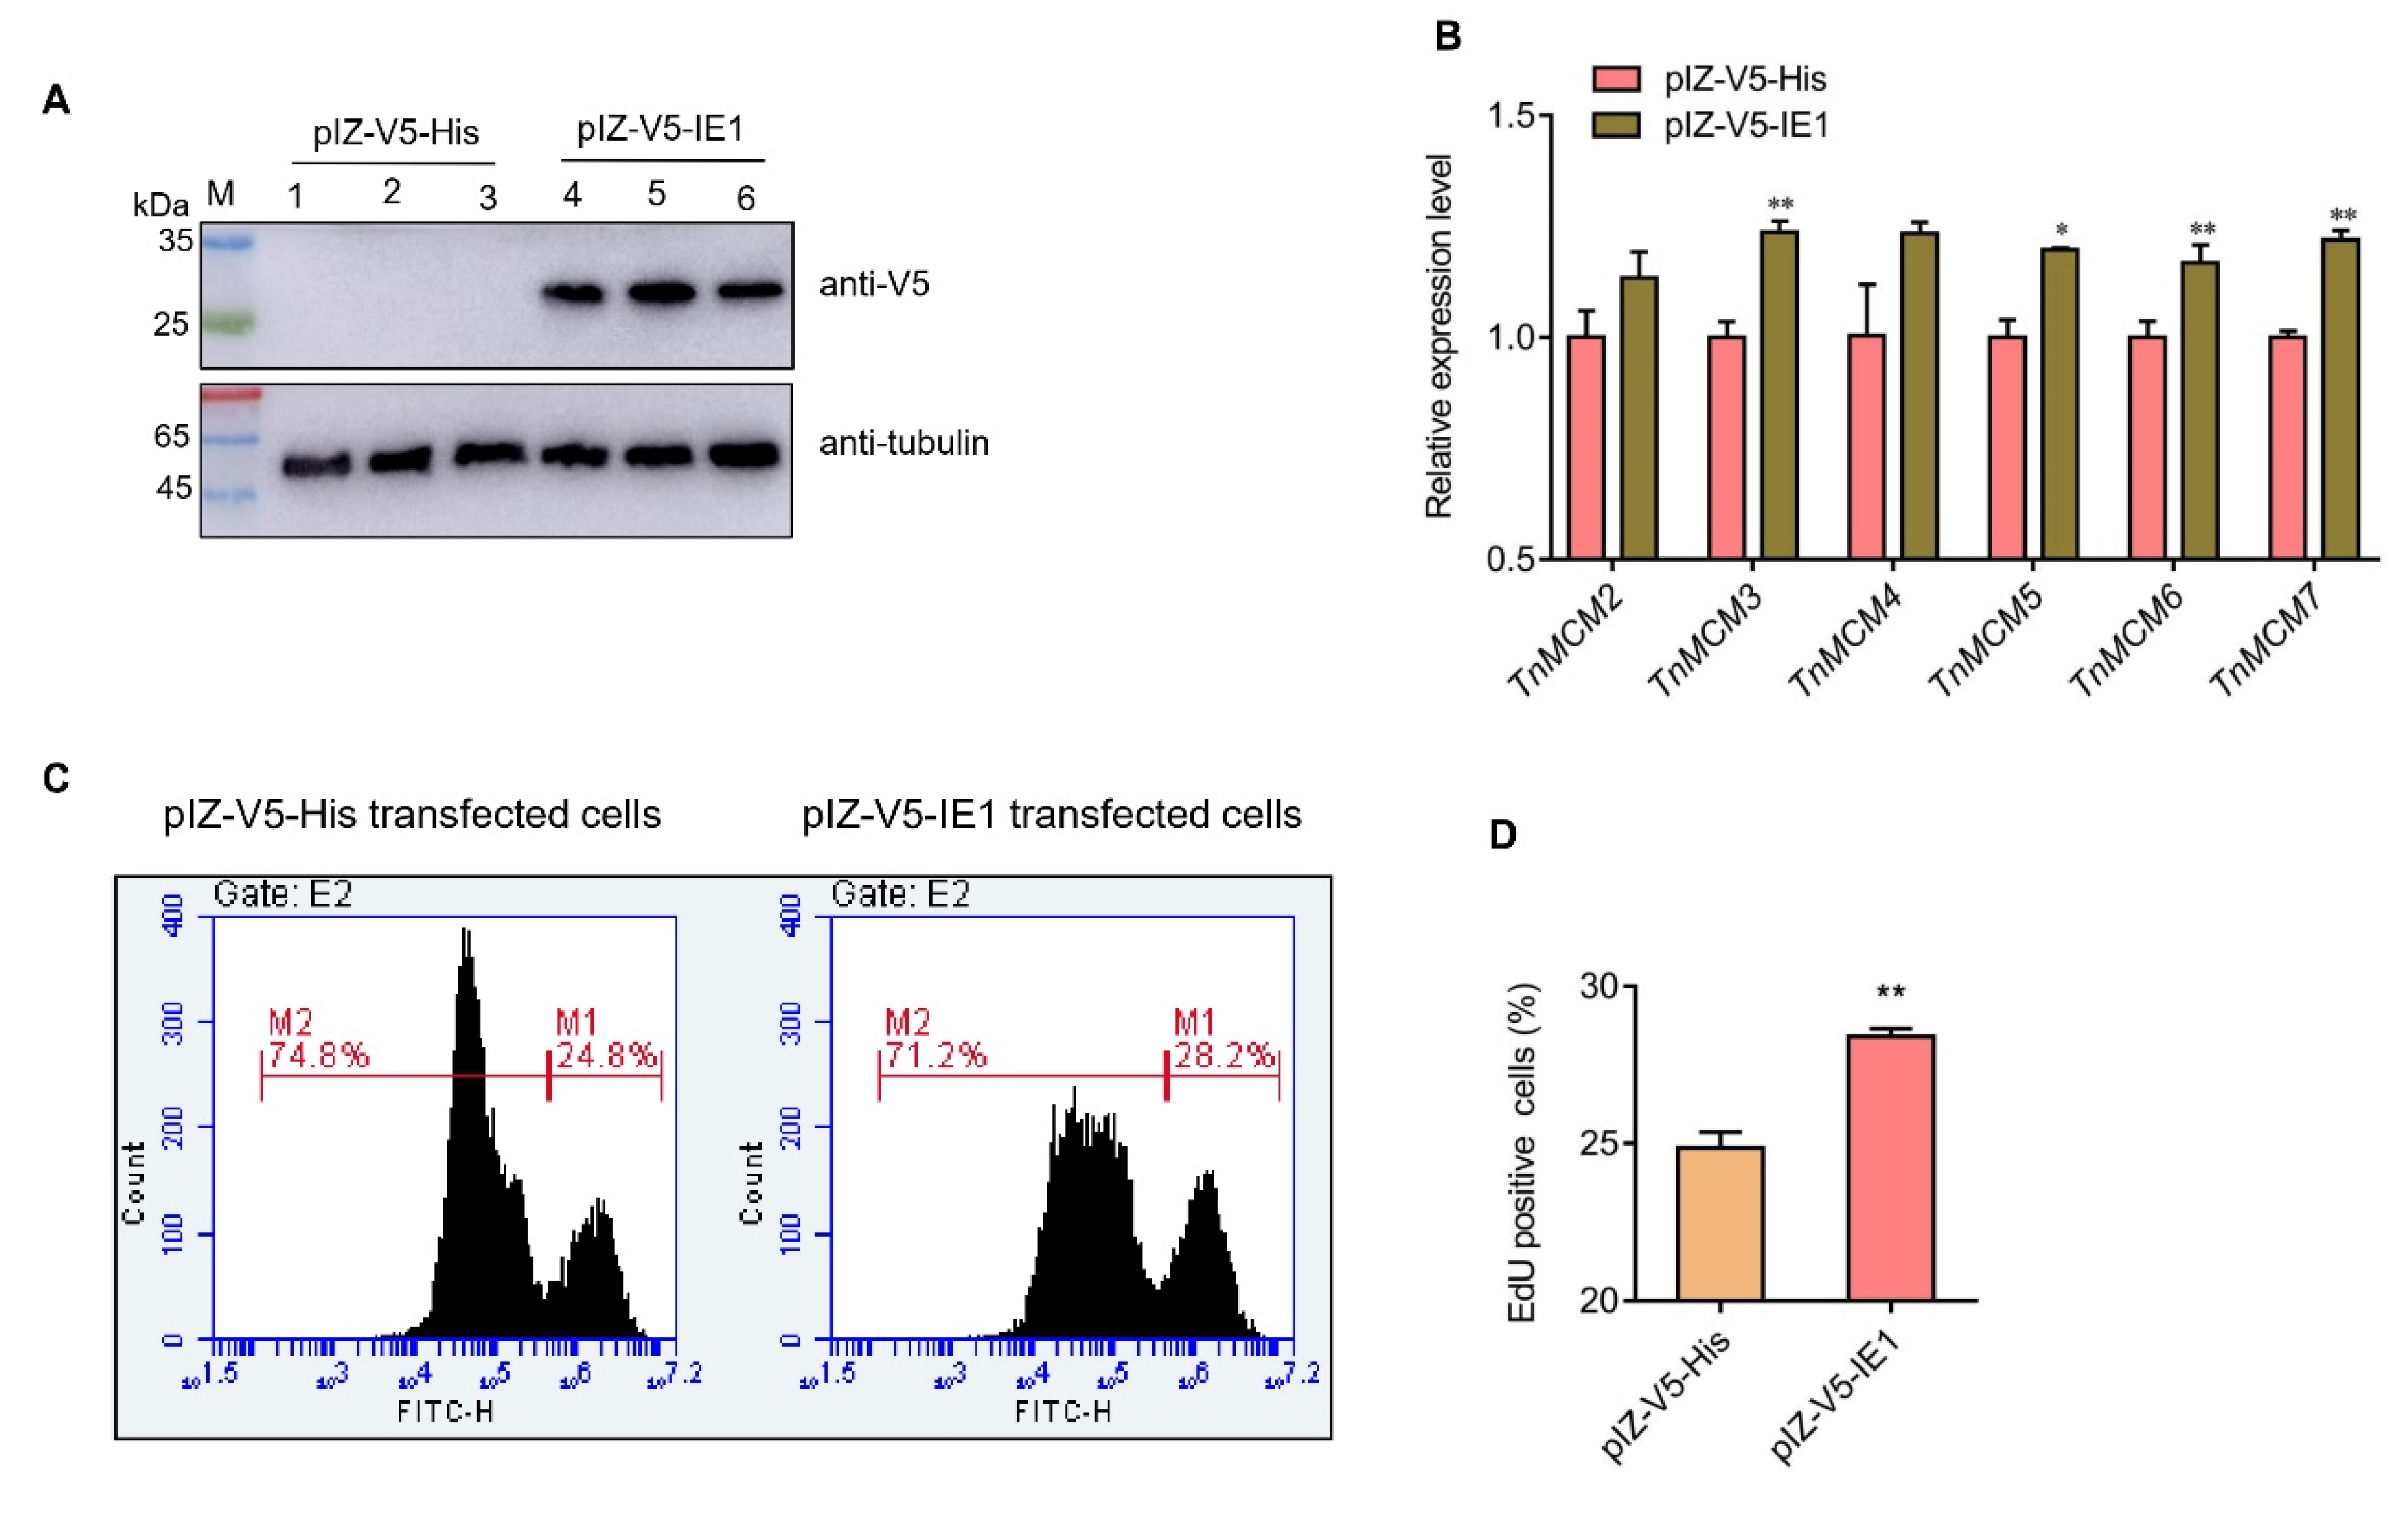
2.6. IE1 Promotes the Cellular DNA Synthesis In Vitro

Until now, there was no available shrimp cell line for plasmid transfections. Hence, in this study, the High-Five cell, a clonal isolate derived from the parental Trichoplusia ni (cabbage looper ovary), was used to determine whether IE1 could modulate DNA replication. First, we transfected the IE1 expression plasmid (pIZ-V5-IE1) and empty vector (pIZ-V5-His) into the High-Five cells and then determined the expression of MCM complex genes and DNA synthesis. As illustrated in Figure 8A, IE1 could be expressed in High-Five cells at 24 h post transfection. Following this, the pIZ-V5-IE1 and pIZ-V5-His transfected cells were harvested and used for qPCR and DNA synthesis analysis. The qPCR result showed that the mRNA expression of MCM complex genes in High-Five cells were generally upregulated after IE1 overexpression compared to the control (Figure 8B). Furthermore, the EdU-positive cells were increased by about 14% after IE1 overexpression compared with the control (Figure 8C,D). This result suggests that IE1 could facilitate the cellular DNA synthesis via elevating the expression of the MCM complex genes in vitro.

3. Discussion

IE1, which is an IE protein of WSSV, is a multifunctional regulator that plays critical roles in virus–host interactions. It not only functioned as a transcription factor [22], but also interacted with various shrimp cellular proteins (i.e., Rb, STAT, JNK, β-catenin, Chibby, and proPO) to manipulate the host cellular functions for viral genome replication [18,19,23,24,25,26]. In this study, RNAi coupled with transcriptome sequencing were conducted to explore the downstream genes that are regulated by IE1 directly or indirectly. Under WSSV infection, a total of 429 DEGs were identified after IE1 knockdown, including 284 upregulated genes and 145 downregulated genes (Figure 2). GO and KEGG pathway enrichment analysis revealed that the DEGs were significantly enriched in the MCM complex and DNA replication (Figure 4A,B), which suggest a role for IE1 in DNA replication control during viral infection.
As obligate intracellular pathogens, viruses have to co-opt various host factors and machineries to replicate their genomes. Thus far, although WSSV encodes several DNA replication factors such as DNA polymerase, helicase, and dUTPase [3,28,29], it is still unclear how WSSV replicates its genome and what are key regulators that are involved in initiating genome replication. Here, our transcriptome sequencing and qPCR results showed that IE1 depletion could inhibit the expression of many DNA replication factors (especially MCM complex genes) under WSSV invasion (Figure 5A,B). In eukaryotic cells, the MCM complex is a hetero–hexameric protein complex composed of MCM2-MCM7. It is thought to function as a DNA replicative helicase that binds to the replication origin and unwinds double-stranded DNA (dsDNA) to initiate replication. Recently, there is growing evidence that many viruses hijack the cellular MCM complex to support viral genome replication. For example, Chaudhuri et al. have shown that Epstein-Barr virus (EBV) recruits the MCM proteins for the propagation of its genome [30]. Kawaguchi et al. have demonstrated that the interaction of MCM proteins and the PA subunit of the viral RNA-dependent RNA polymerase is required for de novo replication of the influenza virus RNA genome [31]. Recently, Dabral et al. reported that Kaposi’s sarcoma-associated herpesvirus (KSHV)-encoded latency-associated nuclear antigen (LANA) interacted with the host MCM proteins (i.e., MCM3, MCM4, and MCM6) and recruited them to the viral replication origin for viral DNA replication [32]. Intriguingly, our present studies showed that the mRNA expression of P. vannamei MCM complex genes was found to be upregulated in response to WSSV attack (Figure 6), while RNAi-mediated suppression of PvMCM2 downregulated the expression of WSSV genes and viral loads at the early infection stage (12 h) (Figure 7). Furthermore, we demonstrated that overexpression of IE1 could enhance the expression of MCM complex genes and cellular DNA synthesis in High-Five cells (Figure 8). Based on the above findings, we propose that IE1 can modulate the cellular DNA replication machinery via targeting the MCM complex, which ultimately promotes the replication of the WSSV genome.
It is worth mentioning that in contrast to the early infection stage (i.e., 12 h), knockdown of PvMCM2 increased the WSSV genes’ expression and viral loads at the late infection period (i.e., 48 h) (Figure 7), indicating that the MCM complex may play important roles in the host defensive immunity. Consistent with this result, several studies recently have reported that the MCM complex protein from shrimp and crab could participate in the antiviral and/or antibacterial immune response by regulating phagocytosis, apoptosis, and expression of immune genes [33,34]. Given that the MCM complex may play critical roles in immune defense, coupled with the fact that WSSV can encode its own helicase [3], we speculated that WSSV may utilize the host cellular helicase (i.e., MCM complex) to initiate its genome replication at the early phase of infection, but depends on its own helicase at the late stage. Consequently, the MCM complex could be required for the initial genome replication of WSSV, whilst plays antiviral roles at the late infection stage. In addition, although our results revealed that IE1 could modulate the expression of MCM complex genes during WSSV infection (Figure 5), the molecular mechanisms behind this remain unclear. Interestingly, given that IE1 not only functions as a transcription factor by itself, but also interacts with the host transcription factors (e.g., STAT and TATA-box-binding protein) [19,22,35], it is necessary for us to explore whether IE1 directly modulates the expression of the host MCM complex genes in the future. On the other hand, it has been previously shown that expression of MCM complex genes could be regulated by the cell cycle transcription factor E2F [36,37]. A recent work suggests that IE1 can interact with the host Rb protein, thereby resulting in the release and activation of E2F [23]. These data hint that IE1 may modulate the expression of MCM proteins via the Rb-E2F pathway.
In conclusion, this study for the first time explored the downstream genes of IE1 during WSSV infection using RNAi and transcriptome sequencing analysis. A total of 429 DEGs after IE1 knockdown were identified, which are mainly involved in DNA replication. Our results reveal that IE1 could modulate the cellular DNA replication machinery via regulating the MCM complex and consequently drives viral genome replication. The current data provide a novel insight into the biological functions of IE1, which contributes to better understanding of WSSV–host interactions and therefore helps in developing more potential therapeutic avenues for virus infection.

4. Materials and Methods

4.1. Shrimp Culture and Virus

The penaeid shrimp, P. vannamei (as 5–8 g body weight), was purchased from Huaxun Aquatic Product Corporation (Shantou, China). These shrimp were acclimatized for 2 days in tanks with aerated seawater at room temperature before experiments. The WSSV strain used in this study was the Chinese mainland isolate (GenBank accession no: AF332093). The virus inoculum was isolated from WSSV-infected crayfish (Procambrus clarkii) and quantified as previously described [38,39]. The animal experiment was reviewed and approved by the Animal Research and Ethics Committees of Shantou University, Guangdong, China.

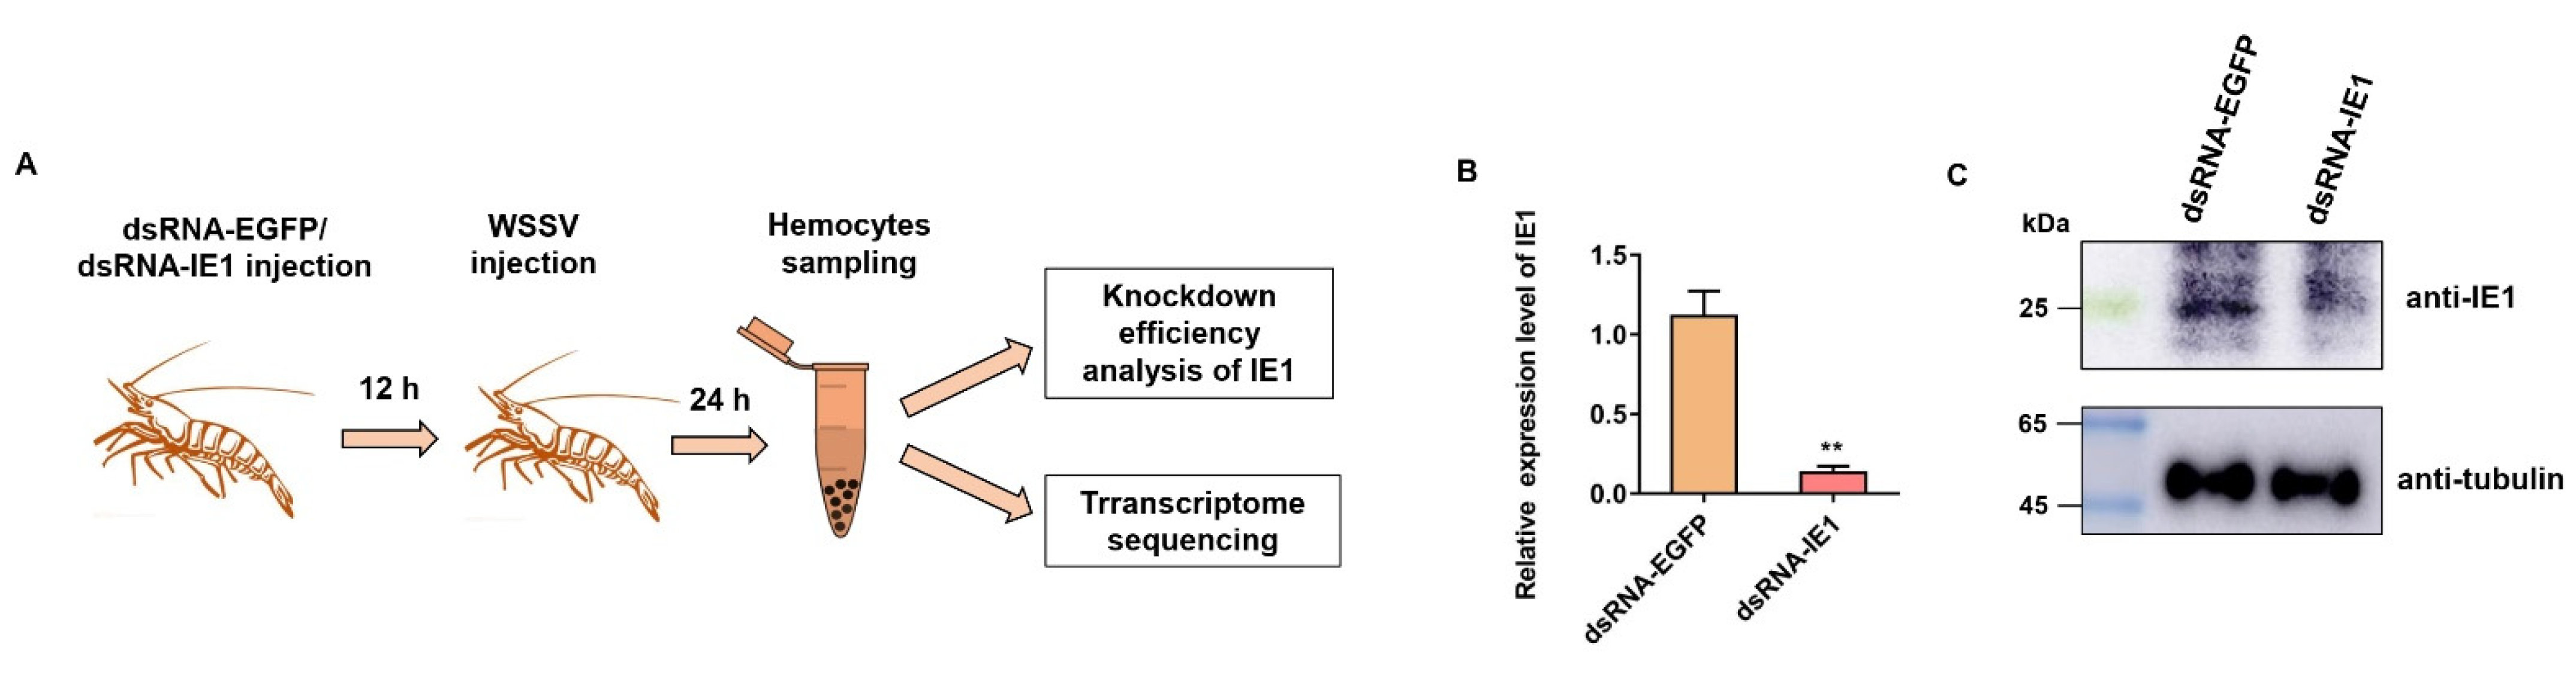
4.2. RNAi-Mediated Knockdown of IE1 and Sample Collection

The gene silencing of IE1 during viral infection was carried out according to a previous protocol with minor modifications [35]. Briefly, the double-stranded RNA (dsRNA) targeting the IE1 gene (dsRNA-IE1) was prepared in vitro using the T7 RiboMAXTM Express RNAi System (Promega, Madison, WI, USA). The dsRNA specific for the EGFP gene (dsRNA-EGFP) was also synthesized for a negative control. The primers used for dsRNA synthesis are shown in Table S4. For RNAi assay, shrimp were randomly divided into two groups. The experimental group was intramuscularly injected with 10 µg of dsRNA-IE1, while the control group was injected with an equal amount of dsRNA-EGFP. At 12 h post dsRNA injection, each shrimp per group was further challenged with 100 µL of WSSV virions (1 × 10⁵ copies). At 24 h after viral infection, the hemolymph of each group was collected from the pericardial sinus using a sterile syringe and immediately mixed with ice-cold anti-coagulant solution (258 mM sodium citrate dihydrate, 328 mM sodium citrate, 110 mM glucose, 140 mM NaCl, pH 6.0). The hemocytes were harvested by centrifugation at 500 g for 10 min at 4 °C, and then used for RNA extraction and protein sample preparation. Before transcriptome sequencing, the IE1 knockdown efficiency was evaluated using qPCR and Western blot analysis as described in Section 4.6 and Section 4.10. The qPCR primers of IE1 and the internal reference gene PvEF1α are shown in Table S4. The primary antibody against IE1 (anti-IE1) was previously prepared by immunizing the mouse with purified recombinant IE1 in our lab.

4.3. RNA Extraction, cDNA Library Construction, and Transcriptome Sequencing

Total RNA was extracted from the hemocytes of each group using an RNAfast200 kit (Fastagen, Shanghai, China) according to the manufacturer’s instructions, and genomic DNA was removed using DNase I (Takara bio Inc., Dalian, China). Then, RNA quality was determined by the Agilent 2100 Bioanalyser, while RNA concentration was quantified using the NanoDrop 2000 spectrophotometer. Only high-quality RNA samples (OD260/280 = 1.8~2.2, OD260/230 ≥ 2.0, RIN ≥ 6.5) were used to construct cDNA libraries. To prepare cDNA libraries for sequencing, mRNA with poly (A) tail was isolated from the total RNA using oligo(dT) magnetic beads and then randomly fragmented into ~300 bp fragments. Thereafter, the double-stranded cDNA was synthesized using a SuperScript double-stranded cDNA synthesis kit (Invitrogen, Waltham, MA, USA) with random hexamer primers. The synthesized cDNA was then subjected to end-repair, phosphorylation, ‘A’ base addition, and adapter connection. Libraries were size selected for cDNA target fragments of 300 bp on 2% low-range ultra-agarose, followed by PCR amplified using Phusion DNA polymerase (NEB) for 15 PCR cycles. After purification and quantification, the paired-end cDNA libraries were sequenced with the Illumina NovaSeq 6000 platform at Shanghai Majorbio Bio-pharm Technology Co., Ltd. (Shanghai, China).

4.4. Reads Mapping, De Novo Assembly, and Unigene Annotation

The generated raw reads of each sample were trimmed for quality control using fastp program (https://github.com/OpenGene/fastp). Next, the clean reads were separately aligned to the reference genome of Penaeus vannamei (GenBank accession no: ASM378908v1) using HISAT2 software (https://daehwankimlab.github.io/hisat2/), and the mapped reads were then subjected to de novo assembly using StringTie software (http://ccb.jhu.edu/software/stringtie/). Finally, the obtained unigenes/transcripts were searched against six functional databases: NCBI non-redundant protein (NR), Swiss-Prot, Pfam, Clusters of Orthologous Groups of Proteins (COG), Gene Ontology (GO), and Kyoto Encyclopedia of Genes and Genomes (KEGG), respectively.

4.5. Identification and Functional Classification Analysis of Differential Expression Genes

The transcript abundance of unigenes/transcripts was calculated by RSEM software (http://deweylab.biostat.wisc.edu/rsem/) according to the transcripts per million reads (TPM) value. The differential expression genes (DEGs) after IE1 knockdown were identified using the DESeq2 software [40]. In addition, GO and KEGG pathway enrichment analysis of DEGs were carried out using GOATOOLS (https://github.com/tanghaibao/goatools) and KOBAS (http://kobas.cbi.pku.edu.cn).

4.6. Validation of DEGs by Real-Time Quantitative PCR (qPCR) Analysis

To validate the transcriptome data, total RNA was separately extracted from the hemocytes of dsRNA-IE1 and dsRNA-EGFP group, and then reverse-transcribed into cDNA using TransScript one-step gDNA removal and cDNA synthesis superMix (TransGen Biotech, Beijing, China) following the manufacturer’s instructions. Eight DEGs associated with DNA replication were selected for qPCR analysis using a LightCycler 480 system (Roche, Basel, Switzerland). Each qPCR reaction mixture included 10 μL of 2×RealStar Green power mixture (GenStar, Beijing, China), 1 μL of each forward and reverse primer (10 μM), 1 μL of cDNA, and 7 μL of ddH2O. The qPCR reactions were performed under the following cycling conditions: 1 cycle at 95 °C for 5 min, followed by 40 cycles at 95 °C for 15 s and 60 °C for 30 s. Each sample per group was carried out in triplicate, and the relative change in gene expression was calculated using the 2−ΔΔCT method [41] and normalized to the internal control gene PvEF1α. The primers of DEGs used for qPCR analysis are shown in Table S4.

4.7. Expression Analysis of P. vannamei MCM Complex Genes after WSSV Infection

For the WSSV challenge experiment, shrimp were intramuscularly injected with 100 µL of WSSV virions (1 × 10⁵ copies) using a sterile syringe. Meanwhile, an equivalent volume of sterile PBS was injected into shrimp and used as a negative control. At 0, 6, 12, 24 and 48 h post infection, hemocytes of each group were collected from four individual shrimp and then used for RNA and DNA isolation. The isolated RNA was then subjected to cDNA synthesis to determine the relative mRNA expression of P. vannamei MCM complex genes by qPCR analysis, as depicted above. The primer sequences of P. vannamei MCM complex genes are listed in Table S4. In addition, in order to assess whether WSSV is well-propagated, the genomic DNA per group was extracted using the TIANamp Marine Animals DNA Kit (TianGen, Beijing, China) and used to calculate the viral loads using absolute qPCR according to our previous method [42].

4.8. Detection of Viral Genes’ Expression and Viral Loads after PvMCM2 Knockdown

To explore the roles of the P. vannamei MCM complex in WSSV infection, RNAi assay was performed as described above with slight modification. Briefly, the dsRNA specific for PvMCM2 and EGFP (designated as dsRNA-PvMCM2 and dsRNA-EGFP) was synthesized in vitro using a commercial dsRNA synthesis kit. The primer sequences used for dsRNA synthesis are provided in Table S4. For the RNAi experiment, shrimp were intramuscularly injected with 10 μg of dsRNA-PvMCM2 or dsRNA-EGFP (negative control) using a sterile syringe with a 22-gauge needle, followed by another injection with 5 μg of dsRNA-PvMCM2 or dsRNA-EGFP after 24 h. Next, shrimp from each group were further injected with 100 μL of WSSV virions (1 × 10⁵ copies) at 24 h post the second dsRNA injection. At 12, 24, and 48 h post virus infection, hemocytes per group were harvested and immediately subjected to isolate the RNA and DNA. Finally, after evaluating the knockdown efficiency of PvMCM2, the mRNA expression of WSSV genes (i.e., IE1 and VP28) and viral loads were quantified using qPCR analysis as described above.

4.9. Plasmid Transfection and Analysis of MCM Complex Genes’ Expression and DNA Synthesis

High-Five (BTI-TN-5B1-4) cells were seeded on a 24-well cell culture plate and maintained in Express Five SFM medium (Invitrogen, Waltham, MA, USA) overnight. For plasmid transfection, the IE1 expression plasmid pIZ-V5-IE1 (1 µg), which was constructed in our previous study [26], was transfected into cells using the FuGENE HD transfection reagent (Promega, Madison, WI, USA) following manufacturer’s instructions. An equal amount of empty vector pIZ-V5-His (Invitrogen, Waltham, MA, USA) was transfected and used as a negative control. At 24 h post transfection, cells were harvested and used for qPCR and DNA synthesis analysis. The qPCR assays were performed as described in Section 4.6, and the primers used for amplification of MCM complex genes and internal reference (EF1α) are shown in Table S4. The DNA synthesis assays were carried out using BeyoClick™ EdU Cell Proliferation Kit with Alexa Fluor 488 (Beyotime, Nantong, China) according to manufacturer’s protocol. In brief, the 5-Ethynyl-20-deoxyuridine (EdU) agent was added to each well and incubated with cells for 3 h. The cells were then fixed in 4% paraformaldehyde (PFA) for 20 min at room temperature. After three washes with PBS containing 3% BSA, the cells were permeabilized with PBS containing 0.3% TritonX-100 for 10 min, followed by three washes with PBS containing 3% BSA. Lastly, the cells were incubated with Click Reaction System containing Alexa Fluor 488 for 30 min at room temperature. After three washes with PBS, a flow cytometer and BD Accuri™ C6 Plus software (BD Biosciences, Franklin Lakes, NJ, USA) were used for EdU detection.

4.10. Western Blot Analysis

The High-Five cells transfected with the plasmid pIZ-V5-His or pIZ-V5-IE1 were harvested and lysed using Western and IP cell lysis buffer (Beyotime, Nantong, China). The prepared protein samples were separated by SDS-PAGE and then electroblotted onto PVDF membranes (Millipore, Burlington, MA, USA). Next, the membranes were blocked with 5% skim milk dissolved in TBST (20 mM Tris, 150 mM NaCl, 0.1% Tween 20, pH 7.6) at room temperature for 1 h. After blocking, the membranes were incubated with mouse anti-V5 (Sangon, Shanghai, China) or anti-tubulin (Sigma-Aldrich, St. Louis, MO, USA) for 2 h at room temperature, followed by incubation with the HRP-conjugated goat anti-mouse IgG secondary antibody (Invitrogen, Waltham, MA, USA) for 1 h at room temperature. After three washes, the membranes were then reacted with Immobilon Western Chemiluminescent HRP Substrate (Millipore, Burlington, MA, USA), and protein signals were detected using Amersham Imager 600 (GE Healthcare, Chicago, IL, USA).

Supplementary Materials

The following supporting information can be downloaded at: https://www.mdpi.com/article/10.3390/ijms23158176/s1.

Author Contributions

Conceptualization, D.Y; methodology, Y.C., G.W., C.W. and D.Y.; investigation, Y.C., G.W., C.W., H.Z. and J.Z.; writing—original draft preparation, Y.C. and D.Y.; writing—review and editing, Y.Z. and Z.L.; funding acquisition, D.Y. and Y.Z. All authors have read and agreed to the published version of the manuscript.

Funding

This work was funded by the National Natural Science Foundation of China (Nos. 31702387 and 32173017), Science and Technology Planning Project of Guangdong Province (STKJ2021188) and Shantou University Scientific Research Foundation for Talents (No. NTF20008).

Institutional Review Board Statement

Not applicable.

Informed Consent Statement

Not applicable.

Data Availability Statement

The transcriptome sequencing data have been deposited to the GenBank database under accession number PRJNA827974. The data supporting the findings of this study are available within the article and its Supplementary Materials.

Conflicts of Interest

The authors declare no conflict of interest.

References

  1. Leu, J.H.; Yang, F.; Zhang, X.; Xu, X.; Kou, G.H.; Lo, C.F. Whispovirus. Curr. Top. Microbiol. Immunol. 2009, 328, 197–227. [Google Scholar] [PubMed]
  2. Escobedo-Bonilla, C.M.; Alday-Sanz, V.; Wille, M.; Sorgeloos, P.; Pensaert, M.B.; Nauwynck, H.J. A review on the morphology, molecular characterization, morphogenesis and pathogenesis of white spot syndrome virus. J. Fish Dis. 2008, 31, 1–18. [Google Scholar] [CrossRef] [PubMed]
  3. Yang, F.; He, J.; Lin, X.H.; Li, Q.; Pan, D.; Zhang, X.B.; Xu, X. Complete genome sequence of the shrimp white spot bacilliform virus. J. Virol. 2001, 75, 11811–11820. [Google Scholar] [CrossRef] [PubMed] [Green Version]
  4. Xie, X.X.; Xu, L.M.; Yang, F. Proteomic analysis of the major envelope and nucleocapsid proteins of white spot syndrome virus. J. Virol. 2006, 80, 10615–10623. [Google Scholar] [CrossRef] [Green Version]
  5. Zheng, S.C.; Xu, J.Y.; Liu, H.P. Cellular entry of white spot syndrome virus and antiviral immunity mediated by cellular receptors in crustaceans. Fish Shellfish Immunol. 2019, 93, 580–588. [Google Scholar] [CrossRef]
  6. Verbruggen, B.; Bickley, L.K.; van Aerle, R.; Bateman, K.S.; Stentiford, G.D.; Santos, E.M.; Tyler, C.R. Molecular mechanisms of white spot syndrome virus infection and perspectives on treatments. Viruses 2016, 8, 23. [Google Scholar] [CrossRef] [Green Version]
  7. Li, C.Z.; Weng, S.P.; He, J.G. WSSV-host interaction: Host response and immune evasion. Fish Shellfish Immunol. 2019, 84, 558–571. [Google Scholar] [CrossRef]
  8. Xu, D.D.; Liu, W.F.; Alvarez, A.; Huang, T.Z. Cellular immune responses against viral pathogens in shrimp. Dev. Comp. Immunol. 2014, 47, 287–297. [Google Scholar] [CrossRef]
  9. Marks, H.; Vorst, O.; van Houwelingen, A.; van Hulten, M.C.W.; Vlak, J.M. Gene-expression profiling of white spot syndrome virus in vivo. J. Gen. Virol. 2005, 86 Pt 7, 2081–2100. [Google Scholar] [CrossRef]
  10. Rodriguez, M.C.; Dybas, J.M.; Hughes, J.; Weitzman, M.D.; Boutell, C. The HSV-1 ubiquitin ligase ICP0: Modifying the cellular proteome to promote infection. Virus Res. 2020, 285, 198015. [Google Scholar] [CrossRef]
  11. Martinez, F.P.; Cosme, R.S.C.; Tang, Q.Y. Murine cytomegalovirus major immediate-early protein 3 interacts with cellular and viral proteins in viral DNA replication compartments and is important for early gene activation. J. Gen. Virol. 2010, 91, 2664–2676. [Google Scholar] [CrossRef] [PubMed]
  12. Torres, L.; Tang, Q. Immediate-Early (IE) gene regulation of cytomegalovirus: IE1- and pp71-mediated viral strategies against cellular defenses. Virol. Sin. 2014, 29, 343–352. [Google Scholar] [CrossRef] [PubMed] [Green Version]
  13. Li, F.; Li, M.Y.; Ke, W.; Ji, Y.C.; Bian, X.F.; Yan, X.M. Identification of the immediate-early genes of white spot syndrome virus. Virology 2009, 385, 267–274. [Google Scholar] [CrossRef] [PubMed] [Green Version]
  14. Lin, F.Y.; Huang, H.; Xu, L.M.; Li, F.; Yang, F. Identification of three immediate-early genes of white spot syndrome virus. Arch. Virol. 2011, 156, 1611–1614. [Google Scholar] [CrossRef] [PubMed]
  15. Liu, W.J.; Chang, Y.S.; Wang, C.H.; Kou, G.H.; Lo, C.F. Microarray and RT-PCR screening for white spot syndrome virus immediate-early genes in cycloheximide-treated shrimp. Virology 2005, 334, 327–341. [Google Scholar] [CrossRef] [Green Version]
  16. Liu, W.J.; Chang, Y.S.; Wang, A.H.; Kou, G.H.; Lo, C.F. White spot syndrome virus annexes a shrimp STAT to enhance expression of the immediate-early gene ie1. J. Virol. 2007, 81, 1461–1471. [Google Scholar] [CrossRef] [Green Version]
  17. Huang, X.D.; Zhao, L.; Zhang, H.Q.; Xu, X.P.; Jia, X.T.; Chen, Y.H.; Wang, P.H.; Weng, S.P.; Yu, X.Q.; Yin, Z.X.; et al. Shrimp NF- κB binds to the immediate-early gene ie1 promoter of white spot syndrome virus and upregulates its activity. Virology 2010, 406, 176–180. [Google Scholar] [CrossRef] [Green Version]
  18. Wang, S.; Li, H.Y.; Weng, S.P.; Li, C.Z.; He, J.G. White spot syndrome virus establishes a novel IE1/JNK/c-Jun positive feedback loop to drive replication. iScience 2020, 23, 100752. [Google Scholar] [CrossRef] [Green Version]
  19. Yao, D.F.; Ruan, L.W.; Lu, H.S.; Shi, H.; Xu, X. Shrimp STAT was hijacked by white spot syndrome virus immediate-early protein IE1 involved in modulation of viral genes. Fish Shellfish Immunol. 2016, 59, 268–275. [Google Scholar] [CrossRef]
  20. Chang, L.K.; Huang, P.H.; Shen, W.T.; Yang, S.H.; Liu, W.J.; Lo, C.F. Role of Penaeus monodon Kruppel-like factor (PmKLF) in infection by white spot syndrome virus. Dev. Comp. Immunol. 2012, 36, 121–129. [Google Scholar] [CrossRef]
  21. Huang, P.H.; Huang, T.Y.; Cai, P.S.; Chang, L.K. Role of Litopenaeus vannamei Yin Yang 1 in the regulation of the white spot syndrome virus immediate early gene ie1. J. Virol. 2017, 91, e02314-16. [Google Scholar] [CrossRef] [PubMed] [Green Version]
  22. Liu, W.J.; Chang, Y.S.; Wang, H.C.; Leu, J.H.; Kou, G.H.; Lo, C.F. Transactivation, dimerization, and DNA-binding activity of white spot syndrome virus immediate-early protein IE1. J. Virol. 2008, 82, 11362–11373. [Google Scholar] [CrossRef] [PubMed] [Green Version]
  23. Ran, X.Z.; Bian, X.F.; Ji, Y.C.; Yan, X.M.; Yang, F.; Li, F. White spot syndrome virus IE1 and WSV056 modulate the G1/S transition by binding to the host retinoblastoma protein. J. Virol. 2013, 87, 12576–12582. [Google Scholar] [CrossRef] [PubMed] [Green Version]
  24. Sun, J.Z.; Ruan, L.W.; Zhou, C.Z.; Shi, H.; Xu, X. Characterization and function of a beta-catenin homolog from Litopenaeus vannamei in WSSV infection. Dev. Comp. Immunol. 2017, 76, 412–419. [Google Scholar] [CrossRef] [PubMed]
  25. Ruan, L.W.; Sun, J.Z.; Zhou, C.Z.; Shi, H.; Lei, K.Y. Cloning, identification and function analysis of a Chibby homolog from Litopenaeus vannamei. Fish Shellfish Immunol. 2018, 78, 114–120. [Google Scholar] [CrossRef]
  26. Wang, C.Q.; Wei, M.H.; Wu, G.C.; He, L.X.; Zhu, J.H.; Aweya, J.J.; Chen, X.L.; Zhao, Y.Z.; Zhang, Y.L.; Yao, D.F. Proteomics analysis reveals a critical role for the WSSV immediate-early protein IE1 in modulating the host prophenoloxidase system. Virulence 2022, 13, 936–948. [Google Scholar] [CrossRef]
  27. Maiorano, D.; Lutzmann, M.; Mechali, M. MCM proteins and DNA replication. Curr. Opin. Cell Biol. 2006, 18, 130–136. [Google Scholar] [CrossRef]
  28. Chen, L.L.; Wang, H.C.; Huang, C.J.; Peng, S.E.; Chen, Y.G.; Lin, S.J.; Chen, W.Y.; Dai, C.F.; Yu, H.T.; Wang, C.H.; et al. Transcriptional analysis of the DNA polymerase gene of shrimp white spot syndrome virus. Virology 2002, 301, 136–147. [Google Scholar] [CrossRef] [Green Version]
  29. Zang, K.; Li, F.H.; Ma, Q.J. The dUTPase of white spot syndrome virus assembles its active sites in a noncanonical manner. J. Biol. Chem. 2018, 293, 1088–1099. [Google Scholar] [CrossRef] [Green Version]
  30. Chaudhuri, B.; Xu, H.Z.; Todorov, I.; Dutta, A.; Yates, J.L. Human DNA replication initiation factors, ORC and MCM, associate with oriP of Epstein-Barr virus. Proc. Natl. Acad. Sci. USA 2001, 98, 10085–10089. [Google Scholar] [CrossRef] [Green Version]
  31. Kawaguchi, A.; Nagata, K. De novo replication of the influenza virus RNA genome is regulated by DNA replicative helicase, MCM. Embo J. 2007, 26, 4566–4575. [Google Scholar] [CrossRef] [PubMed] [Green Version]
  32. Dabral, P.; Uppal, T.; Rossetto, C.C.; Verma, S.C. Minichromosome maintenance proteins cooperate with LANA during the G1/S phase of the cell cycle to support viral DNA replication. J. Virol. 2019, 93, e02256-18. [Google Scholar] [CrossRef] [PubMed] [Green Version]
  33. Wang, Z.; Zhu, F. Minichromosome maintenance protein 7 regulates phagocytosis in kuruma shrimp Marsupenaeus japonicas against white spot syndrome virus. Fish Shellfish Immunol. 2016, 55, 293–303. [Google Scholar] [CrossRef]
  34. Zhu, F.; Qian, X.Y.; Wang, Z.Y. Molecular characterization of minichromosome maintenance protein (MCM7) in Scylla paramamosain and its role in white spot syndrome virus and Vibrio alginolyticus infection. Fish Shellfish Immunol. 2018, 83, 104–114. [Google Scholar] [CrossRef]
  35. Liu, W.J.; Chang, Y.S.; Huang, W.T.; Chen, I.T.; Wang, K.C.H.C.; Kou, G.H.; Lo, C.F. Penaeus monodon TATA box-binding protein interacts with the white spot syndrome virus transactivator IE1 and promotes its transcriptional activity. J. Virol. 2011, 85, 6535–6547. [Google Scholar] [CrossRef] [Green Version]
  36. Ohtani, K.; Iwanaga, R.; Nakamura, M.; Ikeda, M.; Yabuta, N.; Tsuruga, H.; Nojima, H. Cell growth-regulated expression of mammalian MCM5 and MCM6 genes mediated by the transcription factor E2F. Oncogene 1999, 18, 2299–2309. [Google Scholar] [CrossRef] [Green Version]
  37. Bruemmer, D.; Yin, F.; Liu, J.; Kiyono, T.; Fleck, E.; Van Herle, A.J.; Law, R.E. Rapamycin inhibits E2F-dependent expression of minichromosome maintenance proteins in vascular smooth muscle cells. Biochem. Biophys. Res. Commun. 2003, 303, 251–258. [Google Scholar] [CrossRef]
  38. Xie, X.X.; Li, H.Y.; Xu, L.M.; Yang, F. A simple and efficient method for purification of intact white spot syndrome virus (WSSV) viral particles. Virus Res. 2005, 108, 63–67. [Google Scholar] [CrossRef]
  39. Zhou, Q.; Qi, Y.P.; Yang, F. Application of spectrophotometry to evaluate the concentration of purified white spot syndrome virus. J. Virol. Methods 2007, 146, 288–292. [Google Scholar] [CrossRef]
  40. Love, M.I.; Huber, W.; Anders, S. Moderated estimation of fold change and dispersion for RNA-seq data with DESeq2. Genome Biol. 2014, 15, 550. [Google Scholar] [CrossRef] [Green Version]
  41. Livak, K.J.; Schmittgen, T.D. Analysis of relative gene expression data using real-time quantitative PCR and the 2(-Delta C(T)) Method. Methods 2001, 25, 402–408. [Google Scholar] [CrossRef] [PubMed]
  42. Zhan, S.X.; Aweya, J.J.; Wang, F.; Yao, D.F.; Zhong, M.Q.; Chen, J.H.; Li, S.K.; Zhang, Y.L. Litopenaeus vannamei attenuates white spot syndrome virus replication by specific antiviral peptides generated from hemocyanin. Dev. Comp. Immunol. 2019, 91, 50–61. [Google Scholar] [CrossRef] [PubMed]
Figure 1. IE1 knockdown and transcriptome sequencing (A) Workflow of IE1 knockdown in WSSV-infected shrimp and sample preparations for transcriptome sequencing. (B,C) Knockdown efficiency analysis of IE1 using qPCR and Western blot assay. Shrimp were injected with dsRNA-IE1 and dsRNA-EGFP, respectively. At 12 h post dsRNA injection, shrimp of each group were further challenged with WSSV. After infection for 24 h, hemocytes per group were harvested and used for knockdown efficiency analysis of IE1 by qPCR and Western blot analysis, followed by transcriptome sequencing. The qPCR data were shown as mean ± SD, and the statistical significance was computed by Student’s t-test (** indicates p < 0.01).
Ijms 23 08176 g001
Figure 2. Volcano diagram of the DEGs in WSSV−infected shrimp after IE1 knockdown. The x−axis indicates the fold change of unigenes/transcripts between dsRNA−IE1 and dsRNA−EGFP group, and the y−axis shows the statistical significance of the differences (p value). Red dots represent the DEGs that are significantly upregulated, whereas green dots represent the DEGs that are significantly downregulated. The gray dots represent the DEGs that have no significant difference.
Ijms 23 08176 g002
Figure 3. Functional classification analysis of the identified DEGs. (A) GO annotation analysis of the DEGs. The DEGs were classified into different GO terms according to biological process, molecular function, and cellular component. (B) KEGG pathway annotation analysis of the DEGs. The DEGs were categorized into various KEGG pathways according to metabolism, genetic information processing, environmental information processing, and cellular processes.
Ijms 23 08176 g003
Figure 4. GO and KEGG pathway enrichment analysis of the identified DEGs. (A) Top20 of GO term enrichment. (B) Top20 of KEGG pathway enrichment. The y−axis indicates the GO term or KEGG pathway. The bottom x−axis indicates the number of DEGs in each GO term or KEGG pathway. The upper x−axis represents the significance level of enrichment.
Ijms 23 08176 g004
Figure 5. Validation of DEGs by qPCR analysis. (A) Heatmap of the DNA-replication-related DEGs in transcriptome sequencing data. (B) qPCR validation analysis of the DEGs. The data were shown as mean ± SD, and the statistical significance was determined by Student’s t-test (* indicates p < 0.05; and ** indicates p < 0.01).
Ijms 23 08176 g005
Figure 6. P. vannamei MCM complex genes are upregulated upon WSSV infection. (AE) qPCR analysis of PvMCM2, PvMCM3, PvMCM4, PvMCM5, and PvMCM7 expression after WSSV challenge. (F) qPCR analysis of virus copies number (viral loads). Shrimp were separately injected with WSSV or PBS (negative control). At 0, 6, 12, 24, and 48 h post viral infection, hemocytes per group were harvested and then used to determine the expression of P. vannamei MCM complex genes and viral loads using qPCR. All the qPCR assays were carried out in triplicate for each sample. The data were shown as mean ± SD, and the statistical significance between each group was analyzed by Student’s t-test (* indicates p < 0.05, and ** indicates p < 0.01).
Ijms 23 08176 g006
Figure 7. PvMCM2 knockdown inhibits WSSV replication at the early infection stage. (A) Knockdown efficiency analysis of PvMCM2. (BD) qPCR analysis of WSSV genes’ expression (IE1 and VP28) and viral loads after PvMCM2 knockdown. Shrimp were separately injected twice with dsRNA-PvMCM2 and dsRNA-EGFP (negative control), followed by WSSV infection. At 12, 24, and 48 h post viral infection, hemocytes were collected and used to detect the knockdown efficiency of PvMCM2, expression of WSSV genes, and viral loads using qPCR analysis. For each sample, triplicate qPCR assays were performed, and the data were shown as mean ± SD. Significant differences were computed using the Student’s t-test (* indicates p < 0.05, and ** indicates p < 0.01).
Ijms 23 08176 g007
Figure 8. Overexpression of IE1 promotes the expression of MCM complex genes and the cellular DNA synthesis in High-Five cells. (A) Western blot analysis of IE1 expression in High-Five cells. (B) qPCR analysis of MCM complex genes’ expression after IE1 overexpression. (C) Analysis of DNA synthesis in IE1-expressed cells using EdU staining and flow cytometry. M2: EdU unlabeled cells, M1: EdU labeled cells. (D) Statistical analysis of DNA synthesis in IE1-expressed cells corresponding to (C). High-Five cells were transiently transfected with the plasmid pIZ-V5-IE1 and pIZ-V5-His (negative control), respectively. At 24 h post transfection, cells per group were harvested and used for Western blot/qPCR analysis and EdU staining. All the experiments were performed in triplicates, and the data were analyzed statistically by Student’s t test (* indicates p < 0.05, ** indicates p < 0.01).
Ijms 23 08176 g008
Publisher’s Note: MDPI stays neutral with regard to jurisdictional claims in published maps and institutional affiliations.

