Article

Crosstalk between Growth and Osmoregulation of GHRH-SST-GH-IGF Axis in Triploid Rainbow Trout (Oncorhynchus mykiss)

Key Laboratory of Mariculture, Ministry of Education (KLMME), Ocean University of China, Qingdao 266003, China
*
Authors to whom correspondence should be addressed.
Int. J. Mol. Sci. 2022, 23(15), 8691; https://doi.org/10.3390/ijms23158691
Submission received: 6 July 2022 / Revised: 29 July 2022 / Accepted: 29 July 2022 / Published: 4 August 2022
(This article belongs to the Section Molecular Biology)

Abstract

:
Smolting is an important development stage of salmonid, and an energy trade-off occurs between osmotic regulation and growth during smolting in rainbow trout (Oncorhynchus mykiss). Growth hormone releasing hormone, somatostatin, growth hormone and insulin-like growth factor (GHRH-SST-GH-IGF) axis exhibit pleiotropic effects in regulating growth and osmotic adaptation. Due to salmonid specific genome duplication, increased paralogs are identified in the ghrh-sst-gh-igf axis, however, their physiology in modulating osmoregulation has yet to be investigated. In this study, seven sst genes (sst1a, sst1b, sst2, sst3a, sst3b, sst5, sst6) were identified in trout. We further investigated the ghrh-sst-gh-igf axis of diploid and triploid trout in response to seawater challenge. Kidney sst (sst1b, sst2, sst5) and sstr (sstr1b1, sstr5a, sstr5b) expressions were changed (more than 2-fold increase (except for sstr5a with 1.99-fold increase) or less than 0.5-fold decrease) due to osmoregulation, suggesting a pleiotropic physiology of SSTs in modulating growth and smoltification. Triploid trout showed significantly down-regulated brain sstr1b1 and igfbp2a1 (p < 0.05), while diploid trout showed up-regulated brain igfbp1a1 (~2.61-fold, p = 0.057) and igfbp2a subtypes (~1.38-fold, p < 0.05), suggesting triploid trout exhibited a better acclimation to the seawater environment. The triploid trout showed up-regulated kidney igfbp5a subtypes (~6.62 and 7.25-fold, p = 0.099 and 0.078) and significantly down-regulated igfbp5b2 (~0.37-fold, p < 0.05), showing a conserved physiology of teleost IGFBP5a in regulating osmoregulation. The IGFBP6 subtypes are involved in energy and nutritional regulation. Distinctive igfbp6 subtypes patterns (p < 0.05) potentially indicated trout triggered energy redistribution in brain and kidney during osmoregulatory regulation. In conclusion, we showed that the GHRH-SST-GH-IGF axis exhibited pleiotropic effects in regulating growth and osmoregulatory regulation during trout smolting, which might provide new insights into seawater aquaculture of salmonid species.

1. Introduction

Rainbow trout (Oncorhynchus mykiss) are an important salmonid fish cultured all over the world. Rainbow trout and steelhead are the same species (Oncorhynchus mykiss) with different lifestyles (National Wildlife Federation, NWF), rainbow trout are landlocked and spend their life mostly (or entirely) in freshwater; while steelhead is an anadromous species, and the juveniles start out in freshwater and then exhibit migration to marine environments [1,2]. Due to anthropogenic activities (with the resulting global climate change), freshwater is becoming increasingly precious, and a Nature paper reported that “80% of the world’s population is exposed to high levels of threat to water security” [3,4]. Global warming results in rising temperatures in ocean and freshwater ecosystems [5,6]. Two recent papers published in Nature series (2017 and 2021) demonstrated the global warming threats to global fishery biodiversity, especially the freshwater faunas [7,8]. Therefore, the two greatest challenges for salmonid culture are reduced freshwater resources (hatcheries) for juveniles and increased water temperature in summer. The Yellow Sea is a semi-closed part of the Pacific Ocean, which is near to the Chinese mainland. In the Yellow Sea, the Yellow Sea Cold Water Mass presents a cold-water mass in summer (<10 °C), which is excellent for summer salmonid culture [9].
Sexual maturation leads to significant reduction of somatic growth in fish. The triploid trout fry can be artificially manufactured by inhibiting the excretion of the second polar body after fertilization, such as hydrostatic treatment [10]. Compared to diploid species, triploid trout exhibited a better growth performance with increased market value due to infertility [11]. Moreover, farm diploid salmonid are known to escape, interbreed, and compete with wild salmonid and non-salmonid species, thus disturbing the aquatic ecosystem [12]. The escaped triploid individuals do not risk a great biological hazard to the natural environment and natural fish populations because of their sterility [13]. Given that salmonid species are not natural fish populations in the Yellow Sea Cold Water Mass, culturing infertile triploid trout is the most effective strategy for environmentally friendly aquaculture.
Salmonids exhibit significant appearance changes and physiological alterations during down-stream migration, which is called smolting [14]. For example, salmonids exhibit changes in morphology in response to increased salinity, including a more streamlined body, darker fin margins, loss of body spots, and silver throughout their bodies [15]. Fish osmoregulation is regulated by multiple endocrine regulators including the growth hormone (GH), and insulin-like growth factor (IGF) [15,16]. The GH-IGF axis is regulated by several endocrine regulators of growth hormone releasing hormone (GHRH), somatostatin (SST), GH receptor (GHR), IGF receptor (IGFR), and IGF binding proteins (IGFBPs) [17]. In addition to the canonical function of regulating growth, the GH-IGF axis also serves as a pleiotropic governor for immunomodulation and osmoregulatory regulation [18,19,20,21]. Previous studies have found that the injection of GH and IGF-1 can both improve salinity tolerance of juvenile Atlantic salmon (Salmo salar), and the effect of GH is better than IGF-1 [22]. Similarly, tilapia (Oreochromis mossambicus) stimulated with GH can enhance the salt resistance, and the Na+, K+-ATPase activity on gill [23].
IGFBPs not only regulate IGF signaling pathways and functions, but are also involved in diverse functions beyond IGF regulation [24]. Seawater exposure (30 ppt) results in significantly increased serum IGFBP1 subtypes rather than IGFBP-2B in Chinook salmon (Oncorhynchus tshawytscha) parr [25]. Microarray analysis showed that igfbp1 had a strong relationship with high salinity adaptation in Coho Salmon (Oncorhynchus kisutch) [26]. Studies in Atlantic salmon showed expression of branchial igfbp6b subtypes coincidentally increased with smoltification while the igfbp5 subtypes significantly decreased following seawater (35 ppt) exposure [27]. The following study further showed branchial exhibits igfbp5b2 expression in parallel with Na+/K+-ATPase activity and transcriptional signature of ion transporters (channels) mRNA levels [28].
Smolting is an important process of development, physiology, and behavior, which enables wild trout migration to marine environments and farmed trout to be farmed in net cages in the sea [29,30]. The GHRH-SST-GH-IGF axis is involved in energy trade-off of multiple functions of growth, immunity, and osmoregulation [14,19,28]. The salmonid specific genome duplication results in increased paralogs in the ghrh-sst-gh-igf axis [31,32,33]. However, functional divergence of these novel paralogs in response to seawater exposure are still limited in diploid and triploid trout. To further understand the effect of the GHRH-SST-GH-IGF axis in seawater exposure between diploid and triploid trout and explore the novel regulatory mechanisms of trout osmoregulation and the candidates of genetic breeding for seawater trout culture, we investigated the sst gene repertoire, and then evaluated the physiology of the ghrh-sst-gh-igf axis in response to seawater exposure between diploid and triploid trout.

2. Results

2.1. Identification of Rainbow Trout sst Genes

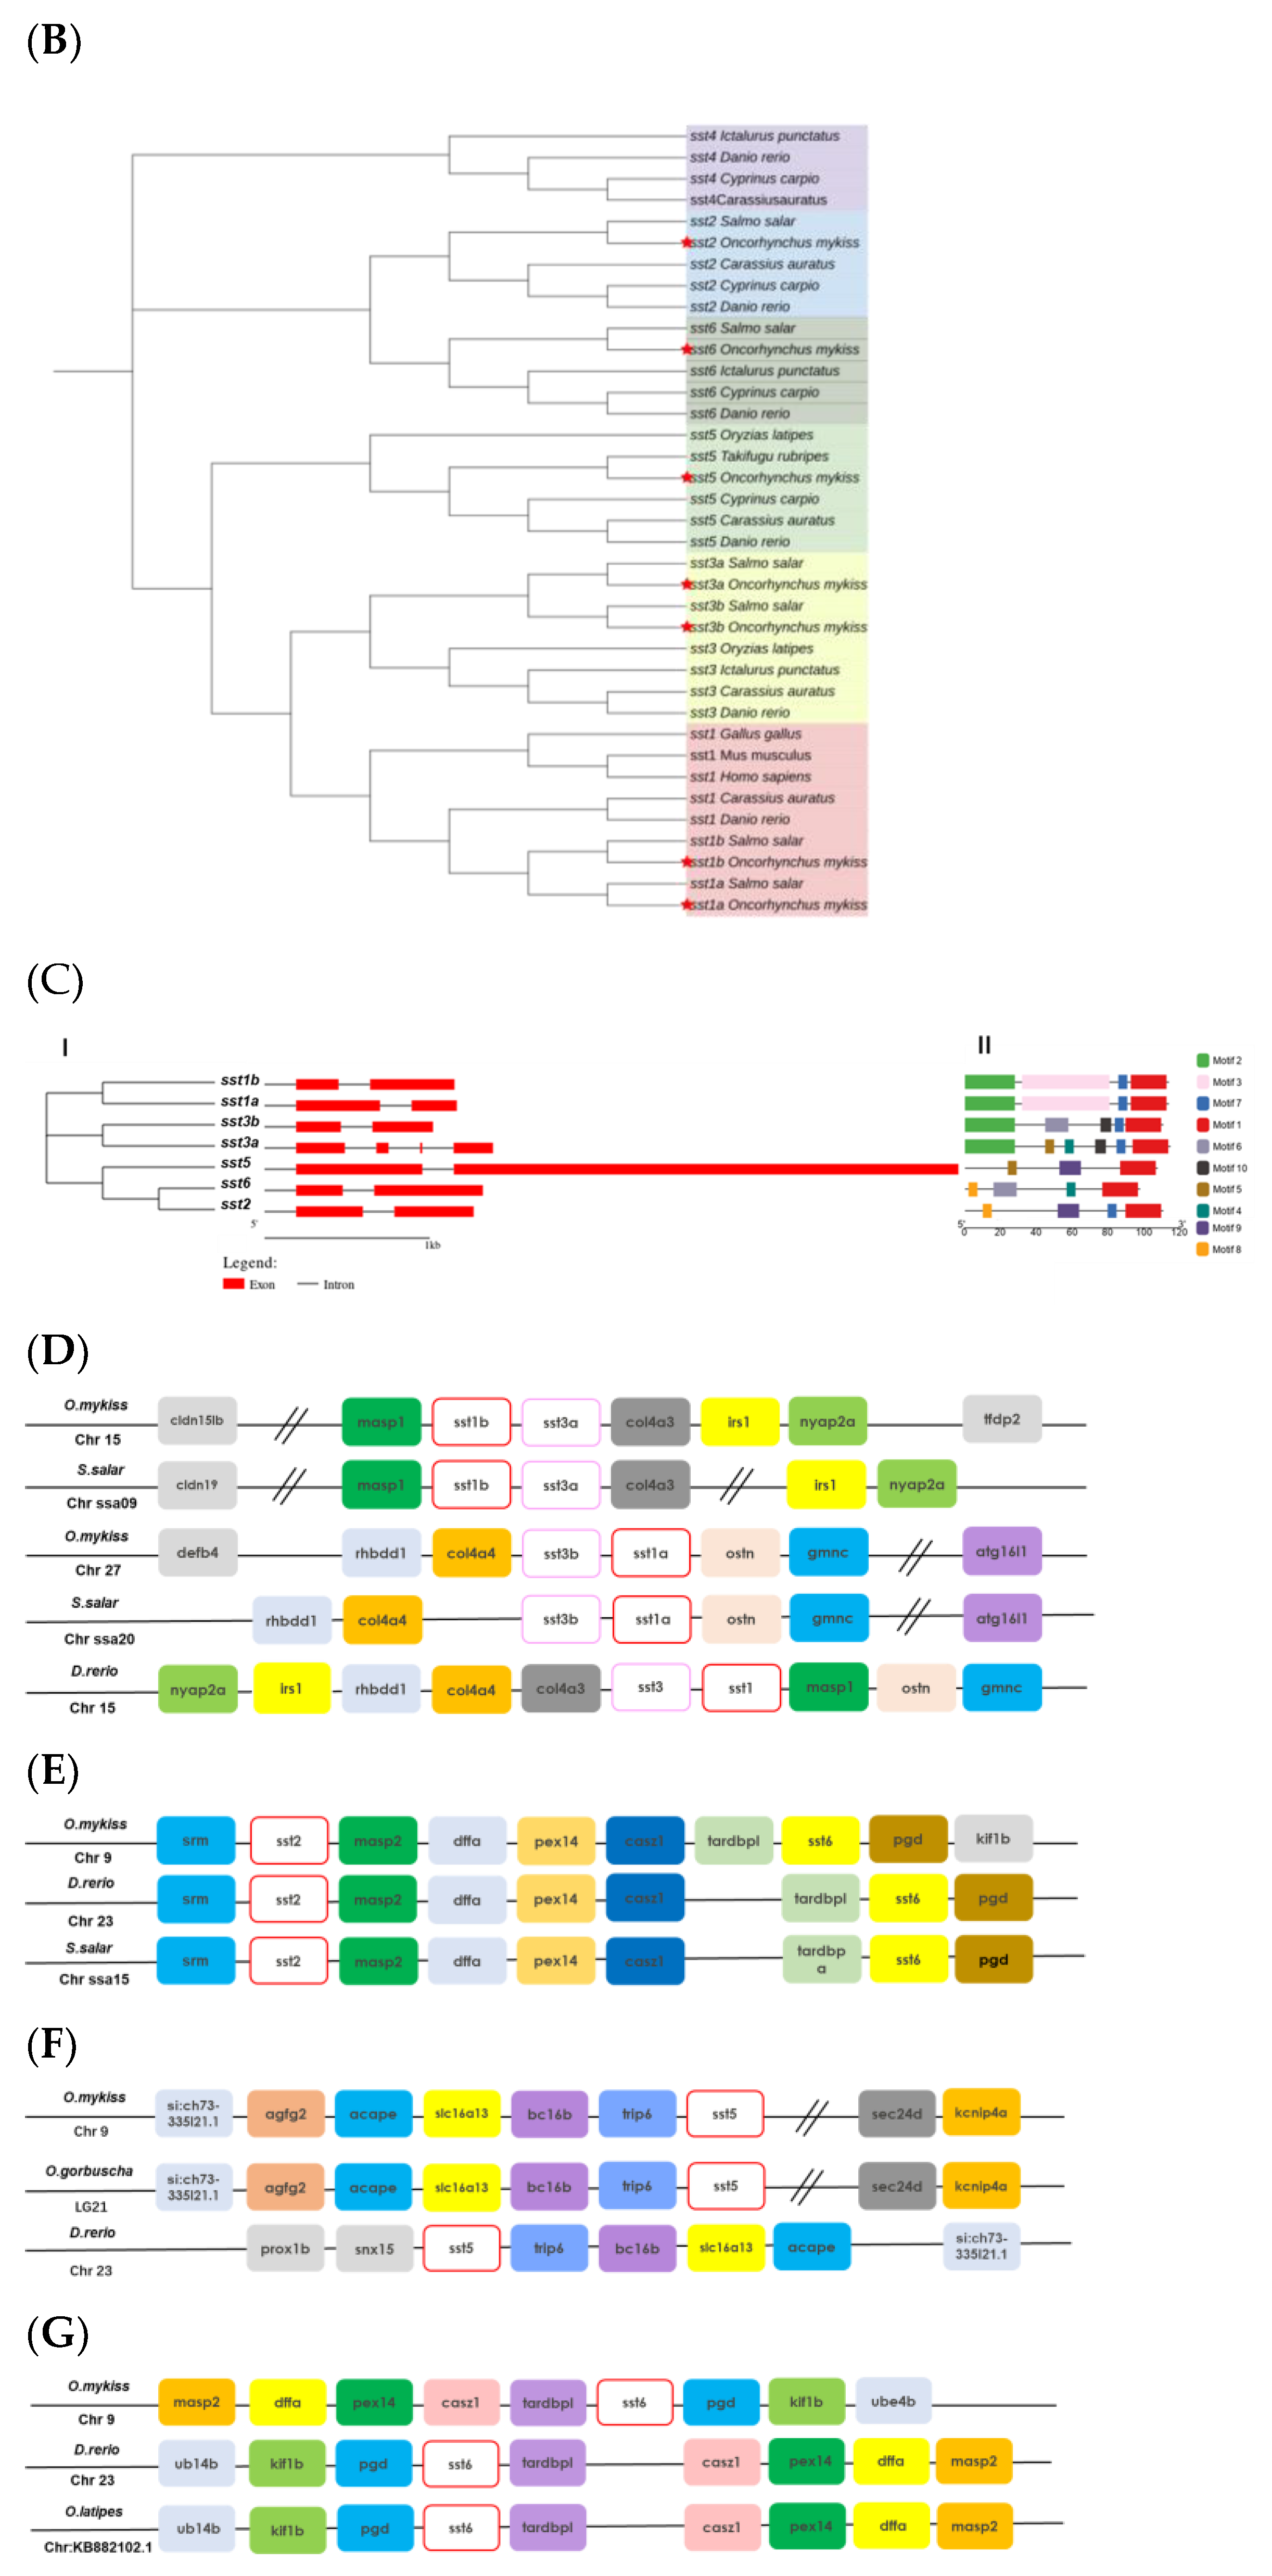
Totally, seven sst genes (sst1a, sst1b, sst2, sst3a, sst3b, sst5, sst6) were identified in rainbow trout (Table 1), and these sst genes were localized in three different chromosomes of 9 (sst2, sst5, sst6), 15 (sst1b, sst3a), and 27 (sst1a, sst3b) (Figure 1A). The amino acids sequences of SST proteins ranged from 98 to 115 amino acids (Table 1). Multiple sequence alignments of trout SST with vertebrate orthologues are shown in Figure S1. The phylogenetic analysis showed trout sst could divide into six subgroups with two duplicates genes of sst1 (sst1a and sst1b) and sst3 (sst3a and sst3b) (Figure 1B). The sst4 was absent in rainbow trout (Figure 1B). Exon-intron structure showed most of the sst genes exerted two exons while sst3a exhibited four exons (Figure 1C). Compared to two SST1 subtypes, a significant alteration of motif structures was observed between SST3a and SST3b, potentially leading to functional diversity (Figure 1C). Syntenic analysis showed sst1 and sst3 subtypes exerted conserved alignments with neighboring genes between rainbow trout and Atlantic salmon (Figure 1D). The sst2, sst5, sst6 exhibited synteny homolog in teleosts (Figure 1E–G).

2.2. Basal Expression of ghrh-gh-sst-igf Axis in Triploid Trout

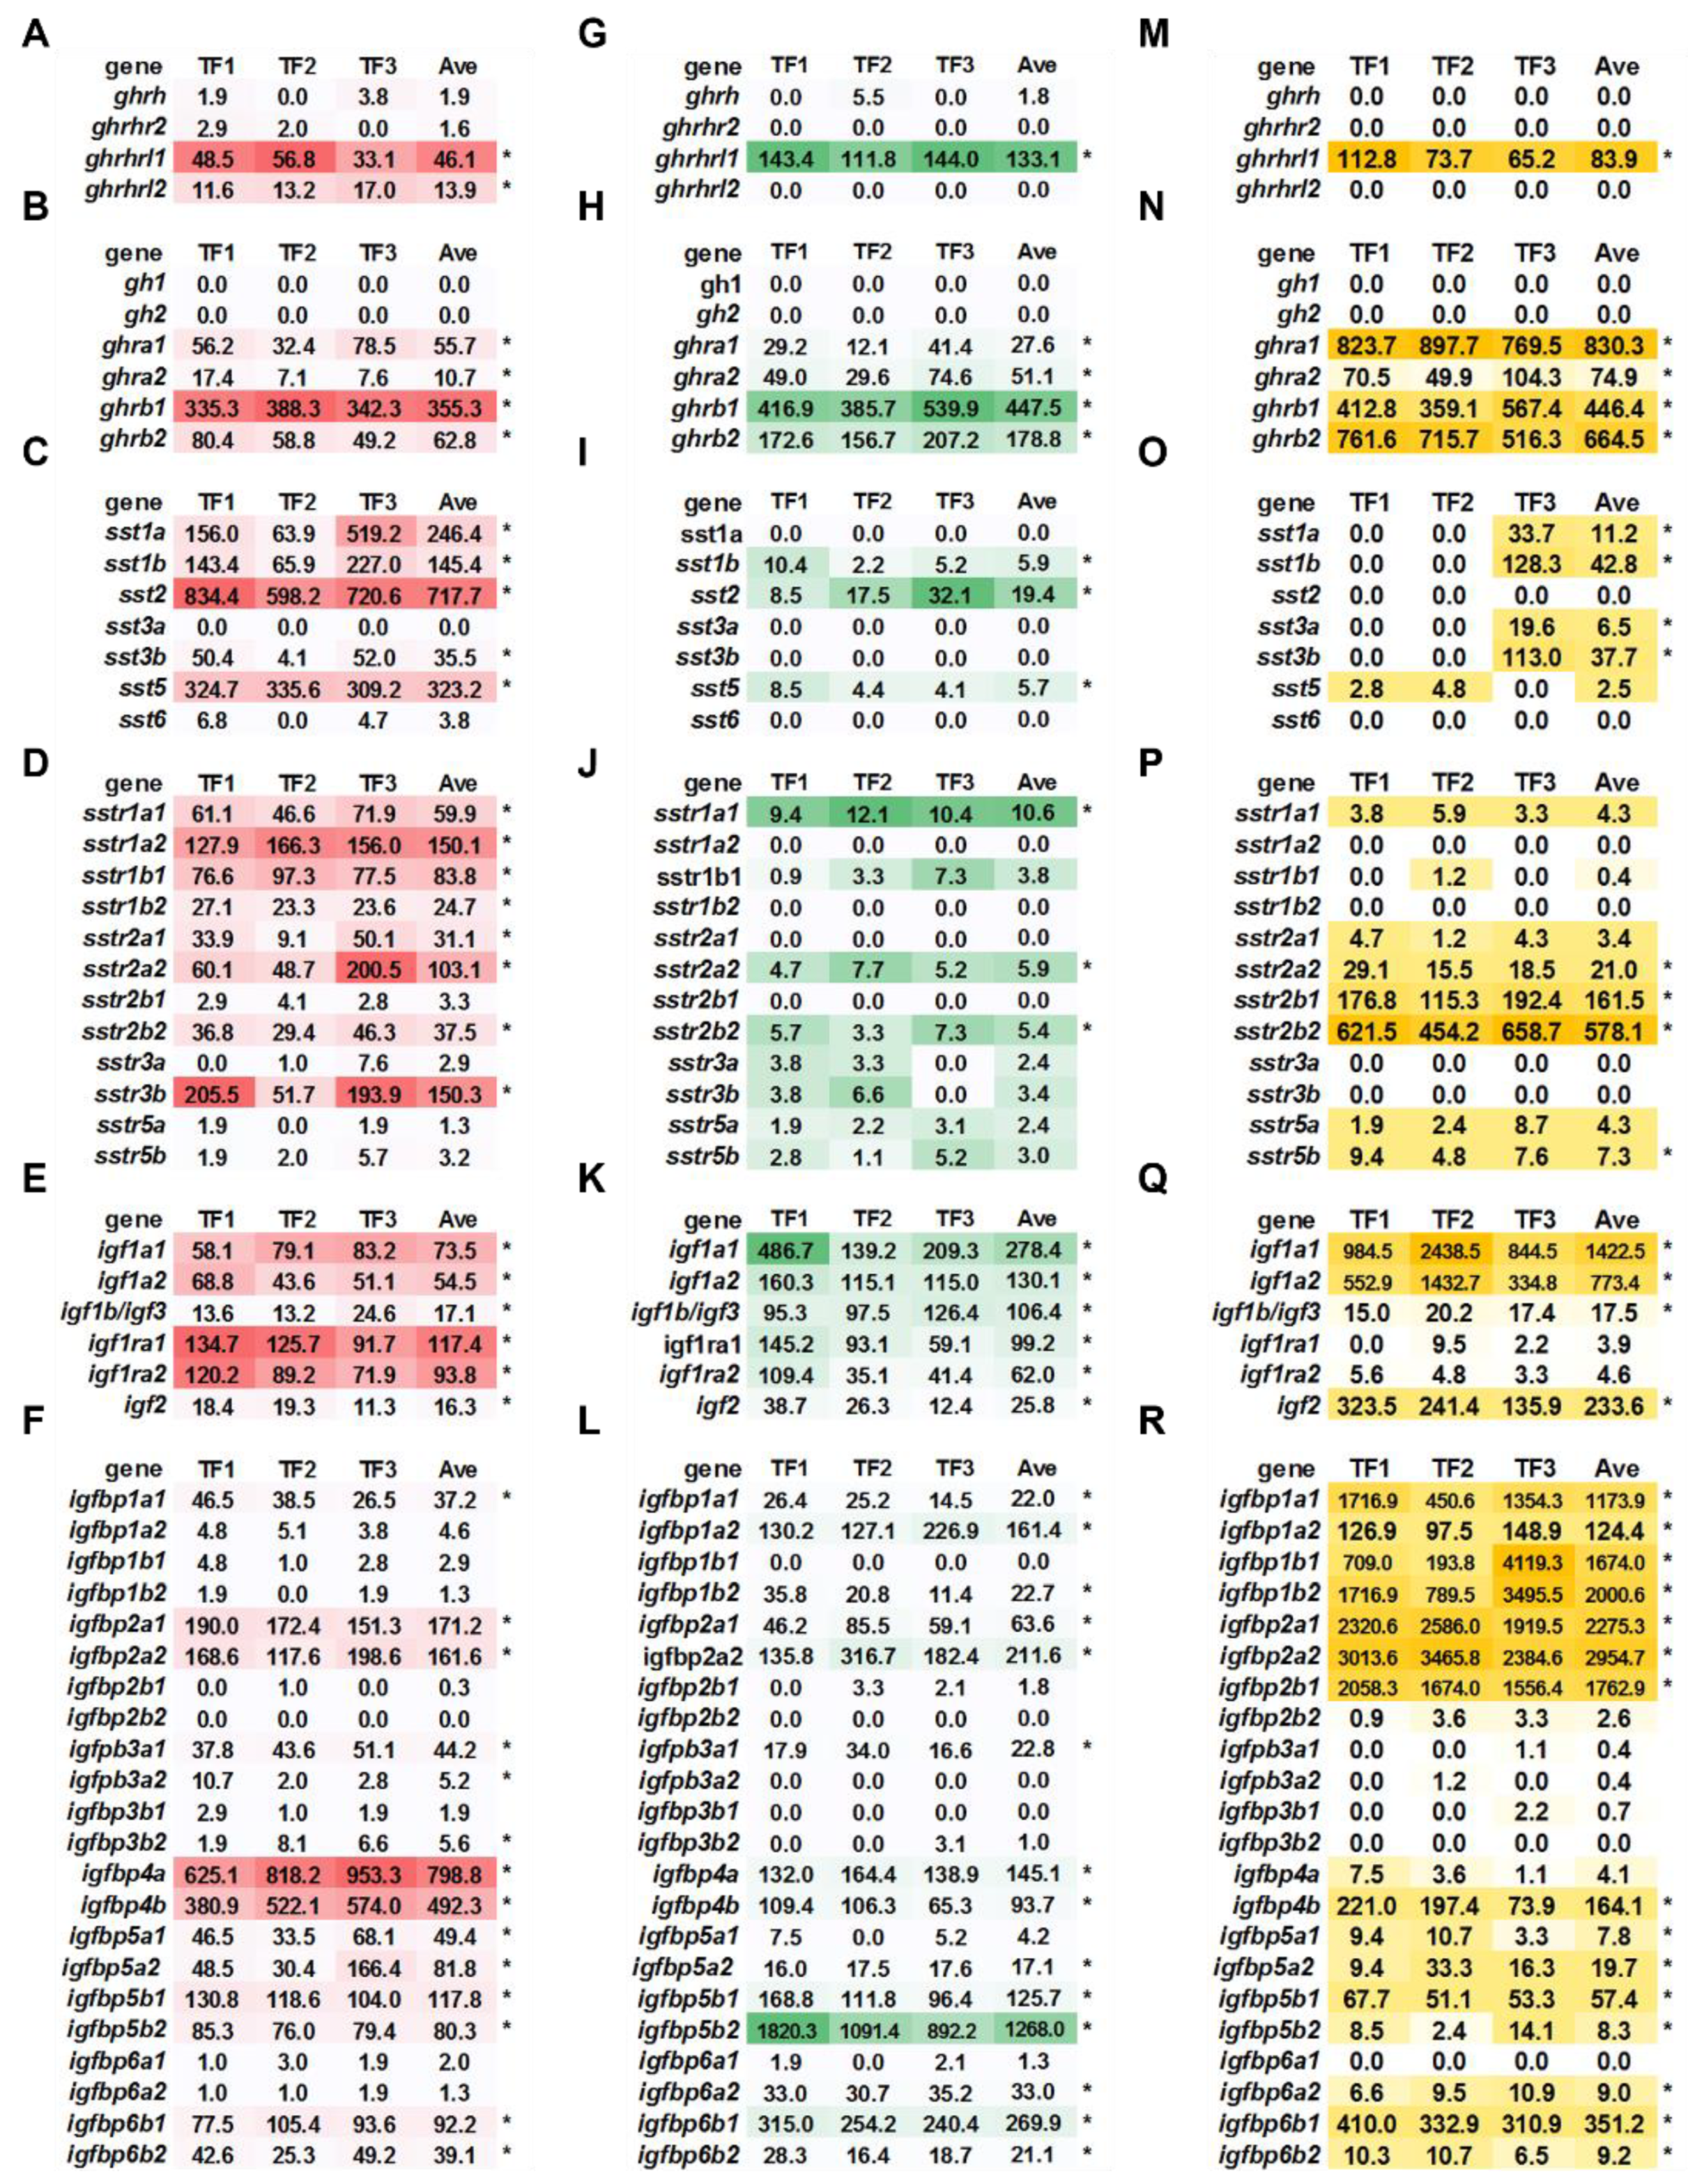
In brain, ghrhrl1 and ghrhrl2 exhibited high basal expression, while ghrhrl1 exerted higher basal expression in kidney and liver (Figure 2A,G,M). Four ghr (ghra1, ghra2, ghrb1 and ghrb2) subtypes showed higher basal expressions in brain, kidney, and liver, with the highest expression of ghrb1, ghrb1, and ghra1 in brain, kidney, and liver, respectively (average expression count > 300, Figure 2B,H,N).
In brain, sst1a, sst1b, sst2, and sst5 exhibited higher basal expressions, with average expression count great than 100 (Figure 2C). Compared to brain, kidney and liver exhibited relatively lower ssts expressions. The average expression levels of kidney sst1b, sst2, and sst5 were ~5.9, 19.4, and 5.7, respectively (Figure 2I). Liver sst1a, sst1b, sst3a, and sst3b exhibited average expression levels of 11.2, 42.8, 6.5, and 37.7 respectively (Figure 2O). Brain exhibited higher basal expressions of sstr1 and sstr2 subtypes (except for sstr2b1) and sstr3b (Figure 2D). The basal expression of sstr1a1, sstr2a2, sstr2b2 were relatively higher in kidney, and sstr2a2, sstr2b1, sstr2b2, and sstr5b showed higher basal expression in liver (Figure 2J,P).
Brain and kidney exhibited higher basal expressions of igf1 subtypes (igf1a1, igf1a2, and igf1b1/igf3) and igf2 with the receptors of igf1ra1 and igf1ra2 (Figure 2E,K). Liver exhibited extremely higher basal expressions of igf1a1 and igf1a2 with average expression count more than 750 (Figure 2Q). High basal expressions of igf1b/igf3 and igf2 were also observed in liver (Figure 2Q). Brain showed higher basal expressions of igfbp2a1, igfbp2a2, igfbp4a, igfbp4b, igfbp5a2, igfbp5b1, igfbp5b2, and igfbp6b1 (average count > 50, Figure 2F). In kidney, high basal expression levels of igfbp1a2, igfbp2a1, igfbp2a2, igfbp4a, igfbp4b, igfbp5b1, igfbp5b2, and igfbp6b1 were observed (average count > 50, Figure 2L). Liver showed extremely high basal expression levels of igfbp1a1, igfbp1b1, igfbp1b2, igfbp2a1, igfbp2a2, and igfbp2b1 (average count > 1000, Figure 2R). High basal expressions of igfbp1a2, igfbp4b, igfbp5b1, and igfbp6b1 were observed in liver (average count > 50, Figure 2R).

2.3. Comparison of Basal Expression of ghrh-gh-sst-igf Axis between Diploid and Triploid Trout

Compared to diploid trout, the top three upregulated genes in triploid brain were sst3b, sstr3b, and sst5, and the downregulated genes were sstr5a, igfbp3b2, and igfbp6a1 (Table 2). In liver, triploid showed the top 3 upregulated genes of igf1a2, igfbp4b, and sst3b, and the top 3 downregulated genes of igfbp6a1, igfbp3a2, and igfbp5a1 (Table 2). In kidney, the top 3 upregulated genes were ghrh, igf1a2, and sstr5b, and the top 3 downregulated genes were ghrhrl2, igfbp3a2, and igfbp2a2 in triploid (Table 2).

2.4. Transcriptional Signature of Triploid Brain ghrh-gh-sst-igf Axis in Response to Seawater Challenge

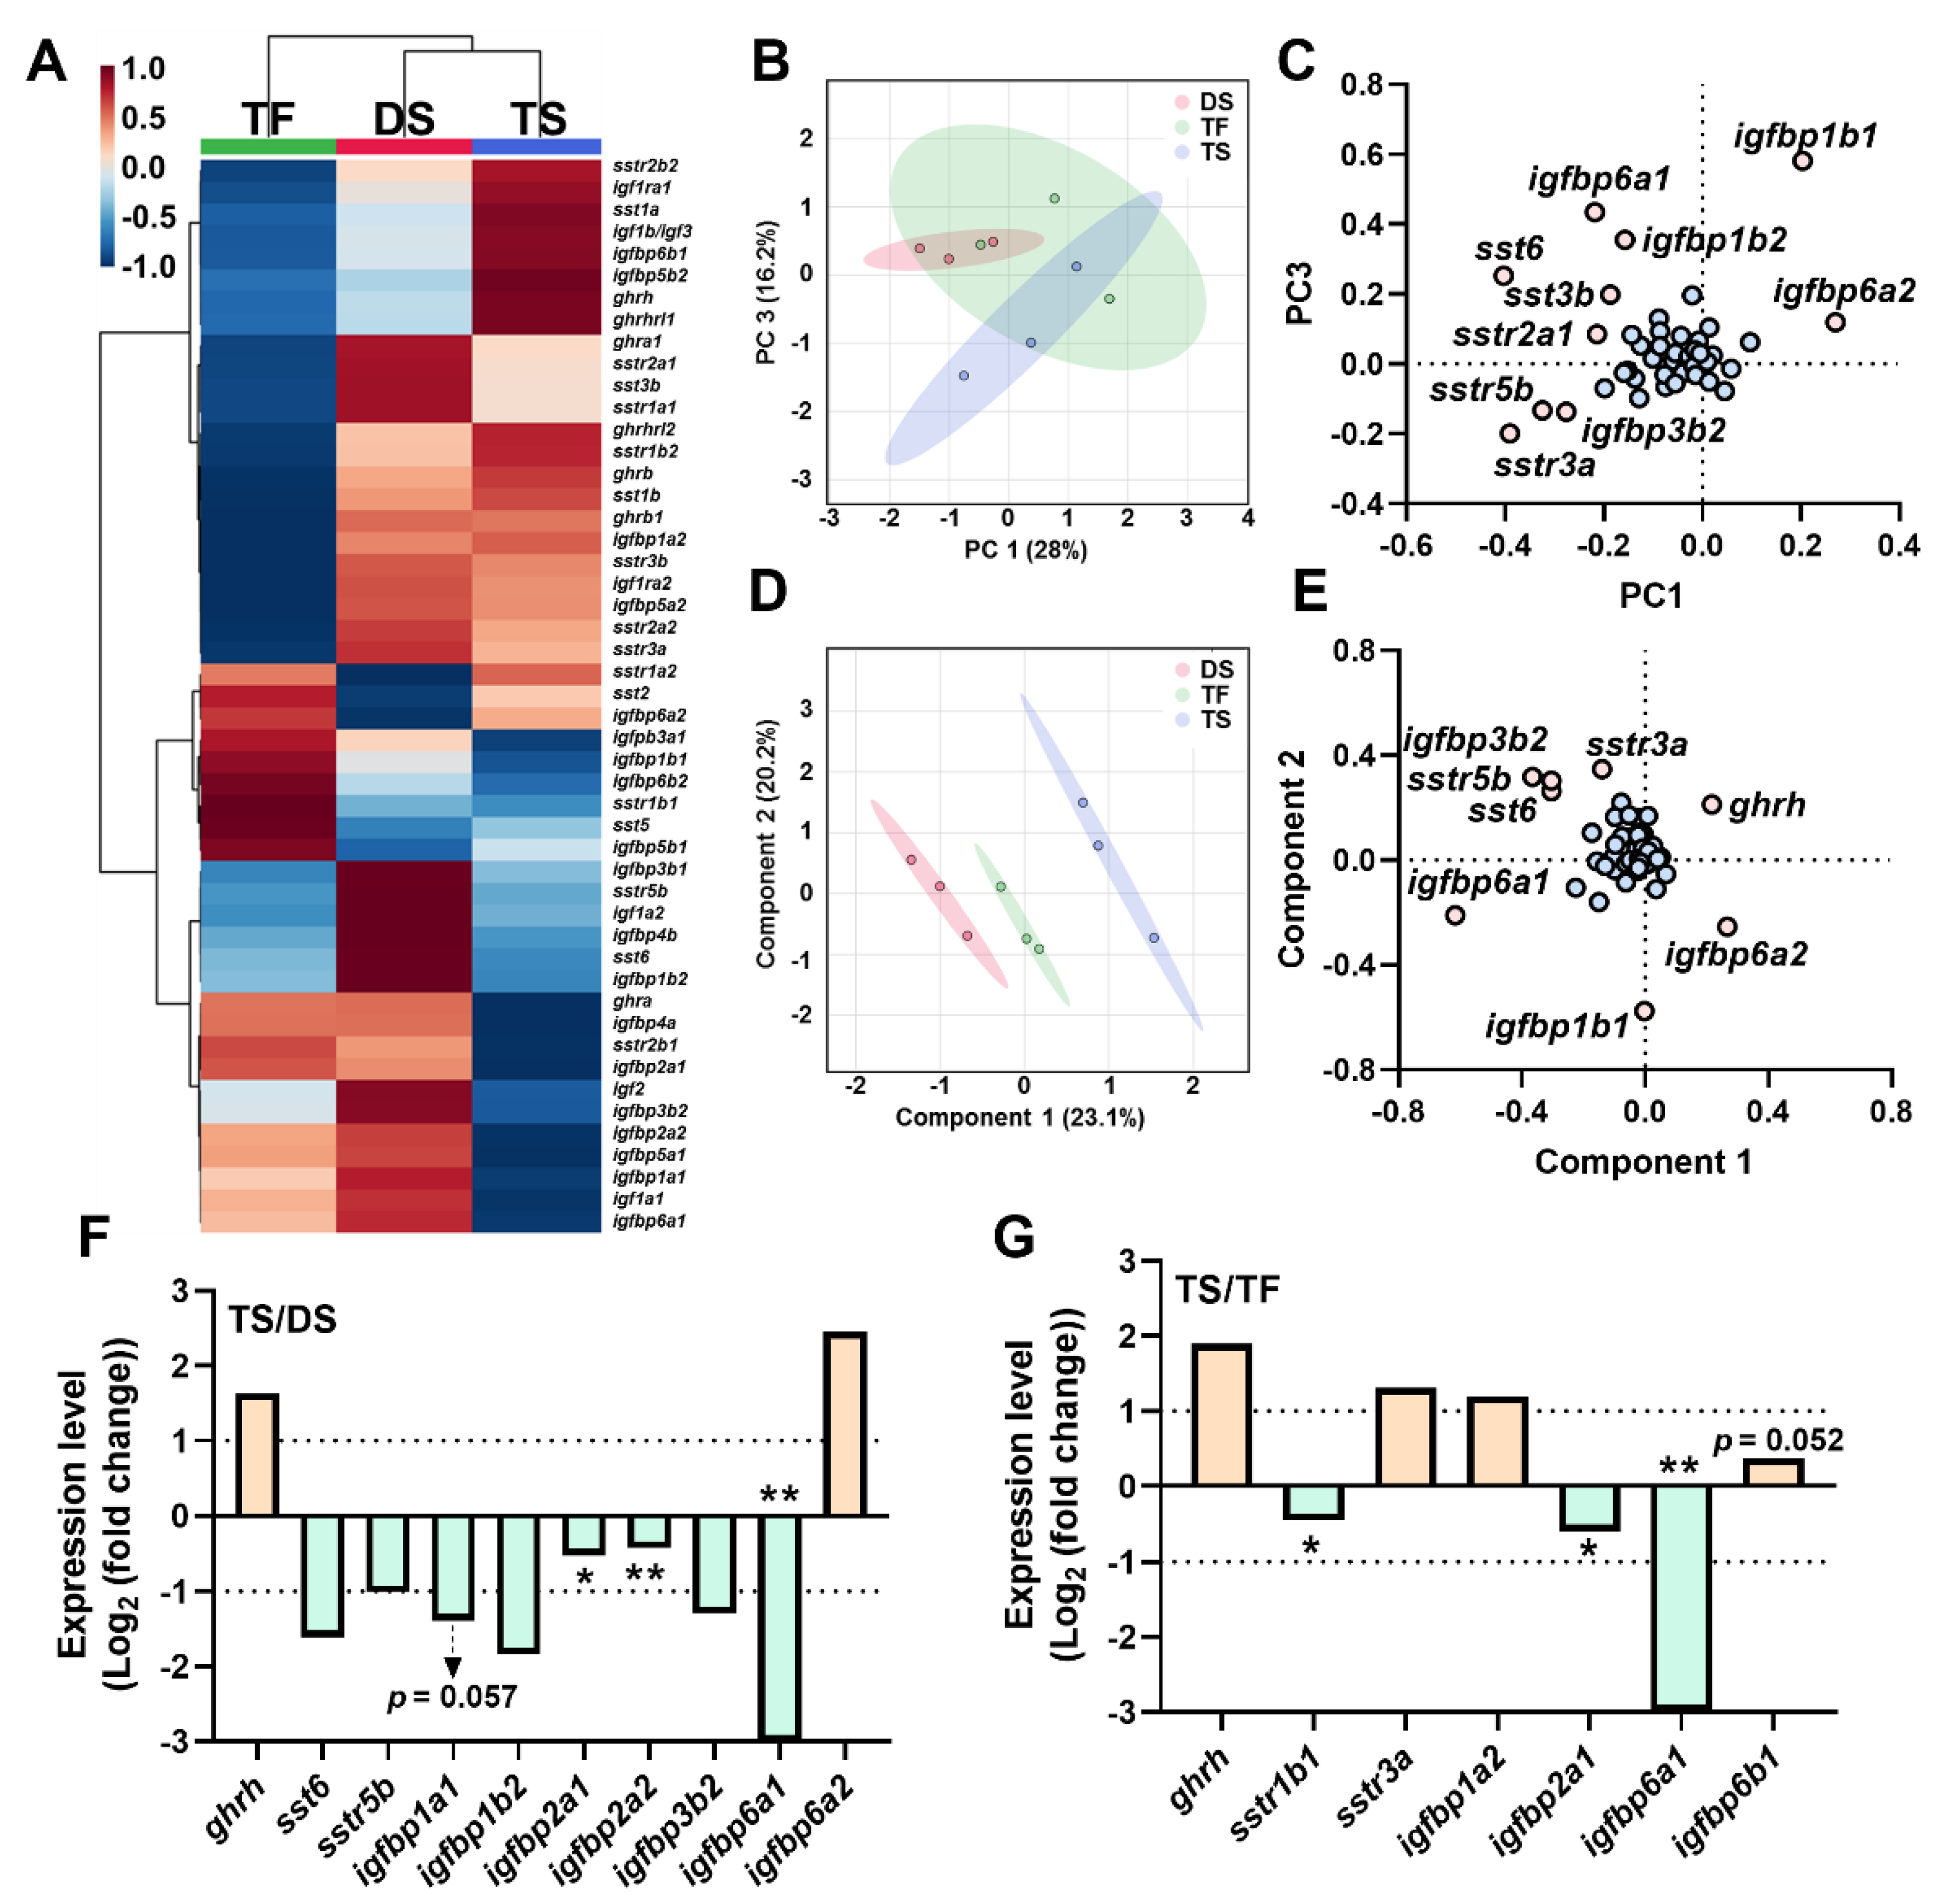
Overall expression profiles of the brain ghrh-gh-sst-igf axis were shown via a heatmap (Figure 3A). The data were analyzed via unsupervised (PCA) and supervised (PLS-DA) methods for dimension reduction and discriminative variable selection. PCA showed clear discrimination between the DS and TS groups (Figure 3B), and sst3b, sst6, sstr2a1, sstr3a, sstr5b, igfbp1b1, igfbp1b2, igfbp3b2, igfbp6a1, and igfbp6a2 served as key genes for PCA discrimination (Figure 3C). Clear discriminations were observed among groups of DS vs. TS and groups of TS vs. TF (Figure 3D), with key genes including ghrh, sst6, sstr3a, sstr5b, igfbp1b1, igfbp3b2, igfbp6a1, and igfbp6a2 (Figure 3E). Compared to DS, the TS group exhibited increased expressions of ghrh and igfbp6a2, and decreased sst6, sstr5b, igfbp1a1, igfbp1b2, igfbp2a1, igfbp2a2, igfbp3b2, igfbp6a1 (Figure 3F). Trout of the TS group showed increased expressions of ghrh, sstr3a, igfbp1a2, and decreased sstr1b1, igfbp2a1, and igfbp6a1 compared to TF (Figure 3G).

2.5. Transcriptional Signature of Triploid Liver ghrh-gh-sst-igf Axis in Response to Seawater Challenge

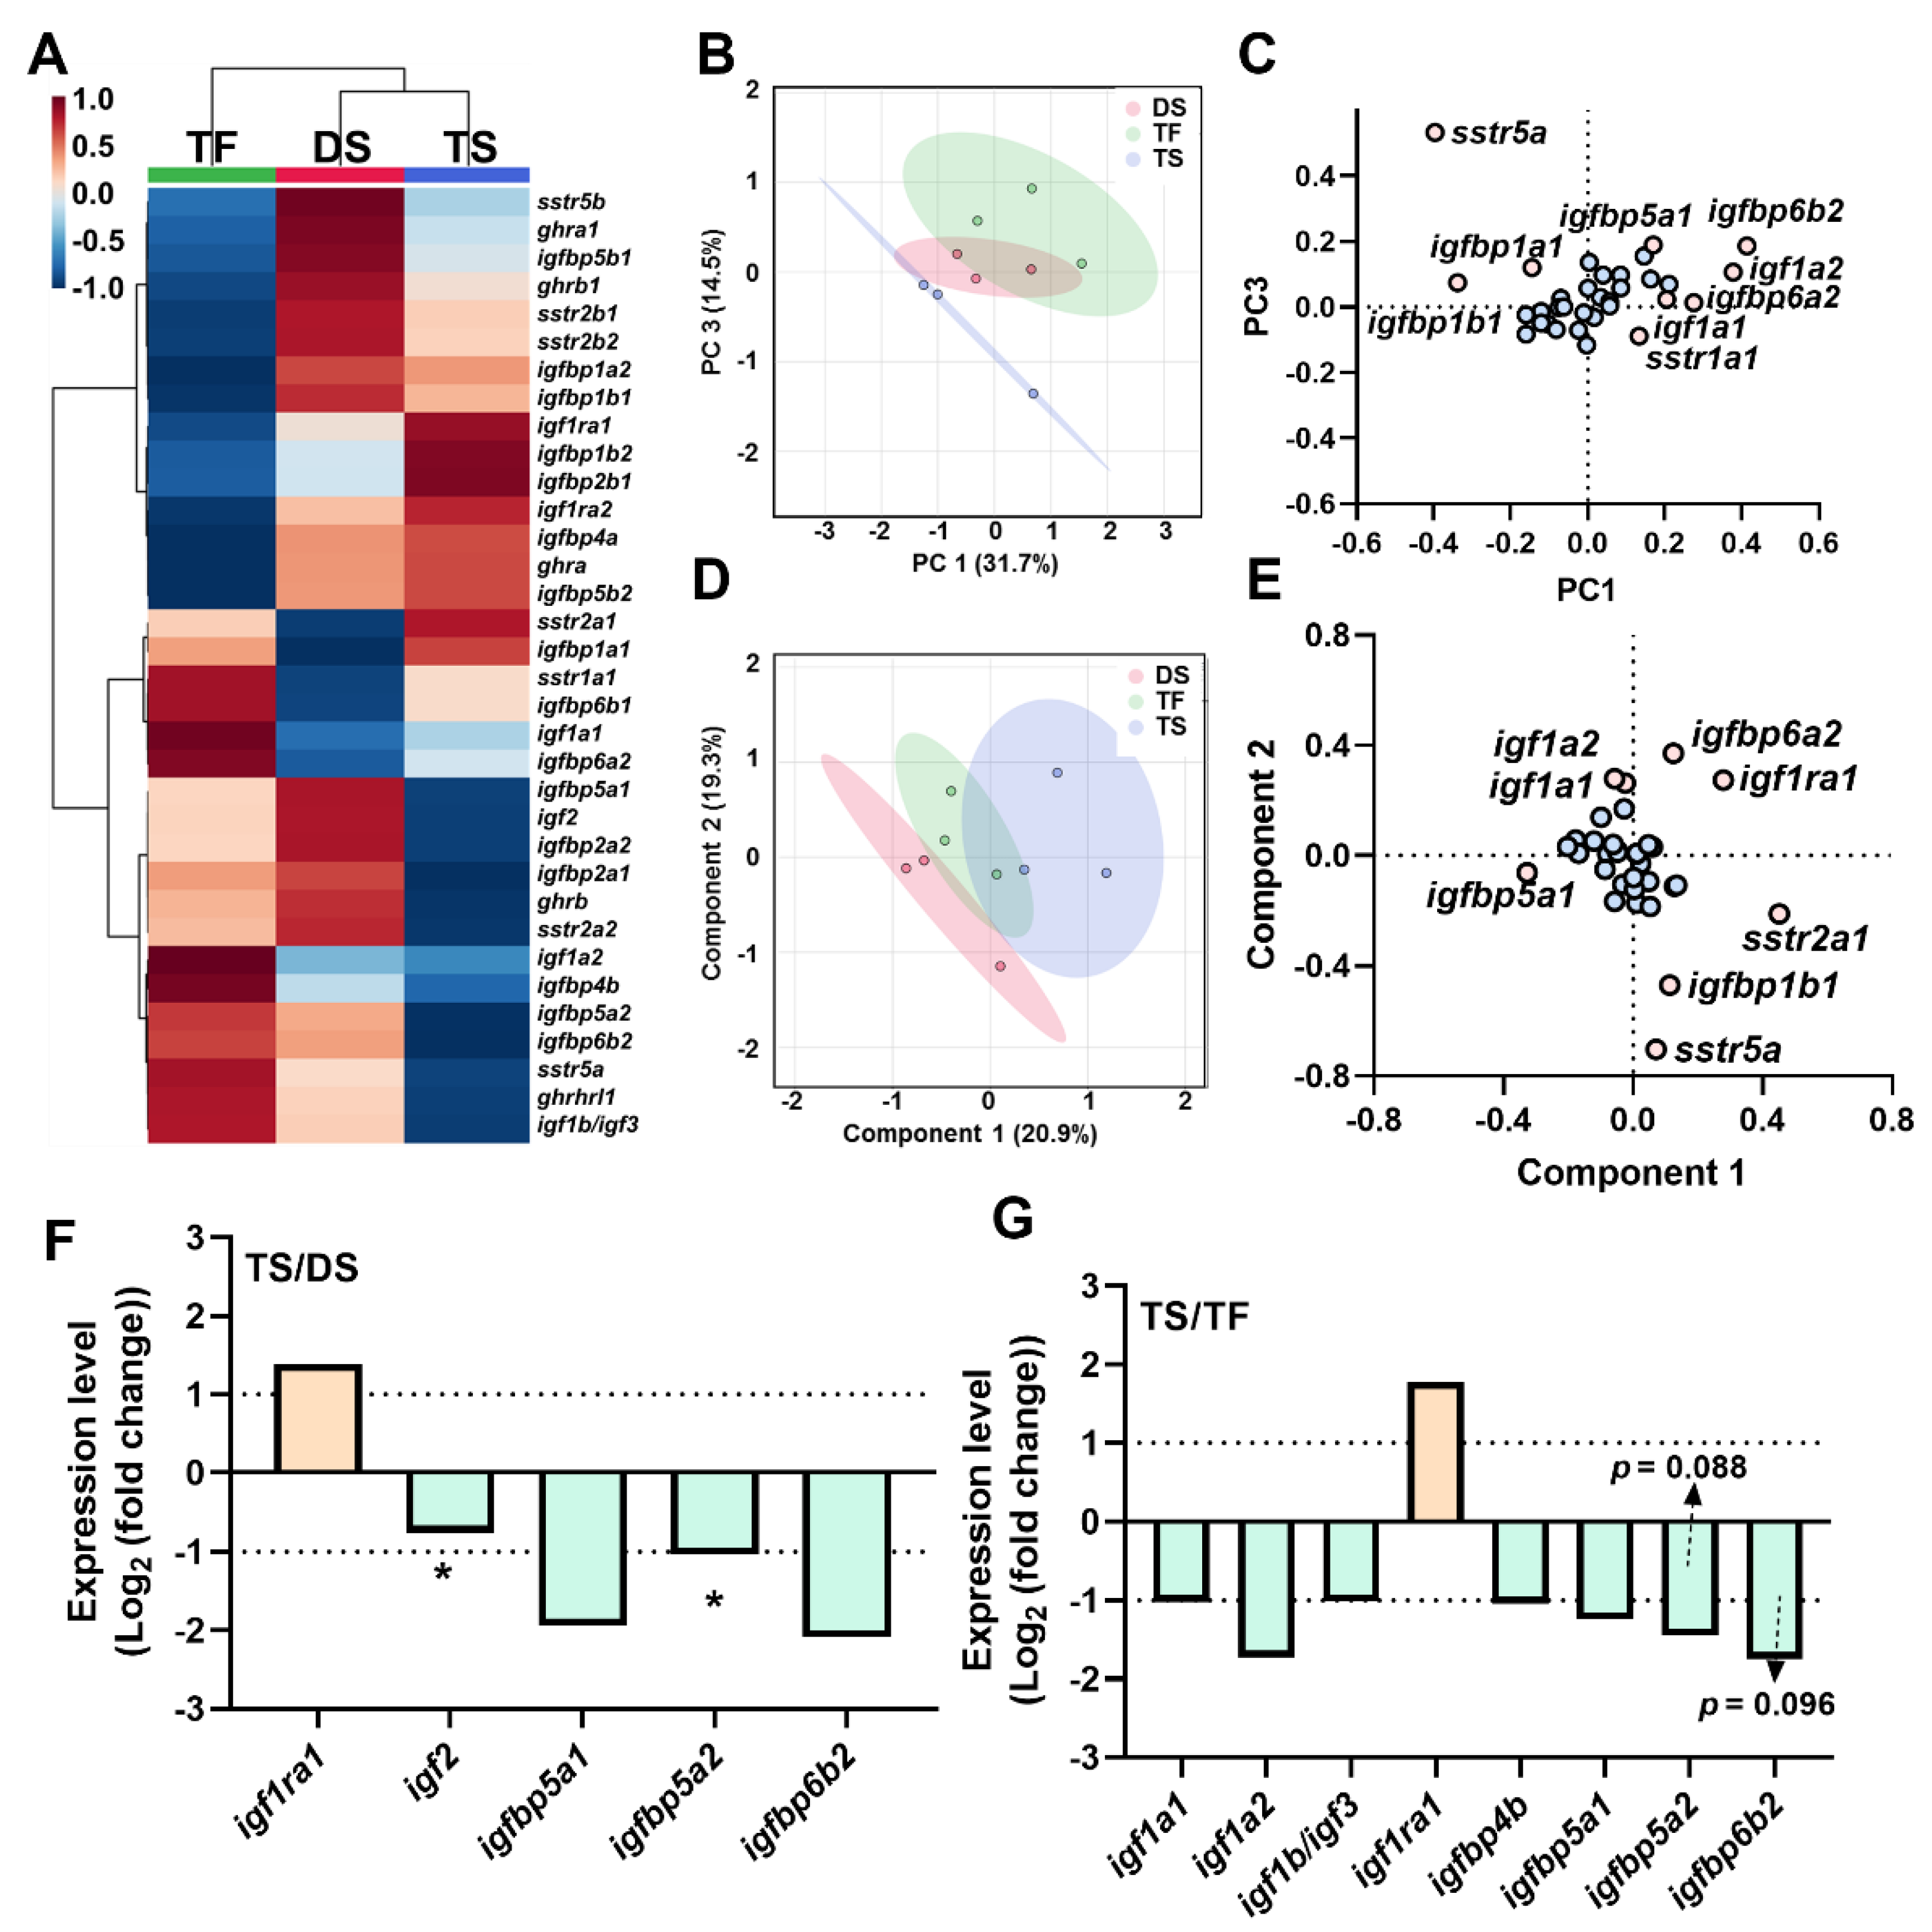
The heatmap showed the overall transcriptional signatures of liver ghrh-gh-sst-igf axis (Figure 4A), and PCA and PLS-DA were used for dimension reduction. A clear discrimination between TF and TS was observed via PCA with key genes of sstr1a1, sstr5a, igf1a1, igf1a2, igfbp1a1, igfbp1b1, igfbp5a1, igfbp6a2, and igfbp6b2 (Figure 4B,C). The supervised dimension reduction of PLS-DA exhibited distinct transcription signatures of liver ghrh-gh-sst-igf axis between DS and TS (Figure 4D). We observed that sstr2a1, sstr5a, igf1a1, igf1a2, igf1ra1, igfbp1b1, igfbp5a1, and igfbp6a2 resulted in distinctly transcriptional discriminations of the ghrh-gh-sst-igf axis between DS and TS (Figure 4E). Compared to DS, the TS group exhibited increased expressions of igf1ra1 and decreased igf2, igfbp5a1, igfbp5a2, and igfbp6b2 (Figure 4F). The TS group exhibited increased expressions of igf1ra1 and reduced igf1a1, igf1a2, igf1b/igf3, igfbp4b, igfbp5a1, igfbp5a2, and igfbp6b2 (Figure 4G) when compared to TF.

2.6. Transcriptional Signature of Triploid Kidney ghrh-gh-sst-igf Axis in Response to Seawater Challenge

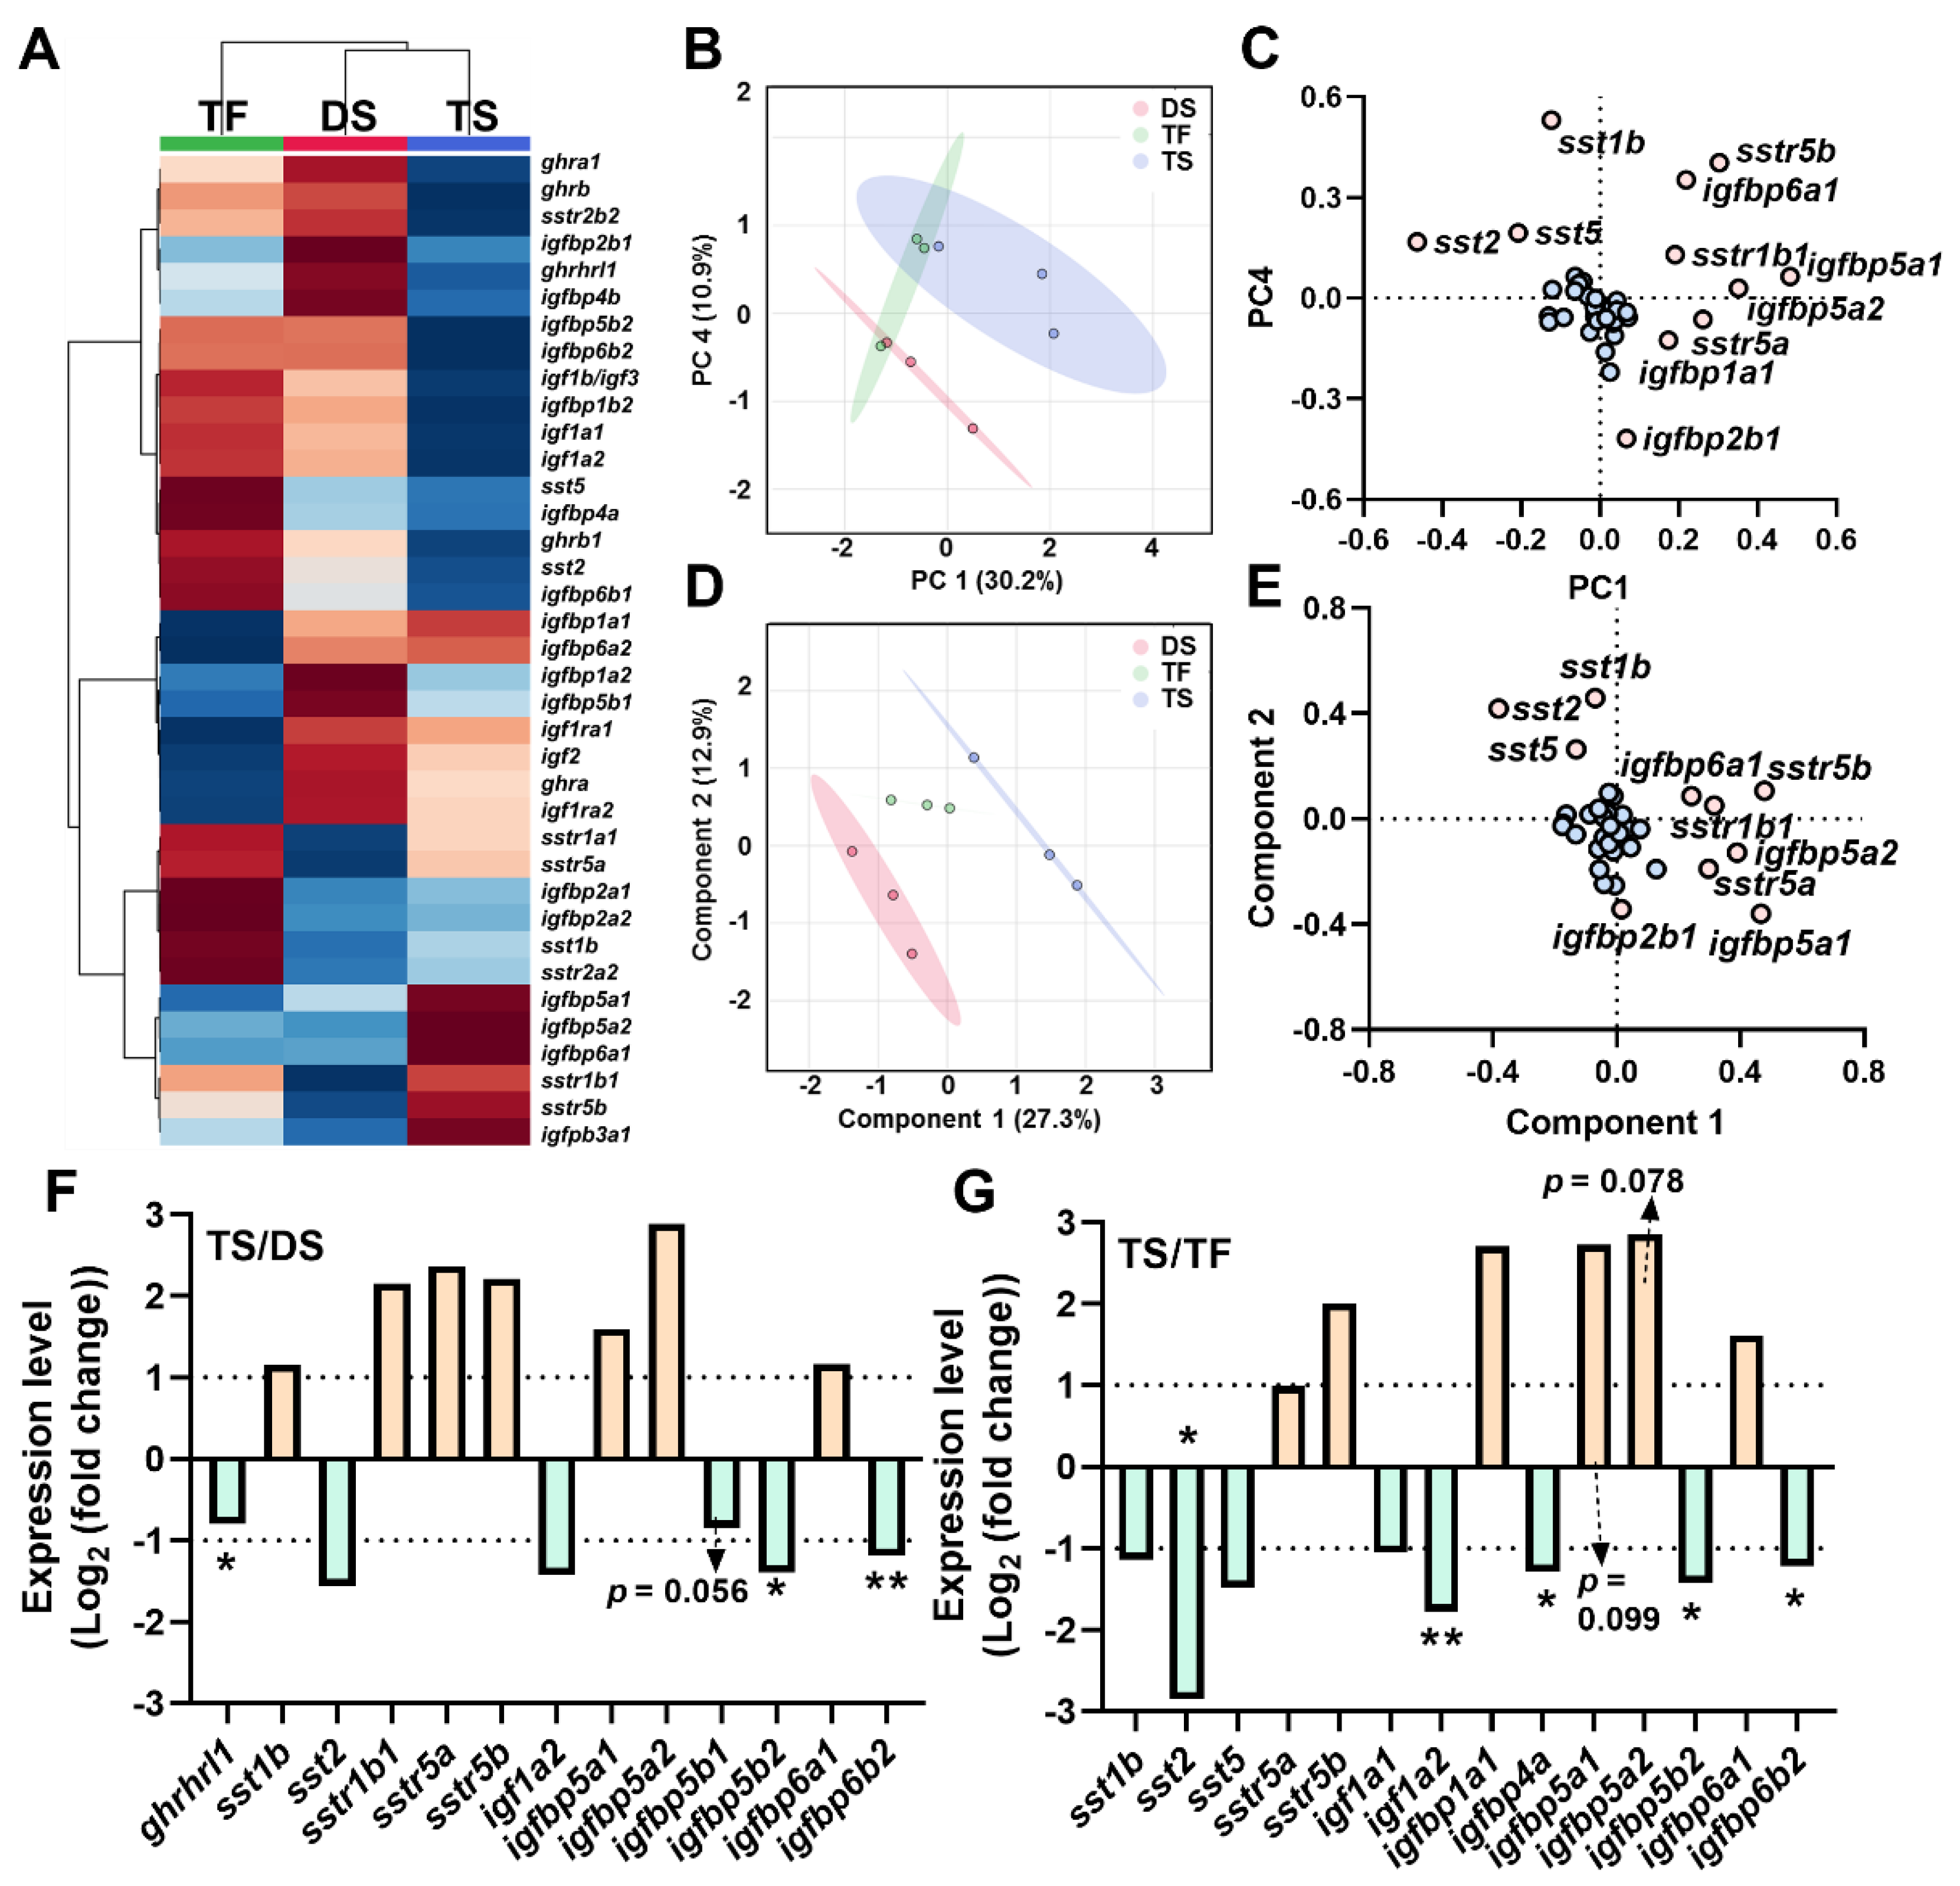
Overall transcriptional profiles of kidney ghrh-gh-sst-igf axis were shown by a heatmap (Figure 5A). The PCA showed distinct discrimination of ghrh-gh-sst-igf transcriptional signature between DS and TS (Figure 5B). Genes of sst1b, sst2, sst5, sstr1b1, sstr5a, sstr5b, igfbp1a1, igfbp2b1, igfbp5a1, igfbp5a2, and igfbp6a1 resulted in transcriptional discrimination between DS and TS (Figure 5C). The PLS-DA exhibited distinct discriminations among groups of DS vs. TS and groups of TS vs. TF (Figure 5D). The loading plot of PLS-DA showed the transcriptional discriminations resulted from the genes of sst1b, sst2, sst5, sstr1b1, sstr5a, sstr5b, igfbp2b1, igfbp5a1, igfbp5a2, and igfbp6a1 (Figure 5E). Compared to DS, the TS group exhibited up-regulated sst1b, sstr1b1, sstr5a, sstr5b, igfbp5a1, igfbp5a2, and igfbp6a1 and decreased ghrhrl1, sst2, igf1a2, igfbp5b1, igfbp5b2, and igfbp6b2 (Figure 5F). Compared to TF, trout of TS exerted up-regulated sstr5a, sstr5b, igfbp1a1, igfbp5a1, igfbp5a2, and igfbp6a1 and decreased sst1b, sst2, sst5, igf1a1, igf1a2, igfbp4a, igfbp5b2, and igfbp6b2 (Figure 5G).

2.7. Correlation Analyses of ghrh-gh-sst-igf Axis

The overall transcriptional correlations of the ghrh-gh-sst-igf axis in brain, kidney, and liver were analyzed via hierarchical clustering heatmaps (Figure 6A,G,L). In brain, positive correlations were observed between ghra1 and sstr1a1, ghra1 and sstr2a2, sstr1a1 and sstr3a, sstr2a2 and sstr2b2, igf1b/igf3 and igfbp5a2 (Figure 5B–F). In kidney, igf1a2 exerted positive correlations with igfbp5b2 and igfbp6b2 (Figure 6H,I). The kidney igfbp2a1 exerted positive correlations with igfbp2a2, and kidney igfbp5b2 exhibited positive correlations with igfbp6b2 (Figure 6J,K). In liver, the data showed negative correlations between ghra2 and igf1a1, ghra2 and igf1a2, sstr2b1 and igfbp6a2, igf1a2 and igfbp5b2, and igfbp1b2 and igfbp2a2, while positive correlations between ghra2 and igfbp1b2, sstr2b1 and sstr2b2, igf1a1 and igf1a2, igfbp2a1 and igfbp2a2, and igfbp2a1 and igfbp5a1 (Figure 6M–V).

3. Discussion

3.1. Complete Repertoire of sst in Rainbow Trout

Our study identified seven sst genes of sst1a, sst1b, sst2, sst3a, sst3b, sst5, sst6. Similarly, six sst genes were identified in zebrafish with sst1sst6, and sst1sst5 being observed in other teleosts of stickleback (Gasterosteus aculeatus), Japanese medaka (Oryzias latipes), puffer (Takifugu rubripes) and spotted green pufferfish (Tetraodon nigroviridis) [34]. The sst1, sst2, and sst5 were generated due to two rounds of genome duplications (2R) in early vertebrate evolution [34,35], therefore we observed conserved sst members of sst1, sst2, and sst5 in both salmonid and non-salmonid species. Previous studies indicated sst3 and sst6 were produced from tandem duplication of sst1 and sst2 [34,36]. Consistently, we observed sst subtypes were colocalized in chromosome 9 (sst2, sst6), chromosome 15 (sst1b, sst3a), or chromosome 27 (sst1a, sst3b), suggesting they were arranged in tandem repeat. The sst4 is derived from sst1 due to teleost specific genome duplications (or three rounds of genome duplications, 3R) [34]. However, the sst4 was absent in rainbow trout. The salmonid ancestors experienced an additional round of genome duplication [37], and salmonid specific genome duplications (or 4R) probably result in sst4 being lost and generate duplicated sst1 and sst3 duplications. Future studies should be focused on physiology and pharmacology between SST1 and SST4, and between SST1(4) paralogs.

3.2. Transcriptional Signature of ghrh-sst-gh-igf Axis in Response to Seawater Challenge

3.2.1. The SST System

The SST exhibits a conserved function of suppressing growth in both mammals and teleosts [38,39,40,41]. Triploid trout showed significantly down-regulated brain sstr1b1 and kidney sst2, potentially suggesting triploid trout exerts a better growth after seawater acclimation. A recent human clinical case report showed SST and analogs target the GI tract and pancreas, thus regulating water and salt reabsorption [42]. We observed gene expressions of sst (sst1b, sst2, sst5) and sstr (sstr1b1, sstr5a, sstr5b) were changed in kidney rather than liver after seawater challenge. Considering the pleiotropic physiology of GH in regulating growth and smoltification, we proposed that SST might regulate extracellular osmolarity via the GH-IGF axis in kidney [15,43]. Consistently, recent studies showed SST is involved in physiological regulations of GHRs, IGFs, IGFRs, and IGFBPs [44,45,46].

3.2.2. The IGFBPs System

Smolting is a pan-hyperendocrine state in salmonids, and McCormick indicated that the GH-IGF axis is significantly involved in migratory readiness via regulating salinity tolerance, growth, and metabolism. IGF acts as the primary regulator and target of GH functions, and the local physiology of IGF is co-regulated by IGFRs and IGFBPs. Salmonid specific genome duplication results in expanded igfbp paralogs, however, physiology of these novel igfbp paralogs in response to seawater challenge (migratory readiness) has yet to be determined.
  • The IGFBPs of triploid trout before and after seawater challenge.
In triploid trout, the upregulated brain igfbp1a2 and kidney igfbp1a1 were observed after seawater challenge, suggesting the central and peripheral endocrine response to salinity challenge is regulated by different igfbp1a subtypes. Previous studies showed the upregulated IGFBP1 could suppress the interaction between IGF and receptors, thus saving the energy from basal metabolism for the processes of acclimation to environmental stress [47,48]. Meanwhile, triploid trout kidney showed an increased trend of igfbp5a subtype expression and significantly downregulated igfbp5b2 and igfbp6b2. The IGFBP5 and IGFBP6 subtypes are involved in regulation of ionic and energy (nutrition) homeostasis. For example, igfbp5a is specifically expressed in zebrafish ionocytes (chloride cell) and dysregulation of IGFBP5a results in abnormal ionocyte proliferation [49]. Consistent to previous studies showing igfbp5a and igfbp5b exert distinctive expressions in zebrafish and grass carp, we showed igfbp5(6)a subtypes exhibited conversed transcriptional signatures with igfbp5(6)b, suggesting an evolutionary divergence in physiology [50,51].
2.
Comparison of IGFBPs in diploid and triploid in response to seawater challenge.
It is necessary to evaluate whether triploid trout exhibit equally biology and physiology performances as diploids in response to environment challenges before mass commercial production [52]. The GH-IGF axis is involved in multiple functions associated with commercially relevant traits, including growth, immunity, and smoltification. IGFBP1 could be induced by stress and acts as a negative regulator of teleost growth and development [24]. Diploid showed up-regulated brain igfbp1a1 (p = 0.057) after seawater challenge. Brain plays a key role in stress reactivity and modulates the physiological and behavioral alterations for stress coping and recovery [53]. Meanwhile, significantly increased brain igfbp2a1 and igfbp2a2 expressions were observed in diploid trout. Previous study showed igfbp2 overexpression results in growth and development reduction [54,55]. Our results suggested triploid were less sensitive to seawater challenge when compared to diploids. The igfbp5 exerted subtype-specific transcription patterns in kidney (down-regulated igfbp5b2) and liver (down-regulated igfbp5a2) in triploid when compared to diploid. Previous studies revealed igfbp5 is involved in both muscle growth and ionic homeostasis in teleost [24,27,49,56,57,58]. The triploid exhibited potential IGFBP5 subtype-regulated crosstalk between growth (or energy production) and osmoregulation in liver and kidney. The igfbp6, a growth inhibitor of teleost growth [24], showed down-regulation in triploid after seawater challenge, suggesting a better energy crosstalk between seawater acclimation and growth in triploid trout.

4. Materials and Methods

4.1. Ethics Statement

All experimental protocols were performed in conformity to the Guidelines of Animal Research and Ethics Committees of the Ocean University of China (Permit Number: 20141201), and National Institutes of Health Guide for the Care and Use of Laboratory Animals (NIH Publications, No. 8023, revised 1978). Immature trout were used in this study and sex effects were not considered. No endangered or protected animals were used in this study.

4.2. Ploidy Identification

The ploidy identification procedure was combined with CyFlowTMRobby6 (Sysmex, Norderstedt, Germany). Briefly, caudal fin (~0.05 g) was clipped and homogenized with 1×PBS and CyStainTM UV Precise P Nuclei Extraction Buffer (Sysmex, Germany). At least 10,000 cells were measured per sample via flow cytometry. The average relative DNA content of six diploid trout were determined as the diploid control.

4.3. Animals Acclimation and Salinity Challenge

Trout juveniles (diploid and triploid, ~9.7 g, ~10.7 cm) were obtained from Linqu Salmon and Trout Aquatic Breeding LLC (Weifang, Shandong, China). The experimental trout were derived from the same full-sibling family batch with same day age and synchronized development. Trout were acclimated for 10 days before salinity challenge. Fish were acclimated and maintained in a recirculating water system at the Experimental Fish Facility in the Key Laboratory of Mariculture, Ocean University of China, with ~16 °C of water temperature, ~7 mg/L of dissolved oxygen, saturated feeding (5% of body weight), and natural photoperiod of 12:12 (hours) of light and dark. The acclimation protocols were performed in conformity with the Standards of Linxia Salmon and National Trout Elite Breeding and Protection Farm (Linxia, Gansu, China, Approved by the Department of Agriculture, China, 2009).
After acclimation, trout were divided into four groups (diploid freshwater exposure (DF), diploid seawater exposure (DS), triploid freshwater exposure (TF), and triploid seawater exposure (TS)). Each group contained three biological replications and each replication contained 18 individual trout. The DF and TF groups were cultured in cuboid tanks filled with freshwater, while the DS and TS groups were cultured in cuboid tanks filled with seawater at salinity of 15 (15 ppt) for 7 days. Trout were reared in the same recirculating water system with acclimation protocol, with the same water temperature, dissolved oxygen, feeding regime, and photoperiod. The exposure seawater (15 ppt) was prepared by dilution of the seawater (30 ppt) with aerated freshwater, and the salinity for the exposure media was detected by LS10T (Suwei, Guangdong, China). During exposure, 40% of the exposure media was replaced every two days for the following reasons: (1) to maintain the salinity concentrations, (2) to qualify the water quality, (3) to reduce the animal chemicals. No mortality was observed in DS and TS groups after a 24-h salinity exposure, and the survival rates on day 7 in DF, DS, TF, and TS were 100%, 96.3 ± 3.2%, 98.1 ± 3.2%, and 98.1 ± 3.2%, respectively.

4.4. Sampling and RNA-seq

Trout were starved 24 h prior to sacrifice and then anesthetized with tricaine (MS-222, Sigma-Aldrich, Shanghai, China). Tissues of brain, liver, and kidney were quickly removed and then stored in tubes at −80 °C in RNase-free conditions. Total RNA was extracted from brain, liver, and kidney via TRIzol reagent (Vazyme Biotech, Nanjing, China) based on the manufacturer’s protocol. The quality and quantity of extracted RNA were evaluated with agarose gel electrophoresis and a biophotometer (OSTC, Shanghai, China).
RNA sequences and data analyses were performed with the general protocol and pipeline for medical and fishery studies of the commercial provider (OEbiotech, Shanghai, China). To reduce the individual differences of RNA-Seq, one RNA-Seq library was constructed via pooling equal quantities of RNA from two individuals within the same replicate (tank). The libraries were sequenced with Illumina HiSeq 4000 platform via a commercial provider (Oebiotech, Shanghai, China). The clean reads of sequences were derived after removing raw reads of low quality and/or poly-N were removed. The latest rainbow trout genome (GCA_013265735.3) was used for mapping of the clean reads via histat2 [59]. The DESeq2 R package was used for gene expression analyses [60], and normalized count (via DESeq2 R package) was used in this study. Details of the data qualities and expression metrics are shown in Tables S1 and S2. Sequence reads are available in the Sequence Read Archive Database (PRJNA844477).

4.5. Identification of Rainbow Trout sst Repertoire

Rainbow trout genomic data were used to identify sst repertoire. The SST amino acid sequences of zebrafish (Danio rerio) and goldfish (Carassius auratus) were used for sequence comparisons via TBLASTN. Molecular weight (MW), isoelectric points (pI), and chromosome location of SST genes/proteins were predicted/acquired by online resources of ProtParam tool and NCBI.
Phylogenetic tree was conducted with the amino acid sequences of SSTs from rainbow trout (Oncorhynchus mykiss), human (Homo sapiens), house mouse (Mus musculus), chicken (Gallus gallus), zebrafish (Danio rerio), Japanese medaka (Oryzias latipes), goldfish (Carassius auratus), common carp (Cyprinus carpio), fugu (Takifugu rubripes), channel catfish (Ictalurus punctatus), and Atlantic salmon (Salmo salar). ClustalW in MEGA 11.0 was used for protein sequence alignment [61]. Phylogenetic tree was conducted via the neighbor-joining (NJ) method and Jones–Taylor–Thornton (JTT) model in MEGA 11.0 software with 1000 bootstrap replicates [62]. The chromosome localization of sst genes in rainbow trout were visualized by TBtools. The sst gene information of rainbow trout, Atlantic salmon, pink salmon (Oncorhynchus gorbuscha), zebrafish, and Japanese medaka were used for syntenic analysis. The sst gene structures of rainbow trout were visualized by online tools (http://gsds.gao-lab.org/index.php, accessed on 27 March 2022). The SST motif analysis was conducted via MEME website (https://meme-suite.org/meme/tools/meme, accessed on 27 March 2022). Multiple sequence alignments among species were retrieved from the ESPript 3.0 website (https://espript.ibcp.fr/ESPript/ESPript/index.php, accessed on 3 April 2022).

4.6. Quantitative Polymerase Chain Reaction (qPCR)

Results of RNA-Seq were validated via qPCR (Figure S2). Total RNA was reverse-transcribed into cDNA using PrimeScript RT reagent kit (Takara, Shiga, Japan). The 4× diluted cDNA was served as the template for qPCR. The primers were designed via Primer 5 software (Table S3) and β-actin was selected as the reference gene [63]. The qPCR system was a 10 µL reaction, containing 1 µL cDNA, 5 µL SYBR®FAST qPCR Master Mix (Monad, Wuhan, China), 0.2 µL of each primer, and 3.6 µL RNAase-free water. The reaction program was 95 °C for 30 s, 40 cycles of 95 °C for 10 s, and Tm for 30 s, followed by 72 °C for 30 s. The qPCR was carried out via StepOnePlus™ Real-time PCR system (Applied Biosystems, Foster City, CA, USA). The results were calculated by the 2ΔΔCt method [64].

4.7. Data Visualization and Statistical Analysis

According to previous studies in medical and fishery studies [65,66], the count of RNA-Seq data were normalized by DESeq2 [67]. The normalized data were analyzed via the websites of MetaboAnalyst and NetworkAnalyst for multivariate analysis of principal components analysis (PCA), partial least squares discriminant analysis, loading plots, and clustering algorithm (heatmap) [68]. Genes were selected via the screening criteria of Log2|Foldchange| ≥ 1 or p value < 0.05 (Log10(count+1) tested by Student’s t-test). The correlation analysis of gene expressions was analyzed via the Pearson correlation coefficient by MetaboAnalyst and GraphPad Prism 8.0. Data of basal expression of ghrh-gh-sst-igf axis in diploid trout were retrieved from previously published RNA-Seq data (SRA of NCBI: PRJNA865462 for liver; SRA of NCBI: PRJNA753277 for brain and kidney) [69,70]. The gene count data were analyzed by DESeq2 R package and then the average count was normalized by average β-actin ((average of normalized count × 10,000)/(average of β-actin count)) [60]. Expression matrix are shown in Tables S1 and S2.

5. Conclusions

In this study, we showed that salmonids exhibited increased sst gene duplications due to salmonid specific genome duplication. Similar to GH, the SST and SSTR exhibited pleiotropic effects in modulating diverse physiological processes including growth and smoltification. Compared to diploid, triploid trout exhibited a better seawater acclimation. The igfbp5 and igfbp6 subtypes were involved in energy redistribution between growth and osmoregulatory regulation.

Supplementary Materials

The following supporting information can be downloaded at: https://www.mdpi.com/article/10.3390/ijms23158691/s1.

Author Contributions

Conceptualization: J.L., Z.H. and H.W.; methodology: K.X.; software: K.X. and Z.H.; validation, K.X., Z.H. and H.W.; formal analysis: K.X. and Z.H.; investigation: K.X. and Z.H.; resources: J.L. and H.W.; data curation: Z.H. and H.W.; writing—original draft preparation: K.X., Z.H. and H.W.; writing—review and editing: Z.H. and H.W.; visualization: K.X. and Z.H.; supervision: Z.H. and H.W.; project administration: K.X., Q.Y., M.L. and X.Y.; funding acquisition: H.W. All authors have read and agreed to the published version of the manuscript.

Funding

This research was funded by the National Natural Science Foundation of China (3217210108).

Institutional Review Board Statement

Not applicable.

Informed Consent Statement

Not applicable.

Data Availability Statement

Data are contained within the article.

Conflicts of Interest

The authors declare no conflict of interest.

References

  1. Pavlov, D.; Savvaitova, K. On the problem of ratio of anadromy and residence in salmonids (Salmonidae). J. Ichthyol. 2008, 48, 778–791. [Google Scholar] [CrossRef]
  2. Kendall, N.W.; McMillan, J.R.; Sloat, M.R.; Buehrens, T.W.; Quinn, T.P.; Pess, G.R.; Kuzishchin, K.V.; McClure, M.M.; Zabel, R.W. Anadromy and residency in steelhead and rainbow trout (Oncorhynchus mykiss): A review of the processes and patterns. Can. J. Fish. Aquat. Sci. 2015, 72, 319–342. [Google Scholar] [CrossRef] [Green Version]
  3. Vörösmarty, C.J.; McIntyre, P.B.; Gessner, M.O.; Dudgeon, D.; Prusevich, A.; Green, P.; Glidden, S.; Bunn, S.E.; Sullivan, C.A.; Liermann, C.R. Global threats to human water security and river biodiversity. Nature 2010, 467, 555–561. [Google Scholar] [CrossRef] [PubMed]
  4. Rodell, M.; Famiglietti, J.S.; Wiese, D.N.; Reager, J.; Beaudoing, H.K.; Landerer, F.W.; Lo, M.-H. Emerging trends in global freshwater availability. Nature 2018, 557, 651–659. [Google Scholar] [CrossRef] [PubMed]
  5. Alfonso, S.; Gesto, M.; Sadoul, B. Temperature increase and its effects on fish stress physiology in the context of global warming. J. Fish Biol. 2021, 98, 1496–1508. [Google Scholar] [CrossRef]
  6. Frölicher, T.L.; Fischer, E.M.; Gruber, N. Marine heatwaves under global warming. Nature 2018, 560, 360–364. [Google Scholar] [CrossRef]
  7. Comte, L.; Olden, J.D. Climatic vulnerability of the world’s freshwater and marine fishes. Nat. Clim. Chang. 2017, 7, 718–722. [Google Scholar] [CrossRef]
  8. Barbarossa, V.; Bosmans, J.; Wanders, N.; King, H.; Bierkens, M.F.; Huijbregts, M.A.; Schipper, A.M. Threats of global warming to the world’s freshwater fishes. Nat. Commun. 2021, 12, 1701. [Google Scholar] [CrossRef]
  9. Zhang, S.; Han, G.; Xie, Y.; Ruiz, J.J. Data assimilation in numerical weather and climate models. Adv. Meteorol. 2015, 2015, 626893. [Google Scholar] [CrossRef]
  10. Thorgaard, G.H. 8 Chromosome Set Manipulation and Sex Control in Fish. Fish Physiol. 1983, 9, 405–434. [Google Scholar] [CrossRef]
  11. Sheehan, R.J.; Shasteen, S.P.; Suresh, A.V.; Kapuscinski, A.R.; Seeb, J.E. Better growth in all-female diploid and triploid rainbow trout. Trans. Am. Fish. Soc. 1999, 128, 491–498. [Google Scholar] [CrossRef]
  12. Naylor, R.; Hindar, K.; Fleming, I.A.; Goldburg, R.; Williams, S.; Volpe, J.; Whoriskey, F.; Eagle, J.; Kelso, D.; Mangel, M. Fugitive salmon: Assessing the risks of escaped fish from net-pen aquaculture. BioScience 2005, 55, 427–437. [Google Scholar] [CrossRef]
  13. Fraser, T.W.; Fjelldal, P.G.; Hansen, T.; Mayer, I. Welfare considerations of triploid fish. Rev. Fish. Sci. 2012, 20, 192–211. [Google Scholar] [CrossRef]
  14. Björnsson, B.T.; Stefansson, S.O.; McCormick, S.D. Environmental endocrinology of salmon smoltification. Gen. Comp. Endocrinol. 2011, 170, 290–298. [Google Scholar] [CrossRef]
  15. McCormick, S.D. Smolt physiology and endocrinology. Fish Physiol. 2012, 32, 199–251. [Google Scholar] [CrossRef]
  16. Mancera, J.M.; McCormick, S.D. Role of prolactin, growth hormone, insulin-like growth factor I and cortisol in teleost osmoregulation. In Fish Osmoregulation; CRC Press: Boca Raton, FL, USA, 2019; pp. 497–515. [Google Scholar]
  17. Daza, D.O.; Sundström, G.; Bergqvist, C.A.; Duan, C.; Larhammar, D. Evolution of the insulin-like growth factor binding protein (IGFBP) family. Endocrinology 2011, 152, 2278–2289. [Google Scholar] [CrossRef] [PubMed] [Green Version]
  18. Alzaid, A.; Castro, R.; Wang, T.; Secombes, C.J.; Boudinot, P.; Macqueen, D.J.; Martin, S.A. Cross talk between growth and immunity: Coupling of the IGF axis to conserved cytokine pathways in rainbow trout. Endocrinology 2016, 157, 1942–1955. [Google Scholar] [CrossRef]
  19. McCormick, S.D. Endocrine control of osmoregulation in teleost fish. Am. Zool. 2001, 41, 781–794. [Google Scholar] [CrossRef]
  20. Tort, L. Stress and immune modulation in fish. Dev. Comp. Immunol. 2011, 35, 1366–1375. [Google Scholar] [CrossRef]
  21. Kim, J.-H.; Macqueen, D.J.; Winton, J.R.; Hansen, J.D.; Park, H.; Devlin, R.H. Effect of growth rate on transcriptomic responses to immune stimulation in wild-type, domesticated, and GH-transgenic coho salmon. BMC Genom. 2019, 20, 1024. [Google Scholar] [CrossRef]
  22. McCormick, S.D. Effects of growth hormone and insulin-like growth factor I on salinity tolerance and gill Na+, K+-ATPase in Atlantic salmon (Salmo salar): Interaction with cortisol. Gen. Comp. Endocrinol. 1996, 101, 3–11. [Google Scholar] [CrossRef] [PubMed]
  23. Sakamoto, T.; Shepherd, B.S.; Madsen, S.S.; Nishioka, R.S.; Siharath, K.; Richman, N.H., III; Bern, H.A.; Grau, E.G. Osmoregulatory actions of growth hormone and prolactin in an advanced teleost. Gen. Comp. Endocrinol. 1997, 106, 95–101. [Google Scholar] [CrossRef] [PubMed]
  24. Garcia de la Serrana, D.; Macqueen, D.J. Insulin-Like Growth Factor-Binding Proteins of Teleost Fishes. Front. Endocrinol. 2018, 9, 80. [Google Scholar] [CrossRef]
  25. Shimizu, M.; Kishimoto, K.; Yamaguchi, T.; Nakano, Y.; Hara, A.; Dickhoff, W.W. Circulating salmon 28- and 22-kDa insulin-like growth factor binding proteins (IGFBPs) are co-orthologs of IGFBP-1. Gen. Comp. Endocrinol. 2011, 174, 97–106. [Google Scholar] [CrossRef] [PubMed] [Green Version]
  26. Maryoung, L.A.; Lavado, R.; Bammler, T.K.; Gallagher, E.P.; Stapleton, P.L.; Beyer, R.P.; Farin, F.M.; Hardiman, G.; Schlenk, D. Differential gene expression in liver, gill, and olfactory rosettes of coho salmon (Oncorhynchus kisutch) after acclimation to salinity. Mar. Biotechnol. 2015, 17, 703–717. [Google Scholar] [CrossRef] [Green Version]
  27. Breves, J.P.; Fujimoto, C.K.; Phipps-Costin, S.K.; Einarsdottir, I.E.; Bjornsson, B.T.; McCormick, S.D. Variation in branchial expression among insulin-like growth-factor binding proteins (igfbps) during Atlantic salmon smoltification and seawater exposure. BMC Physiol. 2017, 17, 2. [Google Scholar] [CrossRef] [Green Version]
  28. Breves, J.P.; Springer-Miller, R.; Chenoweth, D.; Paskavitz, A.; Chang, A.; Regish, A.M.; Einarsdottir, I.; Björnsson, B.T.; McCormick, S.D. Cortisol regulates insulin-like growth-factor binding protein (igfbp) gene expression in Atlantic salmon parr. Mol. Cell. Endocrinol. 2020, 518, 110989. [Google Scholar] [CrossRef]
  29. Khaw, H.L.; Gjerde, B.; Boison, S.A.; Hjelle, E.; Difford, G.F. Quantitative Genetics of Smoltification Status at the Time of Seawater Transfer in Atlantic Salmon (Salmo Salar). Front. Genet. 2021, 12, 696893. [Google Scholar] [CrossRef]
  30. Hoar, W. 4 The physiology of smolting salmonids. Fish Physiol. 1988, 11, 275–343. [Google Scholar] [CrossRef]
  31. Macqueen, D.J.; Garcia de la Serrana, D.; Johnston, I.A. Evolution of ancient functions in the vertebrate insulin-like growth factor system uncovered by study of duplicated salmonid fish genomes. Mol. Biol. Evol. 2013, 30, 1060–1076. [Google Scholar] [CrossRef] [Green Version]
  32. Fuentes, E.N.; Martin, S.A.; Johnston, I.A.; Macqueen, D.J. Divergent regulation of insulin-like growth factor binding protein genes in cultured Atlantic salmon myotubes under different models of catabolism and anabolism. Gen. Comp. Endocrinol. 2017, 247, 53–65. [Google Scholar] [CrossRef]
  33. Alzaid, A.; Martin, S.A.; Macqueen, D.J. The complete salmonid IGF-IR gene repertoire and its transcriptional response to disease. Sci. Rep. 2016, 6, 34806. [Google Scholar] [CrossRef] [PubMed] [Green Version]
  34. Liu, Y.; Lu, D.; Zhang, Y.; Li, S.; Liu, X.; Lin, H. The evolution of somatostatin in vertebrates. Gene 2010, 463, 21–28. [Google Scholar] [CrossRef]
  35. Tostivint, H.; Quan, F.B.; Bougerol, M.; Kenigfest, N.B.; Lihrmann, I. Impact of gene/genome duplications on the evolution of the urotensin II and somatostatin families. Gen. Comp. Endocrinol. 2013, 188, 110–117. [Google Scholar] [CrossRef]
  36. Tostivint, H.; Gaillard, A.-L.; Mazan, S.; Pézeron, G. Revisiting the evolution of the somatostatin family: Already five genes in the gnathostome ancestor. Gen. Comp. Endocrinol. 2019, 279, 139–147. [Google Scholar] [CrossRef] [PubMed]
  37. Macqueen, D.J.; Johnston, I.A. A well-constrained estimate for the timing of the salmonid whole genome duplication reveals major decoupling from species diversification. Proc. R. Soc. B 2014, 281, 20132881. [Google Scholar] [CrossRef] [Green Version]
  38. Sheridan, M.A.; Mommsen, T.P. Effects of nutritional state on in vivo lipid and carbohydrate metabolism of coho salmon (Oncorhynchus kisutch). Gen. Comp. Endocrinol. 1991, 81, 473–483. [Google Scholar] [CrossRef]
  39. Sheridan, M.A.; Hagemeister, A.L. Somatostatin and somatostatin receptors in fish growth. Gen. Comp. Endocrinol. 2010, 167, 360–365. [Google Scholar] [CrossRef]
  40. Patel, Y.C. Somatostatin and its receptor family. Front. Neuroendocrinol. 1999, 20, 157–198. [Google Scholar] [CrossRef]
  41. Ehrman, M.M.; Melroe, G.T.; Moore, C.A.; Kittilson, J.D.; Sheridan, M.A. Nutritional regulation of somatostatin expression in rainbow trout (Oncorhynchus mykiss). Fish Physiol. Biochem. 2002, 26, 309–314. [Google Scholar] [CrossRef]
  42. Kong, C.; Glen, P. The use of the somatostatin analogue octreotide for the conservative management of symptomatic cholecystocolonic fistula: A case report. Ann. R. Coll. Surg. 2019, 101, e59–e61. [Google Scholar] [CrossRef] [PubMed]
  43. Canosa, L.F.; Chang, J.P.; Peter, R.E. Neuroendocrine control of growth hormone in fish. Gen. Comp. Endocrinol. 2007, 151, 1–26. [Google Scholar] [CrossRef] [PubMed]
  44. Wood, A.W.; Duan, G.; Bern, H.A. Insulin-like growth factor signaling in fish. Int. Rev. Cytol. 2005, 243, 215–285. [Google Scholar] [CrossRef] [PubMed]
  45. Reinecke, M.; Björnsson, B.T.; Dickhoff, W.W.; McCormick, S.D.; Navarro, I.; Power, D.M.; Gutiérrez, J. Growth hormone and insulin-like growth factors in fish: Where we are and where to go. Gen. Comp. Endocrinol. 2005, 142, 20–24. [Google Scholar] [CrossRef]
  46. Gabillard, J.-C.; Kamangar, B.B.; Montserrat, N. Coordinated regulation of the GH/IGF system genes during refeeding in rainbow trout (Oncorhynchus mykiss). J. Endocrinol. 2006, 191, 15–24. [Google Scholar] [CrossRef] [Green Version]
  47. Rahman, M.S.; Thomas, P. Characterization of three IGFBP mRNAs in Atlantic croaker and their regulation during hypoxic stress: Potential mechanisms of their upregulation by hypoxia. Am. J. Physiol. 2011, 301, E637–E648. [Google Scholar] [CrossRef]
  48. Maures, T.J.; Duan, C. Structure, developmental expression, and physiological regulation of zebrafish IGF binding protein-1. Endocrinology 2002, 143, 2722–2731. [Google Scholar] [CrossRef]
  49. Dai, W.; Bai, Y.; Hebda, L.; Zhong, X.; Liu, J.; Kao, J.; Duan, C. Calcium deficiency-induced and TRP channel-regulated IGF1R-PI3K-Akt signaling regulates abnormal epithelial cell proliferation. Cell Death Differ. 2014, 21, 568–581. [Google Scholar] [CrossRef] [Green Version]
  50. Zheng, G.-D.; Zhou, C.-X.; Lin, S.-T.; Chen, J.; Jiang, X.-Y.; Zou, S.-M. Two grass carp (Ctenopharyngodon idella) insulin-like growth factor-binding protein 5 genes exhibit different yet conserved functions in development and growth. Comp. Biochem. Physiol. Part B Biochem. Mol. Biol. 2017, 204, 69–76. [Google Scholar] [CrossRef]
  51. Himes, R.W.; Smith, C.W. Tlr2 is critical for diet-induced metabolic syndrome in a murine model. FASEB J. 2010, 24, 731–739. [Google Scholar] [CrossRef] [Green Version]
  52. Chalmers, L.; Thompson, K.D.; Taylor, J.F.; Black, S.; Migaud, H.; North, B.; Adams, A. A comparison of the response of diploid and triploid Atlantic salmon (Salmo salar) siblings to a commercial furunculosis vaccine and subsequent experimental infection with Aeromonas salmonicida. Fish Shellfish Immunol. 2016, 57, 301–308. [Google Scholar] [CrossRef] [PubMed] [Green Version]
  53. McEwen, B.S.; Gianaros, P.J. Central role of the brain in stress and adaptation: Links to socioeconomic status, health, and disease. Ann. N. Y. Acad. Sci. 2010, 1186, 190–222. [Google Scholar] [CrossRef] [PubMed] [Green Version]
  54. Wood, A.W.; Schlueter, P.J.; Duan, C. Targeted knockdown of insulin-like growth factor binding protein-2 disrupts cardiovascular development in zebrafish embryos. Mol. Endocrinol. 2005, 19, 1024–1034. [Google Scholar] [CrossRef] [PubMed]
  55. Zhou, J.; Li, W.; Kamei, H.; Duan, C. Duplication of the IGFBP-2 gene in teleost fish: Protein structure and functionality conservation and gene expression divergence. PLoS ONE 2008, 3, e3926. [Google Scholar] [CrossRef] [Green Version]
  56. Bower, N.I.; Johnston, I.A. Transcriptional regulation of the IGF signaling pathway by amino acids and insulin-like growth factors during myogenesis in Atlantic salmon. PLoS ONE 2010, 5, e11100. [Google Scholar] [CrossRef] [Green Version]
  57. Kusakabe, M.; Ishikawa, A.; Ravinet, M.; Yoshida, K.; Makino, T.; Toyoda, A.; Fujiyama, A.; Kitano, J. Genetic basis for variation in salinity tolerance between stickleback ecotypes. Mol. Ecol. 2017, 26, 304–319. [Google Scholar] [CrossRef] [Green Version]
  58. Pellissier, T.; Al Nafea, H.; Good, S.V. Divergence of insulin superfamily ligands, receptors and Igf binding proteins in marine versus freshwater stickleback: Evidence of selection in known and novel genes. Comp. Biochem. Physiol. Part D Genom. Proteom 2018, 25, 53–61. [Google Scholar] [CrossRef]
  59. Kim, D.; Langmead, B.; Salzberg, S.L. HISAT: A fast spliced aligner with low memory requirements. Nat. Methods 2015, 12, 357–360. [Google Scholar] [CrossRef] [Green Version]
  60. Love, M.I.; Huber, W.; Anders, S. Moderated estimation of fold change and dispersion for RNA-seq data with DESeq2. Genome Biol. 2014, 15, 550. [Google Scholar] [CrossRef] [Green Version]
  61. Tamura, K.; Stecher, G.; Kumar, S. MEGA11: Molecular Evolutionary Genetics Analysis Version 11. Mol. Biol. Evol. 2021, 38, 3022–3027. [Google Scholar] [CrossRef]
  62. Saitou, N.; Nei, M. The neighbor-joining method: A new method for reconstructing phylogenetic trees. Mol. Biol. Evol. 1987, 4, 406–425. [Google Scholar] [CrossRef] [PubMed]
  63. Zeng, C.; Hou, Z.-S.; Zhao, H.-K.; Xin, Y.-R.; Liu, M.-Q.; Yang, X.-D.; Wen, H.-S.; Li, J.-F. Identification and characterization of caspases genes in rainbow trout (Oncorhynchus mykiss) and their expression profiles after Aeromonas salmonicida and Vibrio anguillarum infection. Dev. Comp. Immunol. 2021, 118, 103987. [Google Scholar] [CrossRef] [PubMed]
  64. Livak, K.J.; Schmittgen, T.D. Analysis of relative gene expression data using real-time quantitative PCR and the 2−ΔΔCT method. Methods 2001, 25, 402–408. [Google Scholar] [CrossRef] [PubMed]
  65. Zhao, H.; Soufan, O.; Xia, J.; Tang, R.; Li, L.; Li, D. Transcriptome and physiological analysis reveal alterations in muscle metabolisms and immune responses of grass carp (Ctenopharyngodon idellus) cultured at different stocking densities. Aquaculture 2019, 503, 186–197. [Google Scholar] [CrossRef]
  66. Mouton, A.J.; Ma, Y.; Rivera Gonzalez, O.J.; Daseke, M.J.; Flynn, E.R.; Freeman, T.C.; Garrett, M.R.; DeLeon-Pennell, K.Y.; Lindsey, M.L. Fibroblast polarization over the myocardial infarction time continuum shifts roles from inflammation to angiogenesis. Basic Res. Cardiol. 2019, 114, 6. [Google Scholar] [CrossRef] [PubMed] [Green Version]
  67. Anders, S.; Huber, W. Differential Expression of RNA-Seq Data at the Gene Level—The DESeq Package; European Molecular Biology Laboratory (EMBL): Heidelberg, Germany, 2012. [Google Scholar]
  68. Chong, J.; Wishart, D.S.; Xia, J. Using MetaboAnalyst 4.0 for comprehensive and integrative metabolomics data analysis. Curr. Protoc. Bioinform. 2019, 68, e86. [Google Scholar] [CrossRef]
  69. Yang, X.-D.; Hou, Z.-S.; Liu, M.-Q.; Zeng, C.; Zhao, H.-K.; Xin, Y.-R.; Xiang, K.-W.; Yang, Q.; Wen, H.-S.; Li, J.-F. Identification and characterization of mkk genes and their expression profiles in rainbow trout (Oncorhynchus mykiss) symptomatically or asymptomatically infected with Vibrio anguillarum. Fish Shellfish Immunol. 2022, 121, 1–11. [Google Scholar] [CrossRef]
  70. Liu, M.; Yang, X.; Zeng, C.; Zhao, H.; Li, J.; Hou, Z.; Wen, H. Transcriptional Signatures of Immune, Neural, and Endocrine Functions in the Brain and Kidney of Rainbow Trout (Oncorhynchus mykiss) in Response to Aeromonas salmonicida Infection. Int. J. Mol. Sci. 2022, 23, 1340. [Google Scholar] [CrossRef]
Figure 1. Chromosomal distribution, phylogenetic, syntenic analysis of sst genes in rainbow trout. (A) The chromosomal localization of sst genes. (B) Phylogenetic tree of the SST family in vertebrate. The amino acid sequences were analyzed via a neighbor-joining method with 1000 bootstrap replications. Rainbow trout SSTs are highlighted by a red pentacle. (C) Gene structure and protein motif of SST proteins of rainbow trout. (I) Exon and intron structures of SST proteins in rainbow trout. Phylogenetic tree was constructed by a neighbor-joining method with 1000 bootstrap replications. (II) Protein motif analyses of SST proteins in rainbow trout. Eight specific motifs were found in SST proteins of rainbow trout, different colors represent different motifs. (DG) Conserved syntenic analyses of sst genes: sst1a/b and sst3a/b (1D); sst2 (1E); sst5 (1F); sst6 (1G). sst genes are shown by the same color. The double slash represents the omission of more than two genes.
Ijms 23 08691 g001aIjms 23 08691 g001b
Figure 2. The basal expression of ghrh-sst-gh-igf axis in triploid trout. (AF) The gene expression of ghrh and receptors (A), gh and receptors (B), sst (C), sstr (D), igf and receptors (E), and igfbps (F) in brain. (GL) The gene expression of ghrh and receptors (G), gh and receptors (H), sst (I), sstr (J), igf and receptors (K), and igfbps (L) in kidney. (MR) The gene expression of ghrh and receptors (M), gh and receptors (N), sst (O), sstr (P), igf and receptors (Q), and igfbps (R) in liver. The gene expression levels were generated via counts normalized by DESeq2. The “*” indicates average count > 5.
Ijms 23 08691 g002
Figure 3. The transcriptional signature of ghrh-sst-gh-igf axis in brain in diploid and triploid trout. (A) The heatmap of ghrh-sst-gh-igf axis in brain. (B,C) Principal component analysis (B) and loading plot (C) of ghrh-sst-gh-igf axis. (D,E) Partial least squares discriminant analysis (D) and loading plot (E) of ghrh-sst-gh-igf axis. In loading plot, gene(s) further away from center point (0, 0) showed obvious effects on principal component analysis/partial least squares-discriminant analysis. (F,G) Key genes of ghrh-sst-gh-igf axis of TS/DS (F) and TS/TF (G). Genes were selected based on the principle of Log2|Foldchange| ≥ 1 or p value < 0.05 (Log10(count+1) by Student’s t-test, “*” p < 0.05; “**” p < 0.01). TS: triploid seawater exposure; DS: diploid seawater exposure group; TF: triploid freshwater exposure group.
Ijms 23 08691 g003
Figure 4. The transcriptional signature of ghrh-sst-gh-igf axis in liver in diploid and triploid trout. (A) The heatmap of ghrh-sst-gh-igf axis in brain. (B,C) Principal component analysis (B) and loading plot (C) of ghrh-sst-gh-igf axis. (D,E) Partial least squares discriminant analysis (D) and loading plot (E) of ghrh-sst-gh-igf axis. In loading plot, gene(s) further away from center point (0, 0) showed obvious effects on principal component analysis/partial least squares-discriminant analysis. (F,G) Key genes of ghrh-sst-gh-igf axis of TS/DS (F) and TS/TF(G). Genes were selected based on the principle of Log2|Foldchange| ≥ 1 or p value < 0.05 (Log10(count+1) by Student’s t-test, “*” p < 0.05). TS: triploid seawater exposure; DS: diploid seawater exposure group; TF: triploid freshwater exposure group.
Ijms 23 08691 g004
Figure 5. The transcriptional signature of ghrh-sst-gh-igf axis in kidney in diploid and triploid trout. (A) The heatmap of ghrh-sst-gh-igf axis in brain. (B,C) Principal component analysis (B) and loading plot (C) of ghrh-sst-gh-igf axis. D and E: Partial least squares discriminant analysis (D) and loading plot (E) of ghrh-sst-gh-igf axis. In loading plot, gene(s) further away from center point (0, 0) showed obvious effects on principal component analysis/partial least squares-discriminant analysis. (F,G) Key genes of ghrh-sst-gh-igf axis of TS/DS (F) and TS/TF (G). Genes were selected based on the principle of Log2|Foldchange| ≥ 1 or p value < 0.05 (Log10(count+1) by Student’s t-test, “*” p < 0.05; “**” p < 0.01). TS: triploid seawater exposure; DS: diploid seawater exposure group; TF: triploid freshwater exposure group.
Ijms 23 08691 g005
Figure 6. Correlation analysis of ghrh-sst-gh-igf axis in brain, kidney, and liver. (AF) Heatmap of correlation of ghrh-sst-gh-igf axis in brain (A) and the Pearson correlation coefficient of two genes in brain (BF). (GK) Heatmap of correlation of ghrh-sst-gh-igf axis in kidney (G) and the Pearson correlation coefficient of two genes in kidney (HK). (LV) Heatmap of correlation of ghrh-sst-gh-igf axis in liver (L) and the Pearson correlation coefficient of two genes in liver (MV).
Ijms 23 08691 g006
Table 1. The sequence information and accession number of sst family members.
Gene NameChromosome IDmRNA (bp)Protein Length (aa)MW (KDa)pIAccession Numbers
sst1a2777111412.420325.51XP_021442876.1
sst1b1578511412.461355.14XP_021418859.1
sst2988711112.472536.31XP_021471775.1
sst3a1562411512.9631610.16NP_001118175.1
sst3b2764111112.325087.66XP_021442875.1
sst59382210812.064046.10XP_021470745.1
sst699439811.501448.54XP_021472825.1
Table 2. Comparison of ghrh-gh-sst-igf axis between diploid and triploid trout.
BrainLiverKidney
GeneTriploidDiploidFoldGeneTriploidDiploidFoldGeneTriploidDiploidFold
ghrh2.190.573.82ghrb12761.296143.880.45ghrh1.040.119.17
ghrhr21.890.613.11sst1b264.44116.812.26ghrhrl20.000.730.00
sst1a282.6660.844.65sst1a69.47124.070.56ghrhrl175.5921.003.60
sst3b40.725.747.10sst3b233.0761.203.81ghra115.677.072.22
sst5370.7769.895.30sstr1a126.748.783.05ghrb1254.22133.561.90
sstr2a2118.2748.682.43igf1a18799.162417.773.64sst1b3.360.744.57
sstr3b172.4932.155.37igf1a24784.271005.804.76sst53.221.092.96
sstr5a1.463.890.38igfbp1a17261.6213,604.070.53sstr1a16.033.511.72
igfbp1b13.330.00 igfbp3a22.4510.940.22sstr5b1.720.276.40
igfbp3a25.941.713.46igfbp4a25.1144.170.57igf1a1158.1529.805.31
igfbp3b26.3713.750.46igfbp4b1014.94231.544.38igf1a273.939.657.66
igfbp5a293.8224.073.90igfbp5a148.17178.170.27igf1ra156.3323.542.39
igfbp6a12.264.070.55igfbp6a10.000.780.00igfbp1a291.6930.752.98
igfbp2a2120.22241.840.50
igfbp3a20.000.490.00
igfbp4a82.4340.552.03
igfbp6b1153.3283.791.83
Publisher’s Note: MDPI stays neutral with regard to jurisdictional claims in published maps and institutional affiliations.