Effects of Rhizosphere Bacteria on Strawberry Plants (Fragaria × ananassa Duch.) under Water Deficit
Abstract
:1. Introduction
2. Results
2.1. Bioassays for Plant Growth Promoting Traits
2.2. Bacterial Counts in Substrate
2.3. Chlorophyll Fluorescence
3. Discussion
4. Materials and Methods
4.1. Location of the Experiment, Plant Material, and Growth Conditions
4.2. Experimental Factors
- −
- K0—plants not inoculated with rhizospheric bacteria,
- −
- KMg—application of MgSO4 nutrient solution without bacteria to the growth substrate in the amount of 40 cm3/plant, +
- −
- DLGB 2—inoculation with Bacillus sp. strain DLGB 2,
- −
- DLGB 3—inoculation with Bacillus sp. strain DLGB 3,
- −
- DKB 26—inoculation with Bacillus sp. strain DKB 26,
- −
- DKB 58—inoculation with Bacillus sp. strain DKB 58,
- −
- DKB 84—inoculation with Bacillus sp. strain DKB 84,
- −
- DKB 63—inoculation with Pantoea sp. strain DKB 63,
- −
- DKB 64—inoculation with Pantoea sp. strain DKB 64,
- −
- DKB 65—inoculation with Pantoea sp. strain DKB 65,
- −
- DKB 68—inoculation with Pantoea sp. strain DKB 68,
- −
- DKB 70—inoculation with Pantoea sp. strain DKB 70,
- −
- AJ 1.1—inoculation with Azotobacter sp. strain AJ 1.1,
- −
- PJ 1.2—inoculation with Pseudomonas sp. strain PJ 1.2.
4.3. Bioassays for Plant Growth Promoting Traits
4.4. Bacterial Counts in Substrate
4.5. Chlorophyll “a” Fluorescence
4.6. Statistical Methods
5. Conclusions
Author Contributions
Funding
Institutional Review Board Statement
Informed Consent Statement
Data Availability Statement
Conflicts of Interest
References
- Golldack, D.; Li, C.; Mohan, H.; Probst, N. Tolerance to drought and salt stress in plants: Unraveling the signaling networks. Front. Plant Sci. 2014, 5, 151. [Google Scholar] [CrossRef] [PubMed]
- Kumar, A.; Verma, J.P. Does plant-microbe interaction confer stress tolerance in plants: A review? Microbiol. Res. 2018, 207, 41–52. [Google Scholar] [CrossRef] [PubMed]
- Hura, T.; Grzesiak, S.; Hura, K.; Thiemt, E.; Tokarz, K.; Wȩdzony, M. Physiological and biological tools useful in drought-tolerance detection in genotypes of winter triticale: Accumulation of ferulic acid correlates with drought tolerance. Ann. Bot. 2007, 100, 767. [Google Scholar] [CrossRef]
- Zhou, Y.; Lam, H.M.; Zhang, J. Inhibition of photosynthesis and energy dissipation induced by water and high light stresses in rice. J. Exp. Bot. 2007, 58, 1207–1217. [Google Scholar] [CrossRef]
- Kalaji, M.H.; Pietkiewicz, S. Some physiological indices to be exploited as a crucial tool in plant breeding. Plant Breed. Seed Sci. 2004, 49, 19–39. [Google Scholar]
- Philippot, L.; Raaijmakers, J.M.; Lemanceau, P.; van Der Putten, W.H. Going back to the roots: The microbial ecology of the rhizosphere. Nat. Rev. Microbiol. 2013, 11, 789–799. [Google Scholar] [CrossRef]
- Berg, G.; Grube, M.; Schloter, M.; Smalla, K. Unraveling the plant microbiome: Looking back and future perspectives. Front. Microbiol. 2014, 5, 148. [Google Scholar] [CrossRef]
- Mikiciuk, G.; Sas-Paszt, L.; Mikiciuk, M.; Derkowska, E.; Trzciński, P.; Głuszek, S.; Lisek, A.; Wera-Bryl, S.; Rudnicka, J. Mycorrhizal frequency, physiological parameters, and yield of strawberry plants inoculated with endomycorrhizal fungi and rhizosphere bacteria. Mycorrhiza 2019, 29, 489–501. [Google Scholar] [CrossRef]
- Yaghoubi Khanghahi, M.; Leoni, B.; Crecchio, C. Photosynthetic responses of durum wheat to chemical/microbiological fertilization management under salt and drought stresses. Acta Physiol. Plant 2021, 43, 123. [Google Scholar] [CrossRef]
- Cohen, A.C.; Bottini, R.; Pontin, M.; Berli, F.J.; Moreno, D.; Boccanlandro, H.; Travaglia, C.N.; Piccoli, P.N. Azospirillum brasilense ameliorates the response of Arabidopsis thaliana to drought mainly via enhancement of ABA levels. Physiol Plant 2015, 153, 79–90. [Google Scholar] [CrossRef]
- Naseem, H.; Bano, A. Role of plant growth-promoting rhizobacteria and their exopolysaccharide in drought tolerance of maize. J. Plant Interaction 2014, 9, 689–701. [Google Scholar] [CrossRef] [Green Version]
- Ma, Y.; Oliveira, R.S.; Freitas, H.; Zhang, C. Biochemical and molecular mechanisms of plant-microbe-metal interactions: Relevance for phytoremediation. Front. Plant Sci. 2016, 7, 918. [Google Scholar] [CrossRef]
- Meena, H.; Ahmed, M.A.; Prakash, P. Amelioration of heat stress in wheat, Triticum aestivum by PGPR (Pseudomonas aeruginosa strain 2CpS1). Biosci. Biotech. Res. Comm 2015, 8, 171–174. [Google Scholar]
- Chatterjee, P.; Kanagendran, A.; Samaddar, S.; Pazouki, L.; Sa, T.M.; Niinemets, Ü. Influence of Brevibacterium linens RS16 on foliage photosynthetic and volatile emission characteristics upon heat stress in Eucalyptus grandis. Sci. Total Environ. 2020, 700, 134453. [Google Scholar] [CrossRef]
- Zubair, M.; Hanif, A.; Farzand, A.; Sheikh, T.M.M.; Khan, A.R.; Suleman, M.; Ayaz, M.; Gao, X. Genetic screening and expression analysis of psychrophilic Bacillus spp. reveal their potential to alleviate cold stress and modulate phytohormones in wheat. Microorganisms 2019, 7, 337. [Google Scholar] [CrossRef]
- Azarmi, F.; Mozafari, V.; Abbaszadeh Dahaji, P.; Hamidpour, M. Biochemical, physiological and antioxidant enzymatic activity responses of pistachio seedlings treated with plant growth promoting rhizobacteria and Zn to salinity stress. Acta Physiol. Plant. 2016, 38, 21. [Google Scholar] [CrossRef]
- Suarez, C.; Cardinale, M.; Ratering, S.; Steffens, D.; Jung, S.; Montoya, A.M.Z.; Geissler-Plaum, R.; Schnell, S. Plant growth-promoting effects of Hartmannibacter diazotrophicus on summer barley (Hordeum vulgare L.) under salt stress. Appl. Soil Ecol. 2015, 95, 23–30. [Google Scholar] [CrossRef]
- Abdelkrim, S.; Jebara, S.H.; Saadani, O.; Abid, G.; Taamalli, W.; Zemni, H.; Mannai, K.; Louati, F.; Jebara, M. In situ effects of Lathyrus sativus—PGPR to remediate and restore quality and fertility of Pb and Cd polluted soils. Ecotoxicol. Environ. Saf. 2020, 192, 110260. [Google Scholar] [CrossRef]
- Kang, S.M.; Asaf, S.; Khan, A.L.; Khan, A.; Mun, B.G.; Khan, M.A.; Gul, H.; Lee, I.J. Complete genome sequence of Pseudomonas psychrotolerans CS51, a plant growth-promoting bacterium, under heavy metal stress conditions. Microorganisms 2020, 8, 382. [Google Scholar] [CrossRef]
- Lee, B.D.; Dutta, S.; Ryu, H.; Yoo, S.J.; Suh, D.S.; Park, K. Induction of systemic resistance in Panax ginseng against Phytophthora cactorum by native Bacillus amyloliquefaciens HK34. J. Ginseng Res. 2015, 39, 213. [Google Scholar] [CrossRef]
- Ghazalibiglar, H.; Hampton, J.G.; de Jong, E.V.Z.; Holyoake, A. Is induced systemic resistance the mechanism for control of black rot in Brassica oleracea by a Paenibacillus sp.? Biol. Control 2016, 92, 195–201. [Google Scholar] [CrossRef]
- Glick, B.R. Plant growth-promoting bacteria: Mechanisms and applications. Scientifica 2012, 2012, 963401. [Google Scholar] [CrossRef] [Green Version]
- Sarma, R.K.; Saikia, R. Alleviation of drought stress in mung bean by strain Pseudomonas aeruginosa GGRJ21. Plant Soil 2014, 377, 111–126. [Google Scholar] [CrossRef]
- Bhattacharyya, P.N.; Jha, D.K. Plant growth-promoting rhizobacteria (PGPR): Emergence in agriculture. World J. Microbiol. Biotechnol. 2012, 28, 1327–1350. [Google Scholar] [CrossRef]
- Nautiyal, C.S.; Srivastava, S.; Chauhan, P.S.; Seem, K.; Mishra, A.; Sopory, S.K. Plant growth-promoting bacteria Bacillus amyloliquefaciens NBRISN13 modulates gene expression profile of leaf and rhizosphere community in rice during salt stress. Plant Physiol. Biochem. 2013, 66, 1–9. [Google Scholar] [CrossRef]
- Tiwari, S.; Lata, C.; Chauhan, P.S.; Nautiyal, C.S. Pseudomonas putida attunes morphophysiological, biochemical and molecular responses in Cicer arietinum L. during drought stress and recovery. Plant Physiol. Biochem. 2016, 99, 108–117. [Google Scholar] [CrossRef]
- Goswami, D.; Thakker, J.N.; Dhandhukia, P.C.; Moral, M.T. Portraying mechanics of plant growth promoting rhizobacteria (PGPR): A review. Cogent Food Agric. 2016, 2, 1127500. [Google Scholar] [CrossRef]
- Lim, J.-H.; Kim, S.-D. Induction of drought stress resistance by multi-functional PGPR Bacillus licheniformis K11 in pepper. Plant Pathol. J 2013, 29, 201–208. [Google Scholar] [CrossRef]
- Ngumbi, E.; Kloepper, J. Bacterial-mediated drought tolerance: Current and future prospects. Appl. Soil Ecol. 2016, 105, 109–125. [Google Scholar] [CrossRef]
- Rubin, R.L.; van Groenigen, K.J.; Hungate, B.A. Plant growth promoting rhizobacteria are more effective under drought: A meta-analysis. Plant Soil 2017, 416, 309–323. [Google Scholar] [CrossRef]
- Ahmad, H.M.; Fiaz, S.; Hafeez, S.; Zahra, S.; Shah, A.N.; Gul, B.; Aziz, O.; Fakhar, A.; Rafique, M.; Chen, Y.; et al. Plant growth-promoting rhizobacteria eliminate the effect of drought stress in plants: A review. Front. Plant Sci. 2022, 13, 875774. [Google Scholar] [CrossRef] [PubMed]
- Chen, C.; Xin, K.; Liu, H.; Cheng, J.; Shen, X.; Wang, Y.; Zhang, L. Pantoea alhagi, a novel endophytic bacterium with ability to improve growth and drought tolerance in wheat. Sci. Rep. 2017, 7, 41564. [Google Scholar] [CrossRef] [PubMed] [Green Version]
- Uzma, M.; Iqbal, A.; Hasnain, S. Drought tolerance induction and growth promotion by indole acetic acid producing Pseudomonas aeruginosa in Vigna radiata. PLoS ONE 2022, 17, e0262932. [Google Scholar] [CrossRef]
- Sharma, P.; Kumawat, K.C.; Kaur, S. Plant growth promoting rhizobacteria in nutrient enrichment: Current perspectives. In Biofortification of Food Crops; Singh, U., Praharaj, C., Singh, S., Singh, N., Eds.; Springer: New Delhi, India, 2016; pp. 263–289. [Google Scholar]
- Lal, S.; Chiarini, L.; Tabacchioni, S. New insights in plant-associated Paenibacillus species: Biocontrol and plant growth-promoting activity. In Bacilli and Agrobiotechnology; Islam, M., Rahman, M., Pandey, P., Jha, C., Aeron, A., Eds.; Springer: Cham, Switzerland, 2016; pp. 237–279. [Google Scholar]
- Chauhan, H.; Bagyaraj, D.J.; Selvakumar, G.; Sundaram, S.P. Novel plant growth promoting rhizobacteria—Prospects and potential. Appl. Soil Ecol. 2015, 95, 38–53. [Google Scholar] [CrossRef]
- Lema-Rumińska, J.; Kulus, D.; Tymoszuk, A.; Miler, N.; Woźny, A.; Wenda-Piesik, A. Physiological, biochemical, and biometrical response of cultivated strawberry and wild strawberry in greenhouse gutter cultivation in the autumn-winter season in Poland—Preliminary Study. Agronomy 2021, 11, 1633. [Google Scholar] [CrossRef]
- Caulet, R.P.; Gradinariu, G.; Iurea, D.; Morariu, A. Influence of furostanol glycosides treatments on strawberry (Fragaria × ananassa Duch.) growth and photosynthetic characteristics under drought condition. Sci. Hortic. 2014, 169, 179–188. [Google Scholar] [CrossRef]
- Li, H.; Li, T.; Gordon, R.J.; Asiedu, S.K.; Hu, K. Strawberry plant fruiting efficiency and its correlation with solar irradiance, temperature, and reflectance water index variation. Environ. Exp. Bot. 2010, 68, 165–174. [Google Scholar] [CrossRef]
- Klamkowski, K.; Treder, W.; Wójcik, K. Effects of long-term water stress on leaf gas exchange, growth, and yield of three strawberry cultivars. Acta Sci. Pol. Hortorum Cultus 2015, 14, 55–65. [Google Scholar]
- Ahmad, F.; Ahmad, I.; Khan, M.S. Screening of free-living rhizospheric bacteria for their multiple plant growth promoting activities. Microbiol. Res. 2008, 163, 173–181. [Google Scholar] [CrossRef]
- Govindasamy, V.; Senthilkumar, M.; Magheshwaran, V.; Kumar, U.; Bose, P.; Sharma, V.; Annapurna, K. Bacillus and Paenibacillus spp.: Potential PGPR for sustainable agriculture. In Plant Growth and Health Promoting Bacteria; Maheshwari, D.K., Ed.; Microbiology Monographs; Springer: Berlin/Heidelberg, Germany, 2010; pp. 333–364. [Google Scholar]
- Ferreira, C.M.H.; Soares, H.M.V.M.; Soares, E.V. Promising bacterial genera for agricultural practices: An insight on plant growth-promoting properties and microbial safety aspects. Sci. Total Environ. 2019, 682, 779–799. [Google Scholar] [CrossRef]
- Cueva-Yesquén, L.G.; Goulart, M.C.; Attili de Angelis, D.; Nopper Alves, M.; Fantinatti-Garboggini, F. Multiple plant growth-promotion traits in endophytic bacteria retrieved in the vegetative stage from passionflower. Front. Plant Sci. 2021, 11, 2282. [Google Scholar] [CrossRef]
- Comeau, D.; Balthazar, C.; Novinscak, A.; Bouhamdani, N.; Joly, D.L.; Filion, M. Interactions between Bacillus spp., Pseudomonas spp. and Cannabis sativa promote plant growth. Front. Microbiol. 2021, 12, 2688. [Google Scholar] [CrossRef]
- Andreolli, M.; Lampis, S.; Zapparoli, G.; Angelini, E.; Vallini, G. Diversity of bacterial endophytes in 3 and 15 year-old grapevines of Vitis vinifera cv. Corvina and their potential for plant growth promotion and phytopathogen control. Microbiol. Res. 2016, 183, 42–52. [Google Scholar] [CrossRef]
- Castagno, L.N.; Estrella, M.J.; Sannazzaro, A.I.; Grassano, A.E.; Ruiz, O.A. Phosphate-solubilization mechanism and in vitro plant growth promotion activity mediated by Pantoea eucalypti isolated from Lotus tenuis rhizosphere in the Salado River Basin (Argentina). J. Appl. Microbiol. 2011, 110, 1151–1165. [Google Scholar] [CrossRef]
- Spaepen, S.; Vanderleyden, J. Auxin and plant-microbe interactions. Cold Spring Harb. Perspect. Biol. 2011, 3, a001438. [Google Scholar] [CrossRef]
- Rajkumar, M.; Ae, N.; Prasad, M.N.V.; Freitas, H. Potential of siderophore-producing bacteria for improving heavy metal phytoextraction. Trends Biotechnol. 2010, 28, 142–149. [Google Scholar] [CrossRef]
- Saeid, A.; Prochownik, E.; Dobrowolska-Iwanek, J. Phosphorus solubilization by Bacillus species. Molecules 2018, 23, 2897. [Google Scholar] [CrossRef]
- Zahir, Z.A.; Munir, A.; Asghar, H.N.; Shaharoona, B.; Arshad, M. Effectiveness of rhizobacteria containing ACC deaminase for growth promotion of peas (Pisum sativum) under drought conditions. J. Microbiol. Biotechnol. 2008, 18, 958–963. [Google Scholar]
- Aasfar, A.; Bargaz, A.; Yaakoubi, K.; Hilali, A.; Bennis, I.; Zeroual, Y.; Meftah Kadmiri, I. Nitrogen fixing Azotobacter species as potential soil biological enhancers for crop nutrition and yield stability. Front. Microbiol. 2021, 12, 354. [Google Scholar] [CrossRef]
- Chandran, H.; Meena, M.; Swapnil, P. Plant growth-promoting rhizobacteria as a green alternative for sustainable agriculture. Sustainability 2021, 13, 10986. [Google Scholar] [CrossRef]
- Kudoyarova, G.; Arkhipova, T.; Korshunova, T.; Bakaeva, M.; Loginov, O.; Dodd, I.C. Phytohormone mediation of interactions between plants and non-symbiotic growth promoting bacteria under edaphic stresses. Front. Plant Sci. 2019, 10, 1368. [Google Scholar] [CrossRef] [PubMed]
- Kour, D.; Khan, S.S.; Kaur, T.; Kour, H.; Singh, G.; Yadav, A.; Yadav, A.N. Drought adaptive microbes as bioinoculants for the horticultural crops. Heliyon 2022, 8, e09493. [Google Scholar] [CrossRef] [PubMed]
- Dimkpa, C.; Weinand, T.; Asch, F. Plant–rhizobacteria interactions alleviate abiotic stress conditions. Plant Cell Environ. 2009, 32, 1682–1694. [Google Scholar] [CrossRef]
- Yang, J.; Kloepper, J.W.; Ryu, C.M. Rhizosphere bacteria help plants tolerate abiotic stress. Trends Plant Sci. 2009, 14, 1–4. [Google Scholar] [CrossRef] [PubMed]
- Timmusk, S.; Abd El-Daim, I.A.; Copolovici, L.; Tanilas, T.; Kännaste, A.; Behers, L.; Nevo, E.; Seisenbaeva, G.; Stenström, E.; Niinemets, Ü. Drought-tolerance of wheat improved by rhizosphere bacteria from harsh environments: Enhanced biomass production and reduced emissions of stress volatiles. PLoS ONE 2014, 9, e96086. [Google Scholar] [CrossRef]
- Wang, C.; Guo, Y.; Wang, C.; Liu, H.; Niu, D.; Wang, Y.; Guo, J. Enhancement of tomato (Lycopersicon esculentum) tolerance to drought stress by plant-growth-promoting rhizobacterium (PGPR) Bacillus cereus AR156. J. Agr. Biotechnol. 2012, 20, 1097–1105. [Google Scholar]
- Amellal, N.; Burtin, G.; Bartoli, F.; Heulin, T. Colonization of wheat roots by an exopolysaccharide-producing Pantoea agglomerans strain and its effect on rhizosphere soil aggregation. Appl. Environ. Microbiol. 1998, 64, 3740. [Google Scholar] [CrossRef]
- Shirinbayan, S.; Khosravi, H.; Malakouti, M.J. Alleviation of drought stress in maize (Zea mays) by inoculation with Azotobacter strains isolated from semi-arid regions. Appl. Soil Ecol. 2019, 133, 138–145. [Google Scholar] [CrossRef]
- Griffiths, R.I.; Whiteley, A.S.; O’Donnell, A.G.; Bailey, M.J. Physiological and community responses of established grassland bacterial populations to water stress. Appl. Environ. Microbiol. 2003, 69, 6961. [Google Scholar] [CrossRef]
- Omar, S.A.; Fetyan, N.A.H.; Eldenary, M.E.; Abdelfattah, M.H.; Abd-Elhalim, H.M.; Wróbel, J.; Kalaji, H.M. Alteration in expression level of some growth and stress-related genes after rhizobacteria inoculation to alleviate drought tolerance in sensitive rice genotype. Chem. Biol. Technol. Agric. 2021, 8, 41. [Google Scholar] [CrossRef]
- Ilyas, N.; Bano, A.; Iqbal, S.; Raja, N.I. Physiological, biochemical and molecular characterization of Azospirillum spp. isolated from maize under water stress. Pak. J. Bot. 2012, 44, 71–80. [Google Scholar]
- Masrahi, Y.S.; Al-Turki, T.A.; Sayed, O.H. Photosynthetic adaptation, and survival strategy of Duvalia velutina in an extremely arid environment. Photosynthetica 2015, 53, 555–561. [Google Scholar] [CrossRef]
- Yan, N.; Zhang, Y.L.; Xue, H.M.; Zhang, X.H.; Wang, Z.D.; Shi, L.Y.; Guo, D.P. Changes in plant growth and photosynthetic performance of Zizania latifolia exposed to different phosphorus concentrations under hydroponic condition. Photosynthetica 2015, 53, 630–635. [Google Scholar] [CrossRef]
- Ware, M.A.; Belgio, E.; Ruban, A.V. Photoprotective capacity of nonphotochemical quenching in plants acclimated to different light intensities. Photosynth. Res. 2015, 126, 261–274. [Google Scholar] [CrossRef] [PubMed]
- Faraloni, C.; Cutino, I.; Petruccelli, R.; Leva, A.R.; Lazzeri, S.; Torzillo, G. Chlorophyll fluorescence technique as a rapid tool for in vitro screening of olive cultivars (Olea europaea L.) tolerant to drought stress. Environ. Exp. Bot. 2011, 73, 49–56. [Google Scholar] [CrossRef]
- Xu, D.Q. Photosynthetic Efficiency; Shanghai Scientific and Technical Publishers: Shanghai, China, 2002; pp. 57–61. [Google Scholar]
- Angelini, G.; Ragni, P.; Esposito, D.; Giardi, P.; Pompili, M.L.; Moscardelli, R.; Giardi, M.T. A device to study the effect of space radiation on photosynthetic organisms. Phys. Med. 2001, 17, 267–268. [Google Scholar]
- Liang, G.; Liu, J.; Zhang, J.; Guo, J. Effects of drought stress on photosynthetic and physiological parameters of tomato. J. Amer. Soc. Hort. Sci. 2020, 145, 12–17. [Google Scholar] [CrossRef] [Green Version]
- Tribulato, A.; Toscano, S.; Di Lorenzo, V.; Romano, D. Effects of water stress on gas exchange, water relations and leaf structure in two ornamental shrubs in the Mediterranean area. Agronomy 2019, 9, 381. [Google Scholar] [CrossRef]
- Souza, R.P.; Machado, E.C.; Silva, J.A.B.; Lagôa, A.M.M.A.; Silveira, J.A.G. Photosynthetic gas exchange, chlorophyll fluorescence and some associated metabolic changes in cowpea (Vigna unguiculata) during water stress and recovery. Environ. Exp. Bot. 2004, 51, 45–56. [Google Scholar] [CrossRef]
- Tari, I.; Camen, D.; Coradini, G.; Csiszár, J.; Fediuc, E.; Gémes, K.; Lazar, A.; Madosa, E.; Mihacea, S.; Poór, P.; et al. Changes in chlorophyll fluorescence parameters and oxidative stress responses of bush bean genotypes for selecting contrasting acclimation strategies under water stress. Acta Biol. Hung. 2008, 59, 335–345. [Google Scholar] [CrossRef]
- Ohashi, Y.; Nakayama, N.; Saneoka, H.; Fujita, K. Effects of drought stress on photosynthetic gas exchange, chlorophyll fluorescence and stem diameter of soybean plants. Biol. Plant. 2006, 50, 138–141. [Google Scholar] [CrossRef]
- Czyczyło-Mysza, I.; Myśków, B. Analysis of the impact of drought on selected morphological, biochemical, and physiological traits of rye inbred lines. Acta Physiol. Plant. 2017, 39, 87–94. [Google Scholar] [CrossRef]
- Razavi, F.; Pollet, B.; Steppe, K.; Van Labeke, M.C. Chlorophyll fluorescence as a tool for evaluation of drought stress in strawberry. Photosynthetica 2008, 46, 631–633. [Google Scholar] [CrossRef]
- Strasser, R.J.; Tsimilli-Michael, M.; Srivastava, A. Analysis of the chlorophyll a fluorescence transient. In Chlorophyll a Fluorescence: A Signature of Photosynthesis. Advances in Photosynthesis and Respiration; Papageorgiou, G.C., Govindjee, Eds.; Springer: Dordrecht, Holand, 2004; pp. 321–362. [Google Scholar]
- Farooq, M.; Wahid, A.; Kobayashi, N.; Fujita, D.; Basra, S.M.A. Plant drought stress: Effects, mechanisms and management. Agron. Sustain. Dev. 2009, 29, 185–212. [Google Scholar] [CrossRef]
- Porcel, R.; Zamarreño, Á.; García-Mina, J.; Aroca, R. Involvement of plant endogenous ABA in Bacillus megaterium PGPR activity in tomato plants. BMC Plant Biol. 2014, 14, 36. [Google Scholar] [CrossRef] [PubMed]
- Barnawal, D.; Bharti, N.; Pandey, S.S.; Pandey, A.; Chanotiya, C.S.; Kalra, A. Plant growth promoting rhizobacteria enhances wheat salt and drought stress tolerance by altering endogenous phytohormone levels and TaCTR1/TaDREB2 expression. Physiol. Plant. 2017, 161, 502–514. [Google Scholar] [CrossRef]
- Khan, N.; Bano, A.; Rahman, M.A.; Guo, J.; Kang, Z.; Babar, M.A. Comparative physiological and metabolic analysis reveals a complex mechanism involved in drought tolerance in chickpea (Cicer arietinum L.) induced by PGPR and PGRs. Sci. Rep. 2019, 9, 2097. [Google Scholar] [CrossRef] [Green Version]
- Zarei, T.; Moradi, A.; Kazemeini, S.A.; Akhgar, A.; Rahi, A.A. The role of ACC deaminase producing bacteria in improving sweet corn (Zea mays L. var. saccharata) productivity under limited availability of irrigation water. Sci. Rep. 2020, 10, 20361. [Google Scholar] [CrossRef]
- Pikovskaya, R.I. Mobilization of phosphorus in soil in connection with the vital activity of some microbial species. Mikrobiologya 1948, 17, 362–370. [Google Scholar]
- Schwyn, B.; Neilands, J.B. Universal chemical assay for the detection and determination of siderophores. Anal. Biochem. 1987, 160, 47–56. [Google Scholar] [CrossRef]
- Alexander, D.B.; Zuberer, D.A. Use of chrome azurol S reagents to evaluate siderophore production by rhizosphere bacteria. Biol. Fertil. Soils 1991, 12, 39–45. [Google Scholar] [CrossRef]
- Khalid, A.; Arshad, M.; Zahir, Z.A. Screening plant growth-promoting rhizobacteria for improving growth and yield of wheat. J. Appl. Microbiol. 2004, 96, 473–480. [Google Scholar] [CrossRef] [PubMed]
- Dworkin, M.; Foster, J. Experiments with some microorganisms which utilize ethane and hydrogen. J. Bacteriol. 1958, 75, 592–603. [Google Scholar] [CrossRef] [PubMed]
- Penrose, D.M.; Glick, B.R. Methods for isolating and characterizing ACC deaminase-containing plant growth-promoting rhizobacteria. Physiol. Plant. 2003, 118, 10–15. [Google Scholar] [CrossRef]
- Honma, M.; Shimomura, T. Metabolism of 1-aminocyclopropane-1-carboxylic acid. Agric. Biol. Chem. 1978, 42, 1825–1831. [Google Scholar] [CrossRef]
- Kalaji, M.H.; Bosa, K.; Kościelniak, J.; Żuk-Gołaszewska, K. Effects of salt stress on photosystem II 554 efficiency and CO2 assimilation of two Syrian barley landraces. Environ. Exp. Bot. 2011, 73, 64–72. [Google Scholar] [CrossRef]
- Dorman, C. Environmental Data Analysis; Springer International Publishing: Cham, Switzerland, 2020. [Google Scholar]
- Jamiołkowska, A.; Skwaryło-Bednarz, B.; Mielniczuk, E.; Bisceglie, F.; Pelosi, G.; Degola, F.; Grzęda, E. Effect of thiosemicarbazone derivatives and Fusarium culmorum (Wm. G. Sm.) Sacc. infection of winter wheat seedlings on their health status and soil biological activity. Agronomy 2022, 12, 116. [Google Scholar] [CrossRef]
- De Sá, J.P.M. Applied Statistics Using SPSS, Statistica, MatLab and R, 2nd ed.; Springer Science & Business Media: Berlin, Germany, 2007. [Google Scholar]





| Bacteria Strain | PGPR Traits | |||
|---|---|---|---|---|
| IAA Production | Siderophore Production | Phosphate Solubilization | ACCD Activity (nmol α- KB·mg Protein−1·h−1) | |
| AJ 1.1 | + | + | + | 8306.25 ± 114.2 |
| PJ 1.2 | + | + | + | 6287.5 ± 122.4 |
| DLGB 2 | - | + | - | nd |
| DLGB 3 | - | + | - | nd |
| DKB 26 | - | + | - | 853.0 ± 25.7 |
| DKB 58 | - | + | - | 2946.75 ± 108.6 |
| DKB 84 | - | + | - | 2742.0 ± 46.0 |
| DKB 64 | + | - | + | 3862.25 ± 34.5 |
| DKB 65 | + | - | + | 4757.0 ± 75.7 |
| DKB 70 | + | - | + | 62.5 ± 29.2 |
| DKB 63 | - | - | + | 107.0 ± 17.3 |
| DKB 68 | - | - | + | 122.75 ± 23.7 |
| Variant | Descriptive Statistics | TFM | Area | F0 | |||
|---|---|---|---|---|---|---|---|
| OM | WD | OM | WD | OM | WD | ||
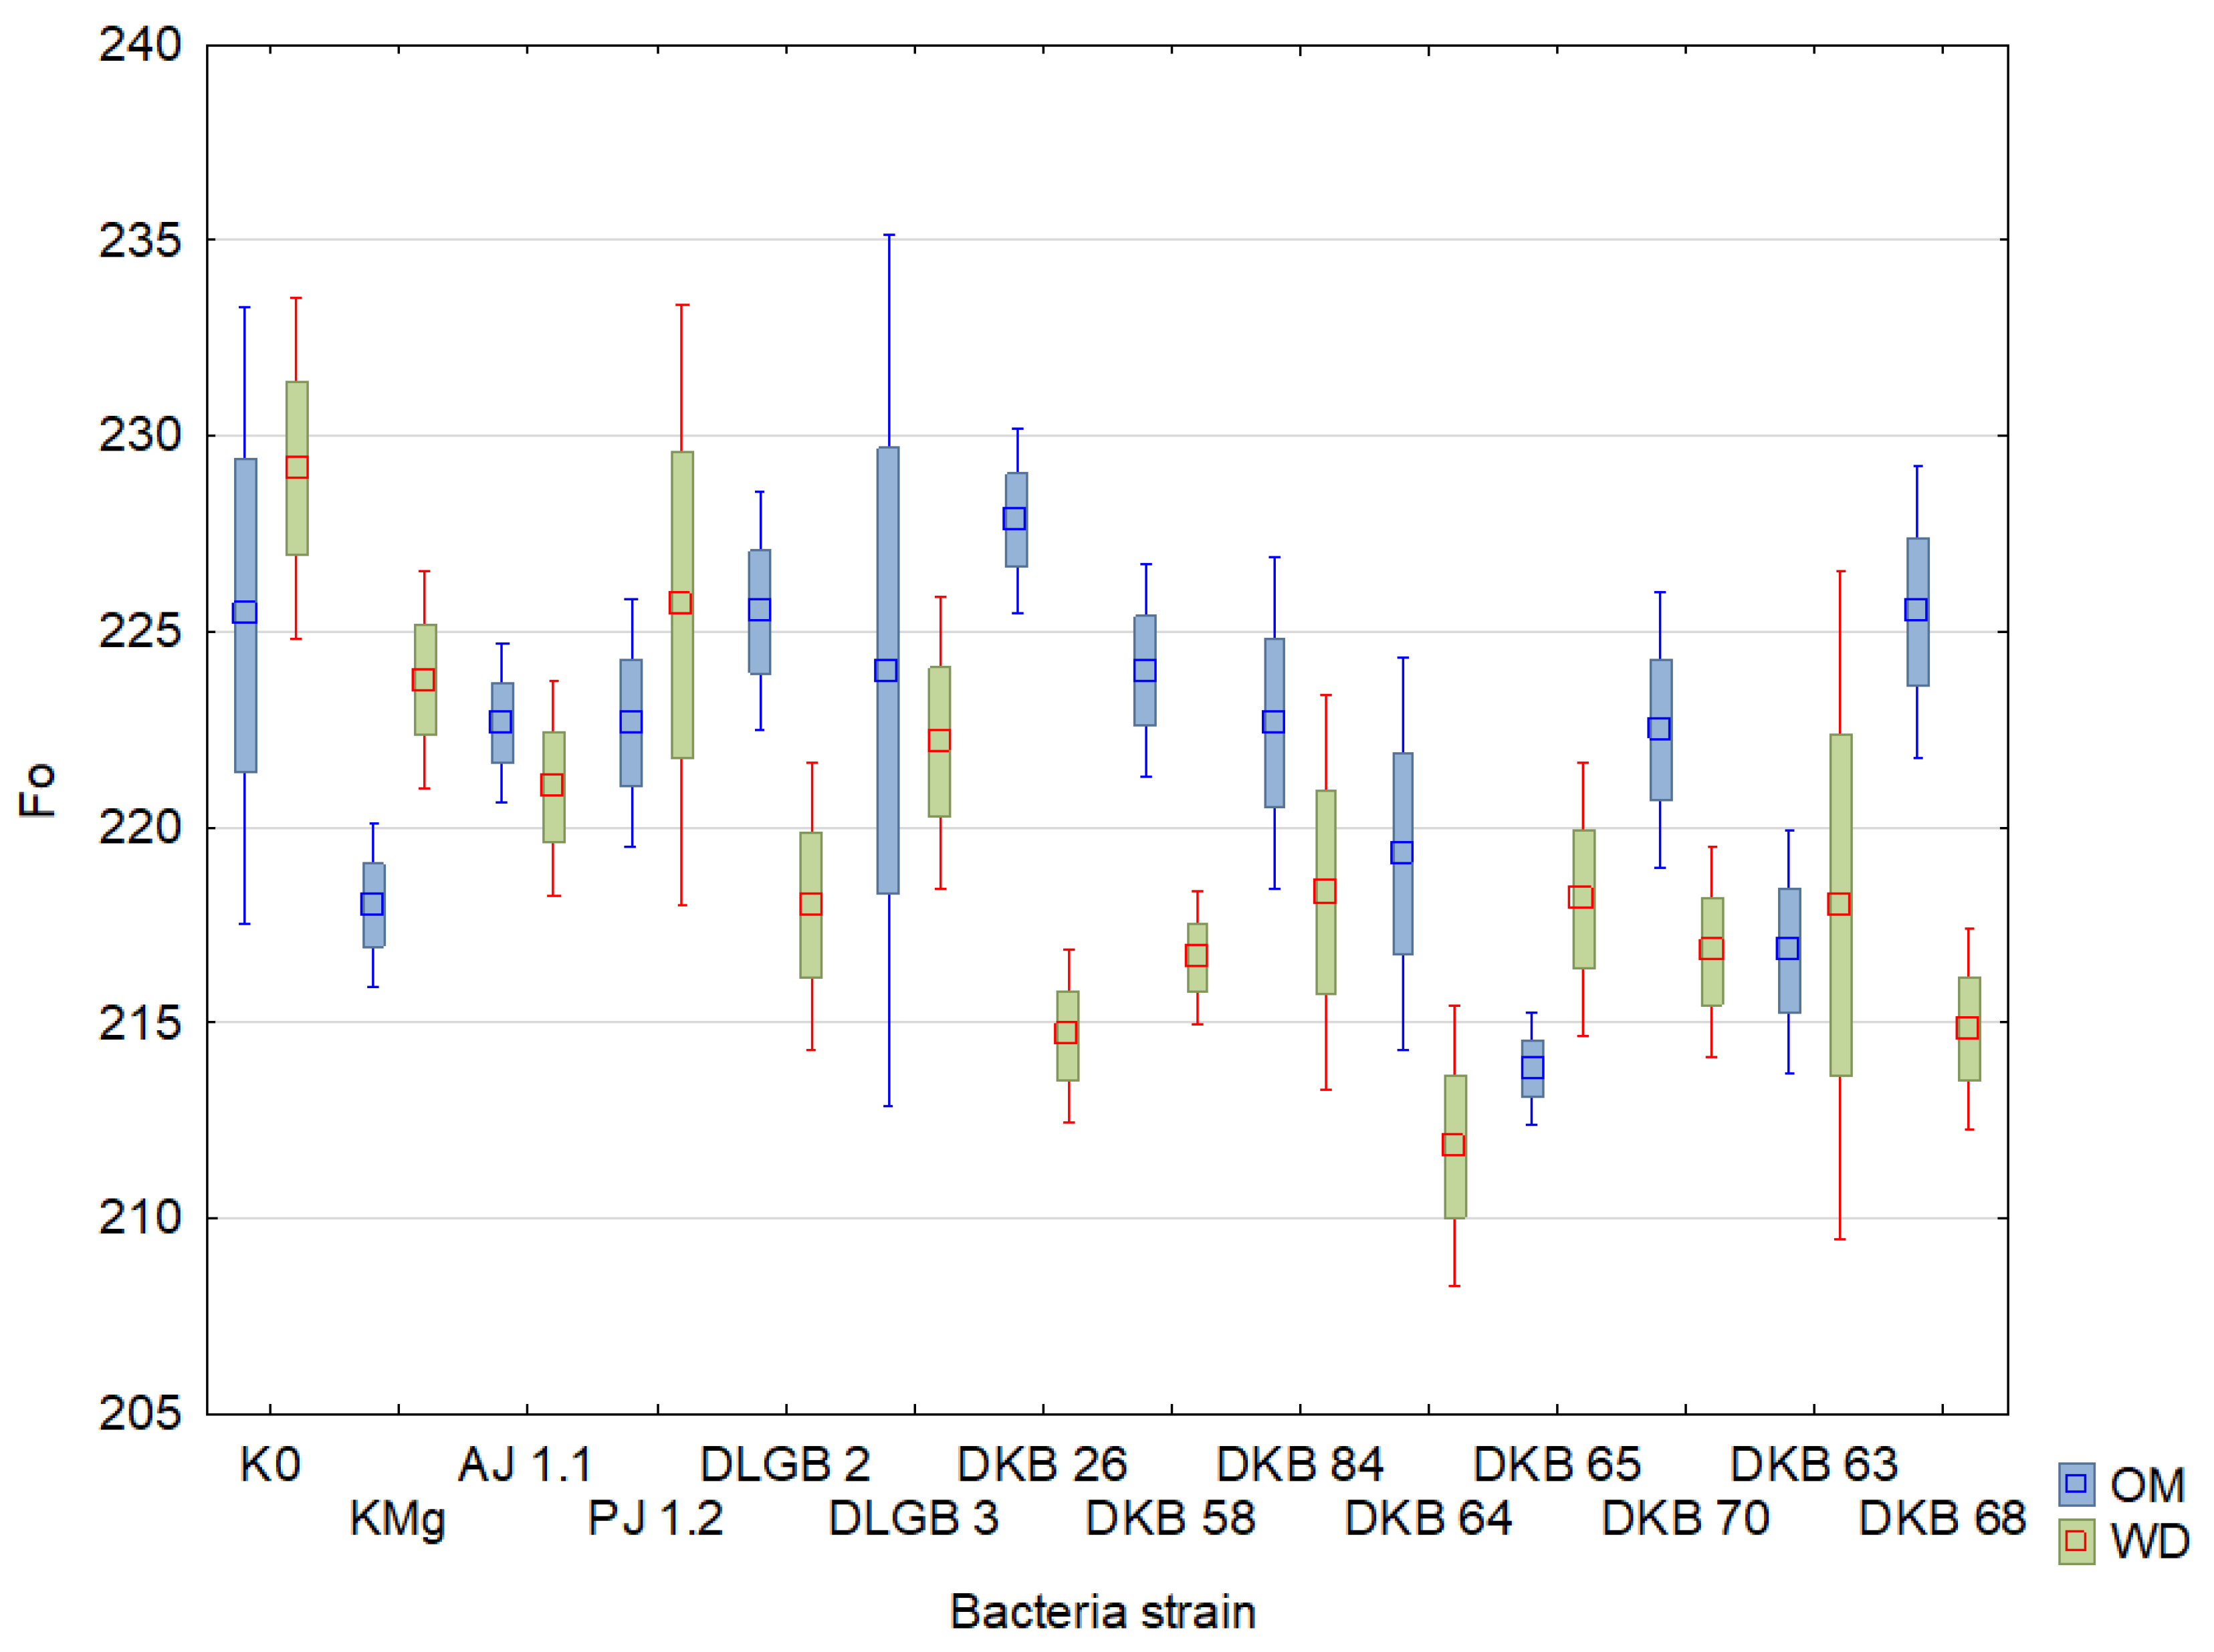
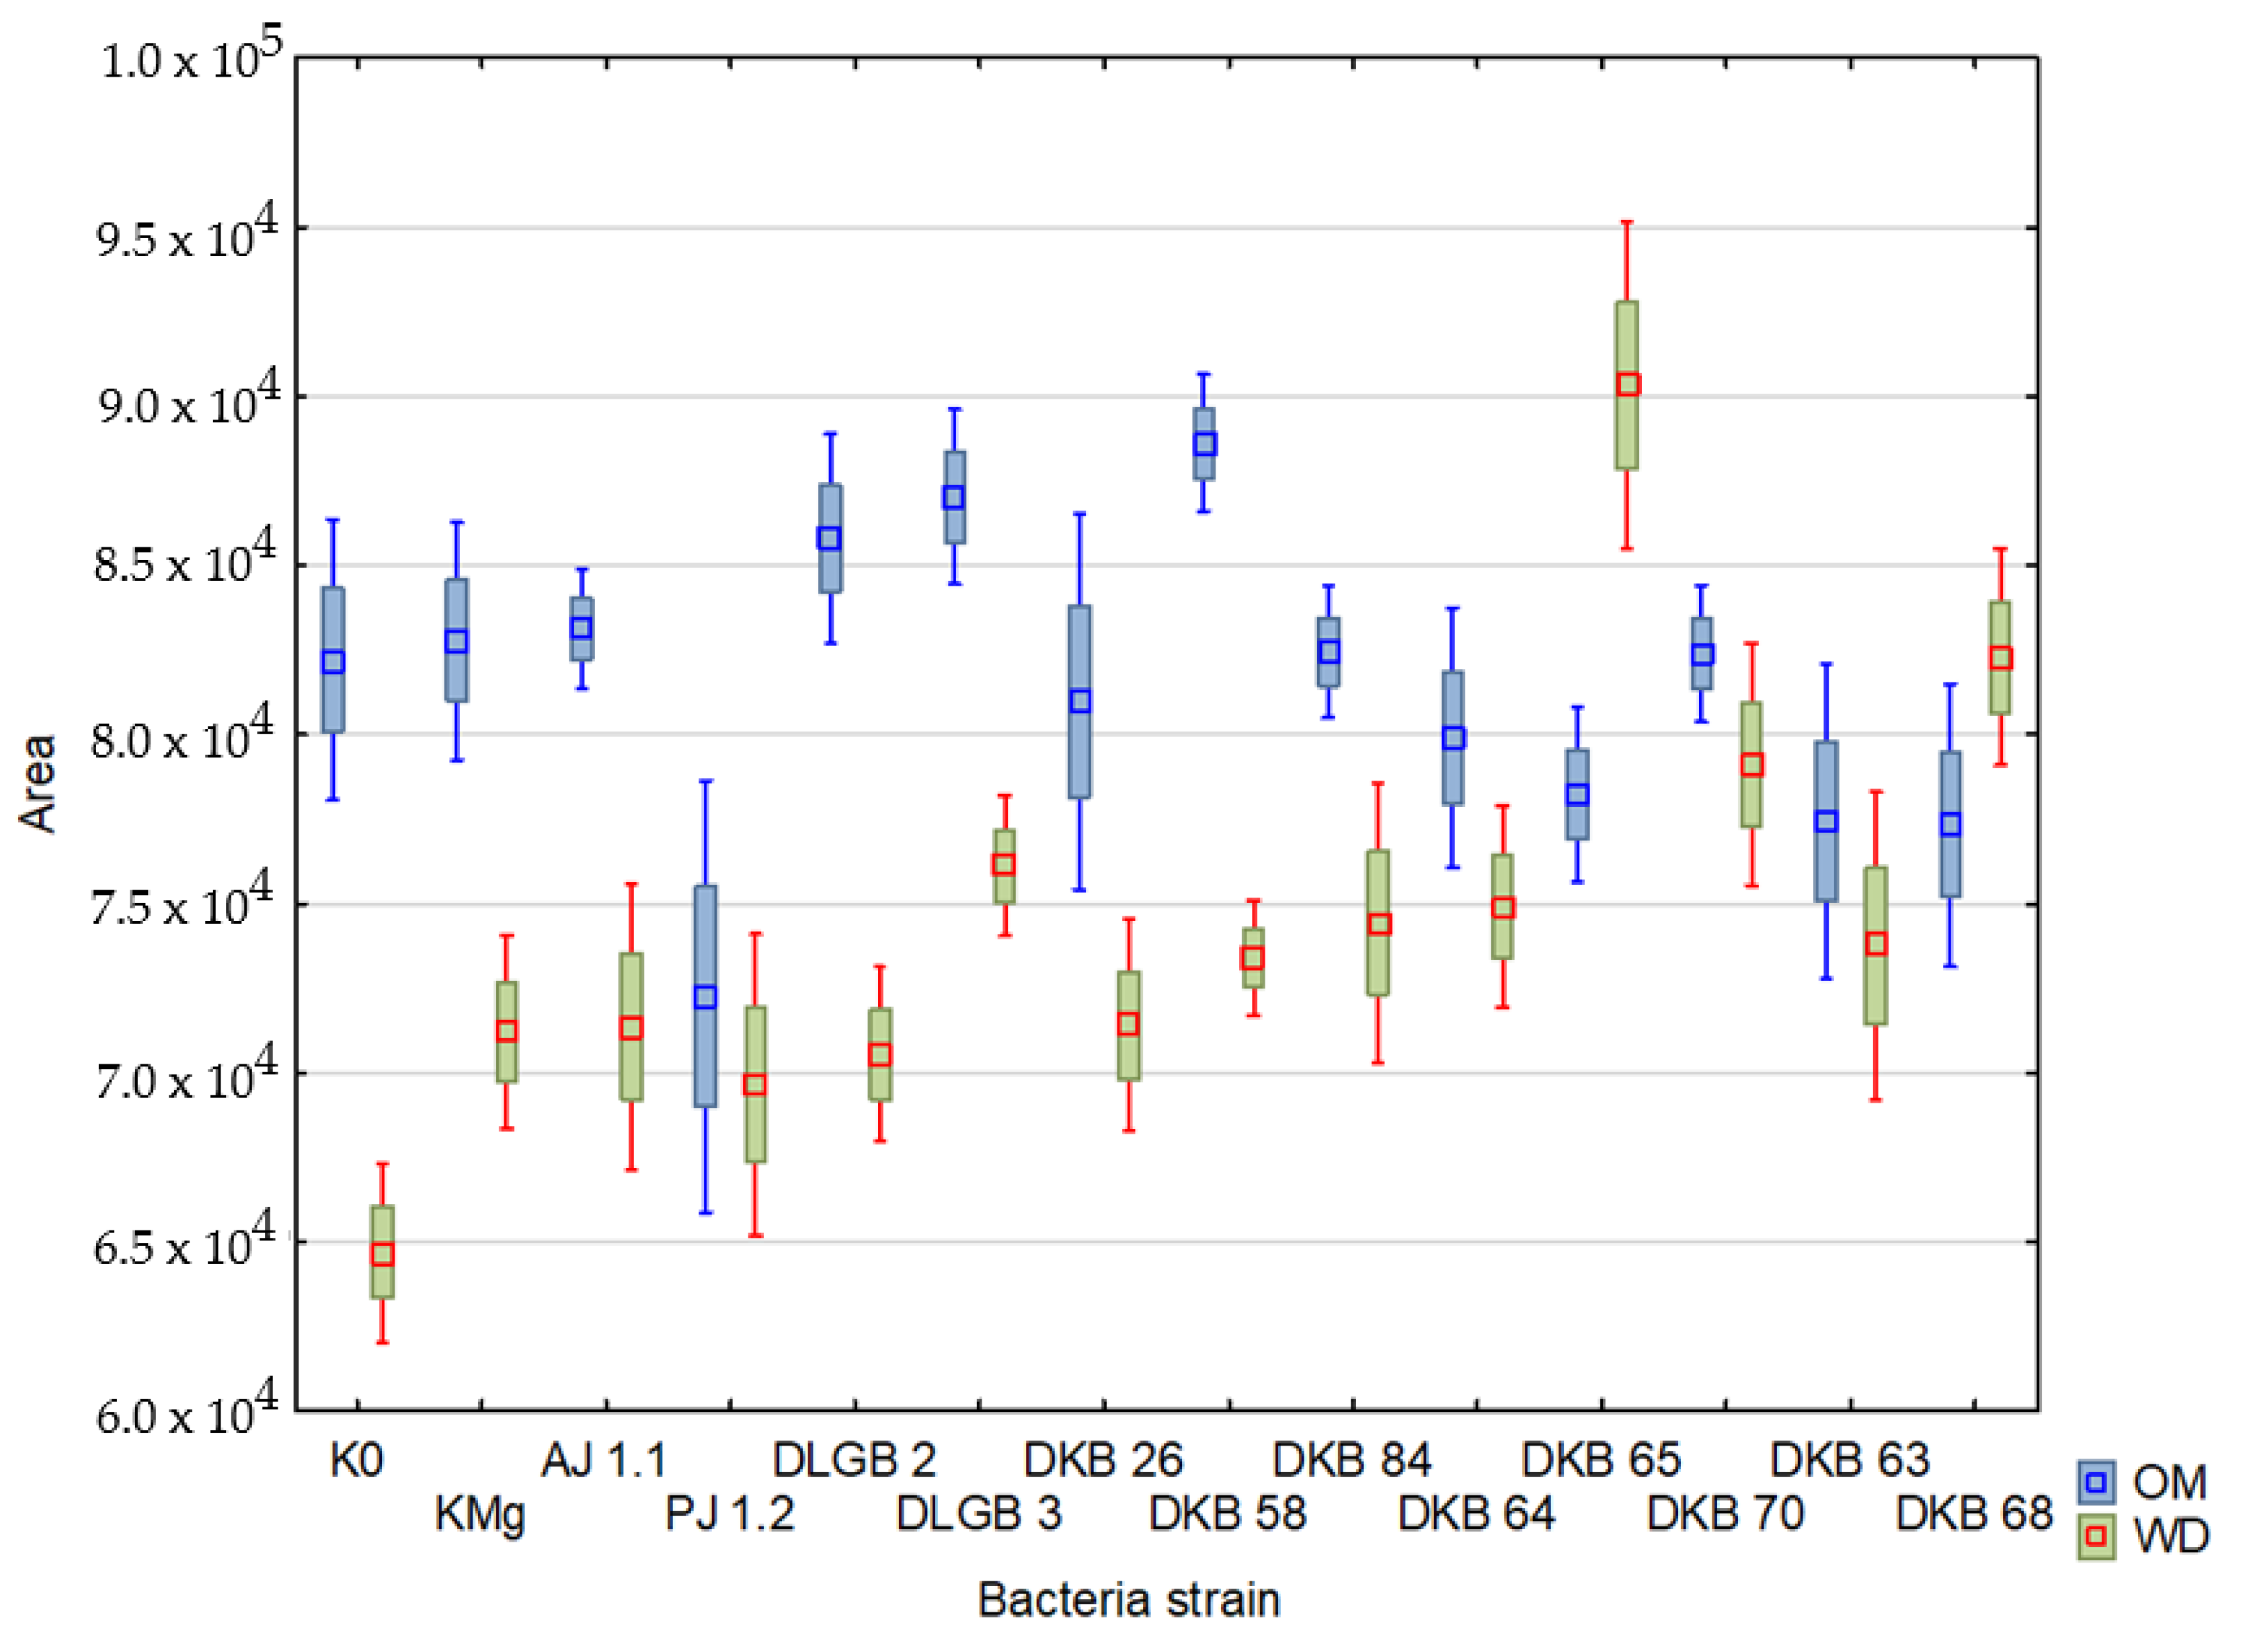
| K0 | Mean ± SD | 837.5 ± 16.06 | 858.33 ± 11.86 | 69,490.33 ± 28 | 61,215.92 ± 19.76 | 230.63 ± 10.61 | 232.38 ± 14.6 |
| Range | 400–900 | 500–900 | 29,086–98,646 | 30,210–89,071 | 202–312 | 202–371 | |
| CV | 16% | 12% | 28% | 20% | 11% | 15% | |
| KMg | Mean ± SD | 891.67 ± 4.58 | 879.17 ± 6.69 | 72,806.5 ± 19.45 | 66,549.96 ± 18.08 | 222.08 ± 5.84 | 224.33 ± 12.27 |
| Range | 700–900 | 700–900 | 53,216–10,2457 | 29,279–89,552 | 202–255 | 202–343 | |
| CV | 5% | 7% | 19% | 18% | 6% | 12% | |
| AJ 1.1 | Mean ± SD | 866.67 ± 10.24 | 875 ± 5.17 | 70,891.58 ± 23.05 | 63,561 ± 21.7 | 234.08 ± 10.7 | 226.42 ± 6.3 |
| Range | 600–900 | 800–900 | 32,248–86,547 | 41,521–81,726 | 216–308 | 205–253 | |
| CV | 10% | 5% | 23% | 22% | 11% | 6% | |
| PJ 1.2 | Mean ± SD | 833.33 ± 17.97 | 891.67 ± 3.24 | 64,828 ± 24.39 | 64,587.67 ± 19.24 | 230.5 ± 5.11 | 221.83 ± 7.01 |
| Range | 400–900 | 800–900 | 42,926–98,793 | 38,747–90,909 | 213–254 | 209–266 | |
| CV | 18% | 3% | 24% | 19% | 5% | 7% | |
| DLGB 2 | Mean ± SD | 841.67 ± 16.38 | 875 ± 7.1 | 72,136.58 ± 25.08 | 68,535.83 ± 8.81 | 244.67 ± 22.69 | 216.17 ± 5.3 |
| Range | 500–900 | 700–900 | 31,493–97,428 | 61,022–78,161 | 193–376 | 195–231 | |
| CV | 16% | 7% | 25% | 9% | 23% | 5% | |
| DLGB 3 | Mean ± SD | 841.67 ± 17.88 | 883.33 ± 4.41 | 72,116.33 ± 26.93 | 71,489.42 ± 9.75 | 227.67 ± 13.27 | 222.67 ± 7.86 |
| Range | 400–900 | 800–900 | 27,371–97,196 | 60,365–83,037 | 200–283 | 205–269 | |
| CV | 18% | 4% | 27% | 10% | 13% | 8% | |
| DKB 26 | Mean ± SD | 883.33 ± 4.41 | 883.33 ± 4.41 | 71,094.58 ± 24.12 | 68,786.42 ± 15.62 | 230.83 ± 3.2 | 218.08 ± 5.2 |
| Range | 800–900 | 800–900 | 35,714–100,350 | 49,304–82,578 | 219–245 | 197–234 | |
| CV | 4% | 4% | 24% | 16% | 3% | 5% | |
| DKB 58 | Mean ± SD | 900 ± 0 | 883.33 ± 4.41 | 77,358.58 ± 16.48 | 68,580.42 ± 12.6 | 234.08 ± 10.91 | 217.75 ± 3.36 |
| Range | 900–900 | 800–900 | 60,224–96,866 | 49,448–79,824 | 207,308 | 201,229 | |
| CV | 0% | 4% | 16% | 13% | 11% | 3% | |
| DKB 84 | Mean ± SD | 883.33 ± 4.41 | 900 ± 0 | 72,272.75 ± 16.14 | 67,263 ± 17.59 | 234.08 ± 14.62 | 222.08 ± 5.58 |
| Range | 800–900 | 900–900 | 57,317–91,807 | 49,923–89,070 | 205–339 | 202–241 | |
| CV | 4% | 0% | 16% | 18% | 15% | 6% | |
| DKB 64 | Mean ± SD | 858.33 ± 11.61 | 900 ± 0 | 68,943.67 ± 23.86 | 75,019.58 ± 8.28 | 233.25 ± 8.98 | 211.92 ± 4.06 |
| Range | 600–900 | 900–900 | 31,718–94,651 | 60,181–82,864 | 197–271 | 194–223 | |
| CV | 12% | 0% | 24% | 8% | 9% | 4% | |
| DKB 65 | Mean ± SD | 900 ± 0 | 891.67 ± 3.24 | 72,762.5 ± 10.73 | 78,063.92 ± 20.74 | 215.08 ± 2.63 | 219.33 ± 3.92 |
| Range | 900–900 | 800–900 | 61,066–84,065 | 55,787–10,7411 | 206–225 | 205–234 | |
| CV | 0% | 3% | 11% | 21% | 3% | 4% | |
| DKB 70 | Mean ± SD | 872.73 ± 5.35 | 890.91 ± 3.38 | 71,595.27 ± 21.35 | 73,844.55 ± 14.44 | 234.64 ± 9.12 | 213.45 ± 4.35 |
| Range | 800–900 | 800–900 | 39,133–90,337 | 52,905–87,403 | 214–285 | 194–226 | |
| CV | 5% | 3% | 21% | 14% | 9% | 4% | |
| DKB 63 | Mean ± SD | 883.33 ± 4.41 | 866.67 ± 7.52 | 71,595.25 ± 17.83 | 63,443.08 ± 30.34 | 229.83 ± 14.49 | 225.67 ± 23.01 |
| Range | 800–900 | 700–900 | 48,060–94,376 | 17,269–91,168 | 206–332 | 159–373 | |
| CV | 4% | 8% | 18% | 30% | 14% | 23% | |
| DKB 68 | Mean ± SD | 866.67 ± 7.52 | 900 ± 0 | 70,508.58 ± 18.64 | 69,153.42 ± 27.11 | 228.17 ± 4.79 | 224.17 ± 14.5 |
| Range | 700–900 | 900–900 | 47,235–91,287 | 25,942–96,307 | 209–244 | 203–324 | |
| CV | 8% | 0% | 19% | 27% | 5% | 15% | |
| Variant | Descriptive Statistics | FM | Fv | Fv/FM | PI | ||||
|---|---|---|---|---|---|---|---|---|---|
| OM | WD | OM | WD | OM | WD | OM | WD | ||
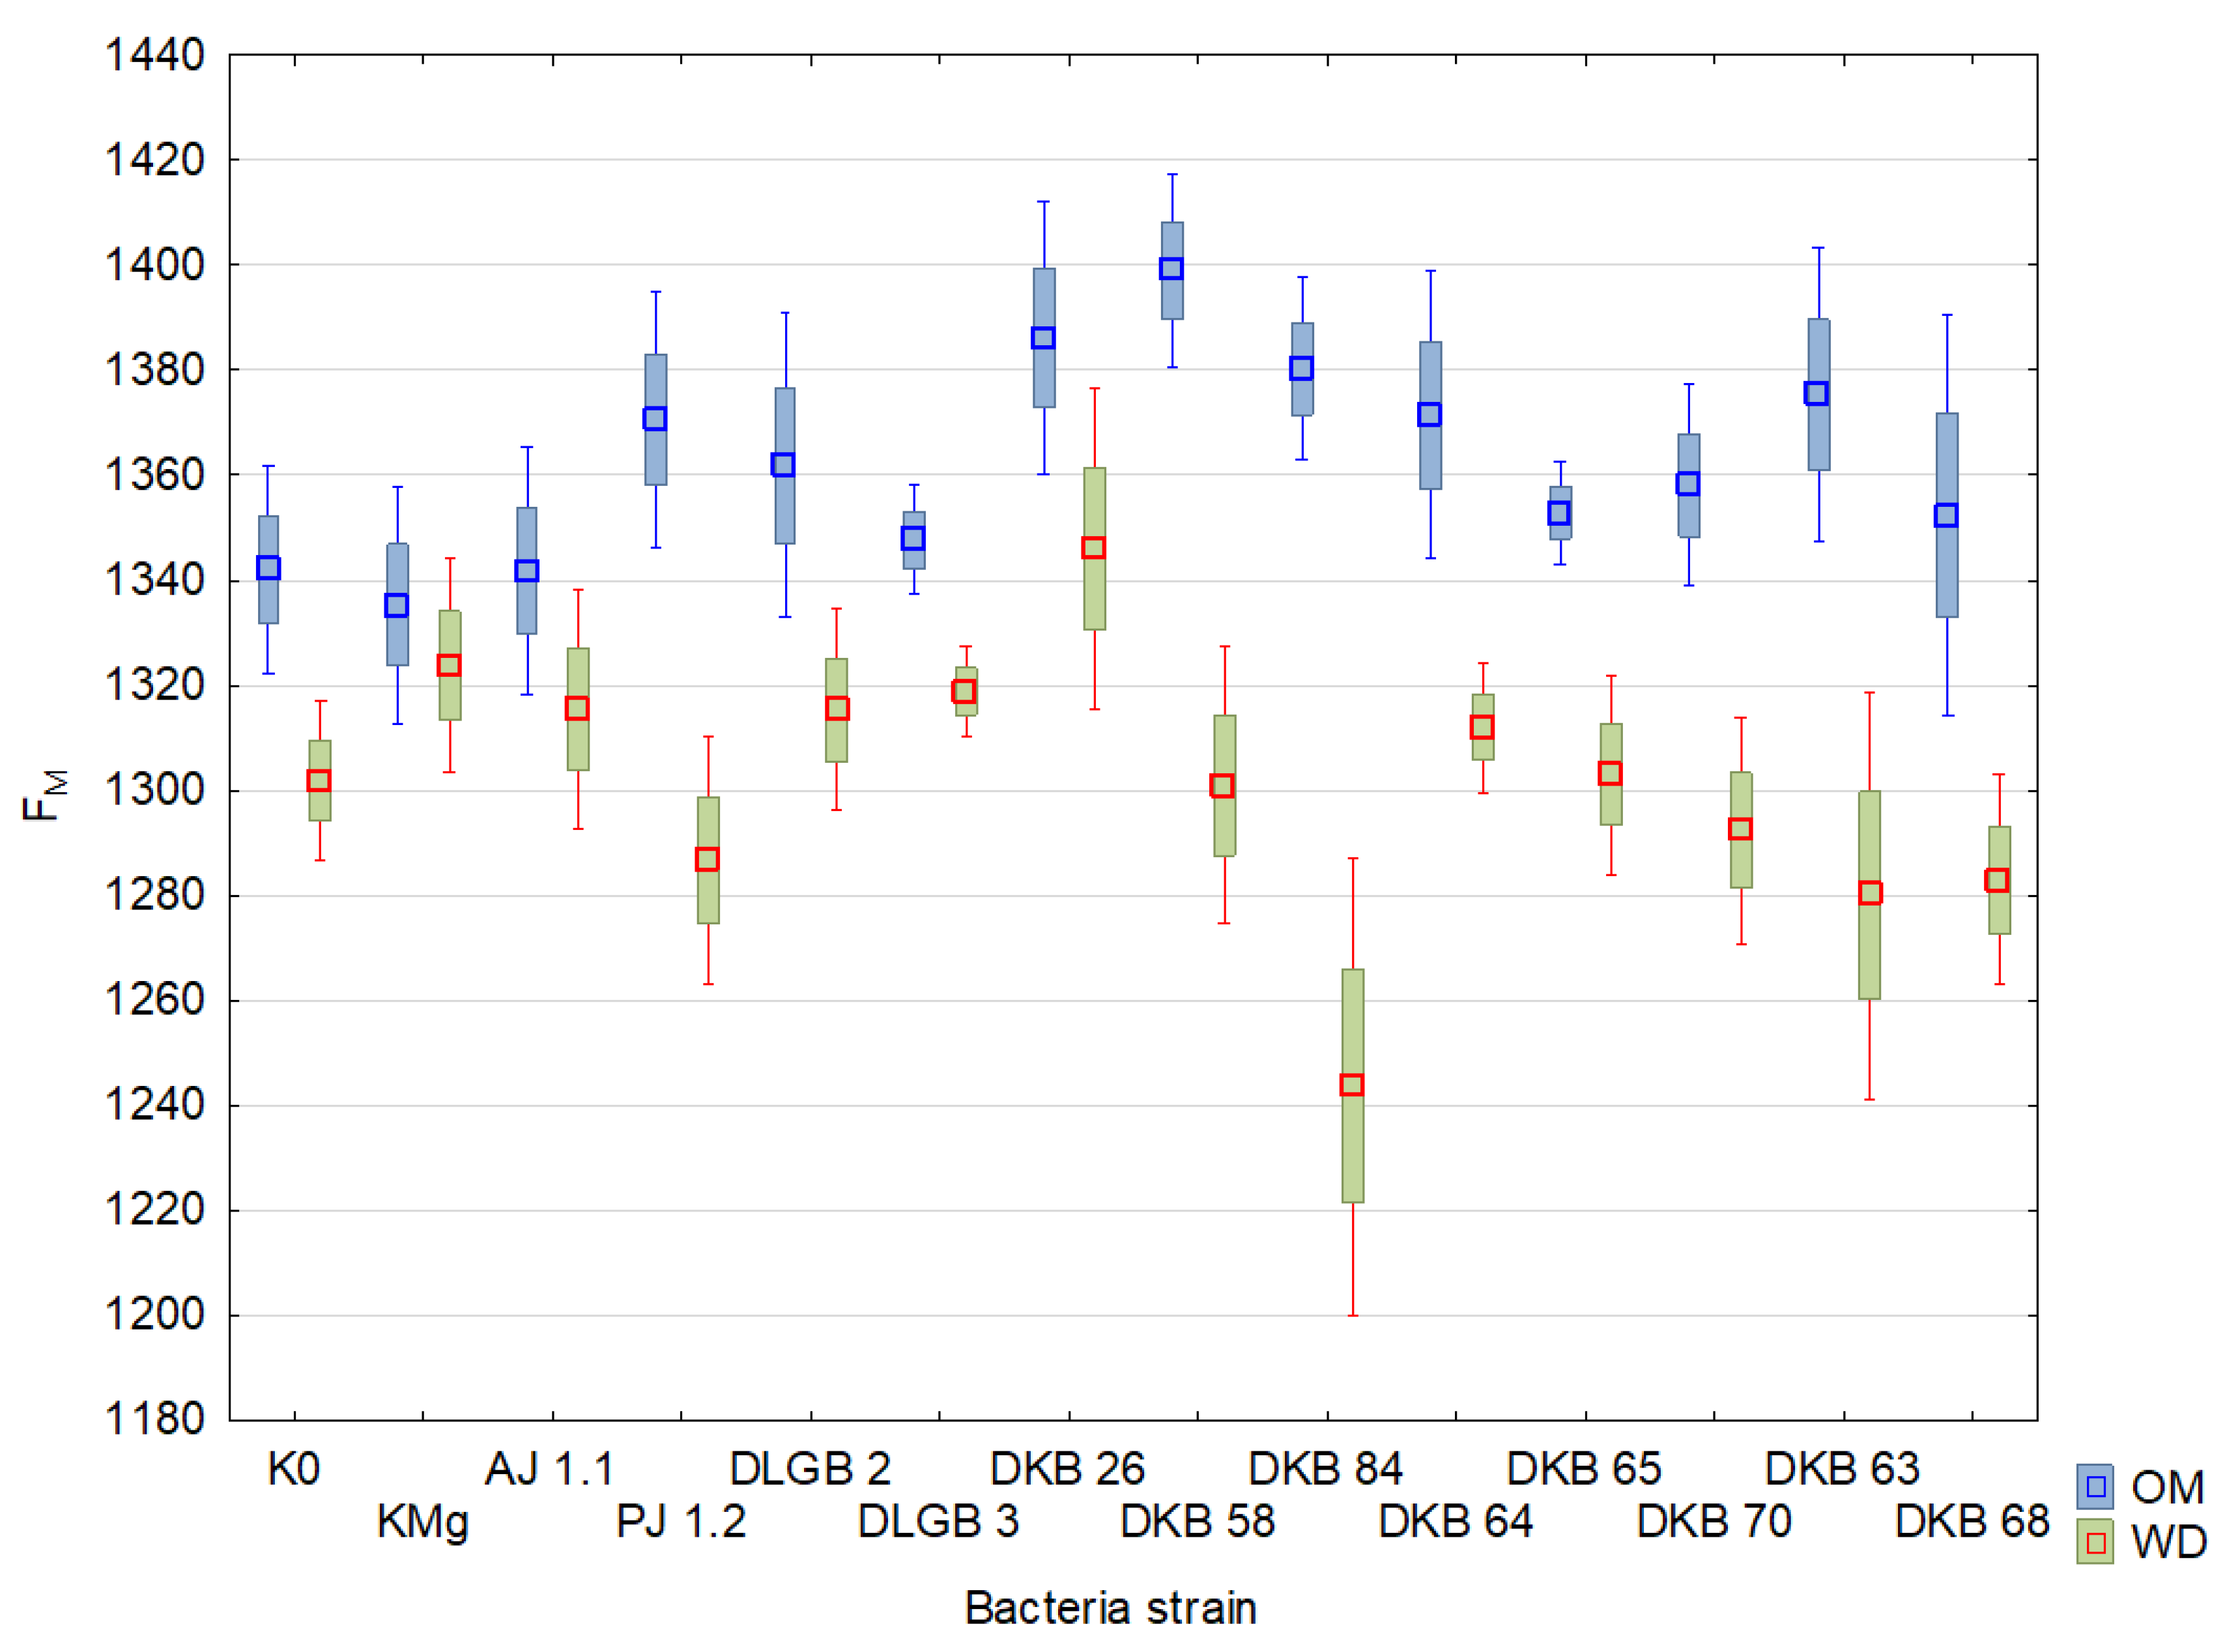
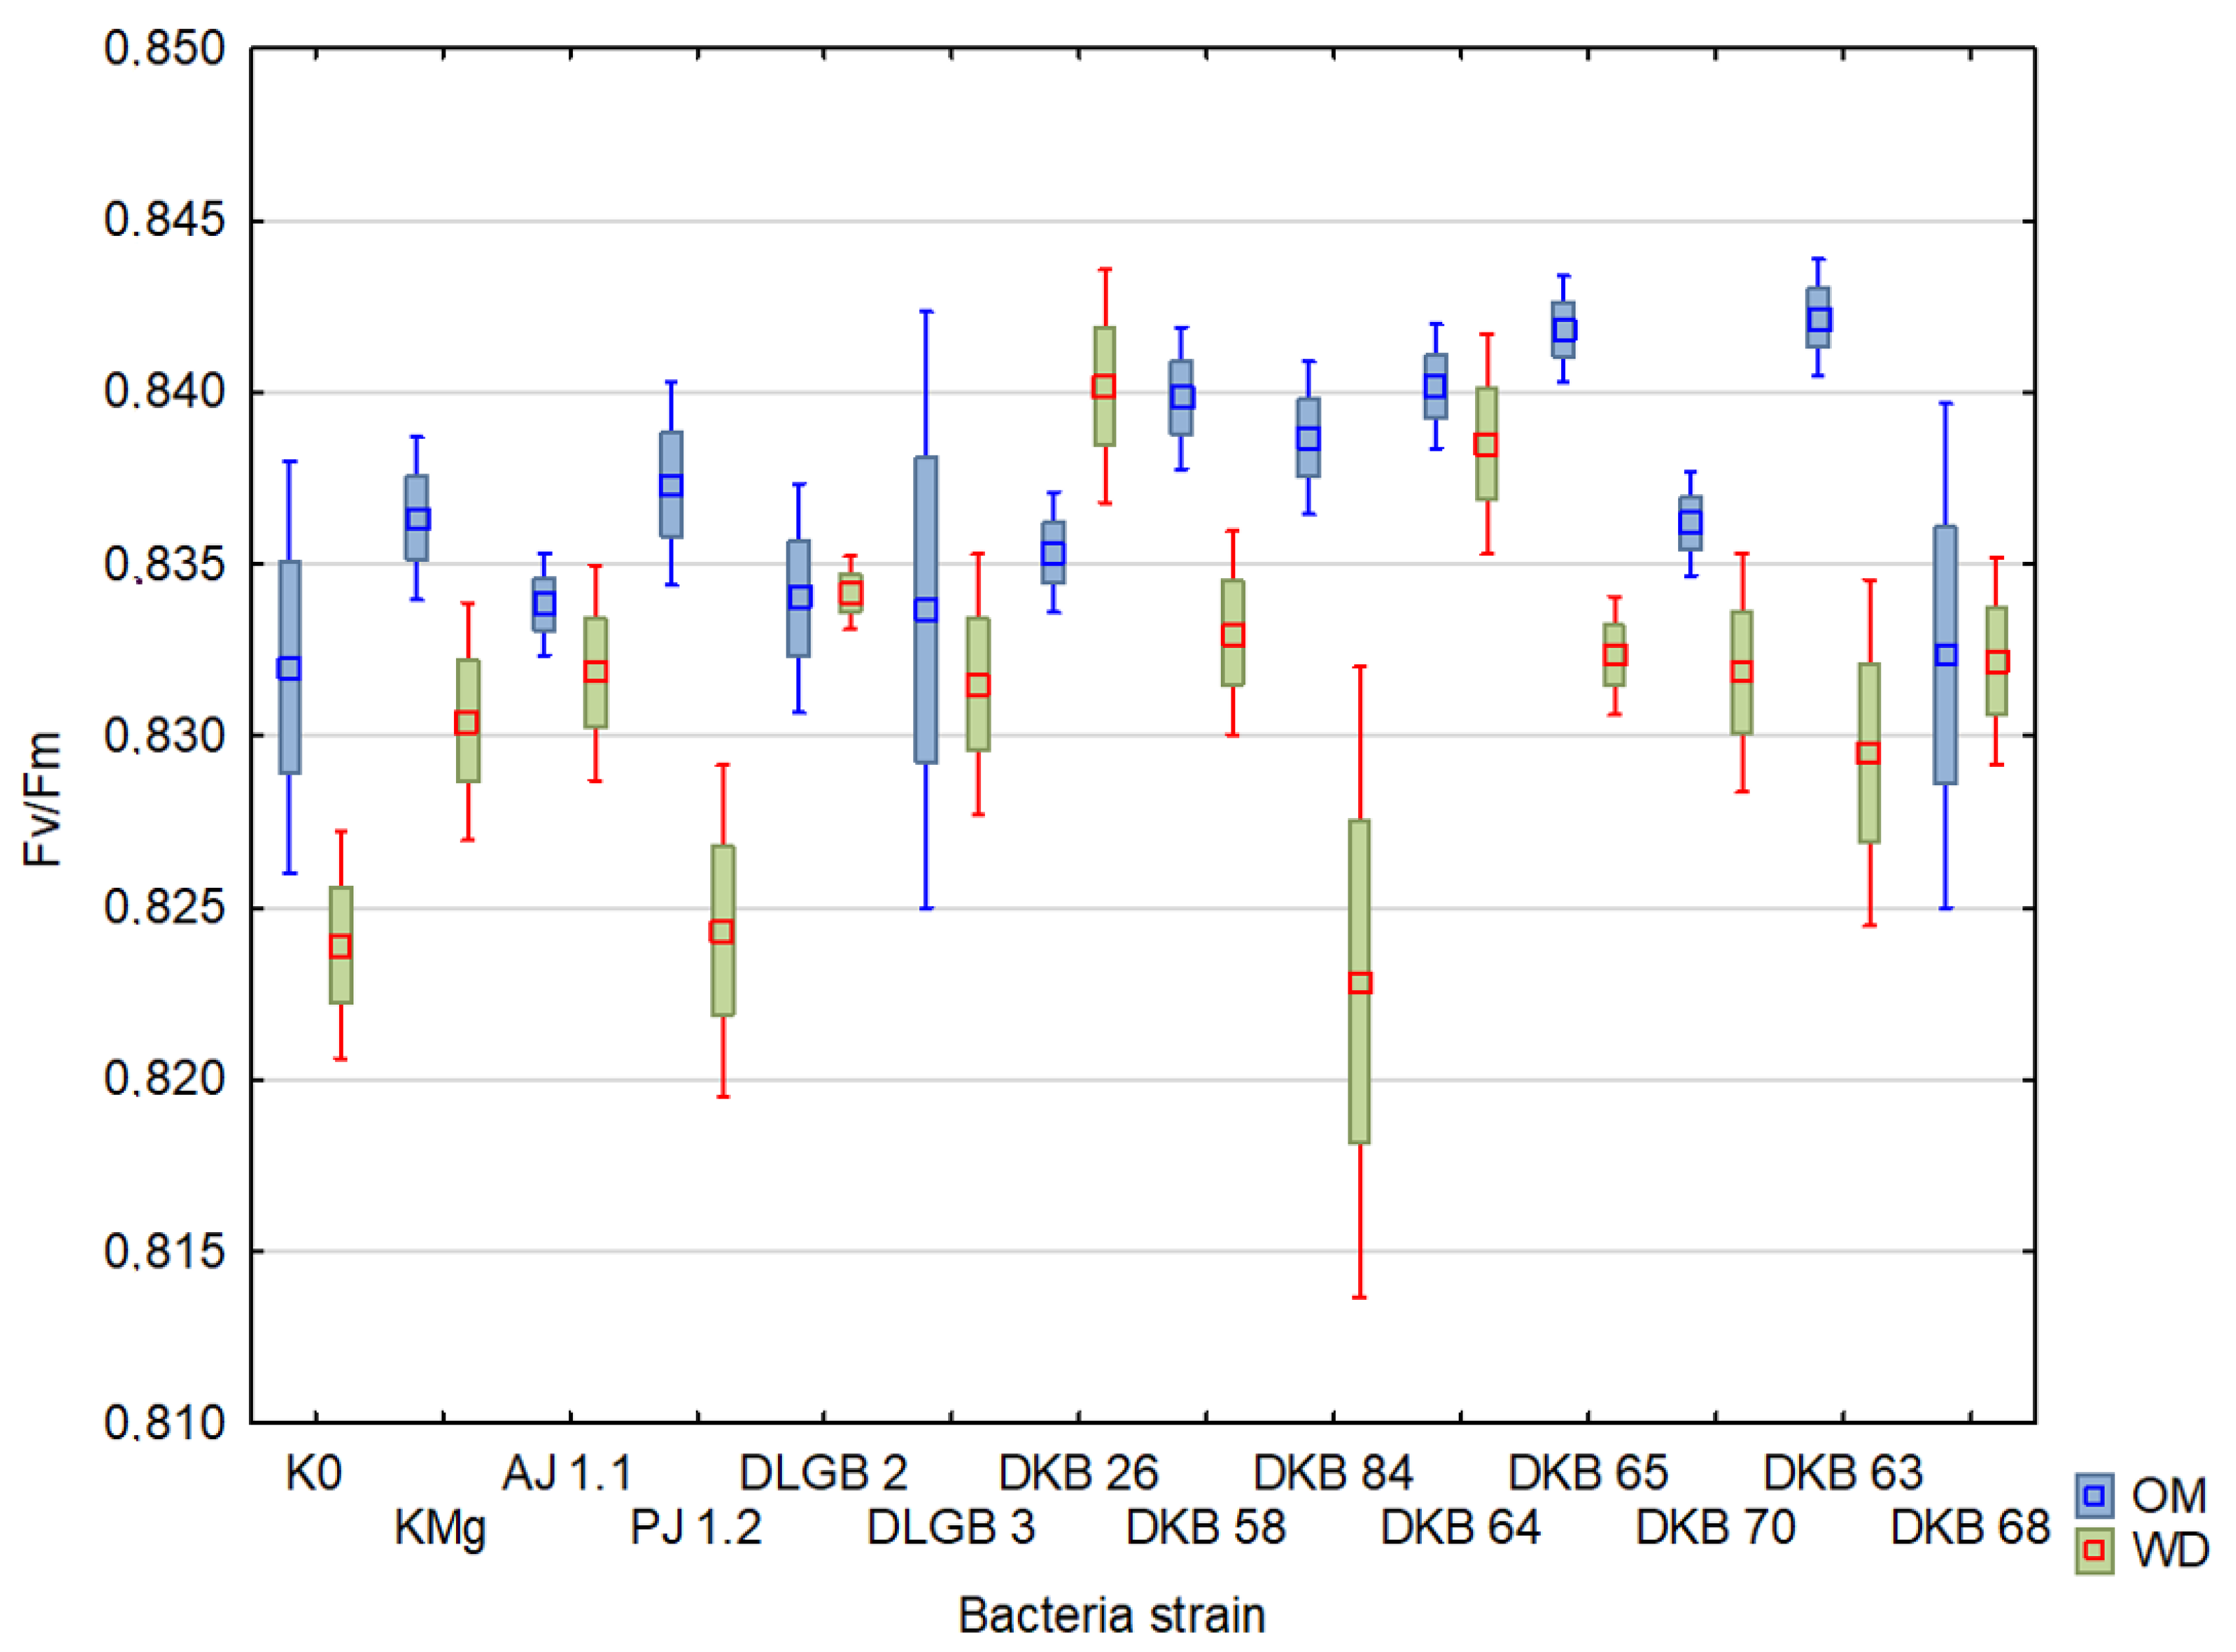
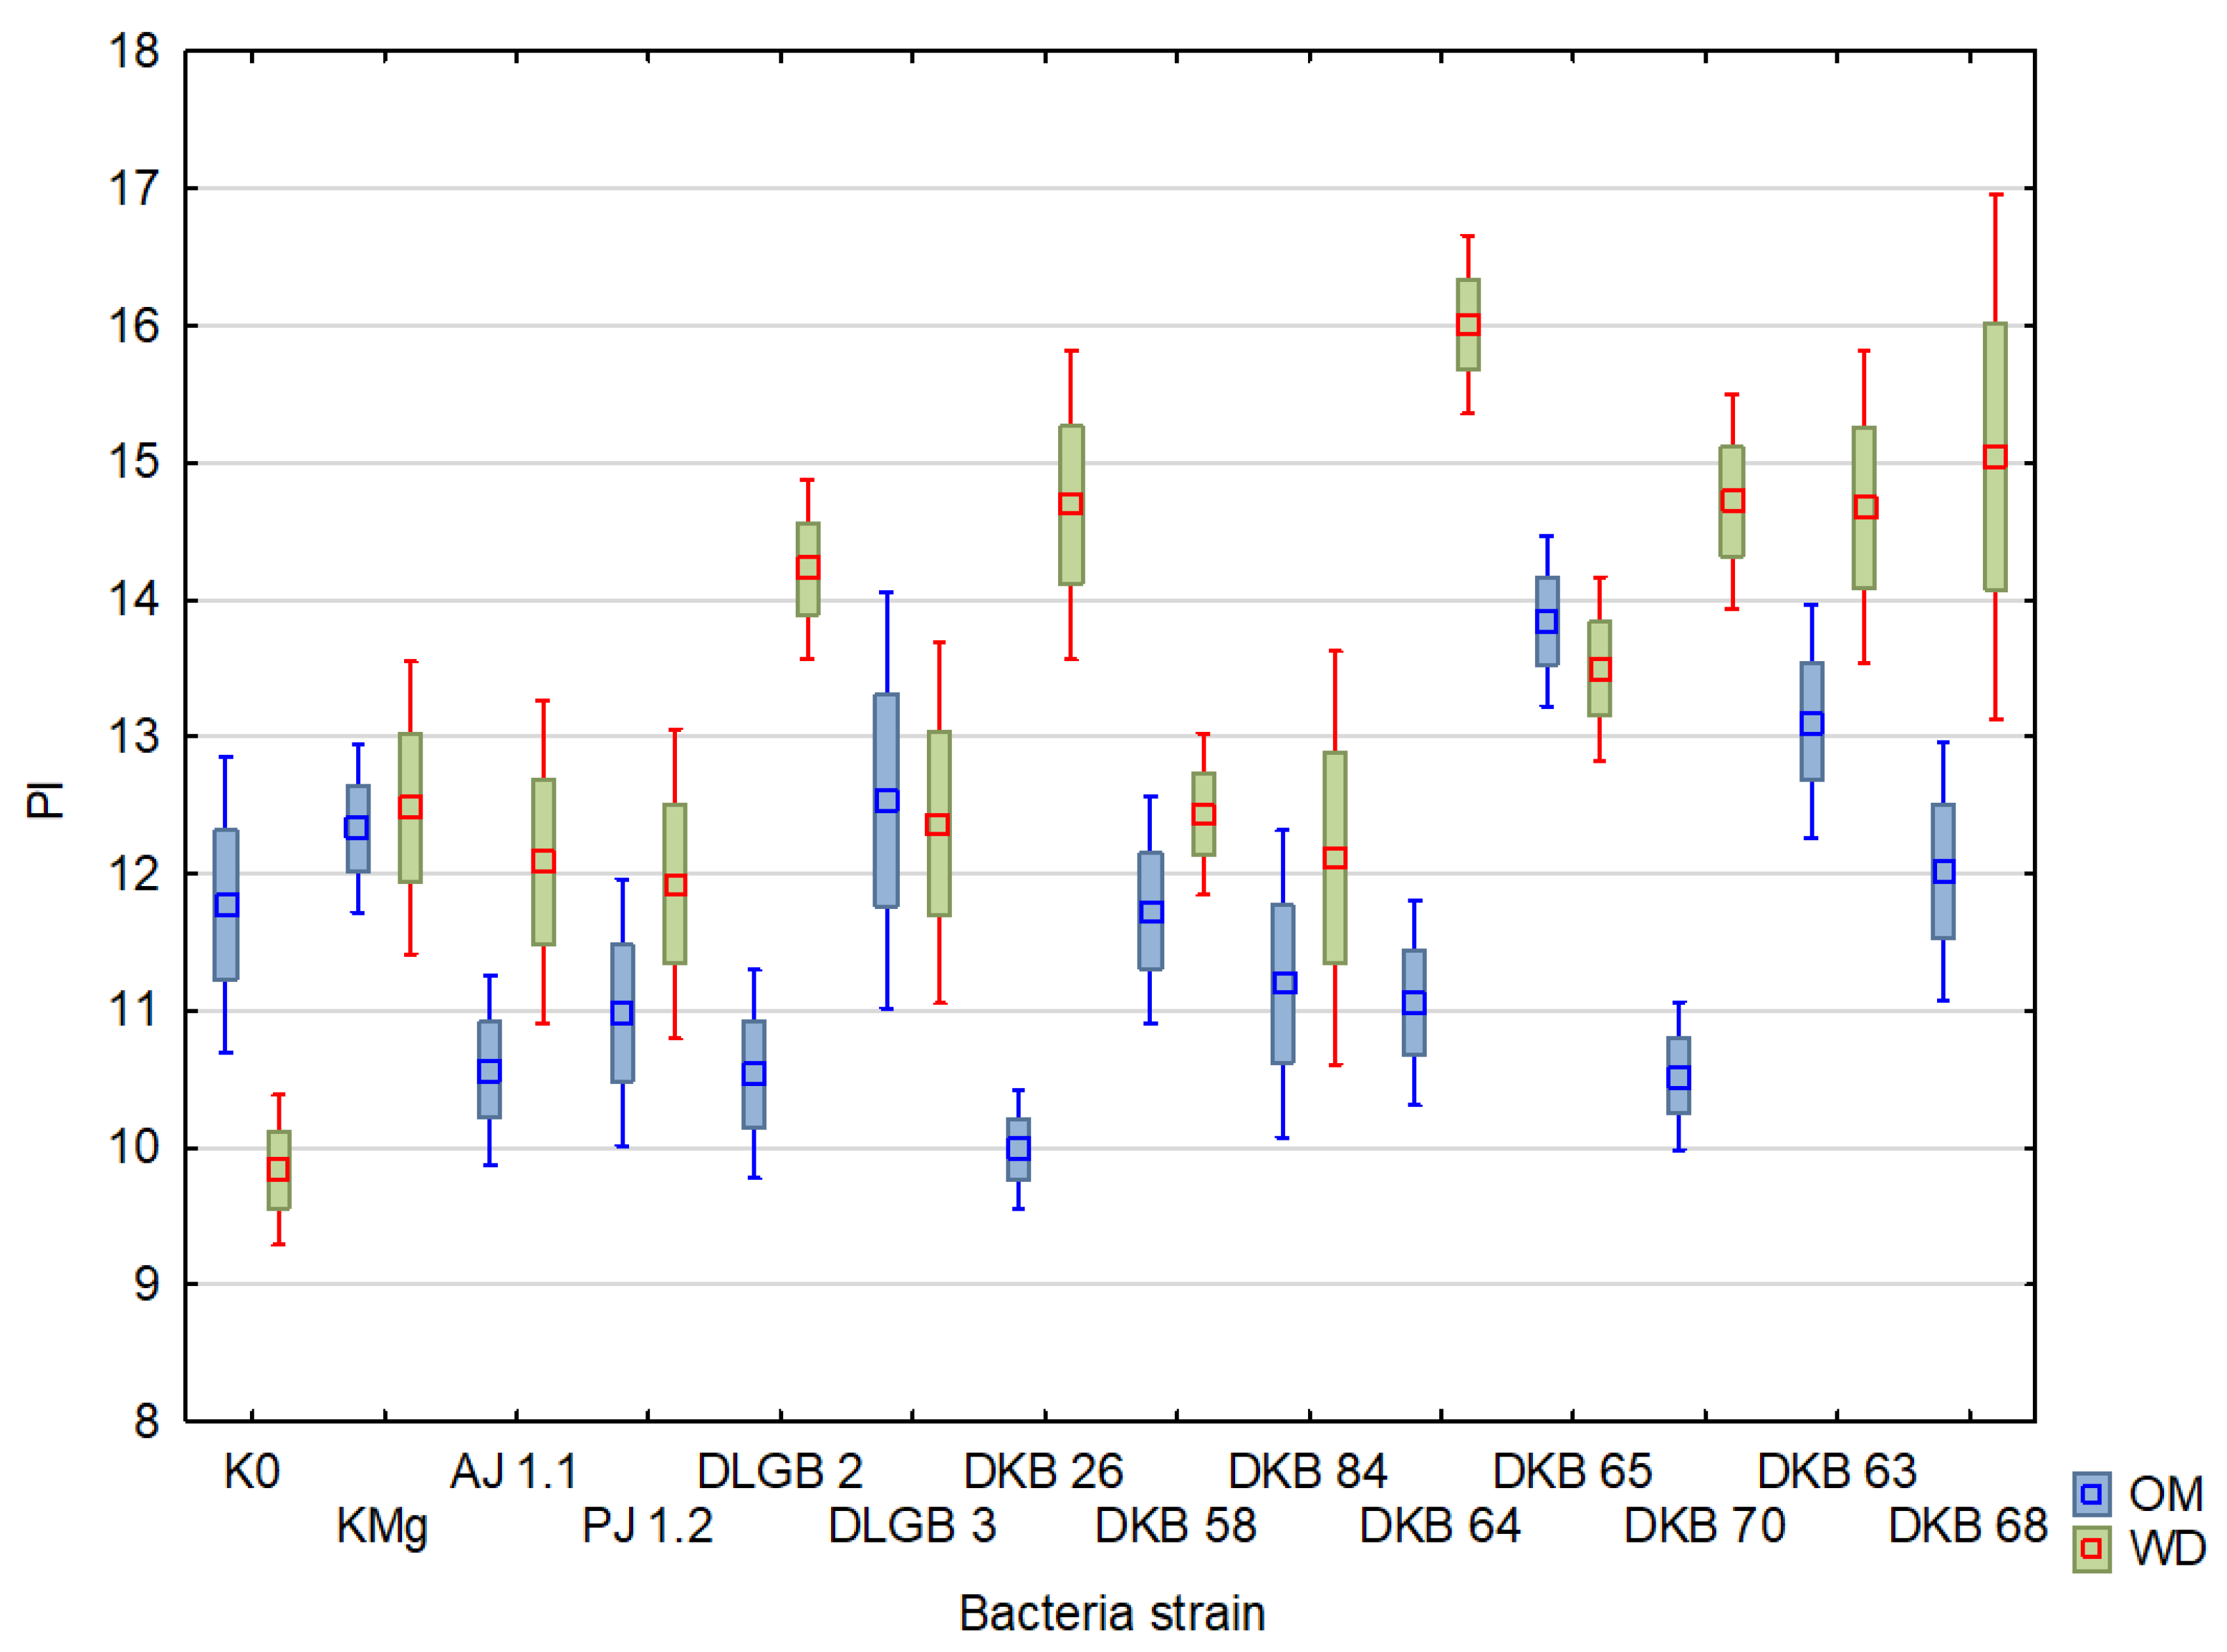
| K0 | Mean ± SD | 1258.46 ± 11.01 | 1253.88 ± 7.26 | 1027.83 ± 13.88 | 1021.5 ± 10.08 | 0.81 ± 3.79 | 0.81 ± 4.24 | 10.18 ± 40.21 | 9.51 ± 36.46 |
| Range | 984–1446 | 1038–1371 | 736–1217 | 777–1138 | 0.75–0.85 | 0.68–0.85 | 1.24–16.51 | 0.64–16.31 | |
| CV | 11% | 7% | 14% | 10% | 4% | 4% | 40% | 36% | |
| KMg | Mean ± SD | 1254.5 ± 10.27 | 1258.25 ± 9.32 | 1032.42 ± 12.57 | 1033.92 ± 11.33 | 0.82 ± 2.71 | 0.82 ± 3.23 | 11.05 ± 25.62 | 11.29 ± 36.03 |
| Range | 1023–1433 | 959–1462 | 795–1198 | 750–1237 | 0.78–0.85 | 0.72–0.85 | 5.74–15.94 | 0.74–17.16 | |
| CV | 10% | 9% | 13% | 11% | 3% | 3% | 26% | 36% | |
| AJ 1.1 | Mean ± SD | 1272.75 ± 9.3 | 1231.92 ± 9.13 | 1038.67 ± 12.32 | 1005.5 ± 11.53 | 0.81 ± 3.95 | 0.81 ± 2.81 | 8.94 ± 35.12 | 10.17 ± 36.19 |
| Range | 1100–1429 | 1035–1405 | 814–1191 | 801–1186 | 0.73–0.84 | 0.77–0.84 | 1.13–12.24 | 5.78–17.07 | |
| CV | 9% | 9% | 12% | 12% | 4% | 3% | 35% | 36% | |
| PJ 1.2 | Mean ± SD | 1266.25 ± 10.66 | 1214.33 ± 10.96 | 1035.75 ± 13.39 | 992.5 ± 12.77 | 0.82 ± 3.01 | 0.82 ± 2.36 | 8.9 ± 32.49 | 10.78 ± 29.07 |
| Range | 1040–1487 | 967–1369 | 810–1259 | 755–1146 | 0.78–0.85 | 0.78–0.84 | 5.59–13.61 | 4.97–15.3 | |
| CV | 11% | 11% | 13% | 13% | 3% | 2% | 32% | 29% | |
| DLGB 2 | Mean ± SD | 1286.08 ± 7.85 | 1237.08 ± 7.68 | 1041.42 ± 11.52 | 1020.92 ± 8.96 | 0.81 ± 5.93 | 0.82 ± 1.67 | 9.08 ± 46.01 | 12.73 ± 24.51 |
| Range | 1112–1437 | 1091–1374 | 851–1200 | 867–1143 | 0.69–0.84 | 0.8–0.84 | 0.52–14.27 | 8.02–17.39 | |
| CV | 8% | 0% | 12% | 9% | 6% | 2% | 46% | 25% | |
| DLGB 3 | Mean ± SD | 1253.42 ± 8.83 | 1242.83 ± 7.91 | 1025.75 ± 12.1 | 1020.17 ± 10.31 | 0.82 ± 4.33 | 0.82 ± 3.11 | 11.29 ± 41.57 | 11.51 ± 31.15 |
| Range | 1088–1384 | 1065–1350 | 806–1165 | 796–1135 | 0.74–0.85 | 0.75–0.84 | 3.06–17.72 | 3.74–16.03 | |
| CV | 9% | 8% | 12% | 10% | 4% | 3% | 42% | 31% | |
| DKB 26 | Mean ± SD | 1327.08 ± 7.45 | 1284.42 ± 10.08 | 1096.25 ± 9.11 | 1066.33 ± 11.92 | 0.83 ± 1.93 | 0.83 ± 2.2 | 9.08 ± 22.59 | 12.63 ± 26.6 |
| Range | 1091–1454 | 1054–1450 | 856–1224 | 851–1230 | 0.79–0.84 | 0.79–0.85 | 3.78–12.25 | 6.8–19.67 | |
| CV | 7% | 10% | 9% | 12% | 2% | 2% | 23% | 27% | |
| DKB 58 | Mean ± SD | 1317.5 ± 7.21 | 1263.33 ± 6.15 | 1083.42 ± 9.66 | 1045.58 ± 7.36 | 0.82 ± 3.22 | 0.83 ± 1.39 | 9.95 ± 34.12 | 11.81 ± 16.31 |
| Range | 1182–1461 | 1122–1393 | 937–1227 | 903–1176 | 0.75–0.85 | 0.81–0.84 | 3.03–14.78 | 7.56–14.65 | |
| CV | 7% | 6% | 10% | 7% | 3% | 1% | 34% | 16% | |
| DKB 84 | Mean ± SD | 1321.5 ± 6.86 | 1164 ± 12.14 | 1087.42 ± 9.99 | 941.92 ± 15.53 | 0.82 ± 4.27 | 0.81 ± 3.85 | 10.06 ± 34.33 | 10.3 ± 39.23 |
| Range | 1116–1443 | 912–1376 | 867–1212 | 674–1156 | 0.72–0.84 | 0.74–0.85 | 1.94–15.89 | 3.03–16.52 | |
| CV | 7% | 12% | 10% | 16% | 4% | 4% | 34% | 39% | |
| DKB 64 | Mean ± SD | 1276.42 ± 10.22 | 1293.67 ± 4.72 | 1043.17 ± 13.13 | 1081.75 ± 5.78 | 0.82 ± 3.53 | 0.84 ± 1.33 | 8.66 ± 37.17 | 15.01 ± 16.9 |
| Range | 1038–1469 | 1177–1378 | 813–1238 | 961–1163 | 0.77–0.85 | 0.82–0.85 | 4.5–14.4 | 10.07–19.1 | |
| CV | 10% | 5% | 13% | 6% | 4% | 1% | 37% | 17% | |
| DKB 65 | Mean ± SD | 1271.58 ± 7.67 | 1272.17 ± 5.07 | 1056.5 ± 9.28 | 1052.83 ± 6.08 | 0.83 ± 1.72 | 0.83 ± 1.27 | 12.49 ± 18.47 | 11.49 ± 24 |
| Range | 1122–1395 | 1163–1348 | 916–1182 | 942–1128 | 0.81–0.85 | 0.81–0.84 | 8.56–16.52 | 6.33–15 | |
| CV | 8% | 5% | 9% | 6% | 2% | 1% | 18% | 24% | |
| DKB 70 | Mean ± SD | 1271.82 ± 9.05 | 1219.91 ± 10.61 | 1037.18 ± 11.72 | 1006.45 ± 12.43 | 0.81 ± 3.24 | 0.82 ± 2.06 | 8.63 ± 28.29 | 13.16 ± 21.64 |
| Range | 1058–1425 | 952–1398 | 837–1193 | 758–1176 | 0.77–0.84 | 0.8–0.85 | 5.4–12.84 | 8.13–18.44 | |
| CV | 9% | 11% | 12% | 12% | 3% | 2% | 28% | 22% | |
| DKB 63 | Mean ± SD | 1294.25 ± 9.57 | 1189.25 ± 16.63 | 1064.42 ± 12.34 | 963.58 ± 21.53 | 0.82 ± 4 | 0.8 ± 8.39 | 10.66 ± 36.75 | 11.94 ± 43.75 |
| Range | 1070–1458 | 779–1426 | 844–1234 | 554–1198 | 0.74–0.85 | 0.6–0.84 | 3.23–15.69 | 0.27–18.92 | |
| CV | 10% | 17% | 12% | 22% | 4% | 8% | 37% | 44% | |
| DKB 68 | Mean ± SD | 1276.75 ± 10.35 | 1183 ± 10.26 | 1048.58 ± 12.96 | 958.83 ± 14.72 | 0.82 ± 3.03 | 0.81 ± 5.86 | 10.4 ± 29.29 | 11.56 ± 49.21 |
| Range | 994–1449 | 970–1342 | 756–1221 | 646–1130 | 0.76–0.85 | 0.67–0.84 | 4.53–13.88 | 1.02–23.96 | |
| CV | 10% | 10% | 13% | 15% | 3% | 6% | 29% | 49% | |
| Variable | Main Effect | ||||
|---|---|---|---|---|---|
| Sum of Squares | df | Mean Square Error | F | p | |
| TFM | 18,984 | 29 | 5539 | 3.42725 | 0.064900 |
| Area | 958,826,171 | 29 | 200,351,660 | 4.78572 | 0.029302 |
| F0 | 6257 | 29 | 600 | 10.43421 | 0.001344 |
| FM | 141,911 | 29 | 13,807 | 10.27838 | 0.001459 |
| FV | 88,573 | 29 | 14,966 | 5.91849 | 0.015441 |
| FV/FM | 0.00007 | 29 | 0.0009 | 0.08489 | 0.770939 |
| PI | 220 | 29 | 13 | 16.75891 | 0.000052 |
Publisher’s Note: MDPI stays neutral with regard to jurisdictional claims in published maps and institutional affiliations. |
© 2022 by the authors. Licensee MDPI, Basel, Switzerland. This article is an open access article distributed under the terms and conditions of the Creative Commons Attribution (CC BY) license (https://creativecommons.org/licenses/by/4.0/).
Share and Cite
Paliwoda, D.; Mikiciuk, G.; Mikiciuk, M.; Kisiel, A.; Sas-Paszt, L.; Miller, T. Effects of Rhizosphere Bacteria on Strawberry Plants (Fragaria × ananassa Duch.) under Water Deficit. Int. J. Mol. Sci. 2022, 23, 10449. https://doi.org/10.3390/ijms231810449
Paliwoda D, Mikiciuk G, Mikiciuk M, Kisiel A, Sas-Paszt L, Miller T. Effects of Rhizosphere Bacteria on Strawberry Plants (Fragaria × ananassa Duch.) under Water Deficit. International Journal of Molecular Sciences. 2022; 23(18):10449. https://doi.org/10.3390/ijms231810449
Chicago/Turabian StylePaliwoda, Dominika, Grzegorz Mikiciuk, Małgorzata Mikiciuk, Anna Kisiel, Lidia Sas-Paszt, and Tymoteusz Miller. 2022. "Effects of Rhizosphere Bacteria on Strawberry Plants (Fragaria × ananassa Duch.) under Water Deficit" International Journal of Molecular Sciences 23, no. 18: 10449. https://doi.org/10.3390/ijms231810449
APA StylePaliwoda, D., Mikiciuk, G., Mikiciuk, M., Kisiel, A., Sas-Paszt, L., & Miller, T. (2022). Effects of Rhizosphere Bacteria on Strawberry Plants (Fragaria × ananassa Duch.) under Water Deficit. International Journal of Molecular Sciences, 23(18), 10449. https://doi.org/10.3390/ijms231810449


