
Influence of Heat Treatment on Surface, Structural and Optical Properties of Nickel and Copper Phthalocyanines Thin Films

 , , , ,
Abstract
:1. Introduction
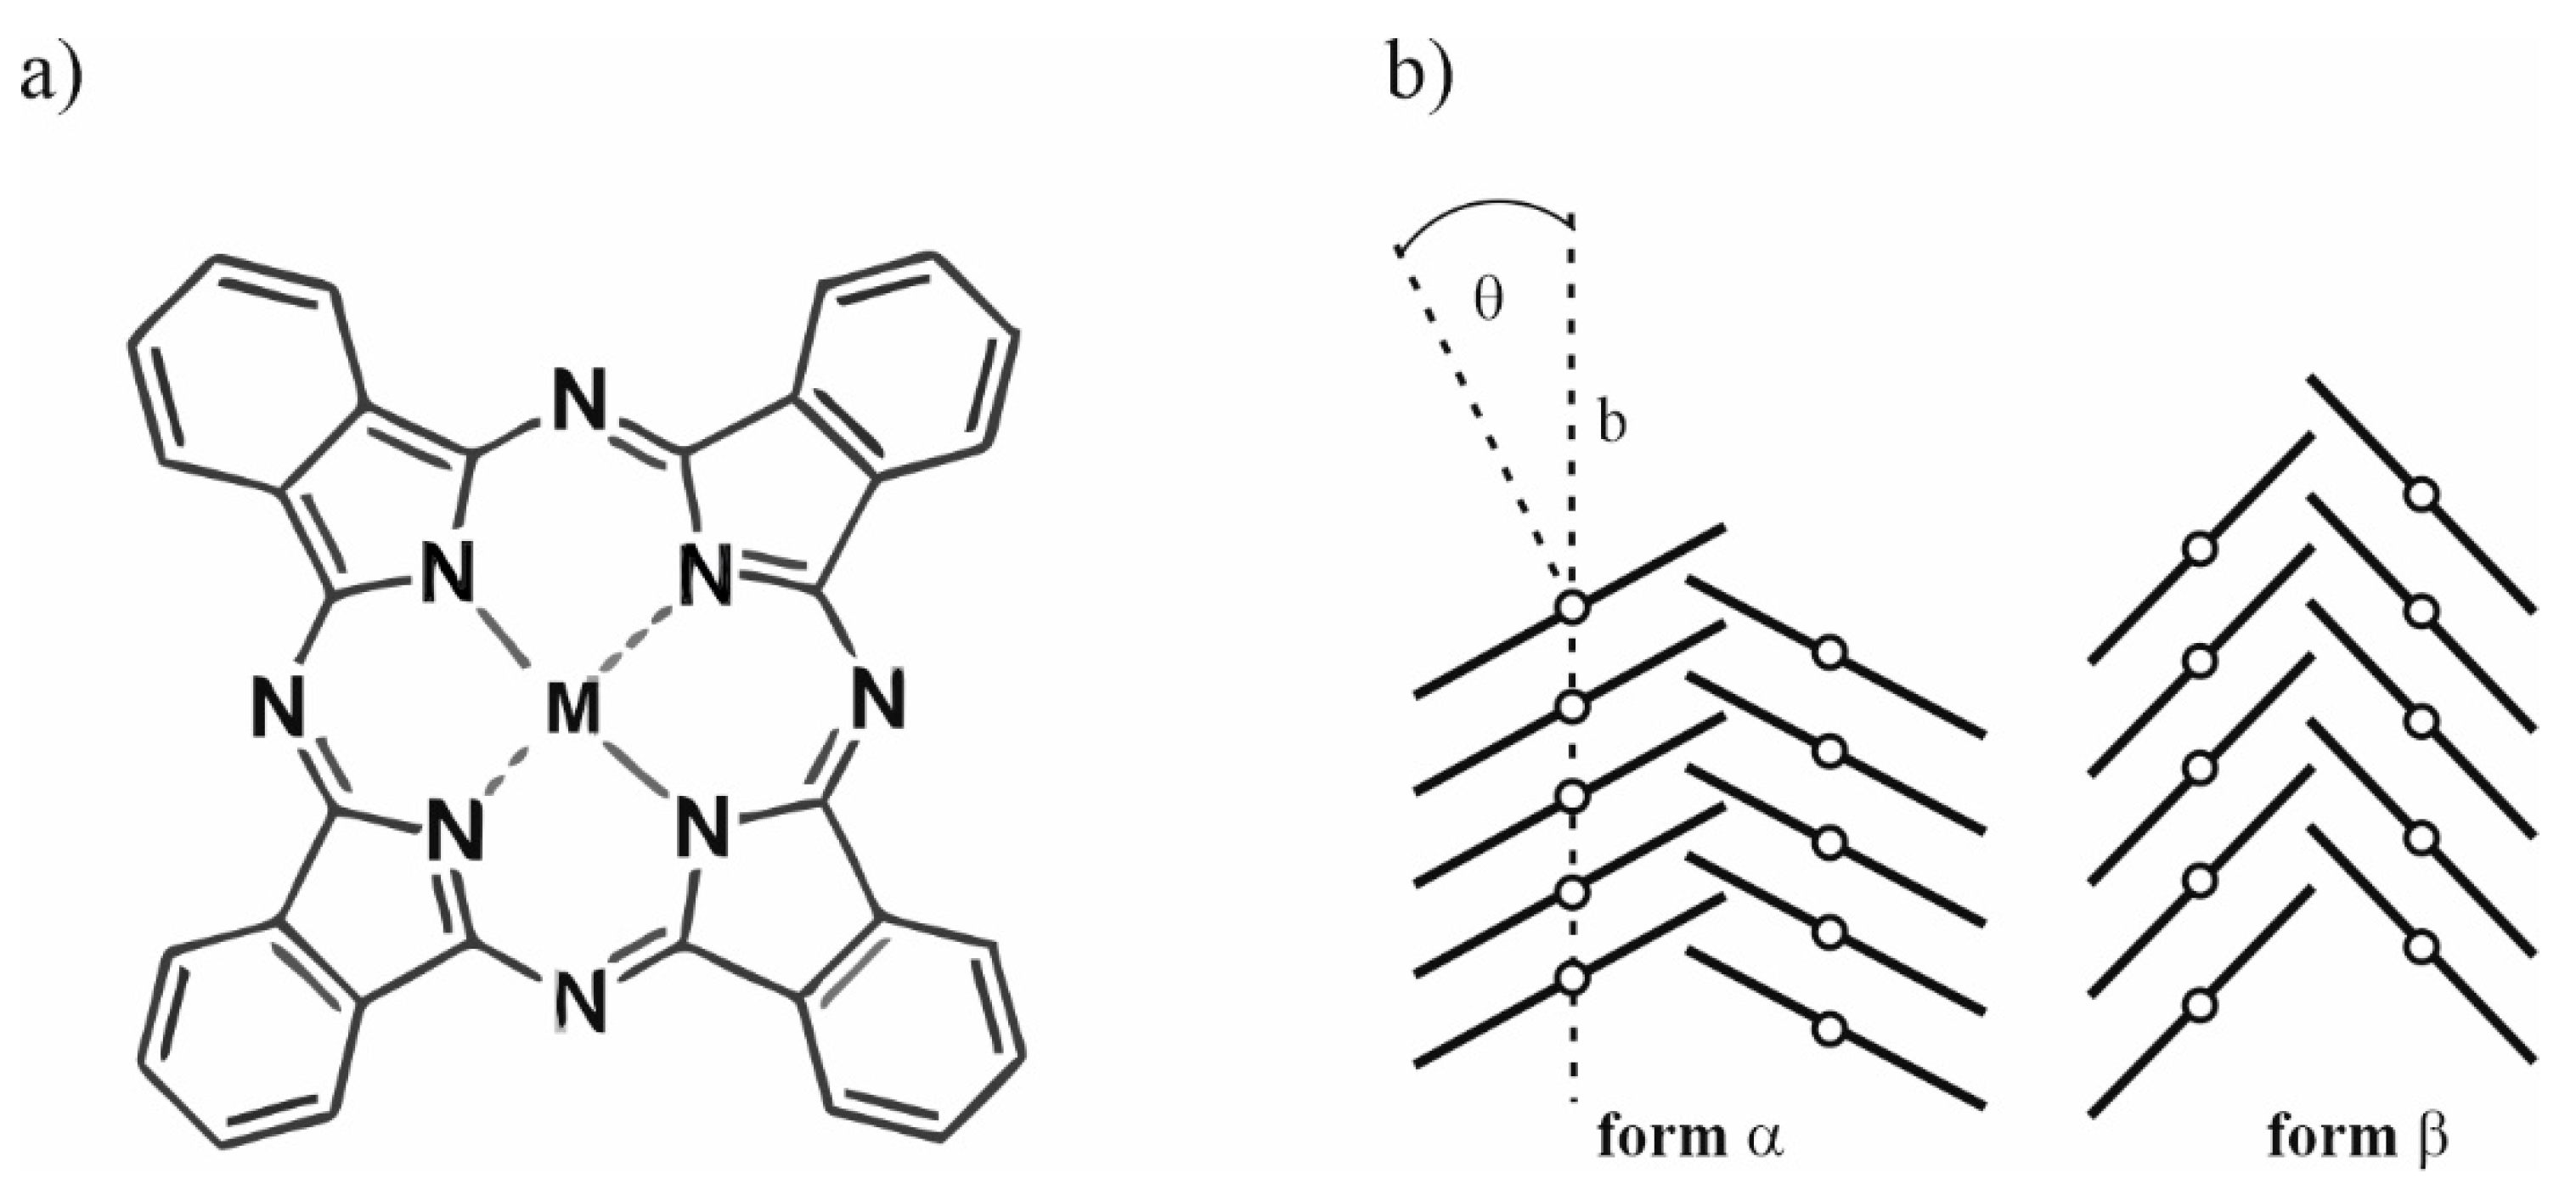
2. Results and Discussion
2.1. AFM
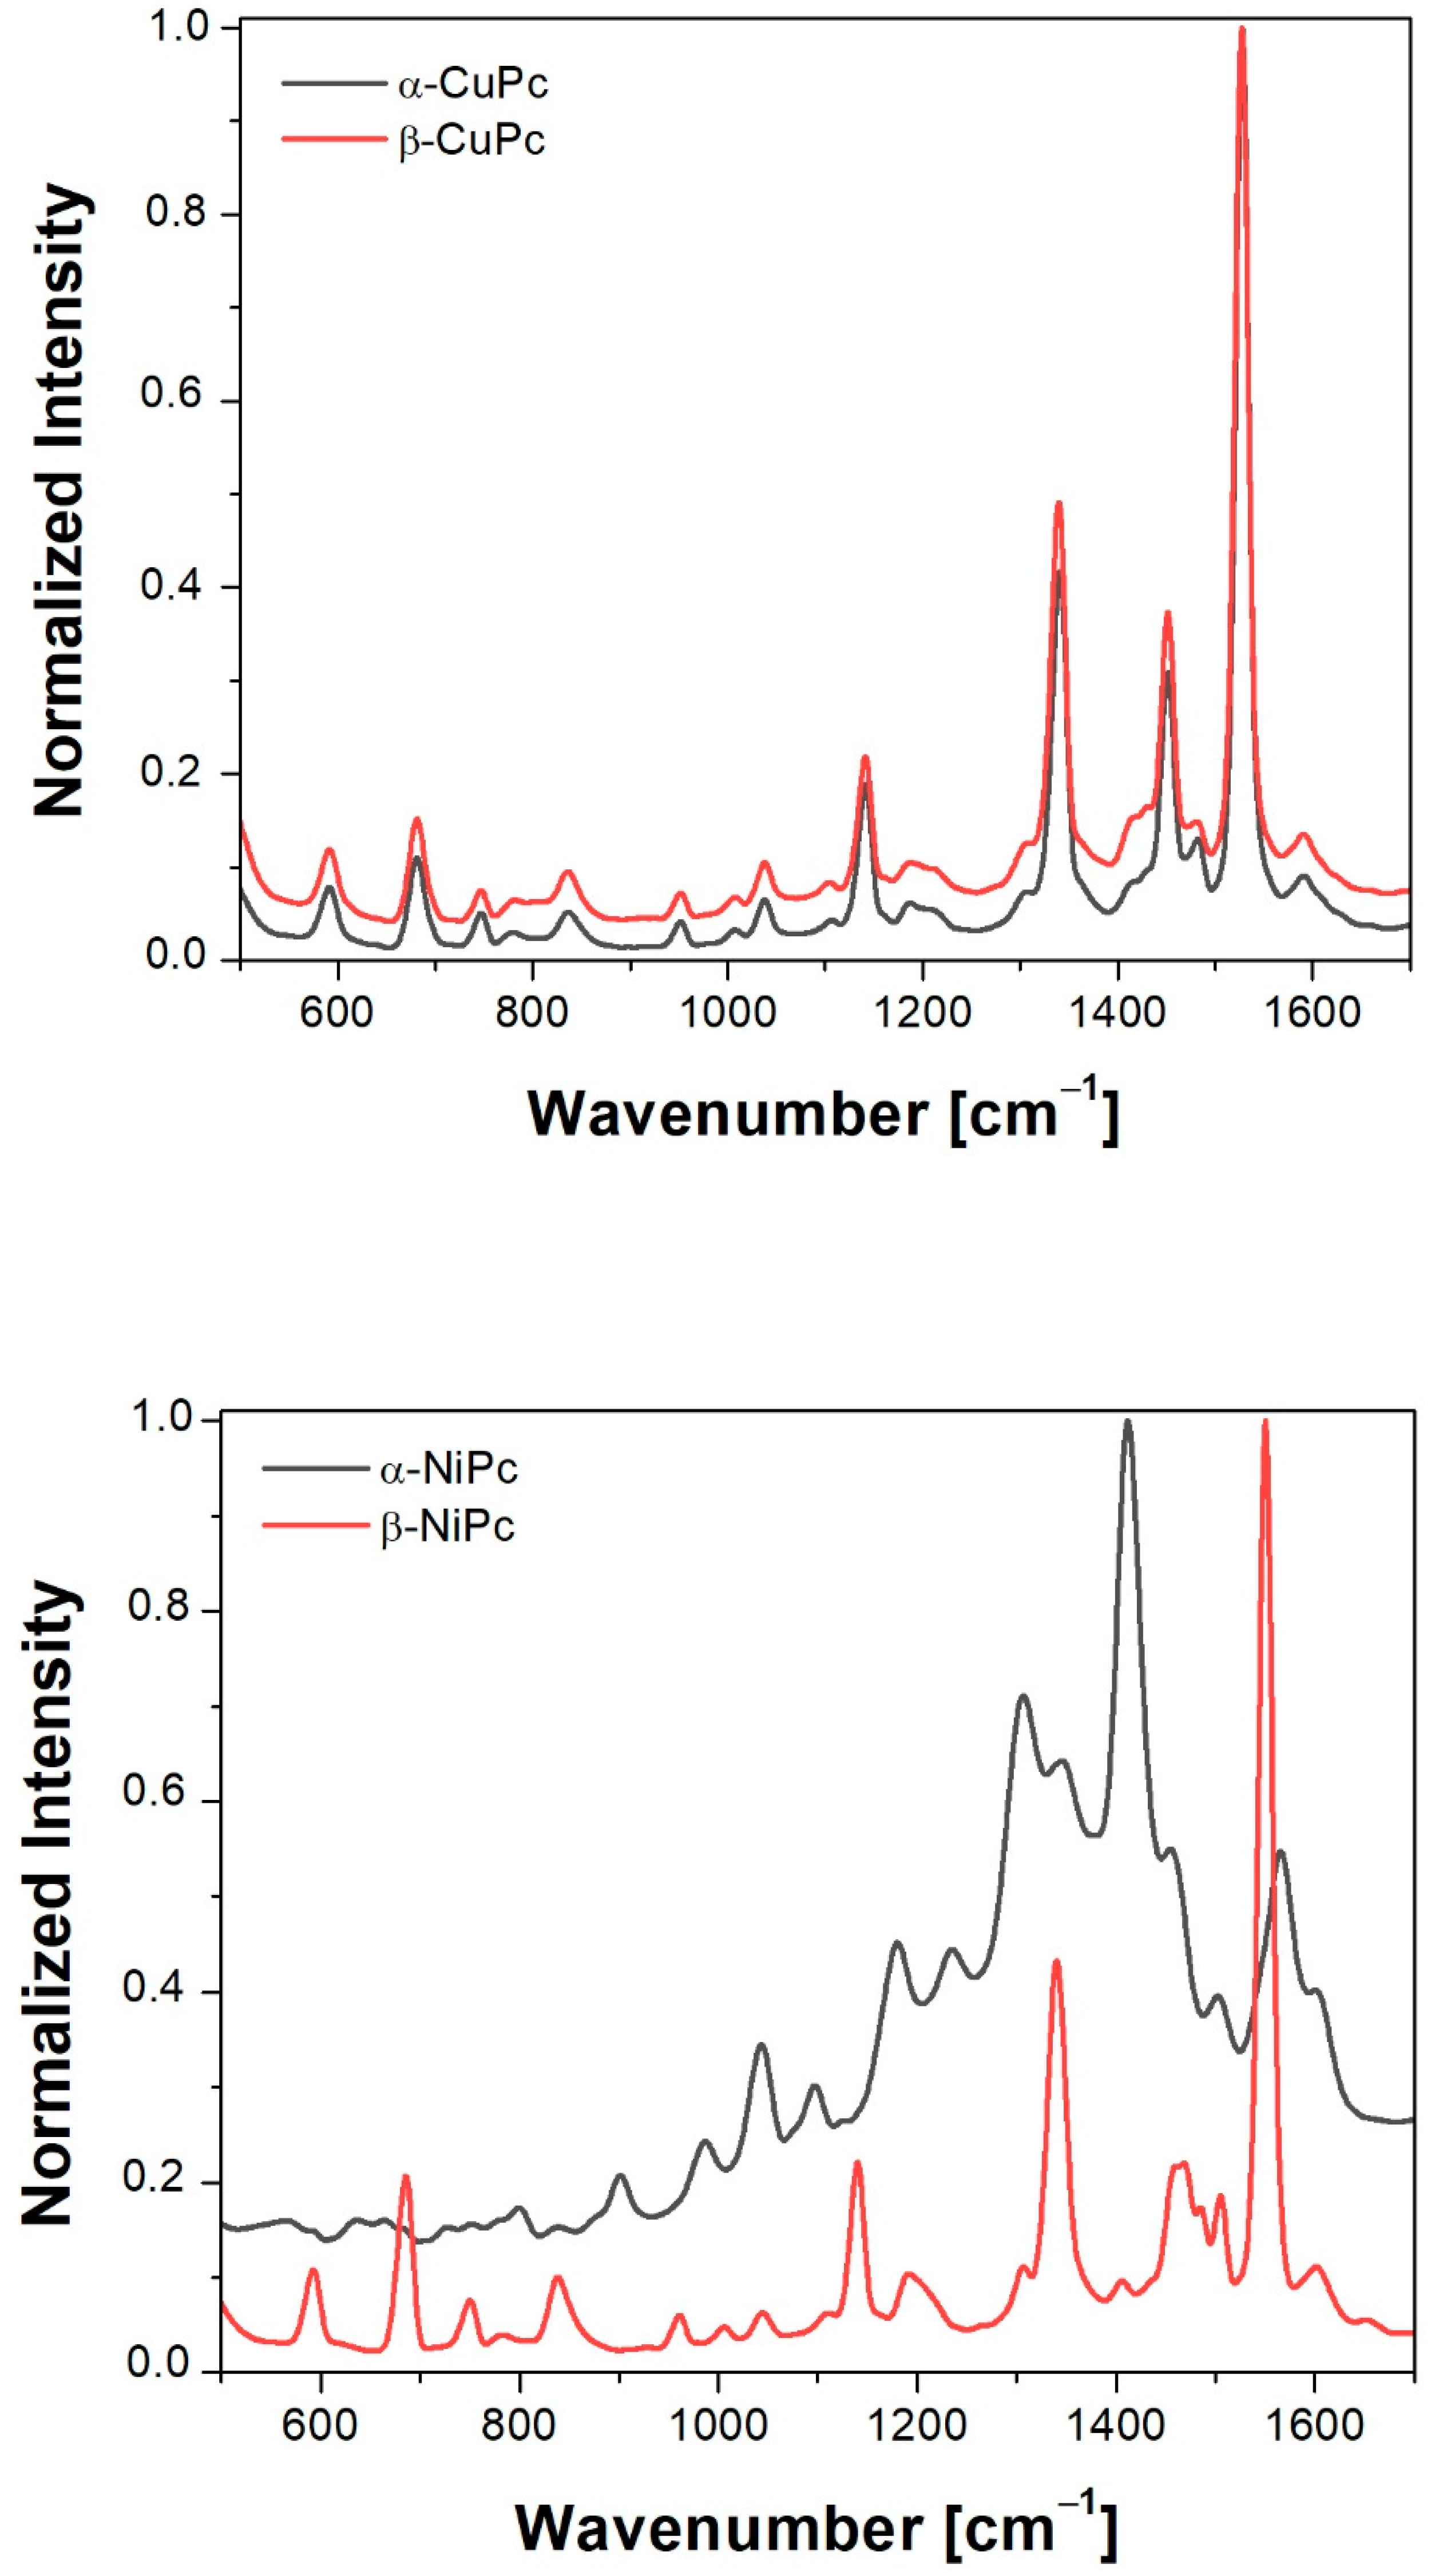
2.2. Raman
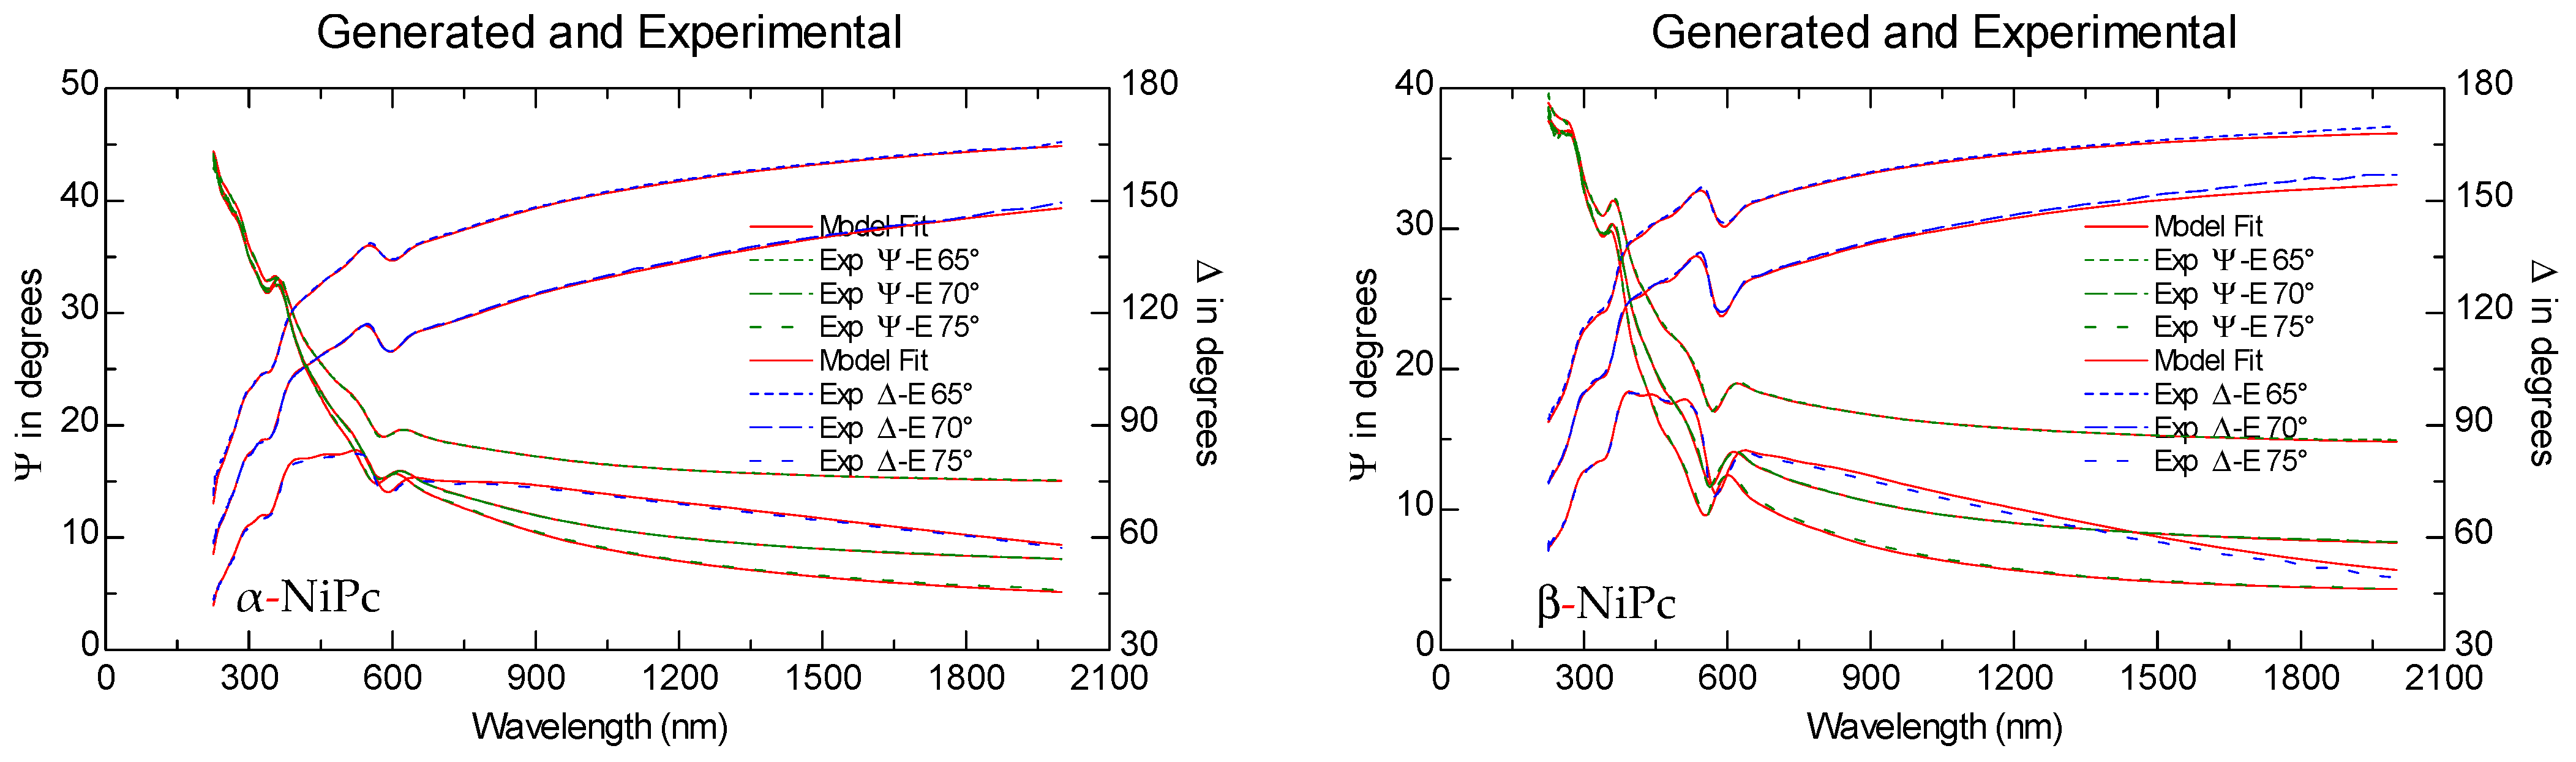
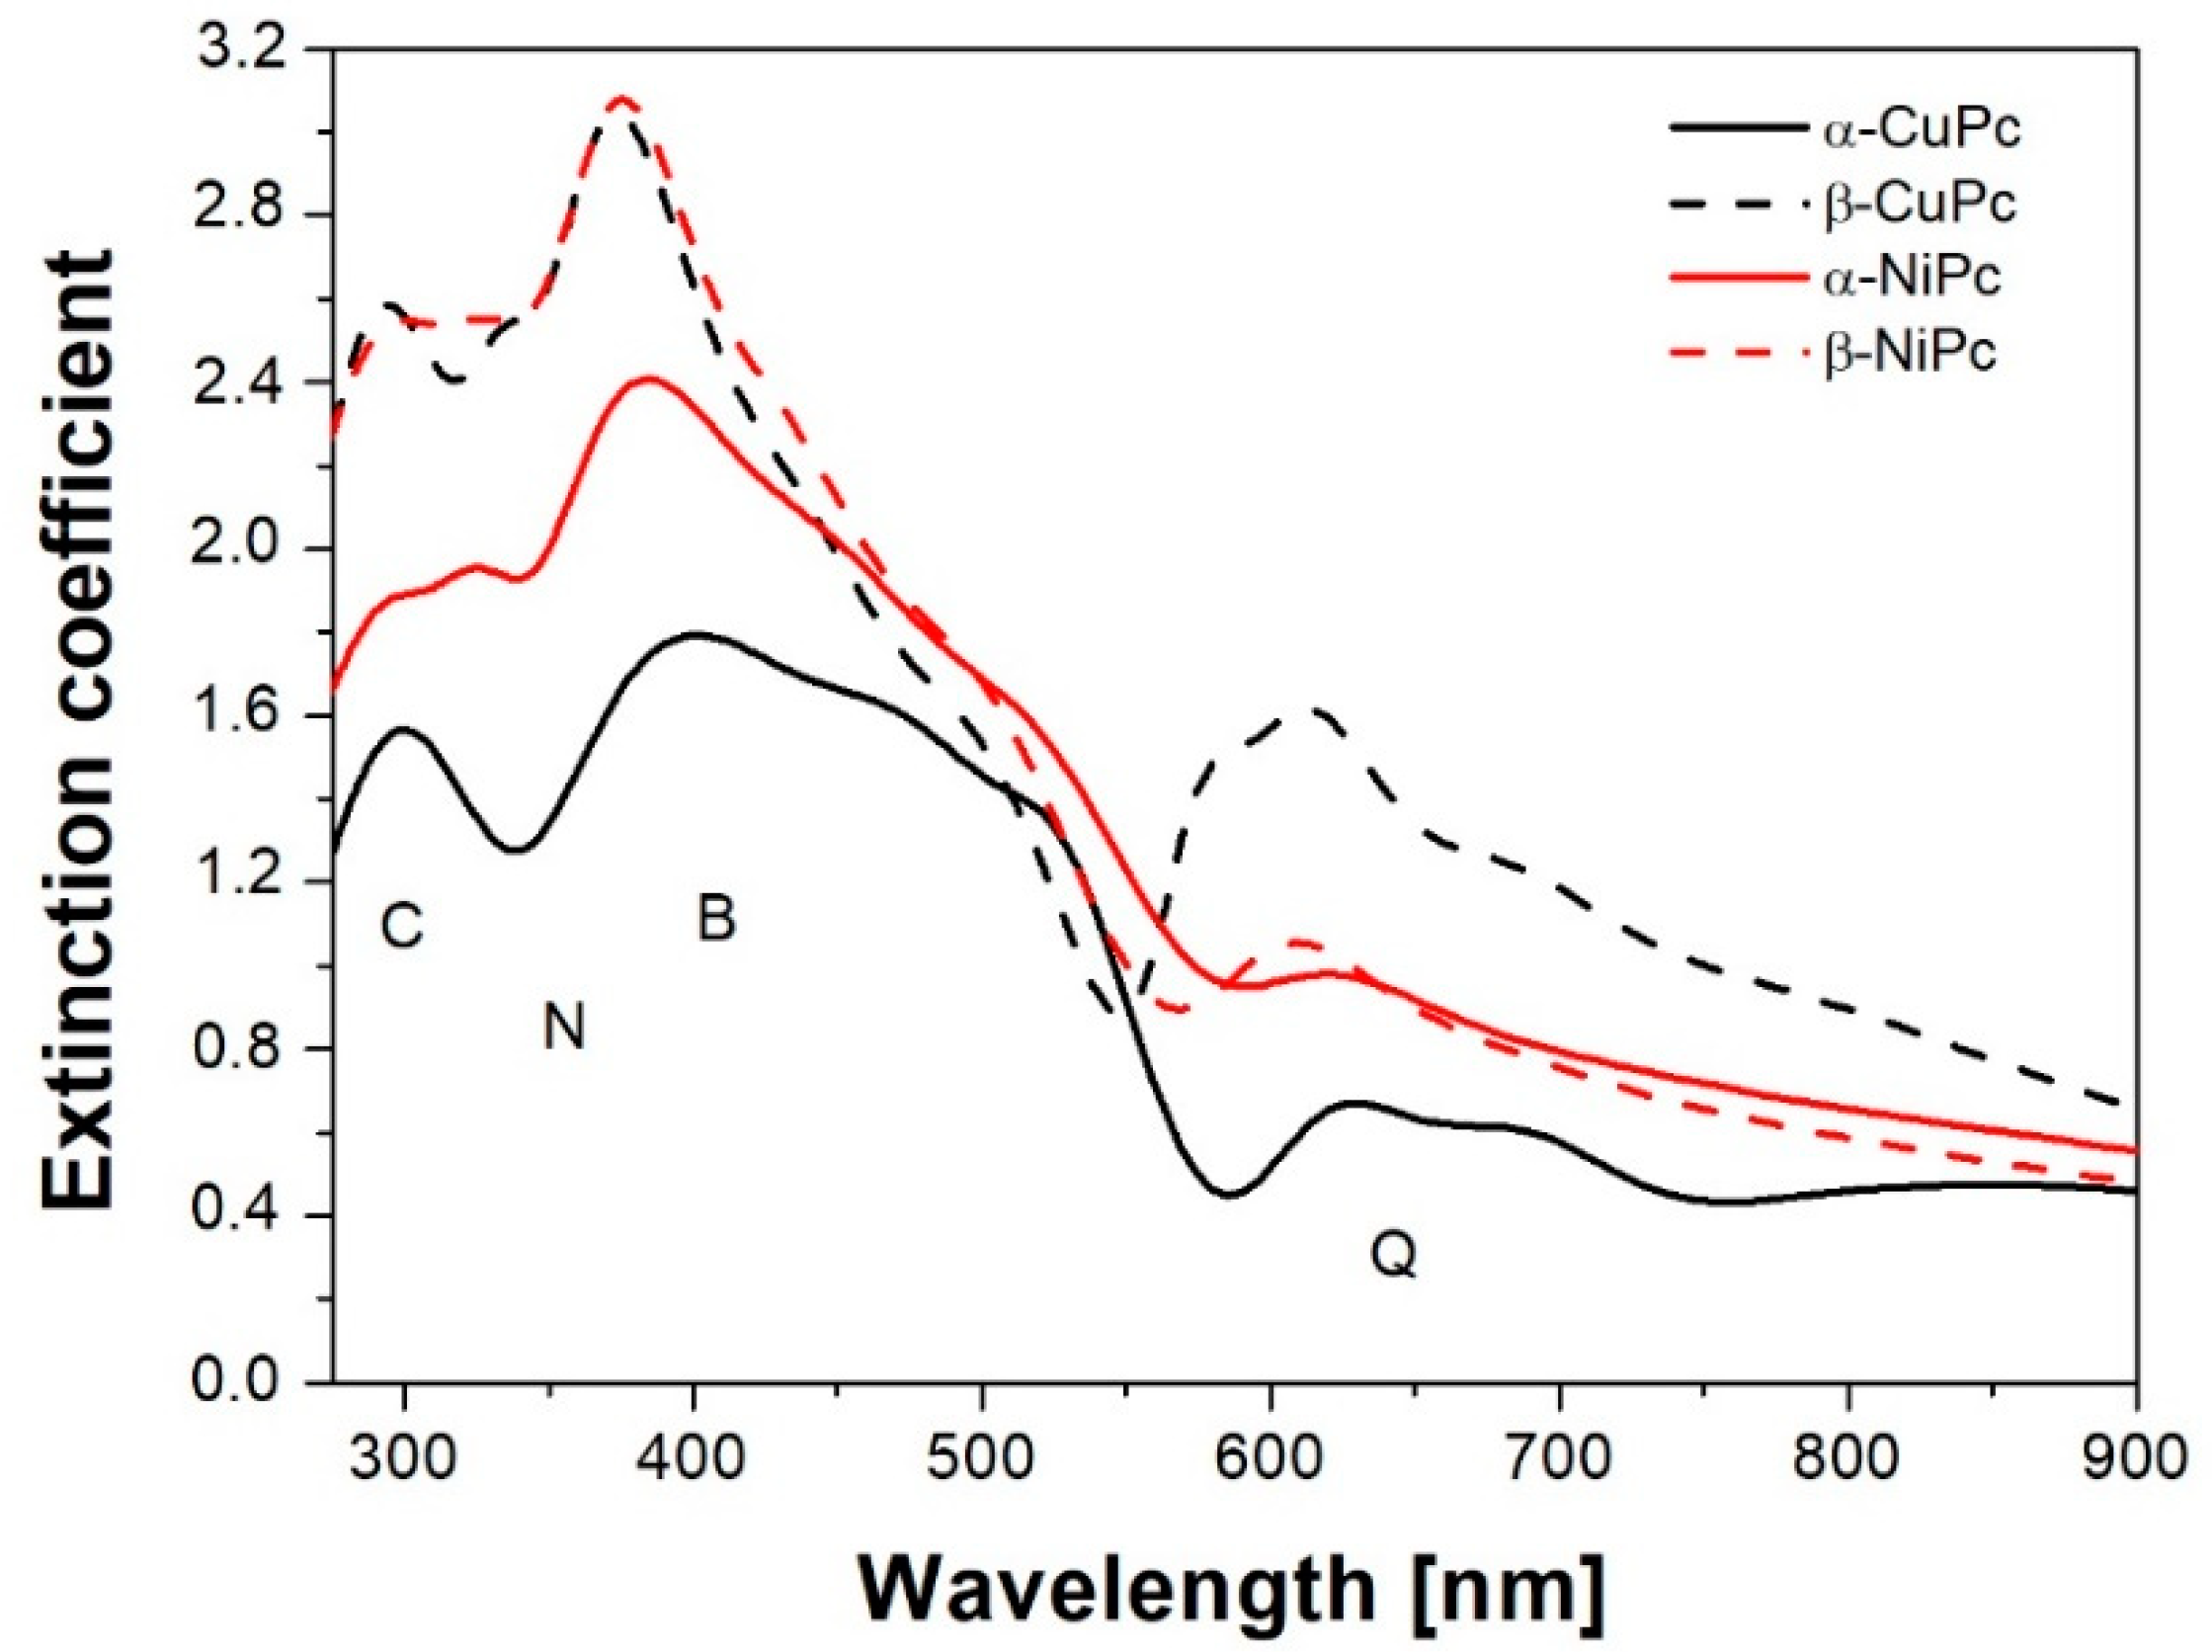
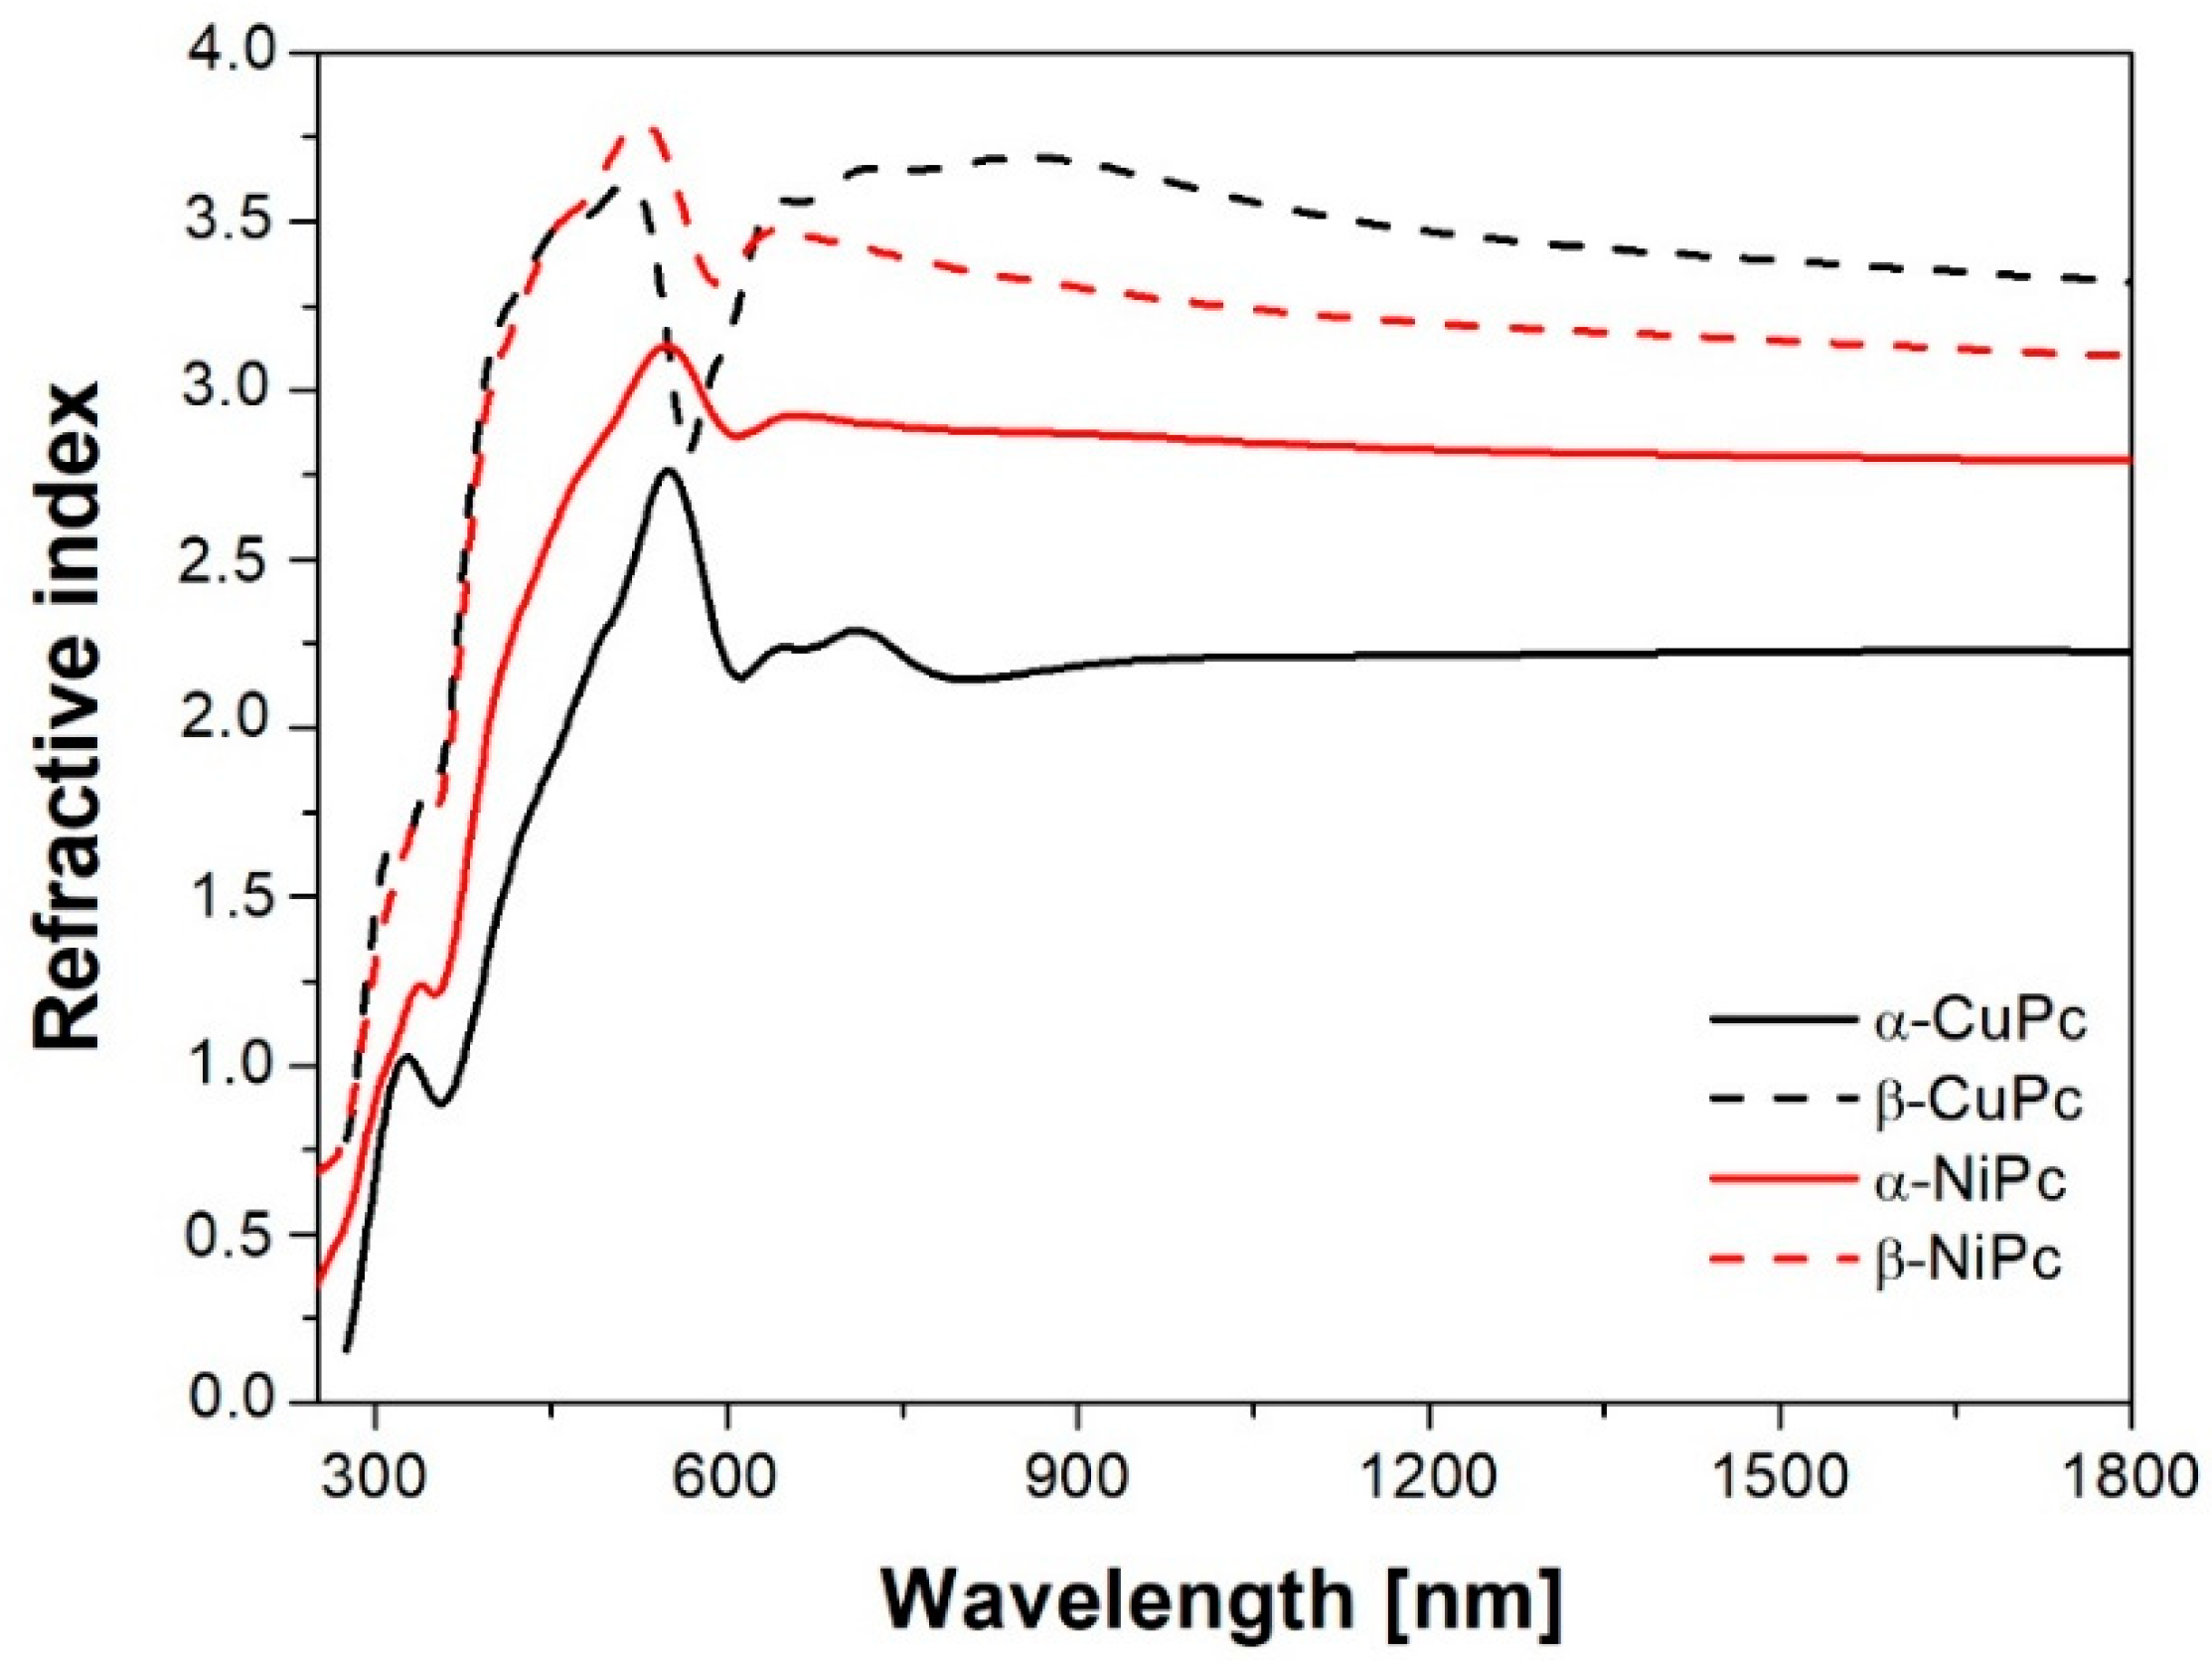
2.3. Spectroscopic Ellipsometry Measurements
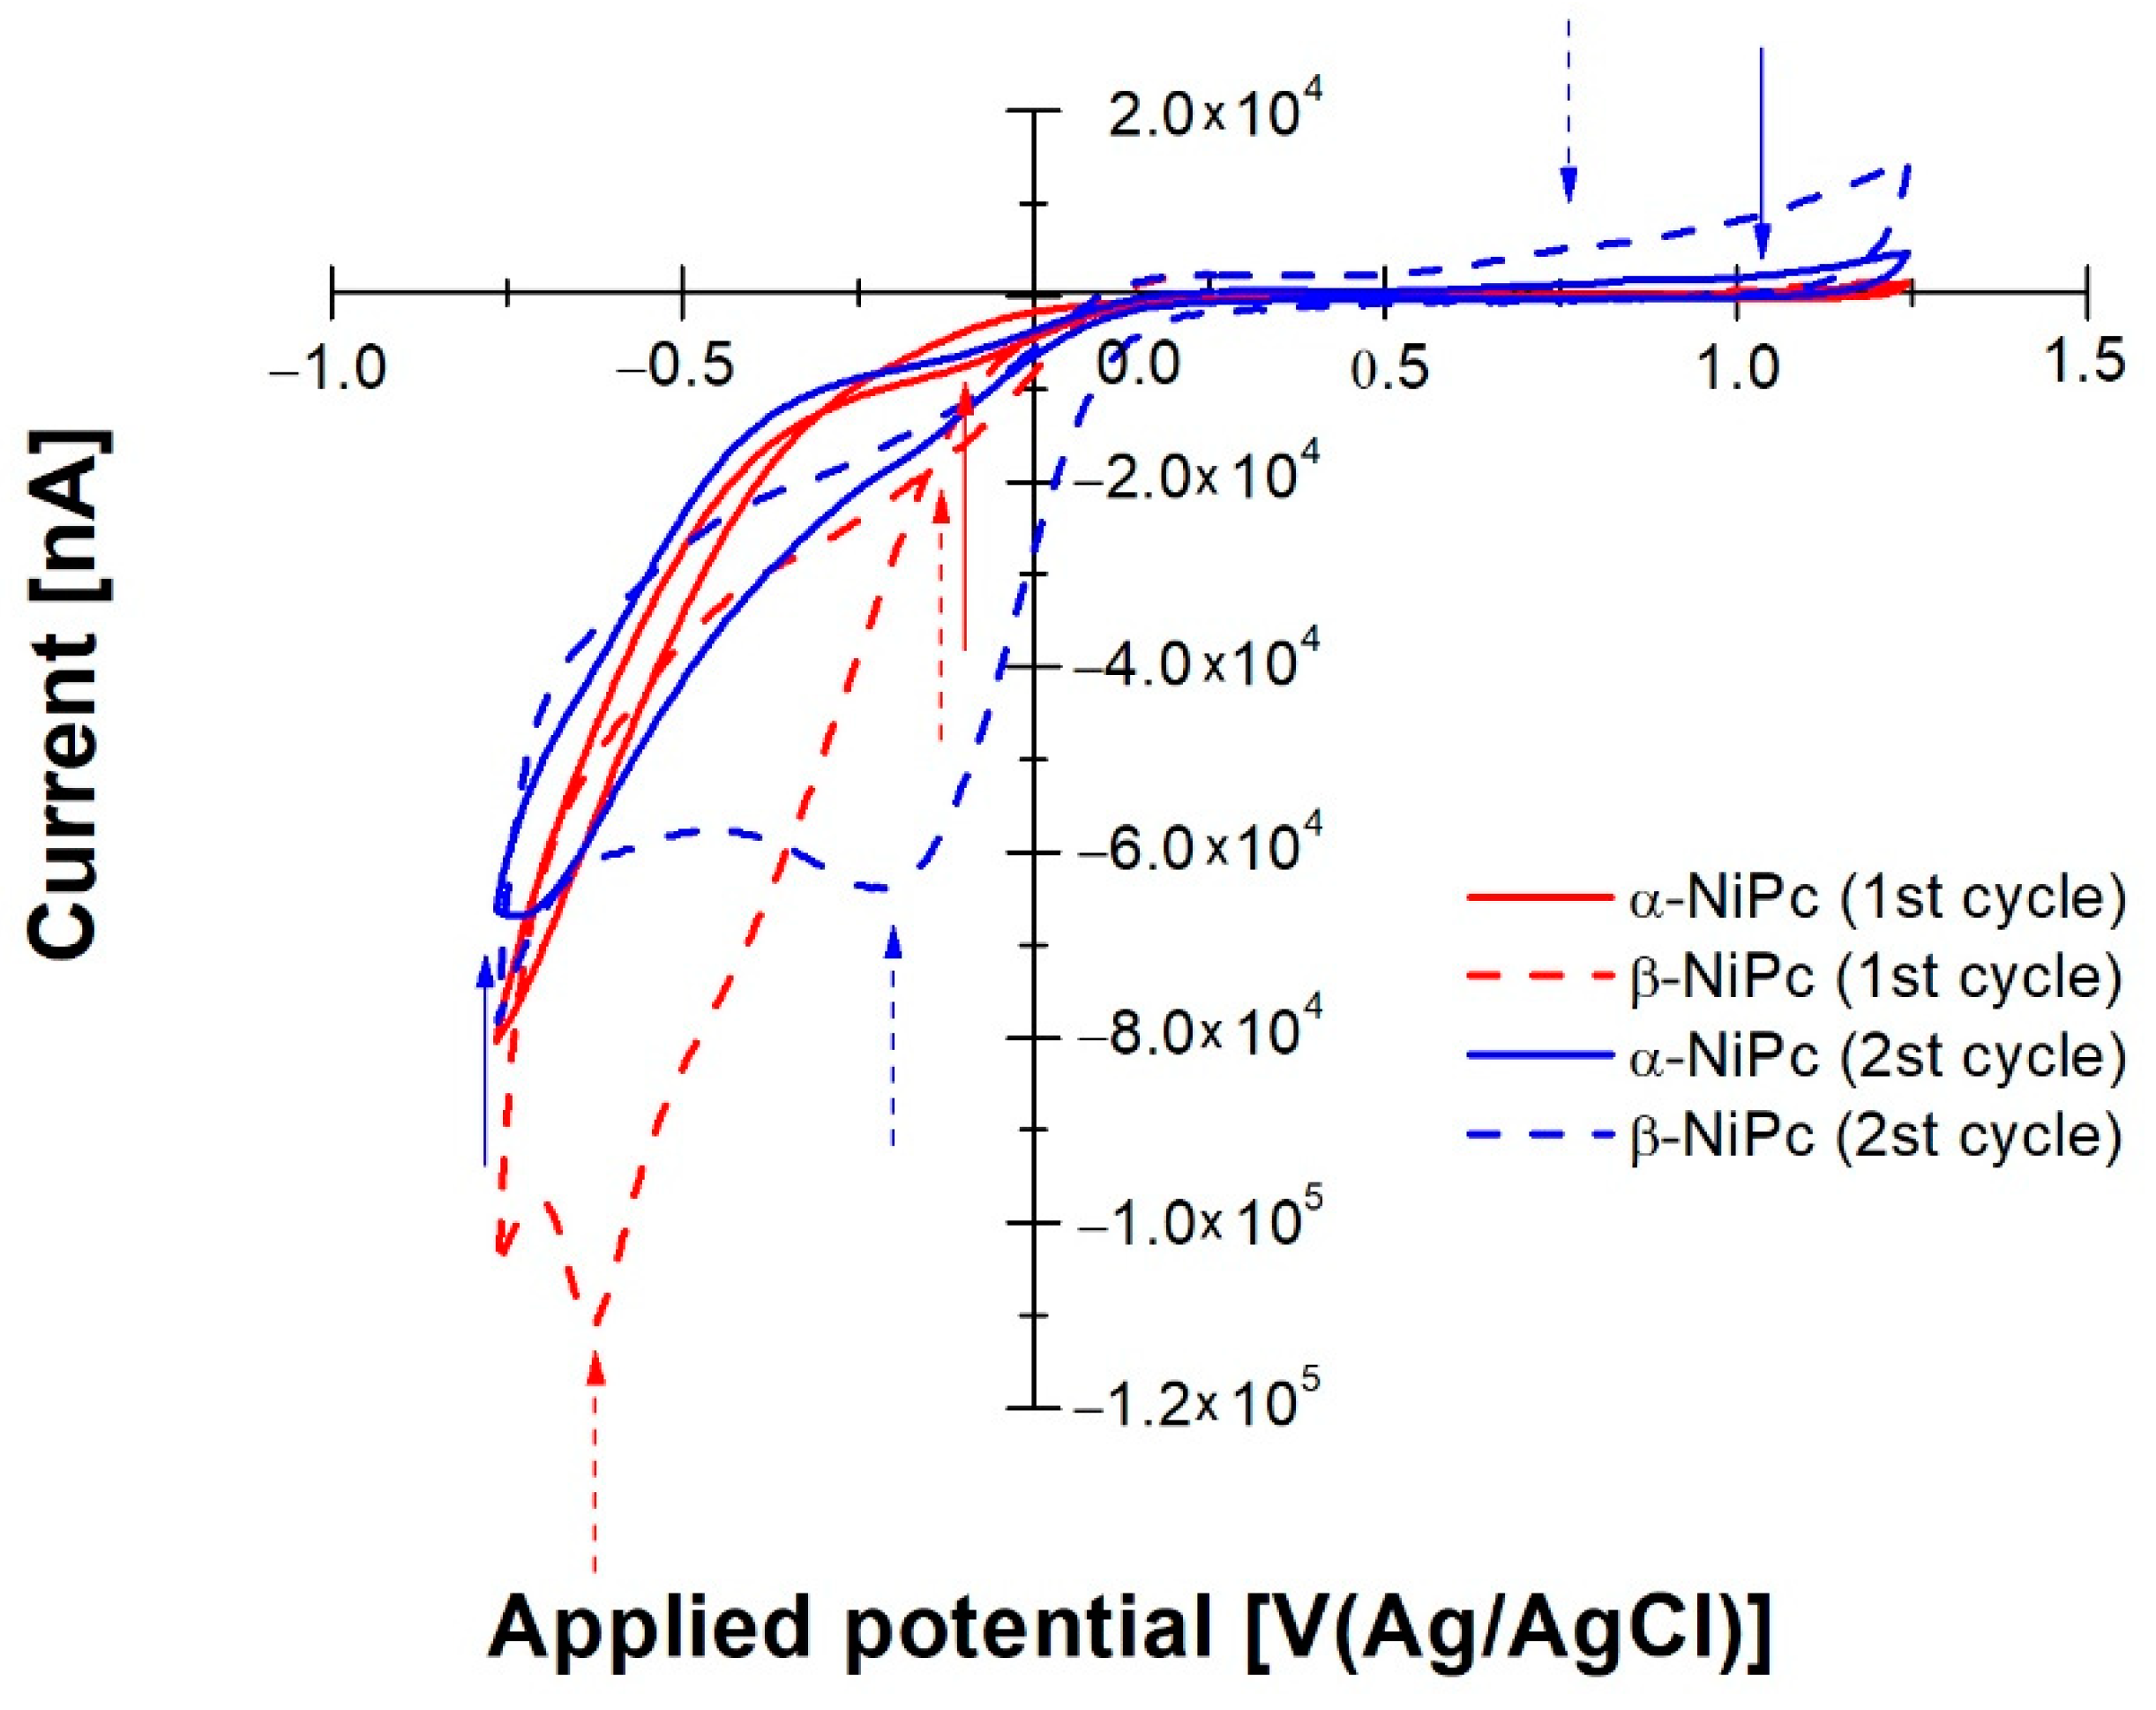
2.4. Electrochemical Investigation
3. Materials and Methods
3.1. Metallophthalocyanines
3.2. Preparation of Thin Films
3.3. Experimental Methods
4. Conclusions
Supplementary Materials
Author Contributions
Funding
Institutional Review Board Statement
Informed Consent Statement
Data Availability Statement
Conflicts of Interest
References
- Forrest, S.R.; Thompson, M.E. Introduction: Organic Electronics and Optoelectronics. Chem. Rev. 2007, 107, 923–925. [Google Scholar] [CrossRef]
- Wöhrle, D. Phthalocyanines: Properties and applications. Edited by C. C. Leznoff and A. B. P. Lever, VCH, Weinheim. Volume 1, 1989, 436 pp., ISBN 3-527-26955-X; Volume 2, 1993, 305 pp., DM 268, ISBN 3-527-89544-2. Adv. Mater. 1993, 5, 942–943. [Google Scholar] [CrossRef]
- Derkowska-Zielinska, B.; Gondek, E.; Pokladko-Kowar, M.; Kaczmarek-Kedziera, A.; Kysil, A.; Lakshminarayana, G.; Krupka, O. Photovoltaic cells with various azo dyes as components of the active layer. Sol. Energy 2020, 203, 19–24. [Google Scholar] [CrossRef]
- Kumar, C.V.; Sfyri, G.; Raptis, D.; Stathatos, E.; Lianos, P. Perovskite Solar Cell with Low Cost Cu-Phthalocyanine as Hole Transporting Material. RSC Adv. 2015, 5, 3786–3791. [Google Scholar] [CrossRef]
- Klos-Witkowska, A. Influence of fractional electromagnetic radiation doses on biosensor matrix component stability. Acta Phys. Pol. A 2018, 133, 101–104. [Google Scholar] [CrossRef]
- Kłos-Witkowska, A.; Martsenyuk, V.; Karpinskyi, V. Analysis of Stability in Enzyme Biosensor Based on Michaelis-Menten Model with Time Delays. Acta Phys. Pol. A 2019, 135, 375–379. [Google Scholar] [CrossRef]
- Yang, J.; Gordon, K.C. Organic light emitting devices based on exciplex interaction from blends of charge transport molecules. Chem. Phys. Lett. 2003, 375, 649–654. [Google Scholar] [CrossRef]
- Sonmezoglu, S.; Şenkul, S.; Taş, R.; Çankaya, G.; Can, M. Electrical characteristics of an organic thin copolymer/pSi Schottky barrier diode. Thin Solid Film. 2010, 518, 4375–4379. [Google Scholar] [CrossRef]
- Sonmezoglu, S.; Şenkul, S.; Taş, R.; Çankaya, G.; Can, M. Electrical and interface state density properties of polyaniline-poly-3-methyl thiophene blend/p-Si Schottky barrier diode. Solid State Sci. 2010, 12, 706–711. [Google Scholar] [CrossRef]
- Gu, D.; Chen, Q.; Tang, X.; Tang, F.; Gan, F.; Shen, S.; Liu, K.; Xu, H. Optical recording performance of phthalocyanine thin films. In Proceedings of the Fourth International Symposium on Optical Storage (ISOS 96), Shenzhen, China, 22–26 April 1996; pp. 67–72. [Google Scholar]
- Pfeiffer, M.; Beyer, A.; Plönnigs, B.; Nollau, A.; Fritz, T.; Leo, K.; Schlettwein, D.; Hiller, S.; Wöhrle, D. Controlled p-doping of pigment layers by cosublimation: Basic mechanisms and implications for their use in organic photovoltaic cells. Sol. Energy Mater. Sol. Cells 2000, 63, 83–99. [Google Scholar] [CrossRef]
- Radhakrishnan, S.; Deshpande, S.D. Conducting Polymers Functionalized with Phthalocyanine as Nitrogen Dioxide Sensors. Sensors 2002, 2, 185–194. [Google Scholar] [CrossRef]
- Michnik, A.; Kłos, A.; Drzazga, Z. The influence of radio-frequency radiation on thermal stability of bovine serum albumin in aqueous solution. J. Therm. Anal. Calorim. 2004, 77, 269–277. [Google Scholar] [CrossRef]
- Popielarski, P.; Mosinska, L.; Bala, W.; Paprocki, K.; Zorenko, Y.; Zorenko, T.; Sypniewska, M. Persistent photoconductivity in ZnO thin films grown on Si substrate by spin coating method. Opt. Mater. 2019, 97, 109343. [Google Scholar] [CrossRef]
- Regimol, C.; Menon, C. Effect of annealing and γ irradiation on tin phthalocyanine thin films. Mater. Sci. Pol. 2007, 25, 649–655. [Google Scholar]
- Soliman, H.; El Nahass, M.; Farid, A.; Farag, A.; El Shazly, A. Structural and transport properties of evaporated iron phthalocyanine (FePc) thin films. Eur. Phys. J. Appl. Phys. 2003, 21, 187–193. [Google Scholar] [CrossRef]
- Soliman, H.; El-Barry, A.; Khosifan, N.; El Nahass, M. Structural and electrical properties of thermally evaporated cobalt phthalocyanine (CoPc) thin films. Eur. Phys. J.-Appl. Phys. 2007, 37, 1–9. [Google Scholar] [CrossRef]
- Riad, S. Dark and photoelectric conversion properties of p-MgPc/n-Si (Organic/Inorganic) heterojunction cells. Thin Solid Film. 2000, 370, 253–257. [Google Scholar] [CrossRef]
- Saleh, A.M.; Abu-Hilal, A.O.; Gould, R.D. Investigation of electrical properties (ac and dc) of organic zinc phthalocyanine, ZnPc, semiconductor thin films. Curr. Appl. Phys. 2003, 3, 345–350. [Google Scholar] [CrossRef]
- Neghabi, M.; Zadsar, M.; Ghorashi, S.M.B. Investigation of structural and optoelectronic properties of annealed nickel phthalocyanine thin films. Mater. Sci. Semicond. Process. 2014, 17, 13–20. [Google Scholar] [CrossRef]
- Popielarski, P.; Bala, W.; Paprocki, K.; Mosinska, L.; Kowalska, M.; Szybowicz, M.; Makowiecki, J. Admittance spectroscopy of CuPC-Si and CoPC-Si heterostructures. Electrochim. Acta 2013, 104, 496–504. [Google Scholar] [CrossRef]
- Ottaviano, L.; Di Nardo, S.; Lozzi, L.; Passacantando, M.; Picozzi, P.; Santucci, S. Thin and ultra-thin films of nickel phthalocyanine grown on highly oriented pyrolitic graphite: An XPS, UHV-AFM and air tapping-mode AFM study. Surf. Sci. 1997, 373, 318–332. [Google Scholar] [CrossRef]
- Tekiel, A.; Goryl, M.; Szymonski, M. Copper phthalocyanine molecules on an InSb(001) c(8 × 2) surface studied by ultra-high-vacuum STM and non-contact AFM. Nanotechnology 2007, 18, 475707. [Google Scholar] [CrossRef]
- Davia, F.G.; Johner, N.P.; Calvo, E.J.; Williams, F.J. Growth and electrochemical stability of a layer-by-layer thin film containing tetrasulfonated Fe phthalocyanine. J. Electroanal. Chem. 2020, 877, 114485. [Google Scholar] [CrossRef]
- Brozek-Pluska, B.; Jarota, A.; Kania, R.; Abramczyk, H. Zinc Phthalocyanine Photochemistry by Raman Imaging, Fluorescence Spectroscopy and Femtosecond Spectroscopy in Normal and Cancerous Human Colon Tissues and Single Cells. Molecules 2020, 25, 2688. [Google Scholar] [CrossRef]
- Szybowicz, M.; Runka, T.; Drozdowski, M.; Bała, W.; Grodzicki, A.; Piszczek, P.; Bratkowski, A. High temperature study of FT-IR and Raman scattering spectra of vacuum deposited CuPc thin films. J. Mol. Struct. 2004, 704, 107–113. [Google Scholar] [CrossRef]
- Wojdyła, M.; Derkowska, B.; Rębarz, M.; Bratkowski, A.; Bała, W. Stationary and modulated absorption spectroscopy of copper phthalocyanine (CuPc) layers grown on transparent substrate. J. Opt. A Pure Appl. Opt. 2005, 7, 463–466. [Google Scholar] [CrossRef]
- Wojdyła, M.; Derkowska, B.; Bała, W.; Bratkowski, A.; Korcala, A. Investigation of optical transition energy in copper phthalocyanine by transmission, reflection and photoreflectance spectroscopy. Opt. Mater. 2006, 28, 1000–1005. [Google Scholar] [CrossRef]
- Tackley, D.R.; Dent, G.; Ewen Smith, W. Phthalocyanines: Structure and vibrations. Phys. Chem. Chem. Phys. 2001, 3, 1419–1426. [Google Scholar] [CrossRef]
- J.A. Woollam Company. Guide to Using WVASE32®; J.A. Woollam Company: New York, NY, USA, 2010. [Google Scholar]
- Fujiwara, H. Spectroscopic Ellipsometry: Principles and Applications; John Wiley & Sons: Hoboken, NJ, USA, 2007. [Google Scholar]
- Liao, M.-S.; Scheiner, S. Electronic structure and bonding in metal phthalocyanines, Metal = Fe, Co, Ni, Cu, Zn, Mg. J. Chem. Phys. 2001, 114, 9780–9791. [Google Scholar] [CrossRef]
- Wojdyła, M.; Rębarz, M.; Bała, W.; Derkowska, B.; Łukasiak, Z. Optical Properties of Vacuum Sublimed Cobalt Phthalocyanine (CoPc) Thin Layers. Mol. Cryst. Liq. Cryst. 2008, 485, 974–989. [Google Scholar] [CrossRef]
- Derkowska, B.; Wojdyła, M.; Czaplicki, R.; Bała, W.; Sahraoui, B. Influence of the central metal atom on the nonlinear optical properties of MPcs solutions and thin films. Opt. Commun. 2007, 274, 206–212. [Google Scholar] [CrossRef]
- Farag, A.A.M. Optical absorption studies of copper phthalocyanine thin films. Opt. Laser Technol. 2007, 39, 728–732. [Google Scholar] [CrossRef]
- El-Nahass, M.M.; Farag, A.M.; Abd El-Rahman, K.F.; Darwish, A.A.A. Dispersion studies and electronic transitions in nickel phthalocyanine thin films. Opt. Laser Technol. 2005, 37, 513–523. [Google Scholar] [CrossRef]
- Kumar, G.A.; Thomas, J.; Unnikrishnan, N.V.; Nampoori, V.P.N.; Vallabhan, C.P.G. Optical properties of phthalocyanine molecules in cyano acrylate polymer matrix. Mater. Res. Bull. 2001, 36, 1–8. [Google Scholar] [CrossRef]
- Wojdyła, M.; Bała, W.; Derkowska, B.; Rębarz, M.; Korcala, A. The temperature dependence of photoluminescence and absorption spectra of vacuum-sublimed magnesium phthalocyanine thin films. Opt. Mater. 2008, 30, 734–739. [Google Scholar] [CrossRef]
- Ding, L.; Xin, Q.; Zhou, X.; Qiao, J.; Li, H.; Wang, H. Electrochemical behavior of nanostructured nickel phthalocyanine (NiPc/C) for oxygen reduction reaction in alkaline media. J. Appl. Electrochem. 2013, 43, 43–51. [Google Scholar] [CrossRef]
- Sakamoto, K. Cyclic voltammetry of phthalocyanines. In Voltammetry; IntechOpen: London, UK, 2018. [Google Scholar]
- Cernini, R.; Li, X.C.; Spencer, G.W.C.; Holmes, A.B.; Moratti, S.C.; Friend, R.H. Electrochemical and optical studies of PPV derivatives and poly(aromatic oxadiazoles). Synth. Met. 1997, 84, 359–360. [Google Scholar] [CrossRef]
- Bartolomé, J.; Monton, C.; Schuller, I.K. Magnetism of metal phthalocyanines. In Molecular Magnets: Physics and Applications; Bartolomé, J., Luis, F., Fernández, J.F., Eds.; Springer: Berlin/Heidelberg, Germany, 2014; pp. 221–245. [Google Scholar]
- Debe, M.K.; Poirier, R.J.; Kam, K.K. Organic-thin-film-induced molecular epitaxy from the vapor phase. Thin Solid Film. 1991, 197, 335–347. [Google Scholar] [CrossRef]
- El-Nahass, M.M.; Bahabri, F.; Al-Ghamdi, A.; Alharbi, S. Structural and transport properties of copper phthalocyanine (CuPc) thin films. Egypt. J. Sol. 2002, 25, 307–321. [Google Scholar]
- Lee, Y.-L.; Sheu, C.-Y.; Hsiao, R.-H. Gas sensing characteristics of copper phthalocyanine films: Effects of film thickness and sensing temperature. Sens. Actuators B Chem. 2004, 99, 281–287. [Google Scholar] [CrossRef]
- Senthilarasu, S.; Sathyamoorthy, R.; Kulkarni, S.K. Substrate temperature effects on structural orientations and optical properties of ZincPthalocyanine (ZnPc) thin films. Mater. Sci. Eng. B 2005, 122, 100–105. [Google Scholar] [CrossRef]
- Sypniewska, M.; Szczesny, R.; Popielarski, P.; Strzalkowski, K.; Derkowska-Zielinska, B. Structural, morphological and photoluminescent properties of annealed ZnO thin layers obtained by the rapid sol-gel spin-coating method. Opto-Electron. Rev. 2020, 28, 182–190. [Google Scholar] [CrossRef]


| α-CuPc | β-CuPc | α-NiPc | β-NiPc | |||||
|---|---|---|---|---|---|---|---|---|
| PP (cm−1) | PI (a.u.) | PP (cm−1) | PI (a.u.) | PP (cm−1) | PI (a.u.) | PP (cm−1) | PI (a.u.) | Assigned Symmetry of Vibration |
| 588.9 | 2798 | 593.7 | 2505 | 593.7 | 6532 | 595.1 | 3792 | B1g C–N vib. |
| 682.35 | 3462 | 682.35 | 2956 | 688.55 | 11,792 | 688.5 | 6912 | A1g C–C vib. |
| 748.74 | 2253 | 746.92 | 1827 | 749.84 | 4674 | 749.84 | 2816 | B1g C–C vib. |
| 837.39 | 2095 | 836 | 2236 | 839.4 | 6219 | 838.8 | 3527 | Out-of-plane ring deformation |
| 1005 | 1629 | 1008.4 | 3364 | 1004.4 | 3442 | 1007.7 | 2368 | A1g |
| 1039.85 | 2541 | 1040.9 | 2649 | 1044.6 | 4214 | 1047.5 | 2550 | C–H bend |
| 1105 | 1966 | 1107.3 | 1693 | 1108.8 | 4214 | 1108.3 | 2816 | A1g C–H bend |
| 1140 | 5957 | 1142 | 3994 | 1142.7 | 12,565 | 1142.7 | 7092 | A1g Pyrrole ring deformation |
| 1190.86 | 2382 | 1194 | 2327 | 1197.9 | 6532 | 1194.8 | 3707 | B2g |
| 1338.9 | 12,276 | 1340 | 8220 | 1341.9 | 23,214 | 1341.9 | 13,427 | A1g pyrrole stretch |
| 1453.9 | 9196 | 1452.4 | 6392 | 1455.35 | 12,252 | 1461.5 | 7188 | B2g |
| 1482 | 4204 | 1486 | 3091 | 1473.9 | 12,565 | 1486 | 5670 | |
| 1526 | 28,419 | 1529 | 16,150 | 1555 | 52,109 | 1553.4 | 30,267 | B2g C–N vib. |
| 1591 | 3046 | 1591 | 2801 | 1604.1 | 6992 | 1602.7 | 3887 | |
| α-NiPc | β-NiPc | α-CuPc | β-CuPc | |
|---|---|---|---|---|
| d (nm) | 37 ± 1 | 45 ± 1 | 30 ± 1 | 86 ± 1 |
| (–) | 2.4 | 3.0 | 5.7 | 8.5 |
| E1 (eV) | 5.17 ± 0.04 | 5.39 ± 0.01 | 3.93 ± 0.01 | 4.66 ± 0.63 |
| E2 (eV) | 4.60 ± 0.16 | 4.05 ± 0.09 | 2.90 ± 0.02 | 4.02 ± 0.07 |
| E3 (eV) | 4.03 ± 0.05 | 4.00 ± 0.97 | 2.46 ± 0.03 | 3.65 ± 0.01 |
| E4 (eV) | 3.71 ± 0.02 | 3.64 ± 0.03 | 2.31 ± 0.01 | 3.26 ± 0.04 |
| E5 (eV) | 3.09 ± 0.08 | 3.23 ± 0.03 | 1.97 ± 0.01 | 2.81 ± 0.06 |
| E6 (eV) | 2.60 ± 0.05 | 2.83 ± 0.04 | 1.80 ± 0.01 | 2.41 ± 0.01 |
| E7 (eV) | 2.31 ± 0.02 | 2.41 ± 0.04 | 1.55 ± 0.03 | 2.15 ± 0.01 |
| E8 (eV) | 2.14 ± 0.01 | 2.04 ± 0.01 | 1.08 ± 0.52 | 1.83 ± 0.05 |
| E9 (eV) | 2.00 ± 0.02 | 1.90 ± 0.12 | - | 1.25 ± 0.32 |
| E10 (eV) | 1.91 ± 0.31 | 1.79 ± 0.34 | - | - |
| E11 (eV) | 1.74 ± 0.38 | 1.42 ± 0.74 | - | - |
| E12 (eV) | 1.28 ± 0.96 | 1.40 ± 0.01 | - | - |
Publisher’s Note: MDPI stays neutral with regard to jurisdictional claims in published maps and institutional affiliations. |
© 2022 by the authors. Licensee MDPI, Basel, Switzerland. This article is an open access article distributed under the terms and conditions of the Creative Commons Attribution (CC BY) license (https://creativecommons.org/licenses/by/4.0/).
Share and Cite
Popielarski, P.; Mosińska, L.; Skowronski, L.; Szczesny, R.; Figà, V.; Naparty, M.; Derkowska-Zielinska, B. Influence of Heat Treatment on Surface, Structural and Optical Properties of Nickel and Copper Phthalocyanines Thin Films. Int. J. Mol. Sci. 2022, 23, 11055. https://doi.org/10.3390/ijms231911055
Popielarski P, Mosińska L, Skowronski L, Szczesny R, Figà V, Naparty M, Derkowska-Zielinska B. Influence of Heat Treatment on Surface, Structural and Optical Properties of Nickel and Copper Phthalocyanines Thin Films. International Journal of Molecular Sciences. 2022; 23(19):11055. https://doi.org/10.3390/ijms231911055
Chicago/Turabian StylePopielarski, Pawel, Lidia Mosińska, Lukasz Skowronski, Robert Szczesny, Viviana Figà, Mieczyslaw Naparty, and Beata Derkowska-Zielinska. 2022. "Influence of Heat Treatment on Surface, Structural and Optical Properties of Nickel and Copper Phthalocyanines Thin Films" International Journal of Molecular Sciences 23, no. 19: 11055. https://doi.org/10.3390/ijms231911055
APA StylePopielarski, P., Mosińska, L., Skowronski, L., Szczesny, R., Figà, V., Naparty, M., & Derkowska-Zielinska, B. (2022). Influence of Heat Treatment on Surface, Structural and Optical Properties of Nickel and Copper Phthalocyanines Thin Films. International Journal of Molecular Sciences, 23(19), 11055. https://doi.org/10.3390/ijms231911055