Article

Investigation of Transcriptome Patterns in Endometrial Cancers from Obese and Lean Women

1
School of Biotechnology and Biomolecular Sciences, University of New South Wales, Sydney, NSW 2052, Australia
2
Chris O’Brien Lifehouse, Camperdown, NSW 2050, Australia
*
Author to whom correspondence should be addressed.
Int. J. Mol. Sci. 2022, 23(19), 11471; https://doi.org/10.3390/ijms231911471
Submission received: 20 July 2022 / Revised: 16 September 2022 / Accepted: 20 September 2022 / Published: 29 September 2022

Abstract

:
Endometrial cancer is the most common gynaecological malignancy in developed countries. One of the largest risk factors for endometrial cancer is obesity. The aim of this study was to determine whether there are differences in the transcriptome of endometrial cancers from obese vs. lean women. Here we investigate the transcriptome of endometrial cancer between obese and lean postmenopausal women using rRNA-depleted RNA-Seq data from endometrial cancer tissues and matched adjacent non-cancerous endometrial tissues. Differential expression analysis identified 12,484 genes (6370 up-regulated and 6114 down-regulated) in endometrial cancer tissues from obese women, and 6219 genes (3196 up-regulated and 3023 down-regulated) in endometrial cancer tissues from lean women (adjusted p-value < 0.1). A gene ontology enrichment analysis revealed that the top 1000 up-regulated genes (by adjusted p-value) were enriched for growth and proliferation pathways while the top 1000 down-regulated genes were enriched for cytoskeleton restructure networks in both obese and lean endometrial cancer tissues. In this study, we also show perturbations in the expression of protein coding genes (HIST1H2BL, HIST1H3F, HIST1H2BH, HIST1H1B, TTK, PTCHD1, ASPN, PRELP, and CDH13) and the lncRNA MBNL1-AS1 in endometrial cancer tissues. Overall, this study has identified gene expression changes that are similar and also unique to endometrial cancers from obese vs. lean women. Furthermore, some of these genes may serve as prognostic biomarkers or, possibly, therapeutic targets for endometrial cancer.

1. Introduction

Endometrial cancer (EC), an adenocarcinoma of the uterus, is the fifth most common malignancy in women and the most common gynaecological malignancy in developed countries [1] (Ferlay et al., 2015). The incidence of EC is increasing, particularly in countries undergoing rapid socioeconomic transitions [2]. The main risk factors are the length of exposure to endogenous and exogenous oestrogens, obesity, diabetes, being at an early age at menarche, nulliparity, late-onset menopause, older age, and the use of tamoxifen [3]. EC has been broadly classified into two subtypes (type I and type II) based on histological and epidemiological observations, where patients diagnosed with type II have poorer prognoses than patients diagnosed with type I tumours [4] A more recent classification system based on genomic and proteomic analysis has classified EC into four categories: POLE ultramutated, microsatellite instability hypermutated, copy-number low, and copy-number high [5].
The transcriptome is the collection of all RNA transcripts which contain messenger RNAs (mRNAs) and non-coding RNAs including microRNAs (miRNA), long non-coding RNAs (lncRNA), long intergenic non-coding RNAs (lincRNAs), circular RNAs (circRNA), and ribosomal RNA (rRNA). Next-generation sequencing (NGS) has emerged as the primary technology for the unbiased profiling of transcriptomes. RNA sequencing (RNA-Seq) is an NGS tool which uncovers the dynamic nature of the transcriptome, including but not limited to, transcript abundance and the nucleotide sequence of specific RNA transcripts. RNA-Seq has facilitated the rapid sequencing of whole transcriptomes, particularly valuable information contributing to our understanding of diseases such as cancer.
Previous transcriptomic studies have identified some of the molecular underpinnings of EC, providing an insight into its pathogenesis. As such, these findings can be translated into the clinical setting as prognostic and diagnostic biomarkers or through targeted therapies [6,7,8]. For example, one study revealed that the lncRNA taurine upregulated 1 (TUG1) was up-regulated in EC compared to its corresponding adjacent normal endometrial tissue [9]. The lncRNA-TUG1 may function as a competing endogenous RNA to regulate VEGFA levels by sponging miR-299 and miR-34a-5p. VEGFA belongs to a family of vascular endothelial growth factor and is the critical regulator in angiogenesis signalling in a variety of tumours [9]. In another study, the lncRNA colon cancer associated transcript-1 (CCAT1) was found to be over-expressed in type I EC, and the knockdown of CCAT1 decreased cell proliferation and colony formation in HEC-1B EC cells [8]. These findings suggest that lncRNA-CCAT1 may promote tumour formation in EC, supporting findings presented in other studies of various cancers [10,11,12]. Similarly, our previous study demonstrated the lincRNAs LINC01480, LINC00645, LINC00891, and LINC00702 displayed a highly specific expression for EC compared to normal endometrial tissue while also distinguishing EC from other gynaecological cancers [6]. In a separate study, three signalling pathways: LXR/RXR activation, the neuroprotective role for THOP1 in Alzheimer’s disease, and glutamate receptor signalling were found to shift from being mostly up-regulated to being down-regulated with the increasing cancer stage. As such, these pathways may play a role in cancer progression [13]. This study also demonstrated a substantial down-regulation of genes between early and advanced stage tumours with an altered expression pattern of neuronal signalling pathways and markers [13].
In the current study, we report on transcriptomic alterations in EC tissues compared with matched non-cancerous endometrial tissues from obese and lean postmenopausal women. We explored the distribution of transcript biotypes in EC and non-cancerous endometrial tissues, identified differentially expressed genes, and performed gene ontology enrichment analysis of up- and down-regulated genes (ranked by p-values). Overall, our study has identified differentially expressed histone-related genes and up-regulated gene ontology (GO) pathways related to cell growth and down-regulated GO pathways related to cytoskeletal rearrangement in EC tissues compared to adjacent non-tumour endometrial tissues. Hereon matched adjacent non-cancerous endometrial tissue will be referred to as the control tissue.

2. Results

A gene was considered expressed if it had a count per million (CPM) value of >0.1. From the cohort of obese women, there were 41,736 genes expressed across 20 EC samples and 41,232 genes expressed in 20 control tissue samples with 38,508 genes common between EC and the control tissue (Figure 1A). Protein coding genes had the most overlapped genes, with only a few uniquely expressed in EC or the control tissue (Figure 1B). The gene category ‘other’ included small non-coding RNAs (snRNA), miscRNAs, and microRNAs (miRNA) as described in the GENCODE Release 31 statistics (see Materials and Methods). Similar observations are made from the lean cohort (Figure S1).
The top 1000 genes from the obese and lean cohort, sorted by fold change, were subjected to principal component analysis (PCA). A separation between EC and the control tissue can be observed (Figure 2). Principal component 1 (PC1) captured 24.65% variance and PC2 captured 10.51% variance between EC and the control tissue. There was no obvious separation between obese and lean cohorts in the PCA.
Prior to differential expression, we applied selection criteria where each gene had to have a CPM value > 0.1 and expressed in ≥25% of the total number of samples in each cohort (obese cohort ≥ 10 samples; lean cohort ≥ 6 samples). There were 34,295 and 33,522 genes which matched these criteria in the obese and lean cohorts, respectively. In the obese cohort, differential expression analysis yielded 12,484 differentially expressed genes having adjusted the p-value of <0.1. Of these, 6370 were up-regulated and 6114 were down-regulated in EC. Up- and down-regulated genes are provided in Tables S2 and S3, respectively. A volcano plot in Figure 3A shows those differentially expressed genes with respect to EC in the obese cohort. The biotypes of each differentially expressed gene, presented in Figure 3B, indicates that 80.68% of up-regulated genes were protein-coding while 63.26% of down-regulated genes were protein coding. In contrast, only 10.19% of up-regulated genes were lncRNAs and 25.38% of down-regulated genes were lncRNAs. In the lean cohort, there were 6219 differentially expressed genes. Of these, 3196 were up-regulated and 3023 were down-regulated. The complete list of genes that were differentially expressed in the lean cohort are provided in Tables S4 and S5. A volcano plot has also been generated for the differentially expressed genes for the lean cohort (Figure S6). Similar to the obese cohort, the majority of up- and down-regulated genes were protein coding (85.7% of up-regulated and 77.87% of down-regulated), while 8.45% of up-regulated genes were lncRNAs and 15.51% of down-regulated genes were lncRNAs (Figure S6).
An independent analysis of the TCGA-UCEC data was performed on 589 samples (35 control and 554 EC) without differentiation between obese and lean. There were 23,706 genes which matched the filtering criterion of CPM > 0.1 in ≥25% of samples (148 samples). Of these, 16,474 genes were differentially expressed with 10,386 up-regulated genes and 6088 down-regulated genes in EC shown in Tables S7 and S8, respectively. There were 1958 up-regulated genes and 1679 down-regulated genes in common between TCGA-UCEC and the lean cohort. Between TCGA-UCEC and the obese cohort, there were 3634 up-regulated genes and 2759 down-regulated genes in common.
The top 10 differentially expressed genes in obesity-related EC (top five up-regulated and top five down-regulated) by the adjusted p-value were selected for visualisation (Figure 4). All five up-regulated genes are protein coding with four genes encoding histones: H2B clustered histone 13 (HIST1H2BL), H3 clustered histone 7 (HIST1H3F), H2B clustered histone 9 (HIST1H2BH), and H1.5 linker histone, cluster member (HIST1H1B). The fifth up-regulated gene selected was TTK protein kinase (TTK). Four of the selected down-regulated genes are protein coding genes including patched domain containing 1 (PTCHD1), asporin (ASPN), proline and arginine rich end leucine rich repeat protein (PRELP), and cadherin 13 (CDH13), and the fifth down-regulated transcript is MBNL1 antisense RNA 1 (MBNL1-AS1), an lncRNA.
The top 1000 up-regulated and top 1000 down-regulated protein coding genes in EC tissue from obese women were selected by the adjusted p-value for a GO enrichment analysis (Figure 5). The enrichment pathways for up-regulated genes showed the enrichment of biological processes related to chromosome segregation, nuclear division, mitotic nuclear division, organelle fission, and nuclear chromosome segregation. Down-regulated genes enrichment categories were related to extracellular matrix organisation, cell-substrate adhesion, the muscle system process, muscle contraction, and extracellular structure organisation. A full list of enrichment gene ontology categories for up-regulated and down-regulated genes, respectively, is shown in Tables S9 and S10. Similar GO pathways were enriched in the differentially expressed genes from the lean cohort (Tables S11a and S12a for up- and down-regulated genes, respectively. Figures S11b and S12b for up- and down-regulated genes respectively). Further, similar GO pathways were observed in the TCGA datasets in Tables S13a and S14a and Figures S13b and S14b for up- and down-regulated genes, respectively.
Following differential expression analysis, common genes (from all biotypes) were identified across obese and lean cohorts. Overall, there were 2727 genes that were up-regulated in both the obese and lean cohorts (p-value = 0, hypergeometric test), and 2715 genes that were down-regulated in both the lean and obese cohorts (p-value = 0, hypergeometric test), (Figure 6). However, there were more up- and down-regulated genes that were unique to EC tissues from the obese cohort (3642 up-regulated and 3399 down-regulated), compared to the lean cohort (469 up-regulated and 307 down-regulated) (Figure 6). Interestingly, there was one common gene (Clavesin 1; CLVS1) that was up-regulated in obese EC and down-regulated in lean EC. However, there were no common genes between obese down-regulated and lean up-regulated (Figure 6). A list of overlapping and unique genes is provided in Table S15.

3. Discussion

In this study, we show the alterations in gene expression in EC from a cohort of 20 obese postmenopausal women and 11 lean postmenopausal women, adding to the increasing body of research into the most common gynaecological cancer. We looked at the biotypes of genes identified across EC and the control tissue, followed by differential expression analysis and a GO enrichment analysis. Furthermore, we identified the common differentially expressed genes from the obese cohort and lean cohort. This study corroborates results from existing studies from our group and the wider scientific community.
In eukaryotes, chromatin is comprised of repeating structural units called the nucleosome core particles which are connected by ‘linker’ DNA. Each nucleosome is composed of 147 base pairs (bp) of DNA wrapped around a core of histone octamers [14]. The histone octamer is made up of a central tetramer of histones H3 and H4, flanked by two dimers of histones H2A and H2B [14]. Interestingly, four of the five top up-regulated genes selected for visualisation were histone encoding genes namely HIST1H2BL, HIST1H3F, HIST1H2BH, and HIST1H1B.
Nayak et al. reported that HIST1H2BL, along with 21 other histone variants, were significantly over-expressed in recurrent breast tumours (aromatase inhibitor-resistant) compared with the controls [15]. This study showed that the over-expression of histone variants might be important in an endocrine response in oestrogen receptor-positive breast cancer [15]. Another study found HIST1H3F to be up-regulated in breast cancer, however, this study had a small sample size to examine the levels of histone members using qPCR (7 clinical BC and 10 adjacent non-cancerous tissues) which was recognised as a limitation [16]. HIST1H3F was also identified as one of four genes in a multigene classifier for larynx carcinoma [17] and was proposed to be a novel prognostic biomarker of muscle invasive bladder cancer (MIBC) [18]. Patients whose tissues had high HIST1H3F expression levels had significantly longer overall survival than patients who had low HIST1H3F expression levels [18]. HIST1H2BH along with PLK1 might serve as a prognostic biomarker of non-small cell lung cancer patients [19]. HIST1H1B mRNA expression was significantly higher in breast cancer tissue than normal breast tissue in basal-like breast cancer (BLBC) [20]. HIST1H1B protein was also significantly higher in breast cancer tissue compared to normal breast tissue. As such it was proposed that HIST1H1B has the potential to be a therapeutic target of BLBC given its association with breast cancer aggressiveness [20].
The WGCNA R package is a collection of R functions to perform a weighted correlation network analysis (WGCNA) [21]. One function identifies sets of genes, called modules, with similar co-expression patterns. Genes within these modules that are highly connected are termed hub genes and are functionally important [21]. One study identified four hub genes BUB1B, NDC80, TPX2, and TTK which were independently associated with the prognosis of EC using a WGCNA algorithm [22]. These four genes were up-regulated in EC, in both obese and lean cohorts, in the current study. Tyrosine threonine kinase (TTK) has been shown to be up-regulated in several cancers including lung cancer, gastric cancer, and pancreatic ductal adenocarcinoma, strongly suggesting it may be critical in cell proliferation in tumours [23,24,25]. In another study, TTK was significantly up-regulated in an endometrial endometrioid carcinoma, with the knockdown of TTK inhibiting EC cell growth as well as inducing cell apoptosis in EC cell lines (AN3CA and HEC-1-B) [26].
There were 6114 down-regulated genes in EC from the obese cohort in this current study, with the top 10 (by adjusted p-value) consisting of 9 protein-coding genes and 1 lncRNA. Of the top 10, patched domain containing 1 (PTCHD1) located in the X-chromosome (Xp22.11) encodes the patched domain containing 1 protein and was the most down-regulated by fold-change. The gene is transcribed in the brain, notably in the cerebellum with deletions in this gene associated with autism spectrum disorder and intellectual disability [27]. There is limited information on PTCHD1 and its involvement in cancer. Katayama et al. identified that PTCHD1 was expressed in stromal cells from locally advanced breast cancer tumours responsive to chemotherapy [28].
A small leucine-rich proteoglycan (SLRP) is a family of macromolecules found abundantly in the ECM which functions as a structural constituent and as signalling molecule [29,30]. Belonging to this family are asporin (ASPN) and proline/arginine rich end leucine rich repeat protein (PRELP) which were identified as down-regulated in EC, in both obese and lean cohorts, in this study. Asporin (ASPN), encodes a protein found in the extracellular matrix (ECM) of cartilage [31,32]. Zhang et al. found that ASPN expression was higher in normal endometrial tissue compared to EC tissue. Additionally, the authors speculate that lncRNA CASC7 inhibits miR-26, inhibits ASPN, inhibits TGF-β, and promotes XIAP, to activate the SMAD/XIAP pathway in EC, thus improving survival and the invasiveness of endometrial cancer cells [33] PRELP protein may function as a molecule anchoring basement membranes to the underlying connective tissue [34].
Another down-regulated gene cadherin-13 (CDH13) in obese and lean cohorts, also called H-cadherin or T-cadherin, belongs to the cadherin superfamily and is a cell adhesion molecule and functions as a tumour suppressor gene [35]. The down-regulation of CDH13 may be related to tumour invasiveness in EC, as it was observed in breast cancer where cells transfected with CDH13 were less invasive [36]. Muscleblind-like 1 antisense RNA 1 (MBNL1-AS1) is an lncRNA that was also down-regulated in EC in obese and lean patients. Its down-regulation has also been observed in prostate cancer and NSCLC whereby the overexpression of MBNL1-AS1 repressed cell proliferation [37,38]. MBNL1-AS1 may function as a sponge for miR-181a-5p [37] and miR-135a-5p [38]. lncRNAs have been implicated as competing endogenous RNAs (ceRNAs), whereby these lncRNAs are able to sponge miRNAs to regulate gene expression at the post-transcription level [39].
The Jagged2 (JAG2), Aurora Kinase A (AURKA), Phosphoglycerate Kinase 1 (PGK1), and Hypoxanthine Guanine Phosphoribosyltransferase 1 (HPRT1) genes were previously shown to be up-regulated in EC compared to the control samples, with a stepwise elevation in protein expression corresponding to the cancer grade [7] In the present study, all four genes (JAG2, AURKA, PGK1, and HPRT1) were significantly up-regulated in EC tissues from obese women. These genes, except JAG2, were also up-regulated in EC from lean women. AURKA belongs to the family of serine/threonine kinases and is involved in the regulation of cell cycle progression. In another study, immunohistochemistry showed the overexpression of AURKA in EC tissues compared with control endometrial tissue, and AURKA overexpression was associated with the cancer grade [40]. The knockdown of AURKA in HEC-1B cells successfully decreased AURKA mRNA and AURKA protein [40]. These findings indicate that AURKA mRNA or protein may be suitable biomarkers and a target for EC therapy.
A previous study from our group identified that several long intergenic non-coding RNAs were differentially expressed in EC [6]. LINC00958, LINC01480, and LINC00645 were up-regulated in EC whereas LINC00891 and LINC00702 were down-regulated in the previous study, with the latter four showing a high specificity to EC as compared to the control tissue [6] This study corroborates these observations; LINC00958 and LINC00645 were both up-regulated and LINC00891 and LINC00702 were both down-regulated in the obese cohort (adjusted p-value < 0.1). Whereas in the lean cohort, LINC00958 was up-regulated and LINC00891 and LINC00702 were down-regulated. In another study, the lincRNA metastasis-associated lung adenocarcinoma transcript 1 (MALAT-1) was identified in the peripheral blood of patients with non-small cell lung cancer (NSCLC) showing different expression levels between NSCLC patients and the controls [41]. However, despite MALAT-1 displaying the characteristics of an ideal biomarker (minimally-invasive, exhibiting high specificity, and robustness), MALAT-1 was unable to discriminate between NSCLS patients and the cancer-free controls with high sensitivity. Thus, the low sensitivity of MALAT-1 would prevent it from being used as a single biomarker [41] This previous study, however, clearly demonstrates that lincRNAs can be identified in blood, and as such it is possible that lincRNAs specific for EC may be identified and used as biomarkers.
Our GO enrichment analysis of the top 1000 up-regulated genes showed that these genes are mainly involved in cell division/proliferation such as chromosome segregation, nuclear division, mitotic nuclear division, organelle fission, and nuclear chromosome segregation. The top 1000 down-regulated differentially expressed genes were associated with the rearrangement of the cytoskeleton such as extracellular matrix organisation, cell-substrate adhesion, muscle system process, muscle contraction, and extracellular structure organisation. All of these processes were also identified in the lean cohort and are known to play a clear role in cancer development and progression. In contrast, processes related to obesity were not clearly identified in these analyses.
Cervical and ovarian cancer are two other gynaecological malignancies. Several genetic and epigenetic factors associated with these cancers have been identified. For instance, HOTAIR has been correlated with cervical cancer recurrence [42,43] as well as the functional role in ovarian, endometrial, and cervical cancers [44]. The copy number and protein expression of claudin-1, CLDN1, was found to increase with the progression of cervical cancer [45]. PTEN methylation and loss of PTEN expression are early events in the development of cervical cancer [46]. In ovarian cancer, a panel of extracellular vesicle-derived circulating miRNAs may be useful for an early diagnosis [47]. Cancer antigen 125 is a protein encoded by the MUC16 gene and used in diagnostic tests [48].
In this study, we observed that obese and lean endometrial cancer tissues shared more than 2700 up- and down-regulated genes. This suggests that there is a considerable overlap in the transcriptome of lean and obese EC. However, there were also differences between the two with EC tissues from obese patients expressing over 7000 unique differentially expressed genes (3642 up- and 3399 down-regulated genes) compared with EC tissues from lean patients (469 up- and 307 down-regulated genes). These analyses indicate that many genes that are differentially expressed in EC are related to cancer development, independent of obesity. However, obesity does appear to play a role in the expression of thousands of genes in ECs from obese women. Whether these genes are regulated by obesity-related factors, such as oestrogen, or whether they impact patient prognosis is unclear and warrants further investigation.
The limitations of our study include the small number of samples for both the obese and lean cohorts. Therefore, future studies will investigate whether the differentially expressed genes are also expressed in larger cohorts, and whether these genes influence prognosis in EC. Additionally, in vitro functional studies will be conducted to determine whether altering the expression of the top up- and down-regulated genes identified in this study disrupt EC cell phenotypes such as cell proliferation, cell cycle progression, survival, and migration/invasion.
In conclusion, our study has shown the networks of genes that are dysregulated in EC tissues from obese and lean women. Our findings, along with the growing body of transcriptomic research, may contribute to the identification of diagnostic and prognostic biomarkers or therapeutic targets for this common cancer in women.

4. Materials and Methods

4.1. Endometrial Cancer and Control Tissue Samples

Women were recruited to our clinical study at the Royal Hospital for Women/Prince of Wales Private Hospital (Randwick, Sydney, Australia) with the inclusion criteria of: being 18 years or older, postmenopausal (ceased having regular periods at least 12 months prior), a BMI of >30 kg/m2 (for the obese cohort), and planned hysterectomy for EC (diagnosis of endometrioid adenocarcinoma on curettings, any grade). Consent was received from all patients prior to sample collection, and all processing and experiments were approved by the Human Research Ethics Committee (HREC) of the South Eastern Sydney Local Health District (HREC 15/339). Clinical data were recorded in a de-identified data-base and matching samples were stored at the Lowy Biobank UNSW, Sydney. Sections of benign or malignant endometrial tissue were collected under sterile conditions and immediately placed in 1 mL of Allprotect tissue reagent (Qiagen) in sterile cryovial tubes, and then stored at −80 °C until processed. The endometrial tissues were powdered and the RNA was extracted using an AllPrep DNA/RNA/Protein Mini Kit (Qiagen, Cat # 80004). For the obese cohort, the mean BMI of patients was 38.41 and mean age was 66.7 years. This study originally included 24 obese patients with EC, however, 4 patients were not included as the RNA-seq data were unavailable for the matched pair of tissues [49]. For the lean cohort, the mean BMI of the patients was 24.01 and the mean age was 70.0 years; there were 16 women with EC, however 5 patients were not included as RNA-seq data were unavailable for the matched pair of tissues. The averages provided for age and BMI exclude the samples missing their respective matched RNA-seq data.

4.2. RNA Template Preparation and Sequencing

Total RNA was subjected to ribosomal RNA (rRNA) depletion and sequencing library preparation using an Illumina TruSeq Stranded Total RNA Gold kit. Paired-end 126 bp read length sequencing was performed using an Illumina HiSeq 2500 sequencer. A total of 6.3 × 10⁹ paired-end reads were analysed from 40 tissue samples from the obese cohort (20 EC tissue samples and 20 matched adjacent non-cancerous endometrial tissue) and 22 tissue samples from the lean cohort (11 EC tissue samples and 11 matched adjacent non-cancerous endometrial tissue). Sequencing adapters were trimmed by the sequencing facility. FastQC v0.11.8 [50] was performed on the technical replicates and then the concatenated technical replicates. Concatenated technical replicates were utilised in downstream bioinformatic analyses.
The RNA-Seq data files of technical replicates for each biological sample included in this study were concatenated into a single FASTA file per biological sample. As the sequencing adapters were trimmed by the sequencing facility before being received, no trimming was required in this analysis. The samples were aligned to the UCSC hg38 reference genome with HISAT2 and annotated using StringTie. Hereon matched adjacent non-cancerous endometrial tissue will be referred to as the control tissue. Subsequent bioinformatic analysis focused on the differential linear RNA transcriptome in EC and the control tissues including the assignment of a gene biotype based on the gene classification outlined in GENCODE, a principal component analysis (PCA), differential expression analysis, and a GO enrichment analysis.

4.3. Sequence Read Alignment and Transcript Assembly

Alignment to the human reference genome (H. Sapiens UCSC hg38) was conducted using an HISAT2 v2.1.0 [51], followed by StringTie [52] to quantify the number of reads mapping to each gene in the reference annotation GENCODE v31. We then used a Python script (prepDE.py) provided with StringTie to generate a read count matrix at the gene level. Genes which had a CPM value of >0.1 were considered expressed. Genes were then classified based on their respective biotype determined by their gene classification as described by Gencode [53]; the classifications were protein-coding, lncRNA, and pseudogene, and the remaining biotypes were classified as ‘other’. Venn diagrams were produced of the biotypes across EC and the control tissue using the Python matplotlib-venn v0.11.7 package [54].

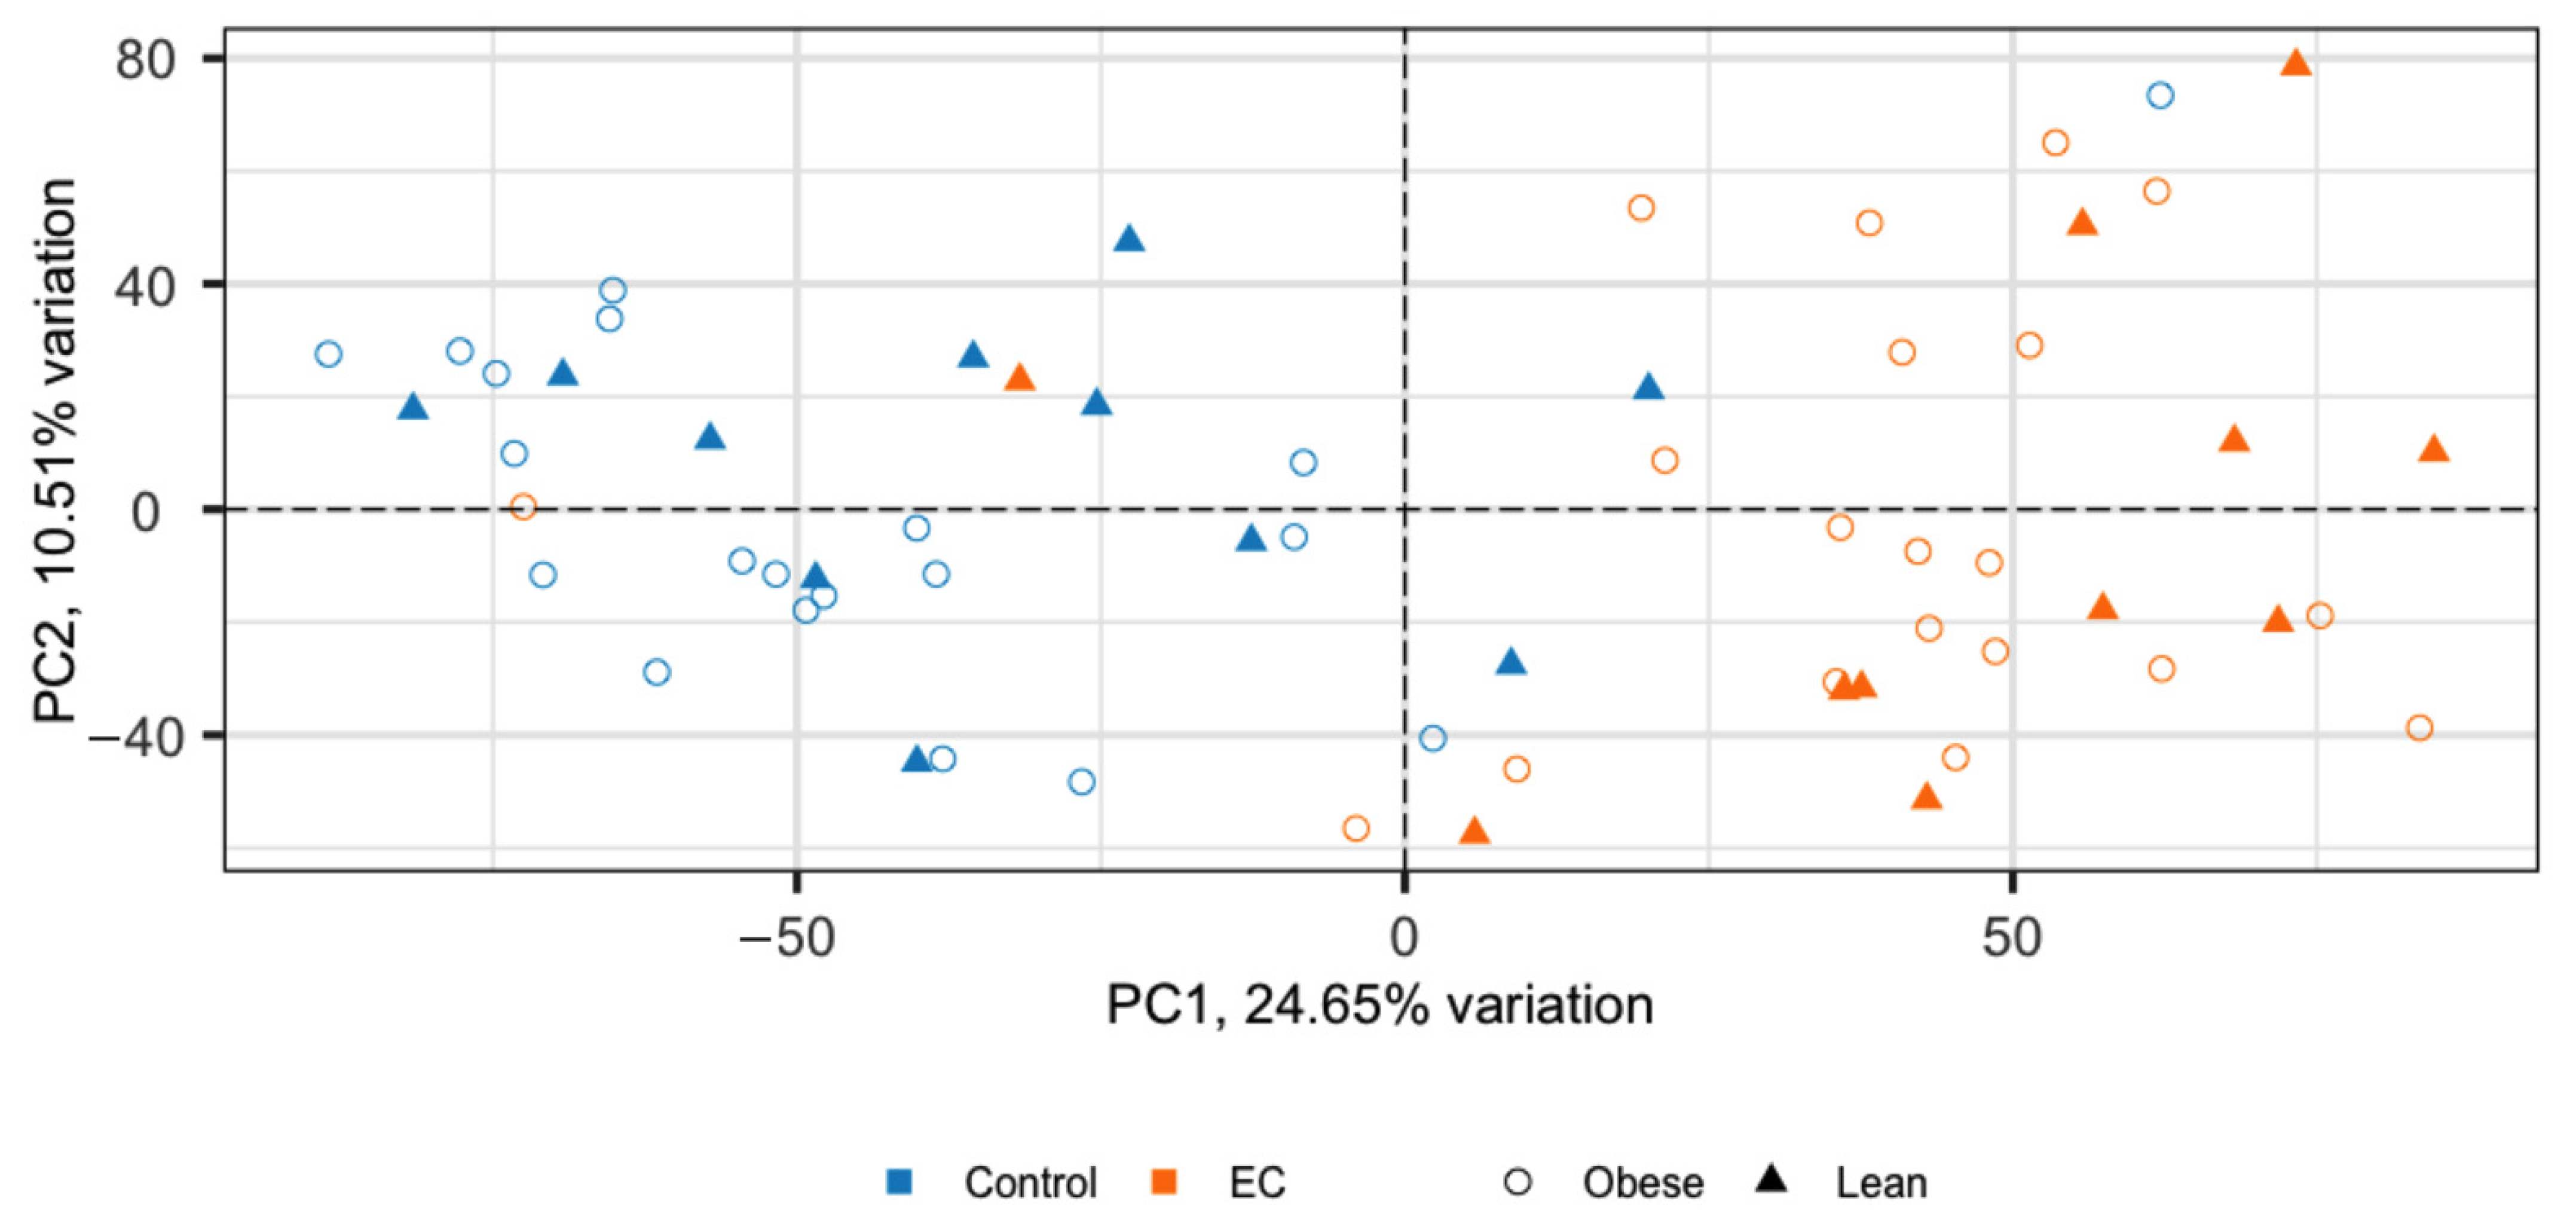
4.4. Principal Component Analysis

To visualise the variation between samples, a principal component analysis (PCA) was conducted. Genes were initially filtered with the criteria of a count per million (CPM) value of >0.1 and expressed in ≥1 samples. Subsequently, the top 1000 genes by fold change were selected and a PCA was conducted for dimensionality reduction with PCAtools v2.6.0 [55].

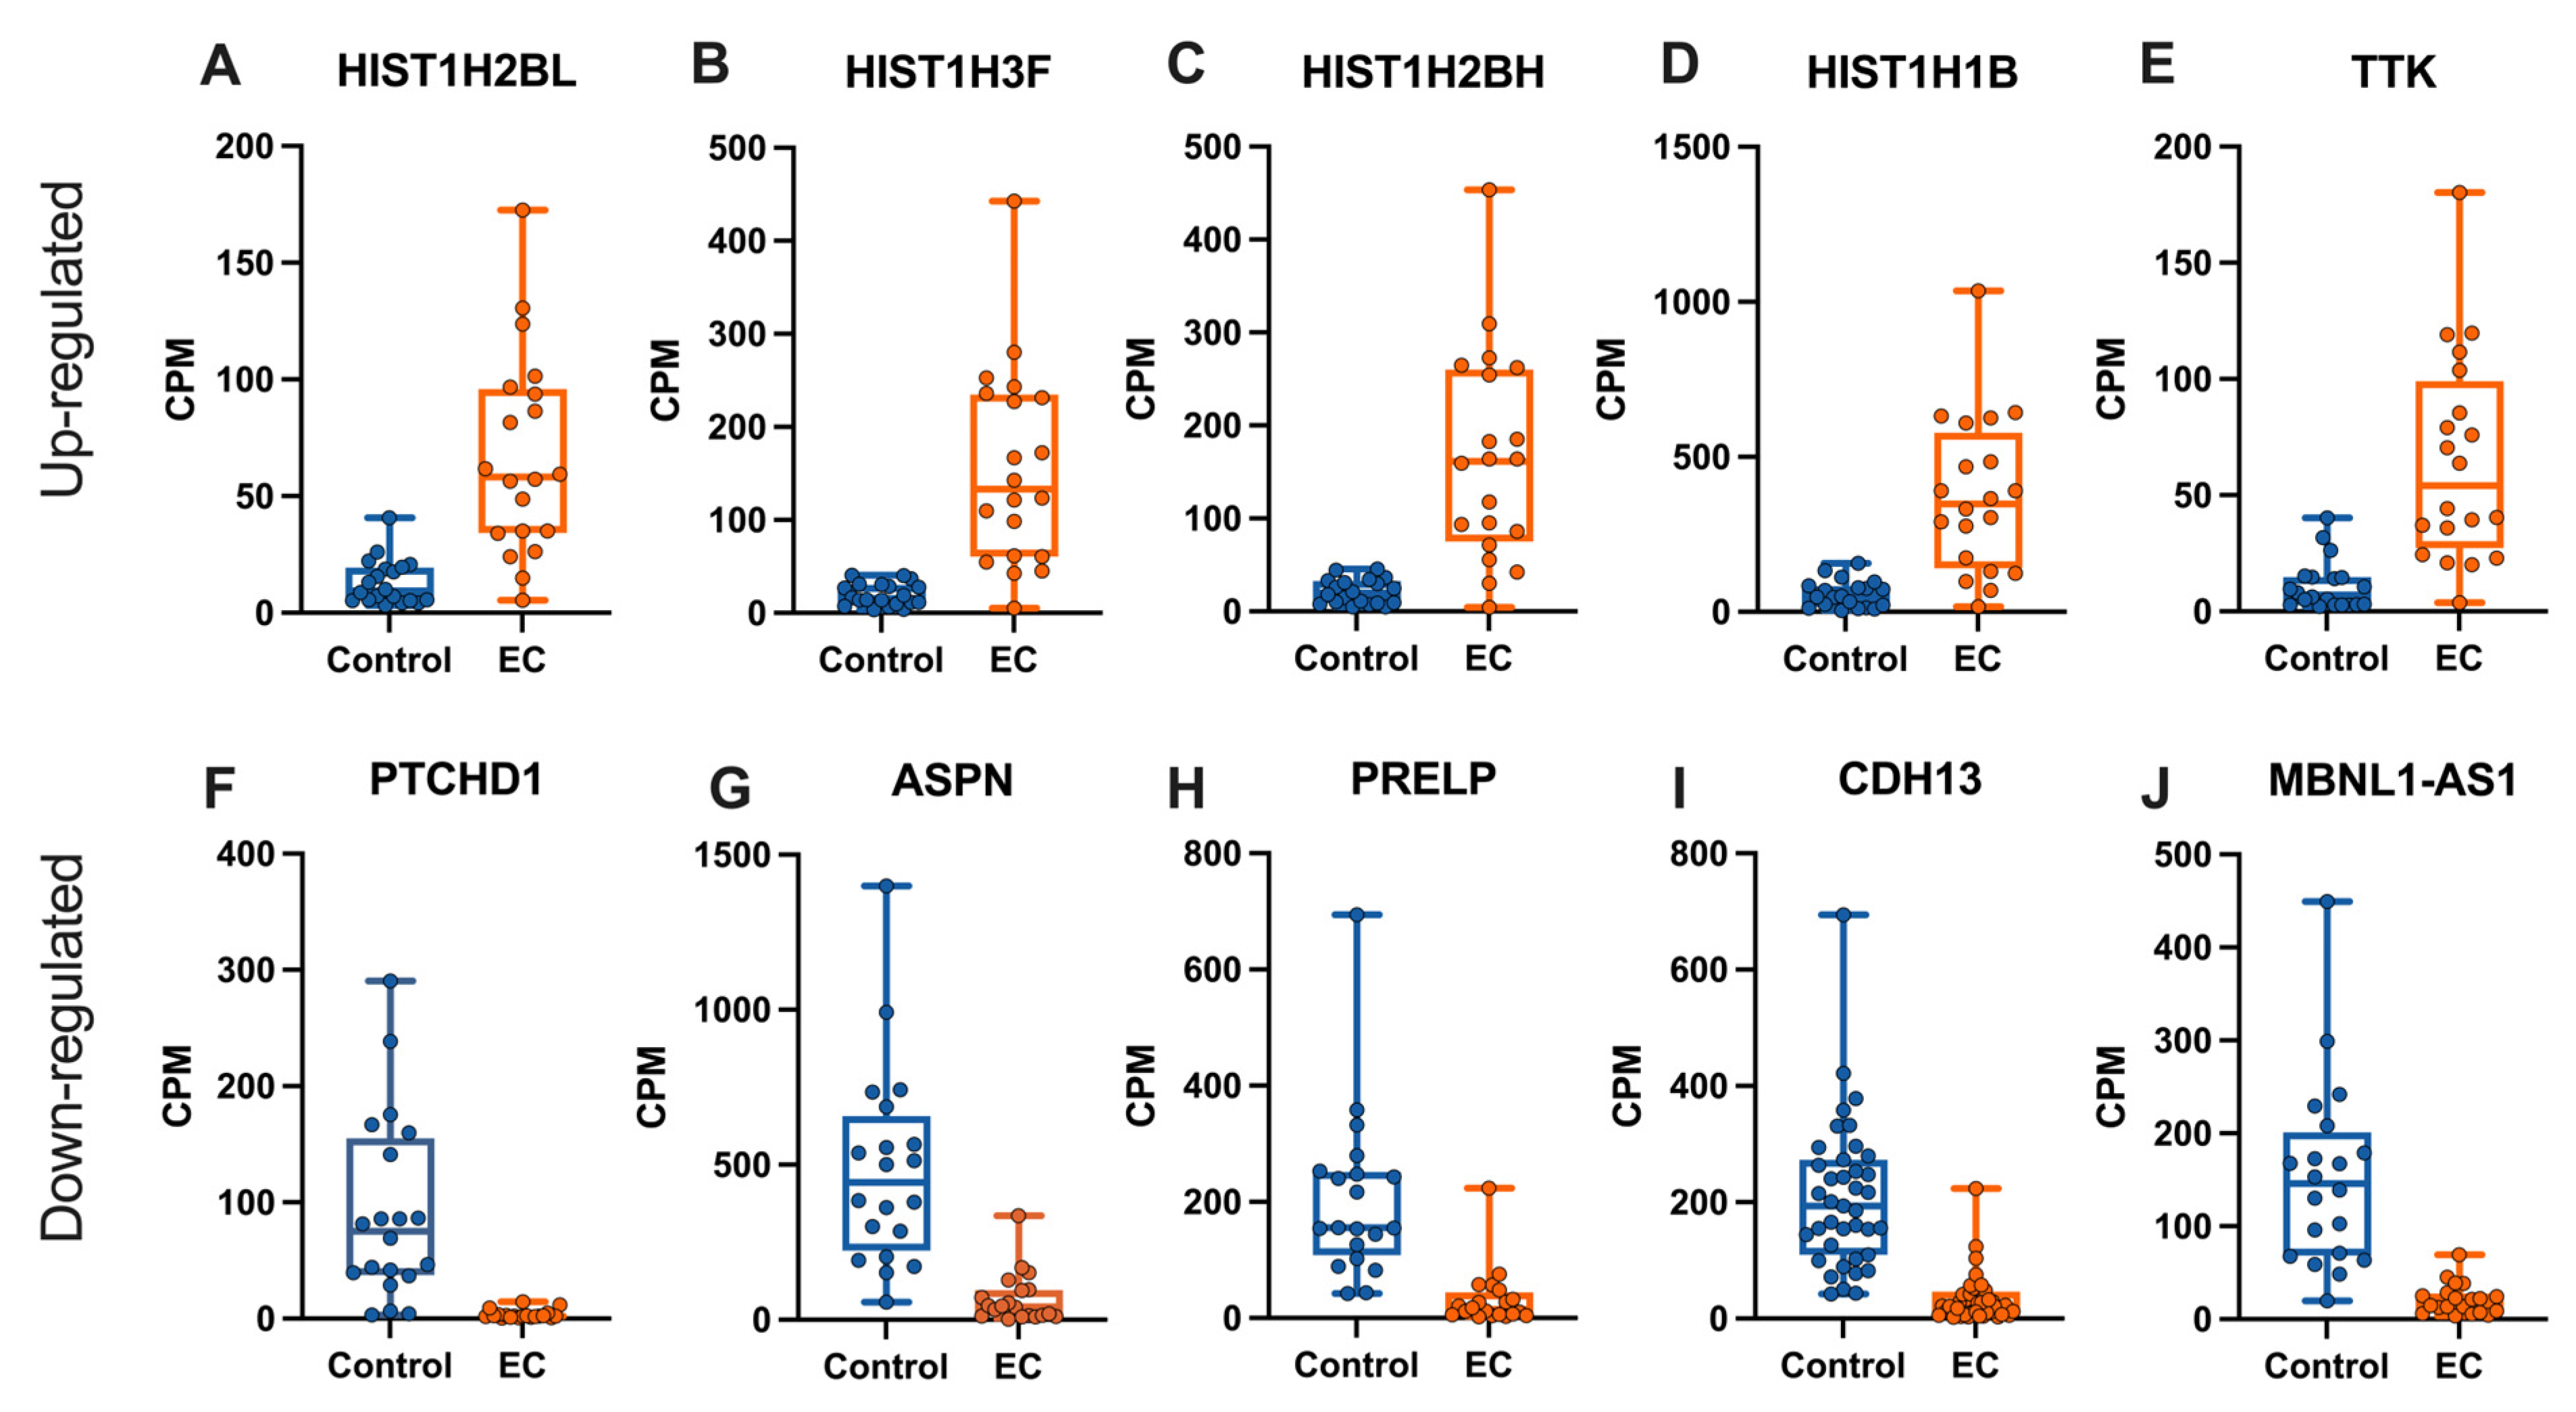
4.5. Differential Expression

Differential expression testing was based on normalised read counts, using a trimmed mean of M-values (TMM) with a generalised linear model (GLM) from the Bioconductor package edgeR [56,57]. A pairwise comparison was used as our design matrix describing the comparison between pairs and tissue type (EC and control tissue). A tag-wise dispersion estimate (estimateDisp) was then used by applying glmQLFit to fit a quasi-likelihood negative binomial generalised log-linear model to the normalised read counts of each gene. To test for statistical significance, we used glmQLFTest which uses a quasi-likelihood F-test for coefficients in the linear model. We applied the Benjamini-Hochberg method on the p-values to account for multiple testing and to control the false discovery rate (FDR). Genes were determined to be differentially expressed if the adjusted p-value was <0.1. The p-value is the probability of observing the output data under the null hypothesis.
To visualise differentially expressed genes, a volcano plot was generated with the R package ggplot2 v3.3.2 [58]. Stacked bar charts and CPM scatter and box and whisker plots were generated in GraphPad Prism v8.4.2.

4.6. Gene Ontology Enrichment Analysis

We used the top 1000 up-regulated and the top 1000 down-regulated genes (as determined by adjusted p-value) to conduct a gene ontology (GO) enrichment analysis utilising clusterProfiler [59] using the enrichGO function.

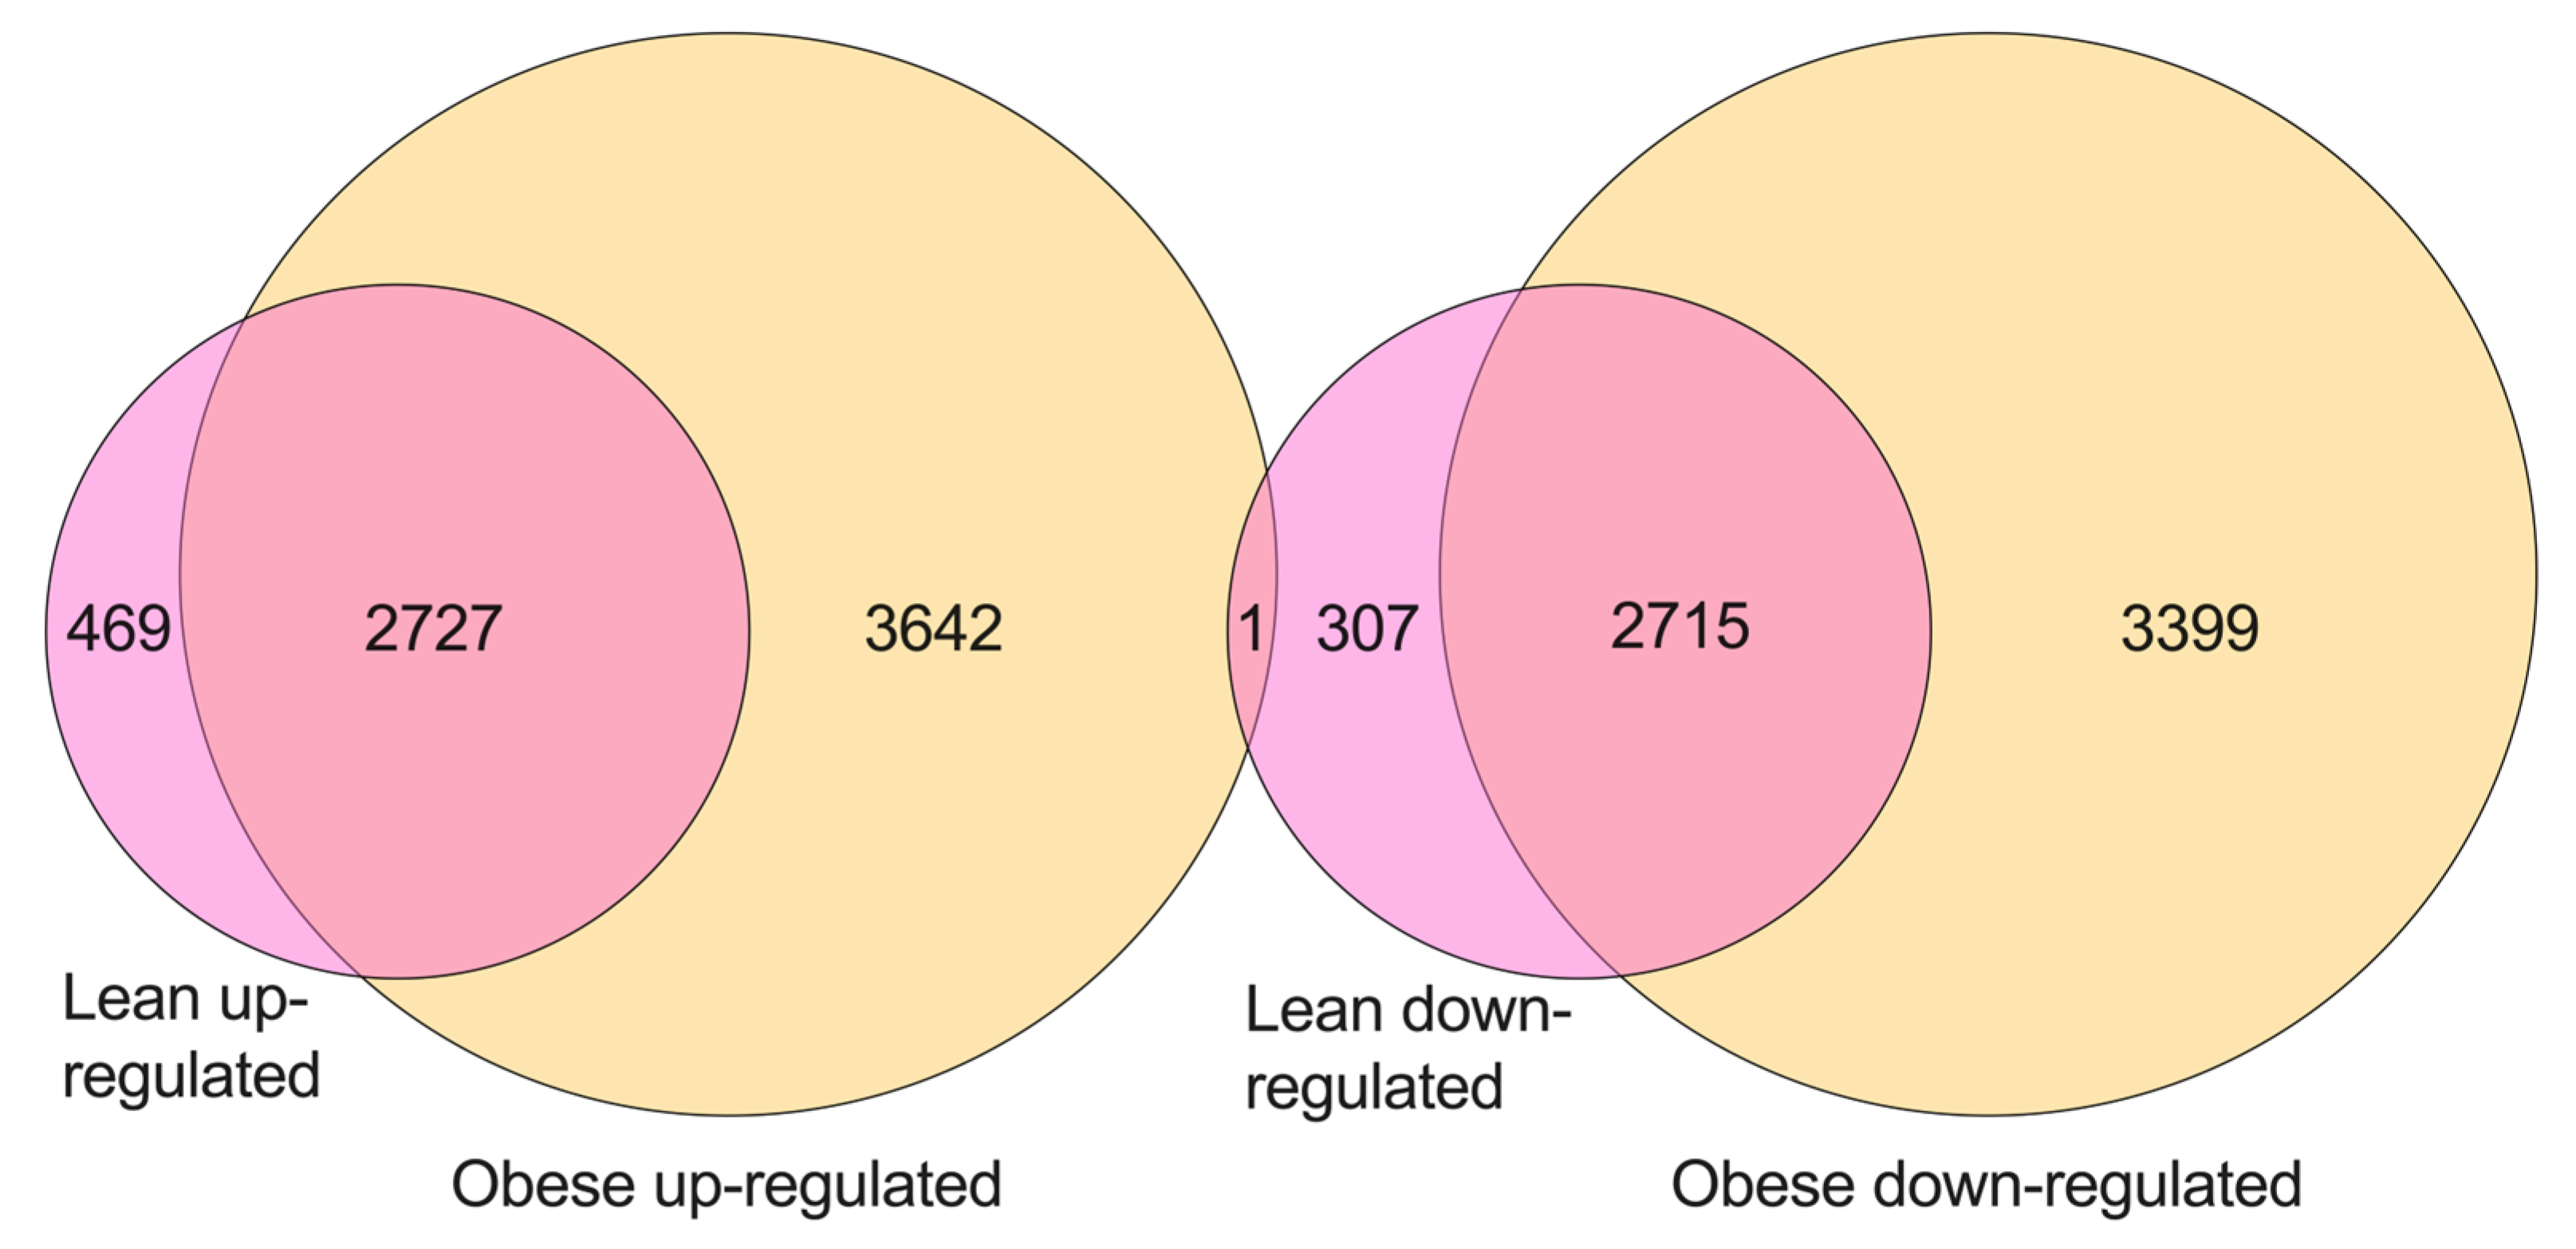
4.7. Venn Diagram for Common Differentially Expressed Genes between Lean and Obese Cohort

The set() data structure in python3 was used to identify the intersection between up- and down-regulated genes across the lean and obese cohort as well as those uniquely expressed to a particular condition (EC or control; up- or down-regulated). Venn diagrams were then drawn manually in Prism with the appropriate values for each section added to the data tables.

4.8. Hypergeometric Testing

The R phyper function was used to test the probability of observing overlapping genes by chance from up- or down-regulated genes. A p-value < 0.05 was considered significant.

4.9. Validation with the Cancer Genome Atlas (TCGA) Data

Gene expression profile data from 589 EC and control samples were downloaded from the TCGA website (https://portal.gdc.cancer.gov/projects/TCGA-UCEC accessed on 7 September 2022). Of the 589 samples, 35 were control samples and the remaining 554 samples were EC. Differential expression was performed with the edgeR ‘limma’ module with a filtration criterial of CPM > 0.1 in ≥25% of the samples (148 samples). Genes with an adjusted p-value of <0.1 were considered differentially expressed.

Supplementary Materials

The following supporting information can be downloaded at: https://www.mdpi.com/article/10.3390/ijms231911471/s1. Table S1. Venn diagrams of biotype distribution across EC and control—lean cohort. Table S2. Up-regulated genes in EC and CPM values—obese cohort. Table S3. Down-regulated genes in EC and CPM values—obese cohort. Table S4. Up-regulated genes in EC and CPM values—lean cohort. Table S5. Down-regulated genes in EC and CPM values—lean cohort. Table S6. Volcano and stacked bar chart of differentially expressed genes—lean cohort. Table S7. Up-regulated genes in EC—TCGA-UCEC. Table S8. Down-regulated genes in EC—TCGA-UCEC. Table S9. Up-regulated gene ontology enrichment analysis—obese cohort. Table S10. Down-regulated gene ontology enrichment analysis—obese cohort. Table S11a and Figure S11b. Up-regulated gene ontology enrichment analysis—lean cohort. Table S12a and Figure S12b. Down-regulated gene ontology enrichment analysis—lean cohort. Table S13a and Figure S13b. Up-regulated gene ontology enrichment analysis—TCGA-UCEC. Table S14a and Figure S14b. Down-regulated gene ontology enrichment analysis—TCGA-UCEC. Table S15. List of common and unique genes across up- and down-regulated genes—obese and lean cohort.

Author Contributions

Conceptualization, M.J. and F.L.B.; methodology, K.T. and A.C.-H.; formal analysis K.T. and A.C.-H.; resources, R.F. and E.M.O.; supervision, M.J.; funding acquisition, F.L.B.; writing—original draft preparation, K.T.; writing—review and editing, A.C.-H., R.F., F.L.B., M.J. All authors have read and agreed to the published version of the manuscript.

Funding

This research was funded by the Translational Cancer Research Network (UNSW). FLB is supported by funding from the Cancer Institute NSW (Career Development Fellowship, 2021/CDF1120).

Institutional Review Board Statement

All processing and experiments were approved by the Human Research Ethics Committee (HREC) of the South Eastern Sydney Local Health District (HREC 15/339).

Informed Consent Statement

Informed consent was obtained from all subjects involved in the study.

Data Availability Statement

The data presented in this study are available in supplementary materials.

Acknowledgments

The authors thank the study participants and staff at the Royal Hospital for Women and Prince of Wales Private Hospital (Randwick, NSW, Australia) who assisted with the procedures. We would also like to thank the Health Science Alliance (HAS) Biobank for processing and storage of samples.

Conflicts of Interest

The authors declare no conflict of interest.

References

  1. Ferlay, J.; Soerjomataram, I.; Dikshit, R.; Eser, S.; Mathers, C.; Rebelo, M.; Parkin, D.M.; Forman, D.; Bray, F. Cancer incidence and mortality worldwide: Sources, methods and major patterns in GLOBOCAN 2012. Int. J. Cancer 2015, 136, E359–E386. [Google Scholar] [CrossRef] [PubMed]
  2. Lortet-Tieulent, J.; Ferlay, J.; Bray, F.; Jemal, A. International Patterns and Trends in Endometrial Cancer Incidence, 1978–2013. JNCI J. Natl. Cancer Inst. 2017, 110, 354–361. [Google Scholar] [CrossRef] [PubMed]
  3. Morice, P.; Leary, A.; Creutzberg, C.; Abu-Rustum, N.; Darai, E. Endometrial cancer. Lancet 2016, 387, 1094–1108. [Google Scholar] [CrossRef]
  4. Bokhman, J.V. Two pathogenetic types of endometrial carcinoma. Gynecol. Oncol. 1983, 15, 10–17. [Google Scholar] [CrossRef]
  5. Levine, D.A.; Getz, G.; Gabriel, S.B.; Cibulskis, K.; Lander, E.; Sivachenko, A.; Sougnez, C.; Lawrence, M.; Kandoth, C.; Dooling, D.; et al. Integrated genomic characterization of endometrial carcinoma. Nature 2013, 497, 67–73. [Google Scholar] [CrossRef]
  6. Chen, B.J.; Byrne, F.L.; Takenaka, K.; Modesitt, S.C.; Olzomer, E.M.; Mills, J.D.; Farrell, R.; Hoehn, K.L.; Janitz, M. Transcriptome landscape of long intergenic non-coding RNAs in endometrial cancer. Gynecol. Oncol. 2017, 147, 654–662. [Google Scholar] [CrossRef]
  7. Townsend, M.H.; Ence, Z.E.; Felsted, A.M.; Parker, A.C.; Piccolo, S.R.; Robison, R.A.; O’Neill, K.L. Potential new biomarkers for endometrial cancer. Cancer Cell Int. 2019, 19, 19. [Google Scholar] [CrossRef]
  8. Treeck, O.; Skrzypczak, M.; Schüler-Toprak, S.; Weber, F.; Ortmann, O. Long non-coding RNA CCAT1 is overexpressed in endometrial cancer and regulates growth and transcriptome of endometrial adenocarcinoma cells. Int. J. Biochem. Cell Biol. 2020, 122, 105740. [Google Scholar] [CrossRef]
  9. Liu, L.; Chen, X.; Zhang, Y.; Hu, Y.; Shen, X.; Zhu, W. Long non-coding RNA TUG1 promotes endometrial cancer development via inhibiting miR-299 and miR-34a-5p. Oncotarget 2017, 8, 31386–31394. [Google Scholar] [CrossRef]
  10. You, Z.; Liu, C.; Wang, C.; Ling, Z.; Wang, Y.; Wang, Y.; Zhang, M.; Chen, S.; Xu, B.; Guan, H.A.-O.; et al. LncRNA CCAT1 Promotes Prostate Cancer Cell Proliferation by Interacting with DDX5 and MIR-28-5P. Mol. Cancer Ther. 2019, 18, 2469–2479. [Google Scholar] [CrossRef] [Green Version]
  11. Nissan, A.; Stojadinovic, A.; Mitrani-Rosenbaum, S.; Halle, D.; Grinbaum, R.; Roistacher, M.; Bochem, A.; Dayanc, B.E.; Ritter, G.; Gomceli, I.; et al. Colon cancer associated transcript-1: A novel RNA expressed in malignant and pre-malignant human tissues. Int. J. Cancer 2012, 130, 1598–1606. [Google Scholar] [CrossRef] [PubMed]
  12. Cui, B.; Li, B.; Liu, Q.; Cui, Y. lncRNA CCAT1 Promotes Glioma Tumorigenesis by Sponging miR-181b. J. Cell. Biochem. 2017, 118, 4548–4557. [Google Scholar] [CrossRef] [PubMed]
  13. Cho-Clark, M.J.; Sukumar, G.; Vidal, N.M.; Raiciulescu, S.; Oyola, M.G.; Olsen, C.; Mariño-Ramírez, L.; Dalgard, C.L.; Wu, T.J. Comparative transcriptome analysis between patient and endometrial cancer cell lines to determine common signaling pathways and markers linked to cancer progression. Oncotarget 2021, 12, 2500–2513. [Google Scholar] [CrossRef] [PubMed]
  14. Peterson, C.L.; Laniel, M.-A. Histones and histone modifications. Curr. Biol. 2004, 14, R546–R551. [Google Scholar] [CrossRef]
  15. Nayak, S.R.; Harrington, E.; Boone, D.; Hartmaier, R.; Chen, J.; Pathiraja, T.N.; Cooper, K.L.; Fine, J.L.; Sanfilippo, J.; Davidson, N.E.; et al. A Role for Histone H2B Variants in Endocrine-Resistant Breast Cancer. Horm. Cancer 2015, 6, 214–224. [Google Scholar] [CrossRef]
  16. Xie, W.; Zhang, J.; Zhong, P.; Qin, S.; Zhang, H.; Fan, X.; Yin, Y.; Liang, R.; Han, Y.; Liao, Y.; et al. Expression and potential prognostic value of histone family gene signature in breast cancer. Exp. Med. 2019, 18, 4893–4903. [Google Scholar] [CrossRef]
  17. Mirisola, V.; Mora, R.; Esposito, A.I.; Guastini, L.; Tabacchiera, F.; Paleari, L.; Amaro, A.; Angelini, G.; Dellepiane, M.; Pfeffer, U.; et al. A prognostic multigene classifier for squamous cell carcinomas of the larynx. Cancer Lett. 2011, 307, 37–46. [Google Scholar] [CrossRef]
  18. Liu, S.; Shi, J.; Liu, Y.; Wang, L.; Zhang, J.; Huang, Y.; Chen, Z.; Yang, J. Analysis of mRNA expression differences in bladder cancer metastasis based on TCGA datasets. J. Int. Med. Res. 2021, 49, 0300060521996929. [Google Scholar] [CrossRef]
  19. Zhang, Y.-Q.; Yuan, Y.; Zhang, J.; Lin, C.-Y.; Guo, J.-L.; Liu, H.-S.; Guo, Q. Evaluation of the roles and regulatory mechanisms of PD-1 target molecules in NSCLC progression. Ann. Transl. Med. 2021, 9, 1168. [Google Scholar] [CrossRef]
  20. Liao, R.; Chen, X.; Cao, Q.; Wang, Y.; Miao, Z.; Lei, X.; Jiang, Q.; Chen, J.; Wu, X.; Li, X.; et al. HIST1H1B Promotes Basal-Like Breast Cancer Progression by Modulating CSF2 Expression. Front. Oncol. 2021, 11, 780094. [Google Scholar] [CrossRef]
  21. Langfelder, P.; Horvath, S. WGCNA: An R package for weighted correlation network analysis. BMC Bioinform. 2008, 9, 559. [Google Scholar] [CrossRef] [PubMed]
  22. Huang, S.; Pang, L.; Wei, C. Identification of a Four-Gene Signature with Prognostic Significance in Endometrial Cancer Using Weighted-Gene Correlation Network Analysis. Front. Genet. 2021, 12, 678780. [Google Scholar] [CrossRef]
  23. Tsai, Y.-M.; Wu, K.-L.; Chang, Y.-Y.; Hung, J.-Y.; Chang, W.-A.; Chang, C.-Y.; Jian, S.-F.; Tsai, P.-H.; Huang, Y.-C.; Chong, I.-W.; et al. Upregulation of Thr/Tyr kinase Increases the Cancer Progression by Neurotensin and Dihydropyrimidinase-Like 3 in Lung Cancer. Int. J. Mol. Sci. 2020, 21, 1640. [Google Scholar] [CrossRef] [PubMed]
  24. Huang, H.; Yang, Y.; Zhang, W.; Liu, X.; Yang, G. TTK regulates proliferation and apoptosis of gastric cancer cells through the Akt-mTOR pathway. FEBS Open Bio 2020, 10, 1542–1549. [Google Scholar] [CrossRef] [PubMed]
  25. Kaistha, B.P.; Honstein, T.; Müller, V.; Bielak, S.; Sauer, M.; Kreider, R.; Fassan, M.; Scarpa, A.; Schmees, C.; Volkmer, H.; et al. Key role of dual specificity kinase TTK in proliferation and survival of pancreatic cancer cells. Br. J. Cancer 2014, 111, 1780–1787. [Google Scholar] [CrossRef]
  26. Zhang, J.; Jiang, Y.; Zhao, Y.; Wang, W.; Xie, Y.; Wang, H.; Yang, Y. Downregulation of tyrosine threonine kinase inhibits tumor growth via G2/M arrest in human endometrioid endometrial adenocarcinoma. Tumor Biol. 2017, 39, 1010428317712444. [Google Scholar] [CrossRef]
  27. Noor, A.; Whibley, A.; Marshall, C.R.; Gianakopoulos, P.J.; Piton, A.; Carson, A.R.; Orlic-Milacic, M.; Lionel, A.C.; Sato, D.; Pinto, D. Disruption at the PTCHD1 Locus on Xp22. 11 in Autism spectrum disorder and intellectual disability. Sci. Transl. Med. 2010, 2, 49ra68. [Google Scholar] [CrossRef]
  28. Katayama, M.L.H.; Vieira, R.A.d.C.; Andrade, V.P.; Roela, R.A.; Lima, L.G.C.A.; Kerr, L.M.; Campos, A.P.d.; Pereira, C.A.d.B.; Serio, P.A.d.M.P.; Encinas, G. Stromal cell signature associated with response to neoadjuvant chemotherapy in locally advanced breast cancer. Cells 2019, 8, 1566. [Google Scholar] [CrossRef]
  29. Kram, V.; Kilts, T.M.; Bhattacharyya, N.; Li, L.; Young, M.F. Small leucine rich proteoglycans, a novel link to osteoclastogenesis. Sci. Rep. 2017, 7, 12627. [Google Scholar] [CrossRef]
  30. Iozzo, R.V.; Schaefer, L. Proteoglycan form and function: A comprehensive nomenclature of proteoglycans. Matrix Biol. 2015, 42, 11–55. [Google Scholar] [CrossRef]
  31. Henry, S.P.; Takanosu, M.; Boyd, T.C.; Mayne, P.M.; Eberspaecher, H.; Zhou, W.; de Crombrugghe, B.; Hook, M.; Mayne, R. Expression pattern and gene characterization of asporin. a newly discovered member of the leucine-rich repeat protein family. J. Biol. Chem. 2001, 276, 12212–12221. [Google Scholar] [CrossRef] [PubMed]
  32. Lorenzo, P.; Aspberg, A.; Önnerfjord, P.; Bayliss, M.T.; Neame, P.J.; Heinegård, D. Identification and characterization of asporin: A novel member of the leucine-rich repeat protein family closely related to decorin and biglycan. J. Biol. Chem. 2001, 276, 12201–12211. [Google Scholar] [CrossRef] [PubMed]
  33. Zhang, X.; Yang, J.; Zhou, W.; Chen, Z.; Wu, W.; Zhang, S.; Wang, L. Identification of LncRNA CASC7/miR-26/ASPN/TGF-β/Smad Axis in Endometrial Cancer. Pak. J. Zool. 2022, 1–9. [Google Scholar] [CrossRef]
  34. Bengtsson, E.; Mörgelin, M.; Sasaki, T.; Timpl, R.; Heinegård, D.; Aspberg, A. The Leucine-rich Repeat Protein PRELP Binds Perlecan and Collagens and May Function as a Basement Membrane Anchor*. J. Biol. Chem. 2002, 277, 15061–15068. [Google Scholar] [CrossRef]
  35. Andreeva, A.V.; Kutuzov, M.A. Cadherin 13 in cancer. Genes Chromosomes Cancer 2010, 49, 775–790. [Google Scholar] [CrossRef]
  36. Lee, S.W.; Reimer, C.L.; Campbell, D.B.; Cheresh, P.; Duda, R.B.; Kocher, O. H-cadherin expression inhibits in vitro invasiveness and tumor formation in vivo. Carcinogenesis 1998, 19, 1157–1159. [Google Scholar] [CrossRef]
  37. Ding, X.; Xu, X.; He, X.-F.; Yuan, Y.; Chen, C.; Shen, X.-Y.; Su, S.; Chen, Z.; Xu, S.-T.; Huang, Y.-H. Muscleblind-like 1 antisense RNA 1 inhibits cell proliferation, invasion, and migration of prostate cancer by sponging miR-181a-5p and regulating PTEN/PI3K/AKT/mTOR signaling. Bioengineered 2021, 12, 803–814. [Google Scholar] [CrossRef]
  38. Cao, G.; Tan, B.; Wei, S.; Shen, W.; Wang, X.; Chu, Y.; Rong, T.; Gao, C. Down-regulation of MBNL1-AS1 contributes to tumorigenesis of NSCLC via sponging miR-135a-5p. Biomed. Pharmacother. 2020, 125, 109856. [Google Scholar] [CrossRef]
  39. Kartha, R.V.; Subramanian, S. Competing endogenous RNAs (ceRNAs): New entrants to the intricacies of gene regulation. Front. Genet. 2014, 5, 8. [Google Scholar] [CrossRef]
  40. Umene, K.; Yanokura, M.; Banno, K.; Irie, H.; Adachi, M.; Iida, M.; Nakamura, K.; Nogami, Y.; Masuda, K.; Kobayashi, Y.; et al. Aurora kinase A has a significant role as a therapeutic target and clinical biomarker in endometrial cancer. Int. J. Oncol. 2015, 46, 1498–1506. [Google Scholar] [CrossRef] [Green Version]
  41. Weber, D.G.; Johnen, G.; Casjens, S.; Bryk, O.; Pesch, B.; Jöckel, K.-H.; Kollmeier, J.; Brüning, T. Evaluation of long noncoding RNA MALAT1 as a candidate blood-based biomarker for the diagnosis of non-small cell lung cancer. BMC Res. Notes 2013, 6, 518. [Google Scholar] [CrossRef] [PubMed]
  42. Adiga, D.; Eswaran, S.; Pandey, D.; Sharan, K.; Kabekkodu, S.P. Molecular landscape of recurrent cervical cancer. Crit. Rev. Oncol./Hematol. 2021, 157, 103178. [Google Scholar] [CrossRef] [PubMed]
  43. Weng, S.-L.; Wu, W.-J.; Hsiao, Y.-H.; Yang, S.-F.; Hsu, C.-F.; Wang, P.-H. Significant association of long non-coding RNAs HOTAIR genetic polymorphisms with cancer recurrence and patient survival in patients with uterine cervical cancer. Int. J. Med. Sci. 2018, 15, 1312. [Google Scholar] [CrossRef] [PubMed]
  44. Li, J.; Wang, J.; Zhong, Y.; Guo, R.; Chu, D.; Qiu, H.; Yuan, Z. HOTAIR: A key regulator in gynecologic cancers. Cancer Cell Int. 2017, 17, 65. [Google Scholar] [CrossRef] [PubMed]
  45. Zhang, W.-n.; Li, W.; Wang, X.-l.; Hu, Z.; Zhu, D.; Ding, W.-c.; Liu, D.; Li, K.-z.; Ma, D.; Wang, H. CLDN1 expression in cervical cancer cells is related to tumor invasion and metastasis. Oncotarget 2016, 7, 87449. [Google Scholar] [CrossRef] [PubMed]
  46. Cheung, T.-H.; Lo, K.W.-K.; Yim, S.-F.; Chan, L.K.-Y.; Heung, M.-S.; Chan, C.-S.; Cheung, A.Y.-K.; Chung, T.K.-H.; Wong, Y.-F. Epigenetic and genetic alternation of PTEN in cervical neoplasm. Gynecol. Oncol. 2004, 93, 621–627. [Google Scholar] [CrossRef]
  47. Lucidi, A.; Buca, D.; Ronsini, C.; Tinari, S.; Bologna, G.; Buca, D.; Leombroni, M.; Liberati, M.; D’antonio, F.; Scambia, G. Role of extracellular vesicles in epithelial ovarian cancer: A systematic review. Int. J. Mol. Sci. 2020, 21, 8762. [Google Scholar] [CrossRef]
  48. Atallah, G.A.; Aziz, N.H.A.; Teik, C.K.; Shafiee, M.N.; Kampan, N.C. New predictive biomarkers for ovarian cancer. Diagnostics 2021, 11, 465. [Google Scholar] [CrossRef]
  49. Kaakoush, N.O.; Olzomer, E.M.; Kosasih, M.; Martin, A.R.; Fargah, F.; Lambie, N.; Susic, D.; Hoehn, K.A.-O.; Farrell, R.A.-O.; Byrne, F.A.-O. Differences in the Active Endometrial Microbiota across Body Weight and Cancer in Humans and Mice. Cancers 2022, 14, 2141. [Google Scholar] [CrossRef]
  50. Andrews, S. FastQC: A Quality Control Tool for High Throughput Sequence Data; Babraham Bioinformatics; Babraham Institute: Cambridge, UK, 2010. [Google Scholar]
  51. Kim, D.; Langmead, B.; Salzberg, S.L. HISAT: A fast spliced aligner with low memory requirements. Nat. Methods 2015, 12, 357–360. [Google Scholar] [CrossRef] [Green Version]
  52. Pertea, M.; Pertea, G.M.; Antonescu, C.M.; Chang, T.-C.; Mendell, J.T.; Salzberg, S.L. StringTie enables improved reconstruction of a transcriptome from RNA-seq reads. Nat. Biotechnol. 2015, 33, 290–295. [Google Scholar] [CrossRef] [PubMed]
  53. GENCODE. Statistics about the GENCODE Release 31. Available online: https://www.gencodegenes.org/human/stats_31.html (accessed on 2 July 2022).
  54. matplotlib-venn. matplotlib-venn. Available online: https://pypi.org/project/matplotlib-venn/ (accessed on 25 June 2022).
  55. Blighe, K.; Lun, A.; Blighe, K.; Lun, A. PCAtools: Everything Principal Components Analysis. R Package Version 2.6.0. 2021. Available online: https://github.com/kevinblighe/PCAtools (accessed on 10 August 2022).
  56. Robinson, M.D.; McCarthy, D.J.; Smyth, G.K. edgeR: A Bioconductor package for differential expression analysis of digital gene expression data. Bioinformatics 2009, 26, 139–140. [Google Scholar] [CrossRef] [PubMed]
  57. McCarthy, D.J.; Chen, Y.; Smyth, G.K. Differential expression analysis of multifactor RNA-Seq experiments with respect to biological variation. Nucleic Acids Res. 2012, 40, 4288–4297. [Google Scholar] [CrossRef] [PubMed]
  58. Wickham, H. ggplot2: Elegant Graphics for Data Analysis; Springer: New York, NY, USA, 2016. [Google Scholar]
  59. Yu, G.; Wang, L.-G.; Han, Y.; He, Q.-Y. clusterProfiler: An R Package for Comparing Biological Themes Among Gene Clusters. OMICS J. Integr. Biol. 2012, 16, 284–287. [Google Scholar] [CrossRef] [PubMed]
Figure 1. Venn diagrams summarising genes by biotype in EC and control tissue from obese women. Presented are the (A) total genes regardless of biotype; (B) protein coding genes; (C) long non-coding (lncRNA); (D) pseudogenes; and (E) other. Numbers within Venn diagrams display the number of genes common to both EC and control (overlapping circles in yellow), unique to EC (orange), and unique to control tissue (blue).
Ijms 23 11471 g001
Figure 2. Principal component analysis (PCA) of EC and control tissue of the top 1000 most varied genes by fold-change from obese and lean women. EC samples in orange and control tissue in blue; circles represent the obese cohort and triangles represent the lean cohort.
Ijms 23 11471 g002
Figure 3. Differential expression analysis between EC and control tissues from the obese cohort. (A) Volcano plot of differentially expressed genes. The x-axis is the fold-change in gene expression between EC and control tissues and the y-axis is the log10 (adjusted p-value). Green, purple, and grey dots represent up-regulated, down-regulated, and non-differentially expressed genes in EC, respectively. (B) Stacked bar charts show the percentage of each biotype of up-regulated genes in shades of green and down-regulated genes in shades of purple.
Ijms 23 11471 g003
Figure 4. Expression patterns of selected differentially expressed gene between control and EC samples from the obese cohort. Scatter plots and box and whisker plots present expression levels in counts per million (CPM) for EC compared to control tissue with boxes denoting the interquartile range (IQR), median represented by horizontal bar within the IQR, and vertical bars indicating minimum and maximum values. (AE) Expression patterns of the top five up-regulated genes in EC and (FJ) top five down-regulated genes in EC by adjusted p-value. The y-axis shows gene expression in CPM, dots indicate the individual sample expression values for EC (blue) and control tissue (orange).
Ijms 23 11471 g004
Figure 5. Gene ontology enrichment analysis of protein coding genes in EC from obese women. (A) Top 1000 up-regulated genes by adjusted p-value. (B) Top 1000 down-regulated genes by adjusted p-value.
Ijms 23 11471 g005
Figure 6. Venn diagram of differentially expressed genes (up- and down-regulated) across obese and lean cohort of women.
Ijms 23 11471 g006
Publisher’s Note: MDPI stays neutral with regard to jurisdictional claims in published maps and institutional affiliations.

