Abstract
Thanks to the crosstalk between Na+ and Ca2+ channels, Na+ and Ca2+ homeostasis interplay in so-called excitable cells enables the generation of action potential in response to electrical stimulation. Here, we investigated the impact of persistent activation of voltage-gated Na+ (NaV) channels by neurotoxins, such as veratridine (VTD), on intracellular Ca2+ concentration ([Ca2+]i) in a model of excitable cells, the rat pituitary GH3b6 cells, in order to identify the molecular actors involved in Na+-Ca2+ homeostasis crosstalk. By combining RT-qPCR, immunoblotting, immunocytochemistry, and patch-clamp techniques, we showed that GH3b6 cells predominantly express the NaV1.3 channel subtype, which likely endorses their voltage-activated Na+ currents. Notably, these Na+ currents were blocked by ICA-121431 and activated by the β-scorpion toxin Tf2, two selective NaV1.3 channel ligands. Using Fura-2, we showed that VTD induced a [Ca2+]i increase. This effect was suppressed by the selective NaV channel blocker tetrodotoxin, as well by the selective L-type CaV channel (LTCC) blocker nifedipine. We also evidenced that crobenetine, a NaV channel blocker, abolished VTD-induced [Ca2+]i elevation, while it had no effects on LTCC. Altogether, our findings highlight a crosstalk between NaV and LTCC in GH3b6 cells, providing a new insight into the mode of action of neurotoxins.
1. Introduction
Voltage-gated Na+ (NaV) channels are key molecular components involved in the electrical-excitability properties of the so-called excitable cells, such as neurons and myocytes (i.e., they can develop action potentials in response to electrical stimulation) [1]. NaV channels constitute validated pharmacological molecular targets for a large panel of clinically used drugs, such as anti-arrhythmics, anti-convulsants, anesthetics, and analgesics [2]. They are also targeted by various natural toxins from animals, plants, and microorganisms [2,3]. In mammalian genomes, nine genes (scn1a, 2a, 3a, 4a, 5a, and scn8a, 9a, 10a, 11a) encode as many NaV channel α-subunit isoforms (NaV1.1, 1.2, 1.3, 1.4, 1.5, 1.6, 1.7, 1.8, and 1.9) [4,5]. These genes share high sequence identities and pharmacological properties among mammalian species, in particular in rodents and humans [5]. NaV channels are pharmacologically classified according to their sensitivity to tetrodotoxin (TTX). Six isoforms are highly sensitive (nanomolar range) to TTX (TTX-S): NaV1.1, 1.2, 1.3, 1.4, NaV1.6, and NaV1.7 and reciprocally three isoforms are much less sensitive and thus called resistant to TTX (TTX-R): NaV1.5, 1.8, and NaV1.9 [2,3]. These α-subunits are complex pore-forming and glycosylated membrane proteins containing all molecular determinants needed to form a rapid inactivating voltage-gated channel, highly selective to Na+ [5]. They are associated with one or two auxiliary β-subunits (NaVβ1–4), encoded by four different genes. These β-subunits play a chaperon, gating, and regulatory role for NaV channels and belong to the cell adhesion molecule family [6].
The pharmacology of NaV channels is particularly vast and complex. At least seven molecular binding sites (Sites 1–7) have been described for various neurotoxins, pyrethroids, local anesthetics, antiarrhythmics, and antiepileptics [2,7,8]. All clinically used drugs block NaV channels through binding to the so-called “local anesthetic receptor site”, within the pore. TTX and saxitoxin, two natural alkaloids, are pore-binding blockers, defining Site 1. Various neurotoxins act as activators, such as (i) veratridine (VTD) and batrachotoxin (BTX) through binding to Site 2; (ii) animal toxins (from scorpion, snake, wasp and sea anemone), which interact with Sites 3 and 4; (iii) polycylic toxins including brevetoxins (with PbTx-2) and ciguatoxins, which interact with Site 5; (iv) δ-conotoxins by binding to Site 6; and (v) pyrethroid insecticides with delthamethrin, defining Site 7 [2,7,8].
NaV channels are mainly expressed in excitable cells, such as neurons of the central nervous system (NaV1.1–3 and NaV1.6) and of the peripheral nervous system (NaV1.6, 1.7, 1.8, 1.9 and possibly 1.1), myocytes (NaV1.4), and cardiomyocytes (NaV1.5) [2]. In neurons [9,10,11,12], synaptosomes [13], and neuroblastoma cells [14,15,16,17], NaV channels could be activated by neurotoxins, such as VTD or brevetoxin (PbTx), leading to a large intracellular Ca2+ overload, as a consequence of the activation of Na+/Ca2+ exchanger reverse mode (NCX), or/and NMDA receptor or/and voltage-gated Ca2+ channels (CaV), including L-type CaV (LTCC). Besides the neurotoxicity linked to Ca2+ overload, these mechanisms reveal a close relationship between Na+ and Ca2+ homeostasis, which is crucial for the regulation of membrane excitability [11,18,19].
NaV channels are also expressed in endocrine networks, such as chromaffin cells, pancreatic β cells, and somatotropic cells in the pituitary gland, which also exhibit membrane excitability properties playing a key role in hormone release [18,20,21]. Among endocrine cells, the GH3 pituitary cell line and subclones, such as GH4C1 and GH3b6 cells, exhibit spontaneous action potentials and intracellular Ca2+ oscillations that can be modified by altering NaV channel activity [22,23]. Interestingly, these characteristics have been already used to test the effects of new toxins and drugs targeting NaV channels using electrophysiology [24,25,26] but never for a cell-based assay using fluorescent probe.
Here, we hypothesized that activation by neurotoxins of NaV channels endogenously expressed in GH3b6 cells would lead to an increase of the intracellular Ca2+ concentration ([Ca2+]i), which could be measured by a Ca2+ fluorescent probe. By combining RT-qPCR, immunoblotting and immunolocalization experiments, we showed for the first time that GH3b6 cells mainly express the NaV1.3 channel subtype and the NaVβ1 subunit. The gating and pharmacological properties of Na+ currents elicited by these cells indeed correspond to NaV1.3 channels. We demonstrated that the pharmacological activation of NaV channels induces [Ca2+]i elevation mediated by LTCC. Taken together, our data highlight a crosstalk between Ca2+ and Na+ homeostasis in GH3b6 cells and particularly between NaV1.3 and LTCC.
2. Results
2.1. GH3b6 Cells Mainly Express the NaV1.3 Channel Subtype
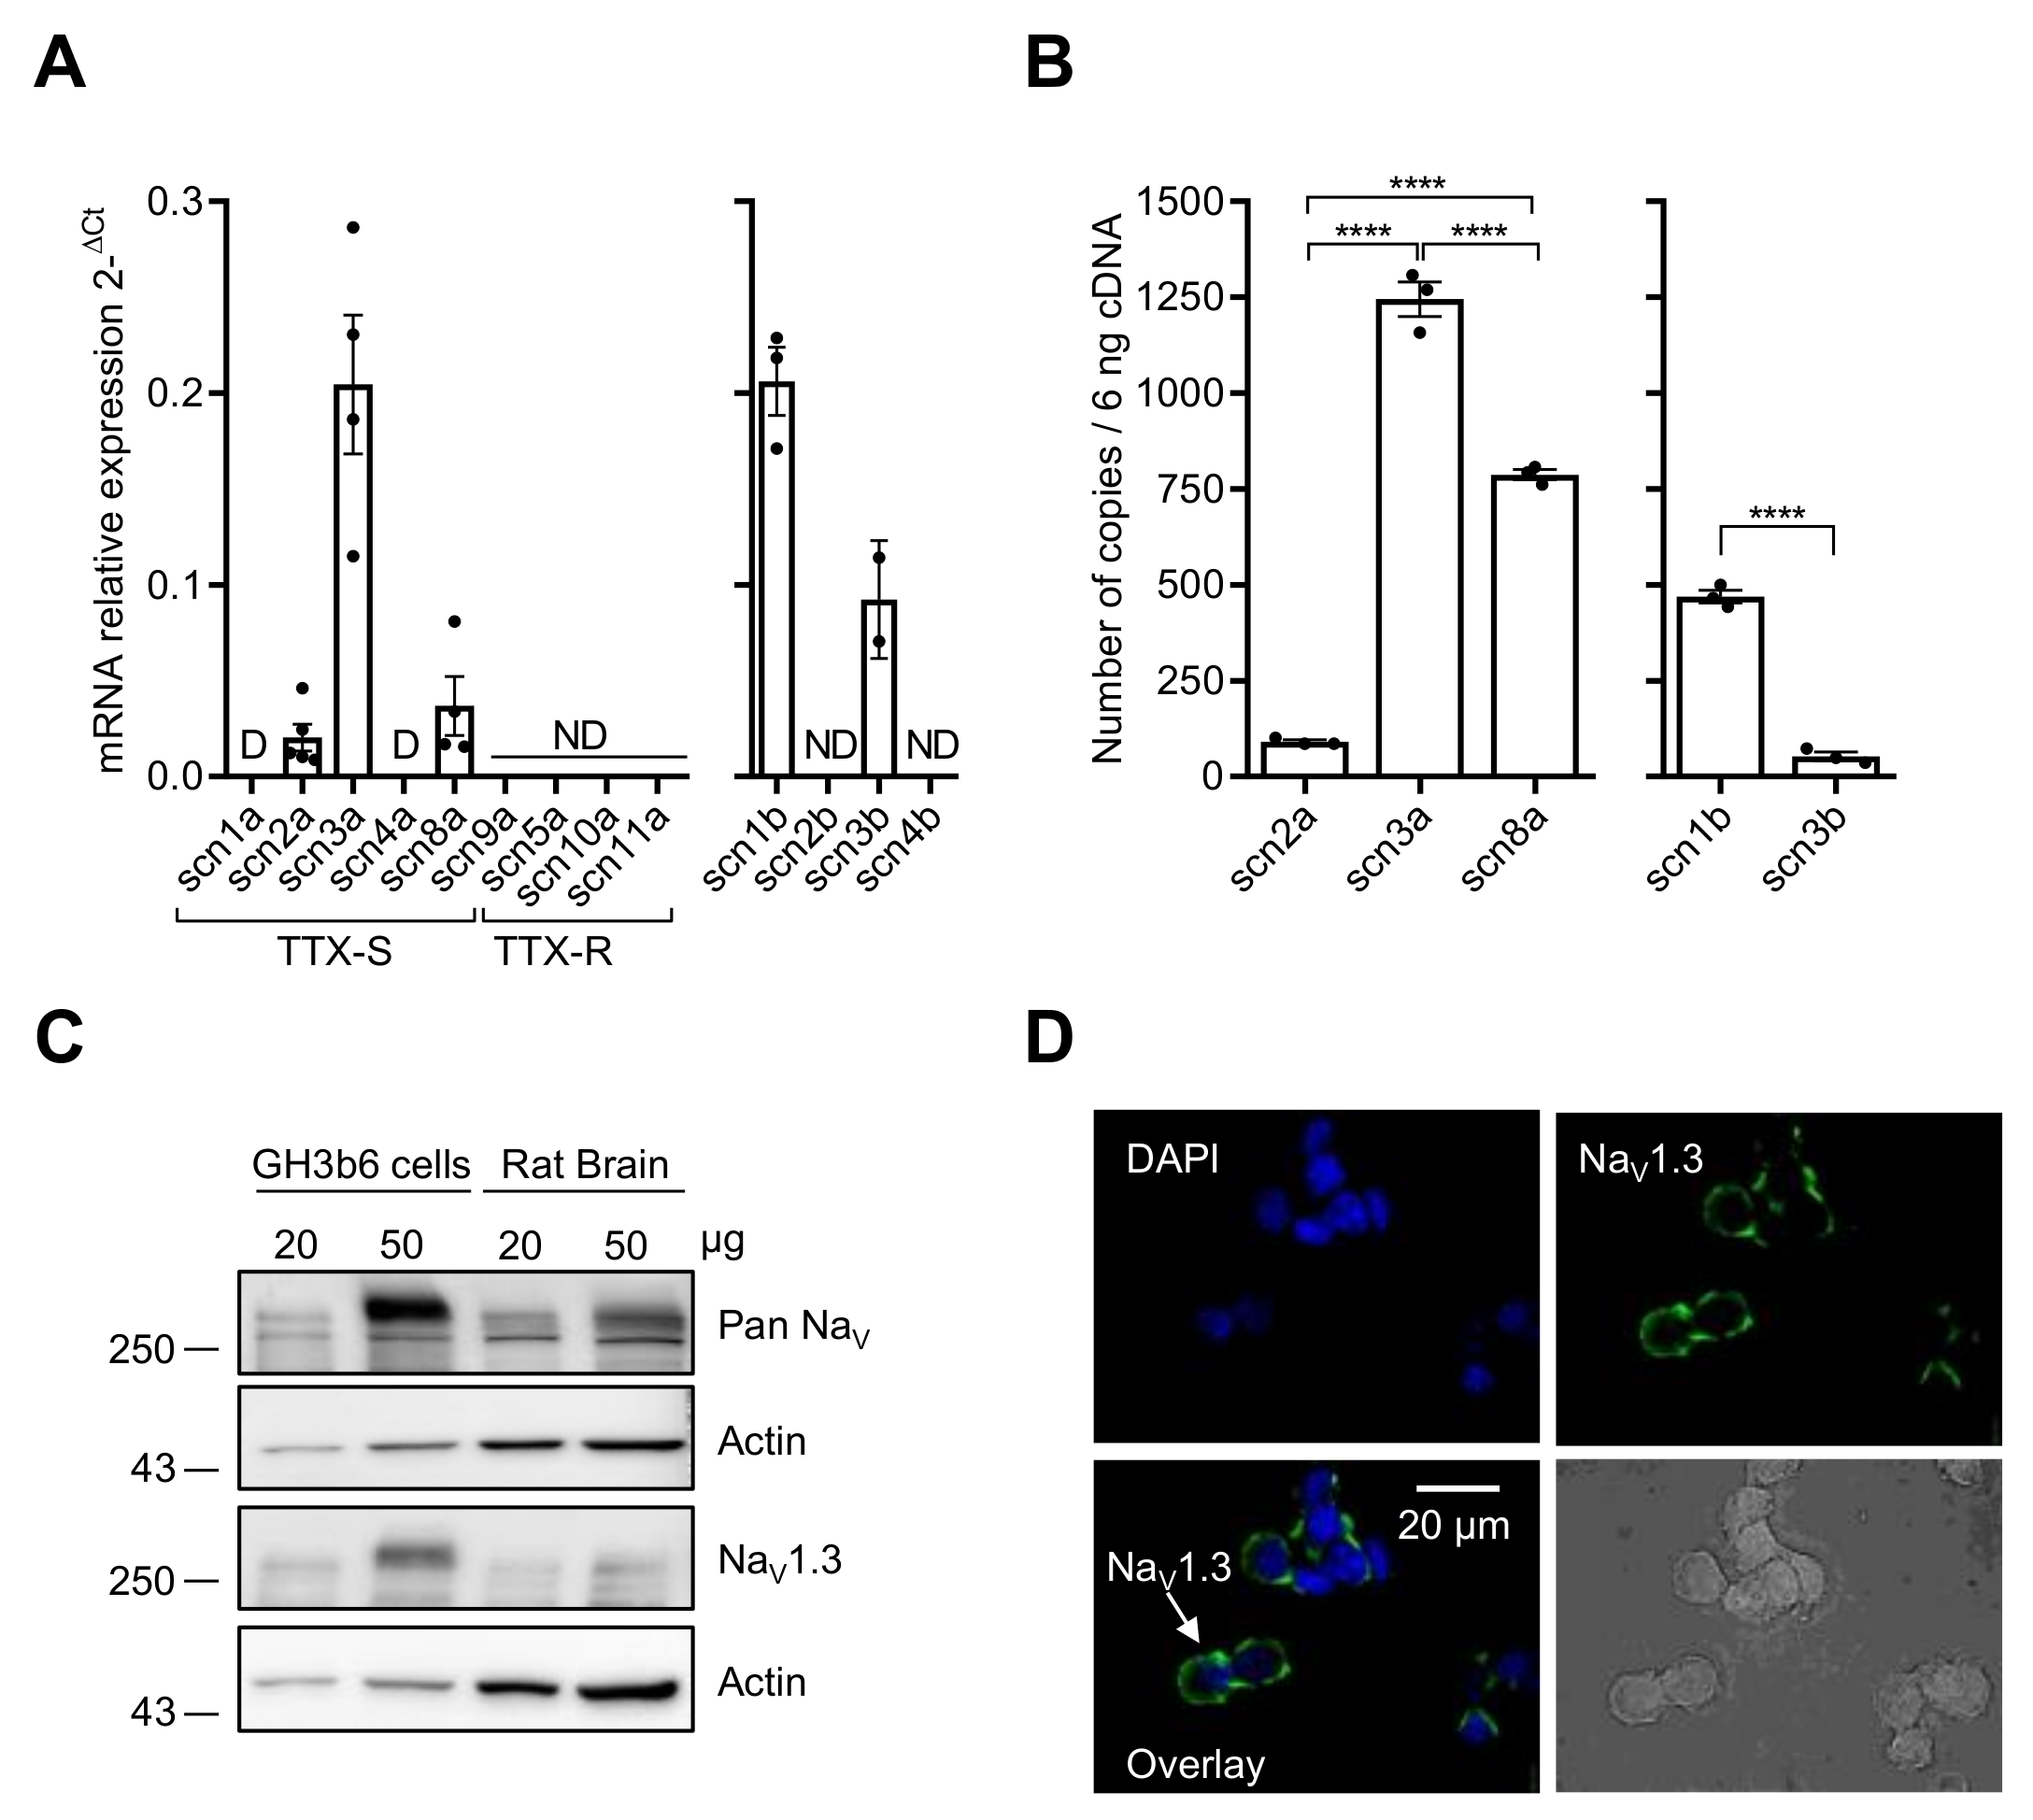
We first characterized the expression of NaV channels in GH3b6 cells by combining RT-qPCR, immunoblotting, and immunolocalization (Figure 1). Scn2a, scn3a, and scn8a cDNAs encoding three TTX-S NaV channels (NaV1.2, NaV1.3, and NaV1.6, respectively) were amplified (Figure 1A). Scn1a and scn4a cDNAs encoding NaV1.1 and NaV1.4 were also detected but at very low levels (Ct-values > 32, with 10 ng of cDNA), and thus their expression was disregarded. Absolute quantification of scn2a, scn3a, and scn8a mRNA copies showed that the transcription level of scn3a was about 13.7-fold and 1.6-fold higher than those of scn2a and scn8a, respectively (p < 0.0001, n = 3; Figure 1B). RT-qPCR experiments allowed the amplifications of scn1b and scn3b cDNAs encoding NaVβ1 and NaVβ3 subunits while scn2b and scn4b cDNAs were not detected (Figure 1A). The number of scn1b mRNA copies was 8.9-fold higher than that of scn3b (p < 0.0001, n = 3, Figure 1B).
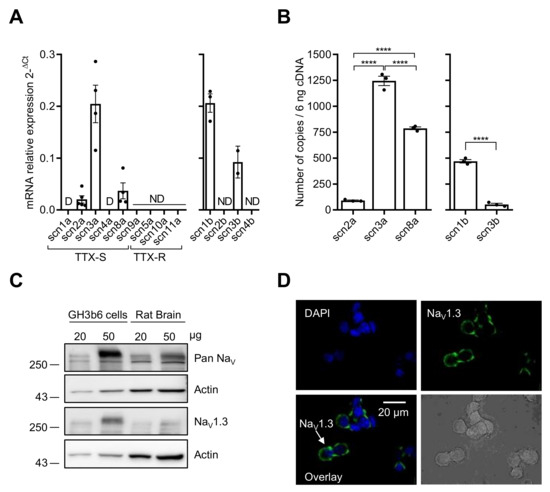
Figure 1.
NaV channel expression in GH3b6 cells. (A) The mRNA expression levels of all α and β subunits were first determined by relative RT-qPCR. (B) RT-qPCR with absolute quantification for the genes, which were detected by relative RT-qPCR. One-way ANOVA (**** p < 0.0001) followed by Tukey post-hoc multiple comparison test was performed. The data are mean ± SEM. D: Disregarded (Ct > 32); ND: Not Detected. (C) Western blot analysis of NaV channel expression. Immunoblotting was performed using pan-NaV and Nav1.3 channels antibodies with 20 and 50 µg of protein extracts from GH3b6 cells and rat brain, after separation on 8% SDS-PAGE. Actin was the loading control. (D) Immunocytolocalization of NaV1.3 channels in GH3b6 cells. Fluorescence labeling (green) using Alexa Fluor 488 anti-mouse secondary antibody allowed the detection of NaV1.3 channels at the plasma membrane. Nuclei (blue) were stained with DAPI. Original magnification ×60.
Since the detection of mRNAs encoding these NaV channel subtypes does not mandatorily reflect their expression at the protein level, we performed Western blot and immunocytochemistry analysis. The immunoblots of GH3b6 cell protein extracts showed an intense immunoreactivity for a band with an apparent molecular weight of ~250 kDa with Pan-NaV and NaV1.3 antibodies (Figure 1C). While NaV1.2 were immunodetected using protein extracts from rat brain, the Western blot with GH3b6 cell proteins did not show NaV1.2 channels at the protein level (Supplementary Figure S1). In addition, the antibodies against NaV1.6 allowed strong immunofluorescent labeling with neurons but not with GH3b6 cells (Supplementary Figure S2). The expression of the NaV1.3 channel at the plasma membrane was confirmed by fluorescent labeling with a specific monoclonal antibody (Figure 1D). Altogether, these findings showed that the NaV1.3 channel is the main NaV channel subtype expressed at the protein level in GH3b6 cells.
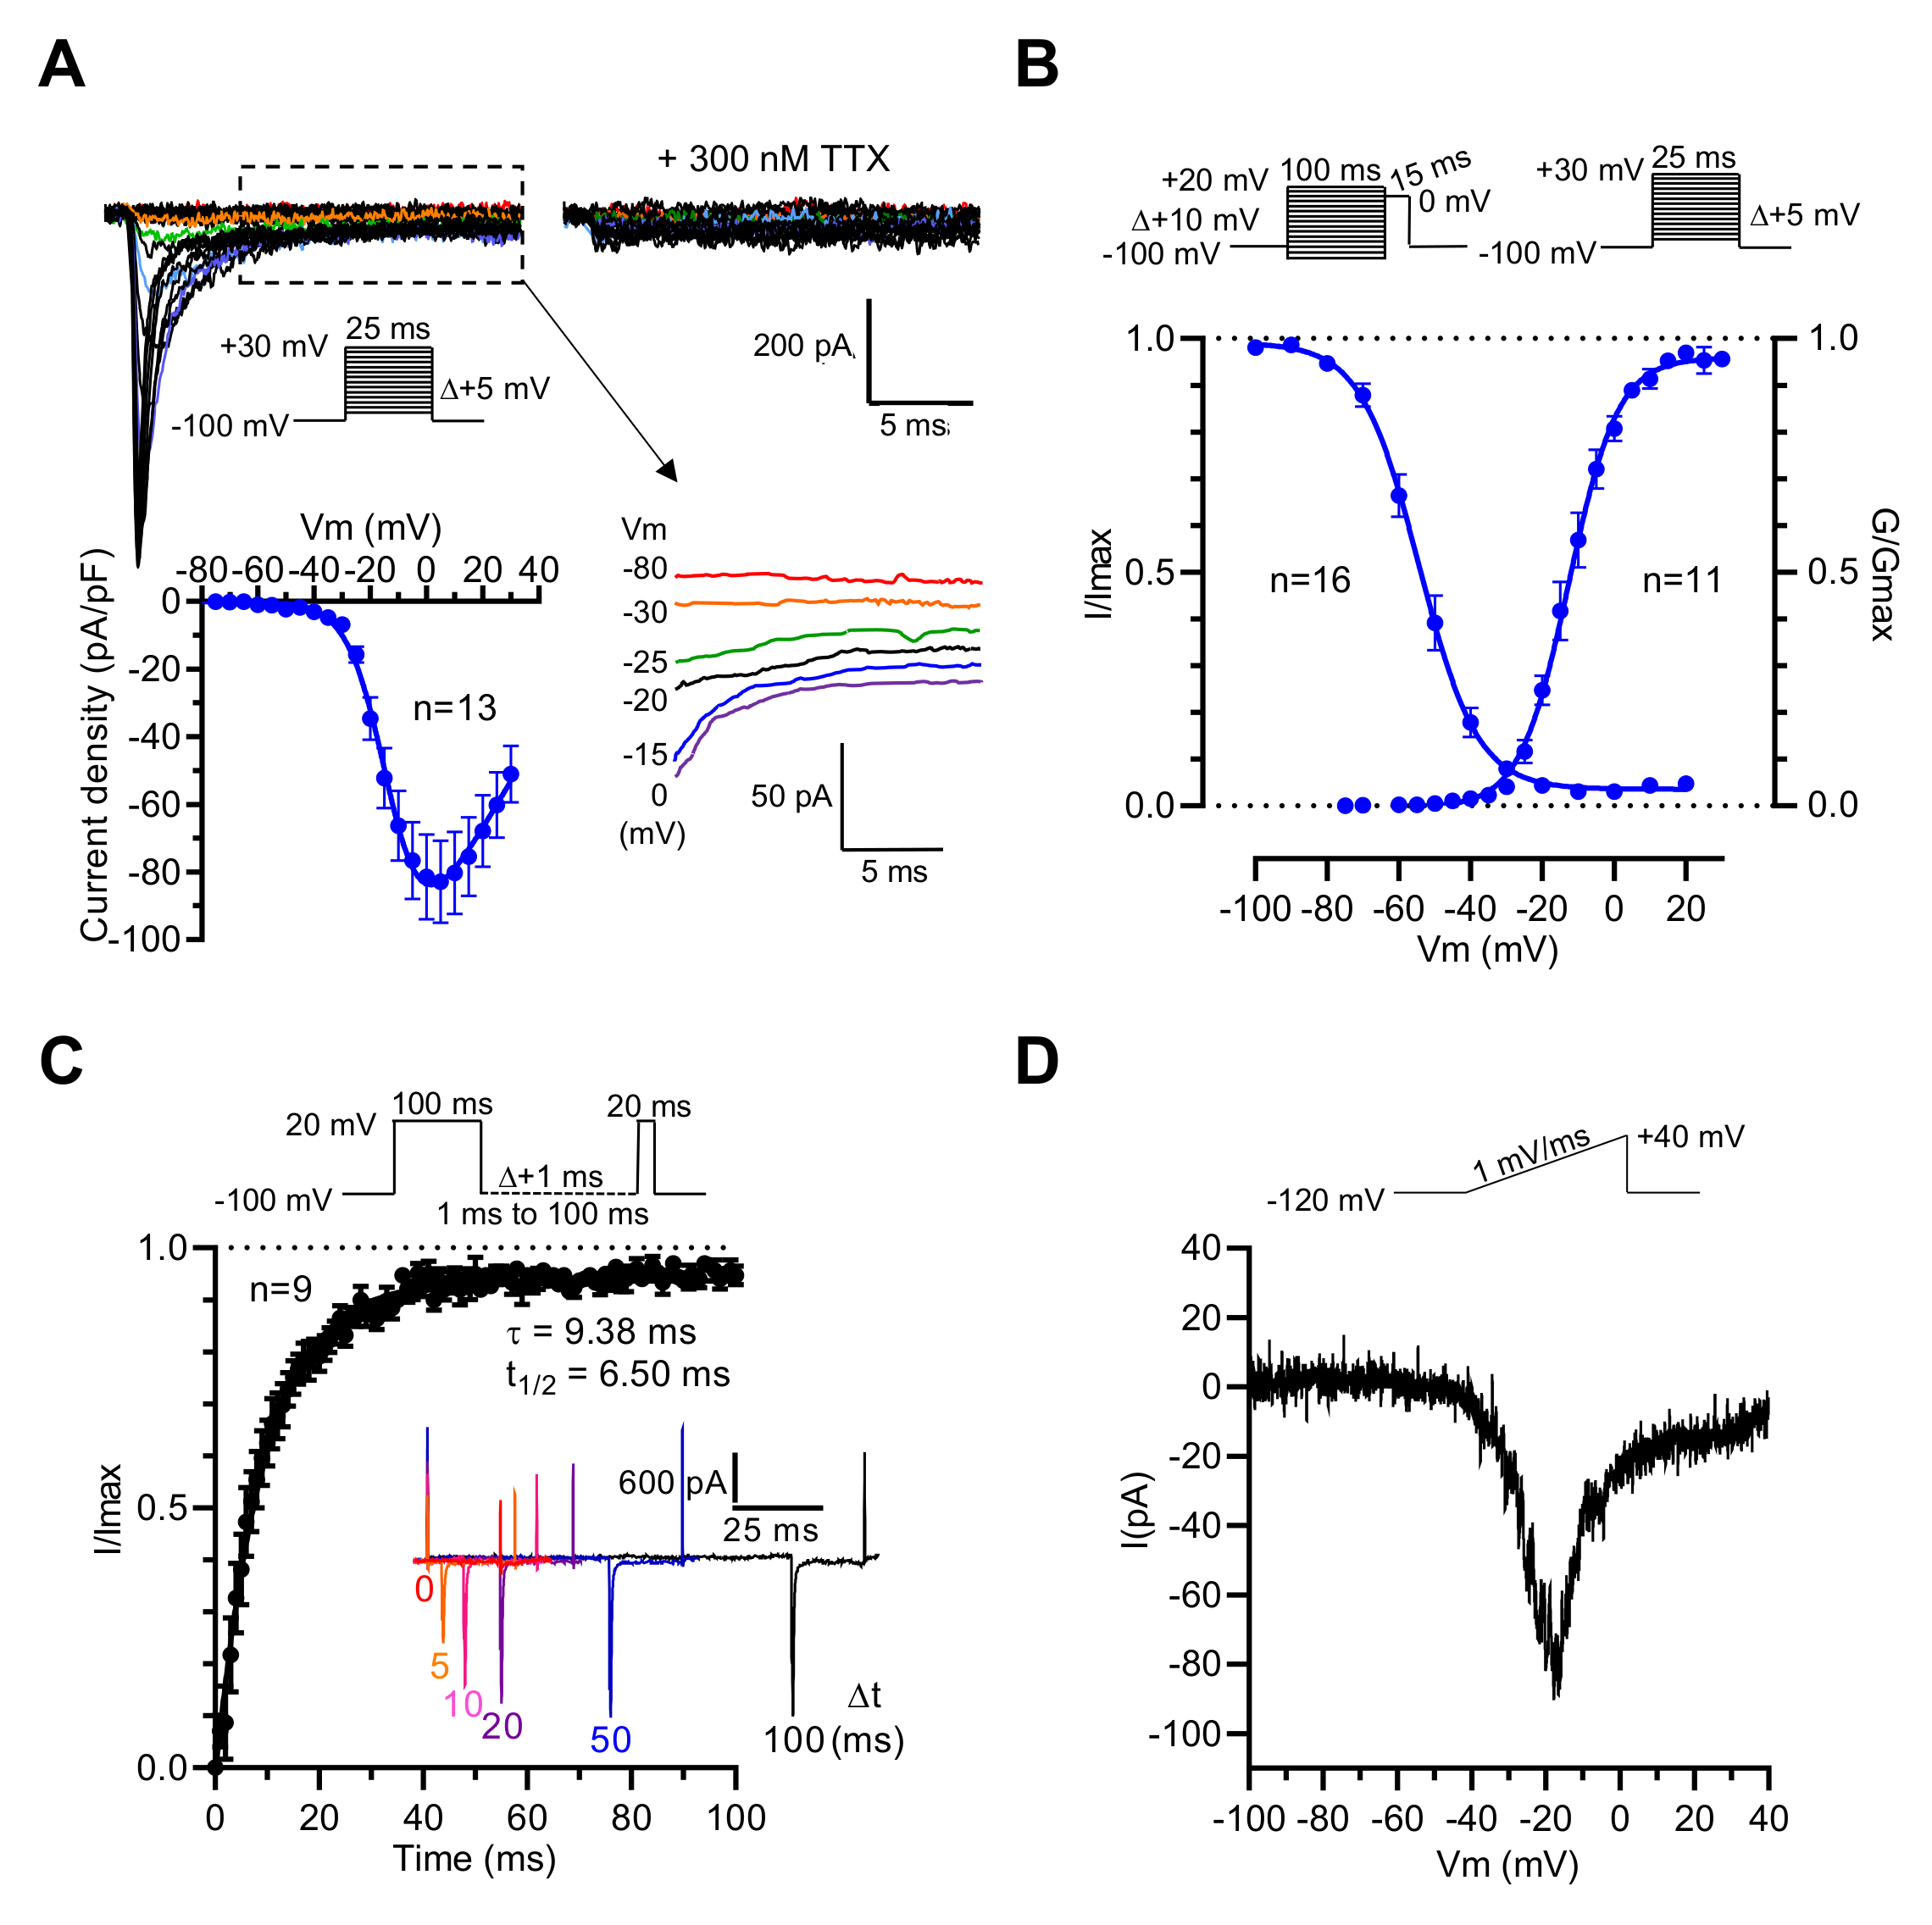
Thus, it is likely that the NaV1.3 channel subtype endorses the genesis of voltage-activated Na+ current in GH3b6 cells. To address this hypothesis, we characterized the Na+ current (INa) in GH3b6 cells by patch-clamp electrophysiology. As expected, depolarizing pulses triggered inward currents, which were blocked by a low concentration of TTX (300 nM, Figure 2A), in accordance with the presence of TTX-S NaV channels as previously described in GH3 cells [27,28]. Current–voltage relationships showed that INa activated between −45 and −40 mV, gradually increased to a maximum current density of −82.87 ± 12.17 pA/pF at −5 mV, and reversed at +58.20 ± 5.14 mV (Figure 2A). We also observed persistent currents at the end of the depolarization pulse (Figure 2A). The voltage dependence of the activation and steady-state inactivation of INa were assessed using specific voltage-clamp protocols. The normalized conductance or peak current amplitudes were plotted versus voltage and fitted to the Boltzmann equation, yielding a V1/2 of −12.23 ± 1.34 mV (n = 11) for activation, and a V1/2 of −53.58 ± 1.66 (n = 16) for inactivation (Figure 2B, Table 1). The recovery from inactivation was also examined and the analysis of the data showed that the recovery of INa is mono-exponential with a time constant of 9.38 ms. These data were in agreement with those previously reported [27,29]. Finally, to confirm that INa in GH3b6 cells are endorsed by NaV1.3 channels, we tested slow ramp depolarization stimulation (Figure 2D). Our data showed that GH3b6 cells indeed produce a ramp-triggered inward current, which is the hallmark of the NaV1.3 channel [30].
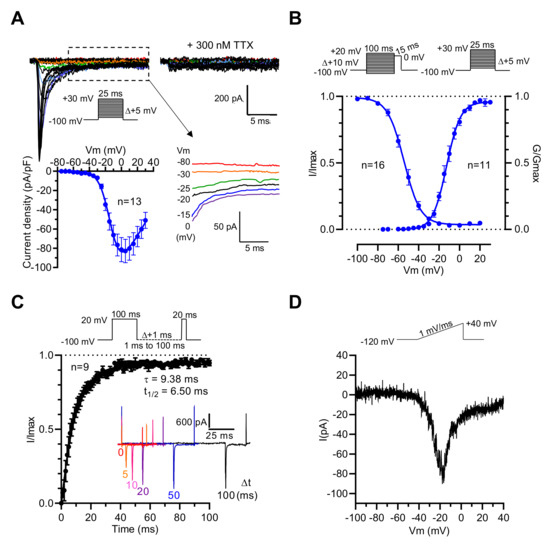
Figure 2.
Electrophysiological characterization of INa in GH3b6 cells by manual patch-clamp recording. (A) Representative family of Na+ current traces recorded in GH3b6 cells before and after the application of 300 nM TTX. The currents were elicited by stepping the membrane potential (Vm) as shown in inset. I–V relationship curve obtained by plotting the mean peak current density to Vm (n = 13). Data were fitted to the equation of Stuehmer with ENa = 58.2 ± 5.1 mV, g = 1.92 ± 1.34 nS, V1/2 = −10.39 ± 0.97 mV, and k = 7.06 ± 0.33 (n = 13). Selected traces illustrating persistent currents are shown in an enlarged view. (B) The voltage dependences of activation (circles) and inactivation (close circles). Depolarization protocols are shown in insets. Fitting was done with the Boltzmann equation as described in the “Material and Methods” section. (C) The graph shows the kinetic of recovery from inactivation at −100 mV. The data (mean ± SEM) were best fitted with a monoexponential equation. To illustrate the rate of recovery from inactivation, selected traces are shown in the inset. (D) Example of the ramp response. The current evoked during increasing the voltage ramp from −120 mV to + 40 mV during 160 ms is shown.

Table 1.
Biophysical parameters of voltage-gated Na+ currents recorded in GH3b6 cells.
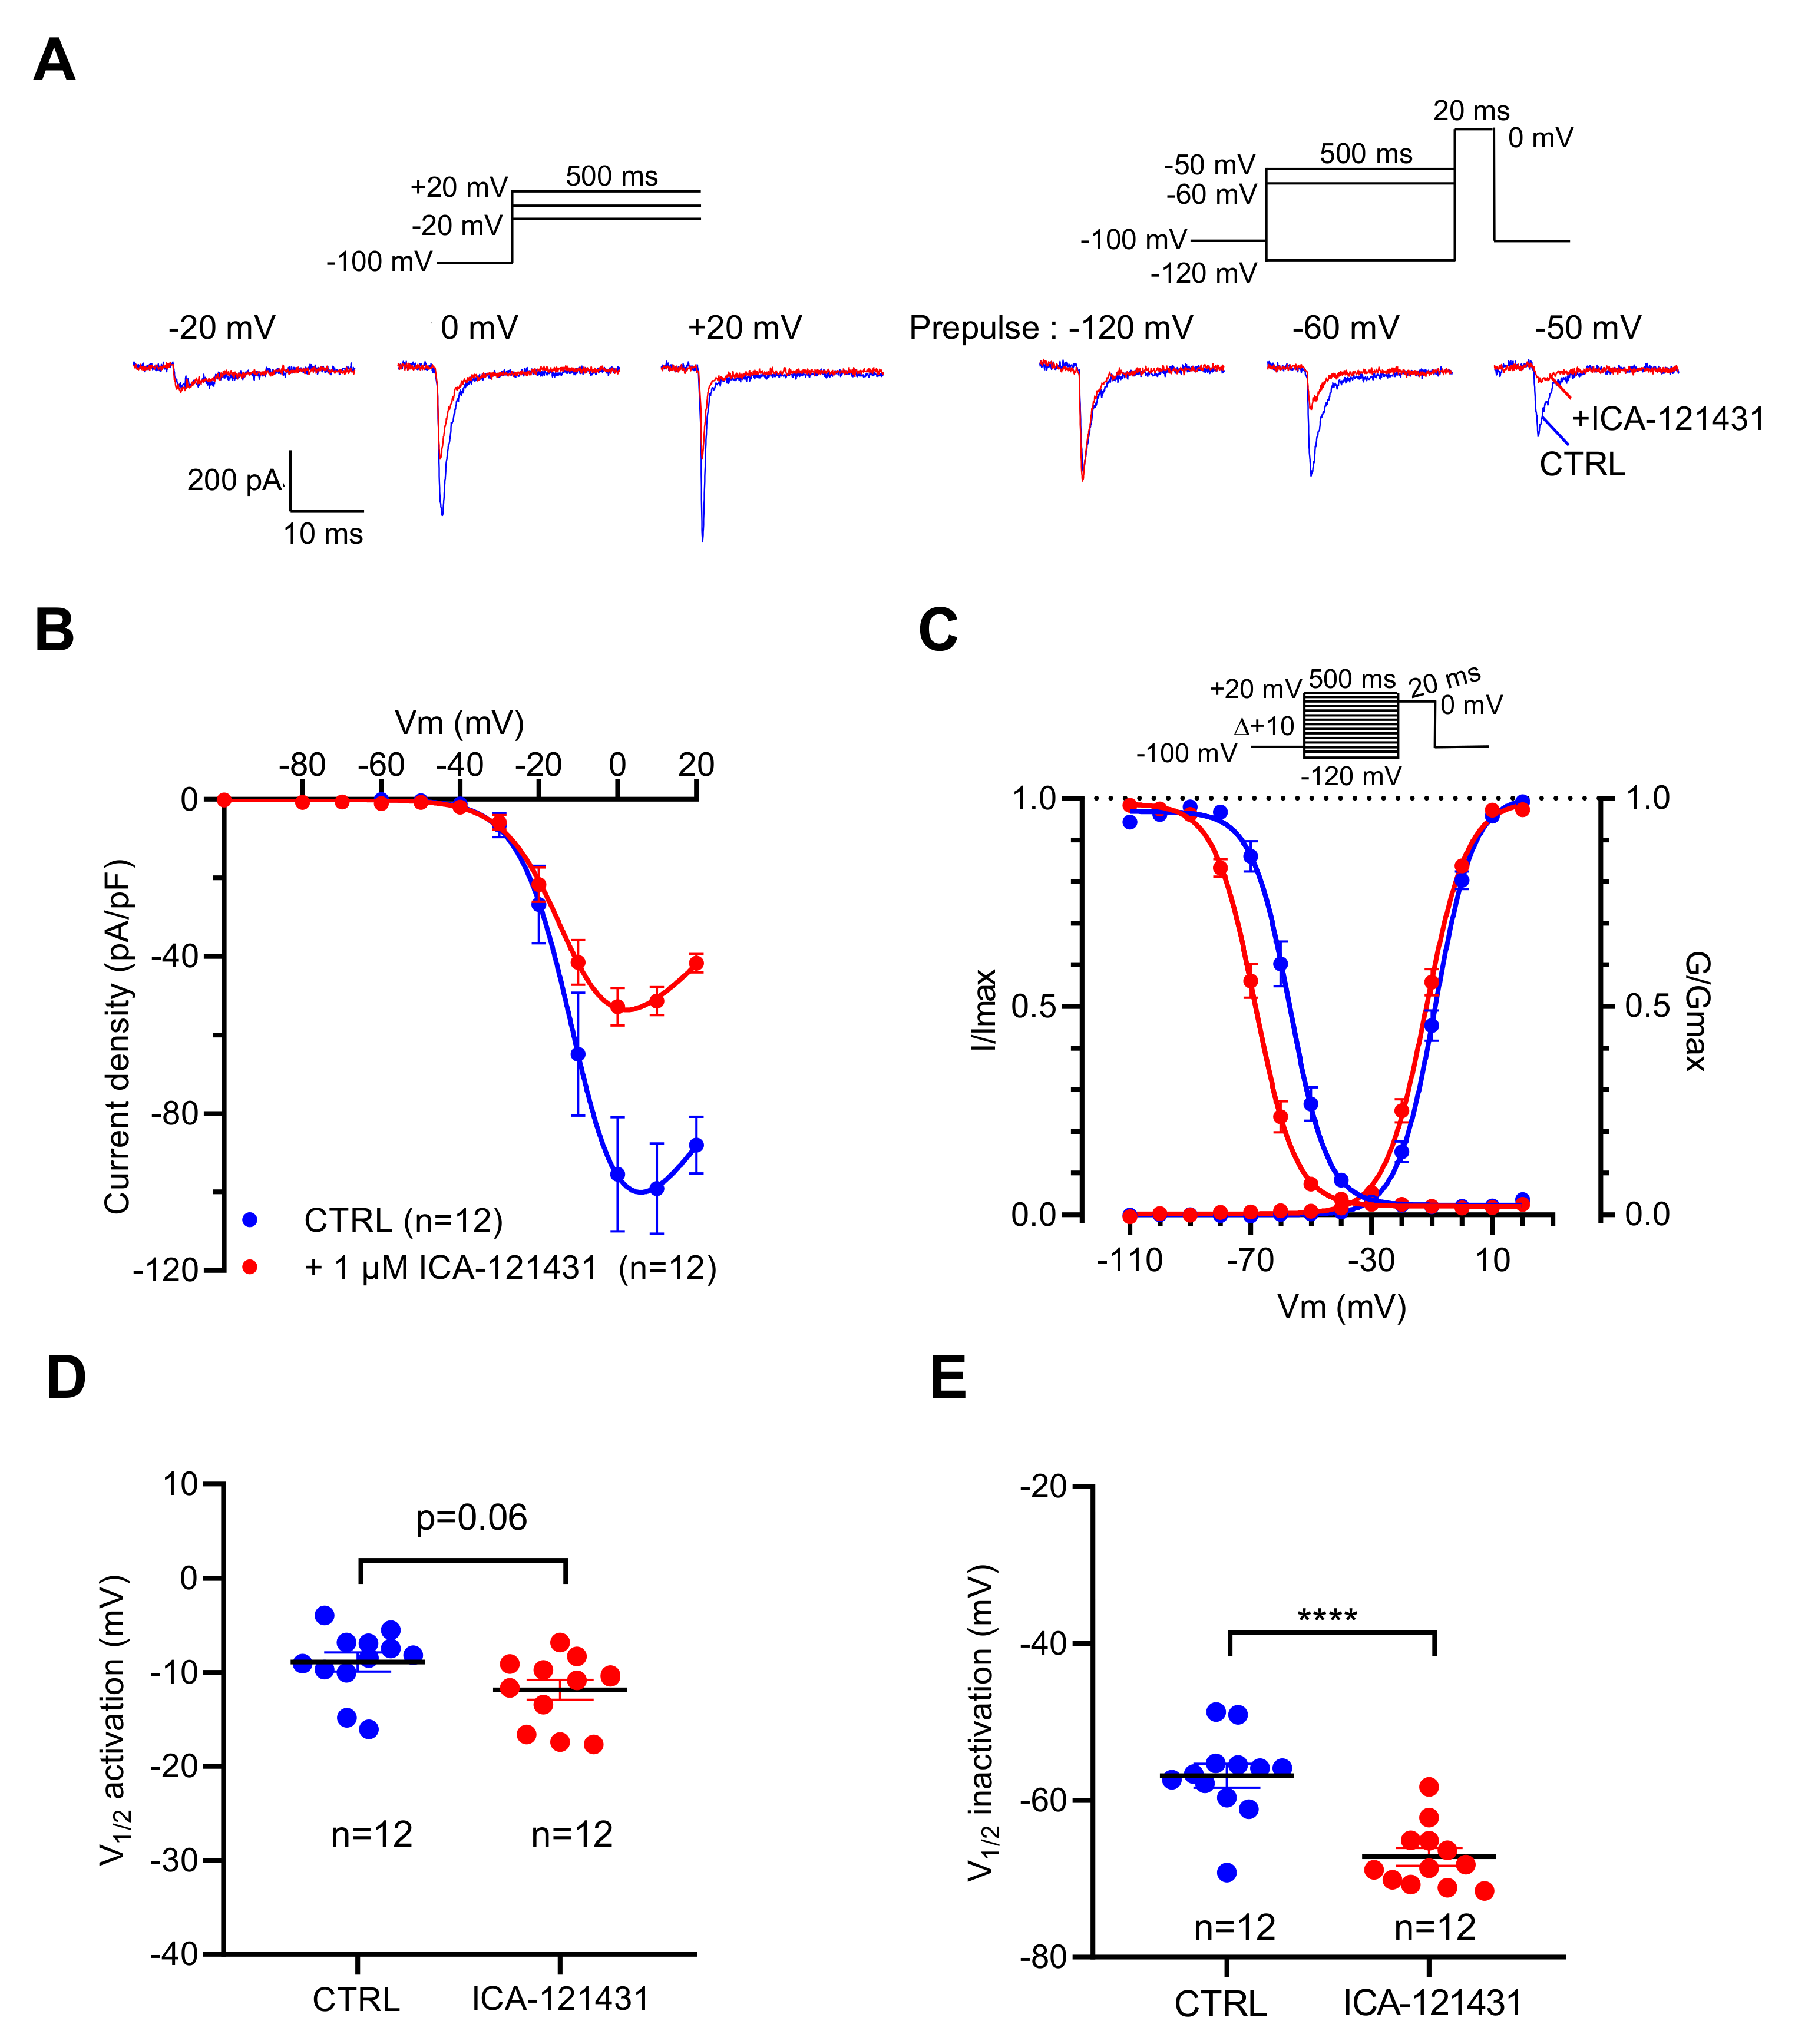
To explore the contribution of the NaV1.3 channel subtype in the genesis of INa in this cell line, we used ICA-121431 [31,32,33] and the β-scorpion toxin Tf2 [32,34], two selective ligands of this NaV channel subtype. At 1 µM, ICA-121431 reduced by 50% the amplitude of INa when they were elicited by depolarizing pulse from −100 mV, while it almost abolished INa evoked by the depolarizing pulse from −50 mV (Figure 3A). ICA-121431 reduced the INa amplitude in a non-voltage-dependent manner (Figure 3B), and thus did not alter the voltage dependency of activation (p = 0.06) (Figure 3C,D). However, ICA-121431 induced a negative shift of 10.3 mV (p < 0.0001) of the voltage dependence of inactivation (Figure 3C,E). These data are in agreement with previous data indicating that ICA-121431 preferentially interacts with inactivated NaV1.3 channels [31,32,33]. At a very low concentration (1 nM), Tf2 strongly altered the activation of INa.
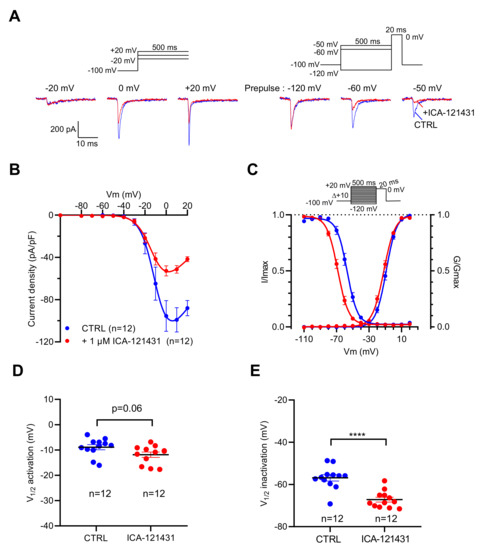
Figure 3.
Effects of ICA-121431, a selective inhibitor of NaV1.3 channels, on INa recorded in GH3b6 cells by manual patch-clamp. (A,B) To illustrate the effects of ICA-121431, examples of superimposed INa elicited by 500 ms depolarizing pulses (at −20, 0, and +20 mV) and examples of superimposed INa elicited by depolarizing pulse at 0 mV immediately after a 500 ms prepulse (−120, −60, and −50 mV) are shown. The control traces are in blue (CTRL) and red traces correspond to INa after ICA-121431 application (1 µM). (B) Current–voltage relationships and (C) activation/inactivation curves of INa recorded before (blue circles) and after 1 µM ICA-121431 (red circles). Comparison of V1/2 activation (D) and inactivation (E) in the absence (CTRL) and in the presence of 1 nM Tf2. Statistical analysis was performed using the two-tailed unpaired t-test, **** p < 0.0001. Data represent the mean ± SEM.
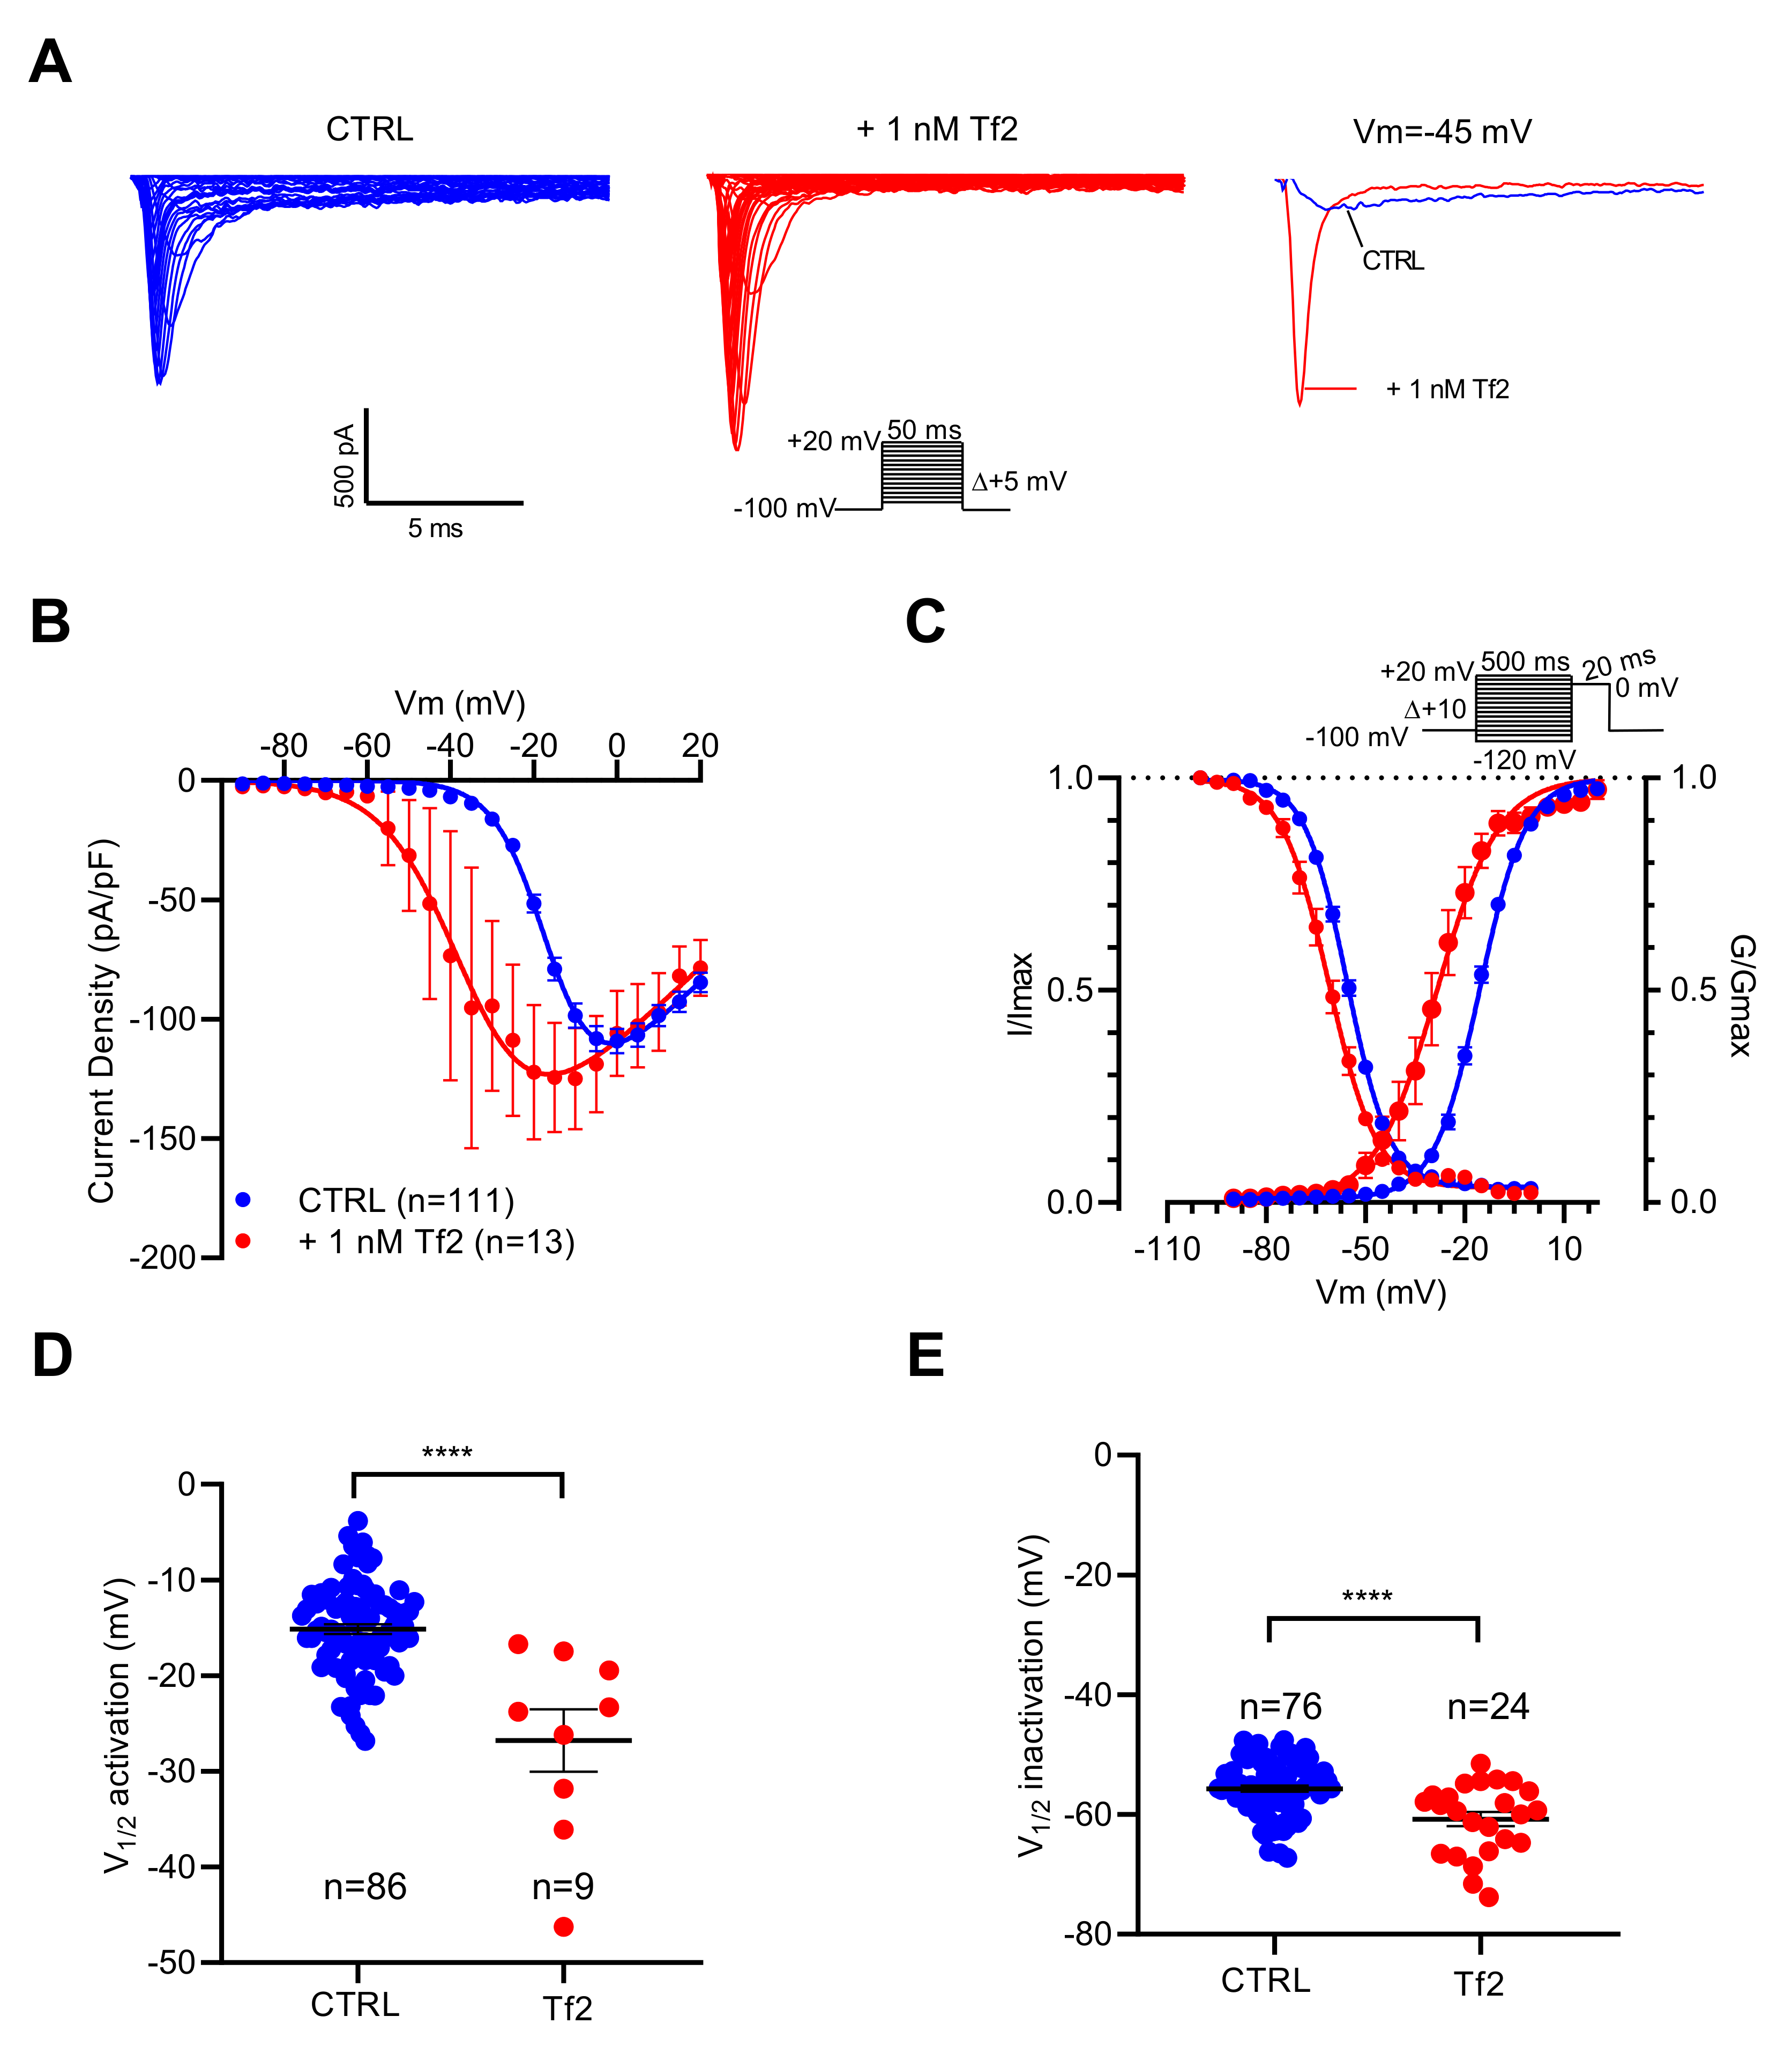
As illustrated in Figure 4A, depolarizing pulses elicited INa with higher amplitudes in the presence of the Tf2 compared to the control. The current–voltage relationships showed that NaV channels opened at potentials more negative in the presence than in the absence of Tf2 (Figure 4B). The V1/2 of activation was positively shifted by 11.7 mV (p < 0.0001) (Figure 4C,D). In addition, Tf2 induced a negative shift of V1/2 of inactivation by 5.1 mV (p < 0.0001) (Figure 4C,E). In conclusion, INa is sensitive to both ICA-121431 and Tf2, indicating that it is promoted by the NaV1.3 channel subtype.
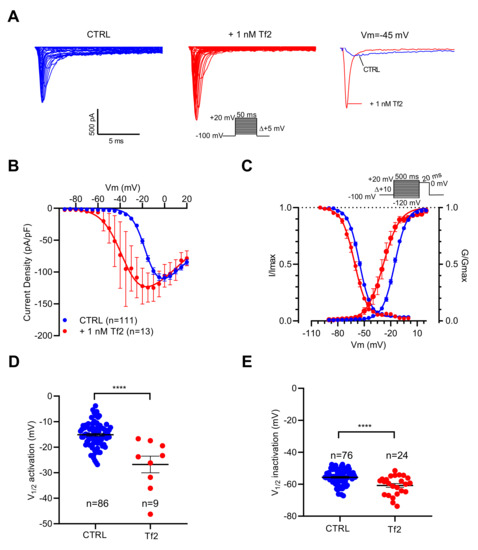
Figure 4.
Effects of Tf2, a selective β-scorpion toxin of NaV1.3 channels, on INa recorded in GH3b6 cells by automated patch-clamp. (A) Representative examples of INa elicited by 50 ms depolarization steps (protocol inset), in the absence and presence of 1 nM Tf2. To illustrate the strong effect of 1 nM Tf2, superimposed INa traces at −45 mV are shown. (B) Current–voltage relationships (C) and activation/inactivation curves of INa recorded before (blue circles) and after 1 nM Tf2 (red circles). Comparison of V1/2 activation (D) and inactivation (E) in the absence (CTRL) and in the presence of 1 nM Tf2. Statistical analysis was performed using the two-tailed unpaired t-test, **** p < 0.0001. Data represent the mean ± SEM.
2.2. Activation of NaV Channels by Various Neurotoxins Triggers the Increase of Intracellular Ca2+ in GH3b6 Cells
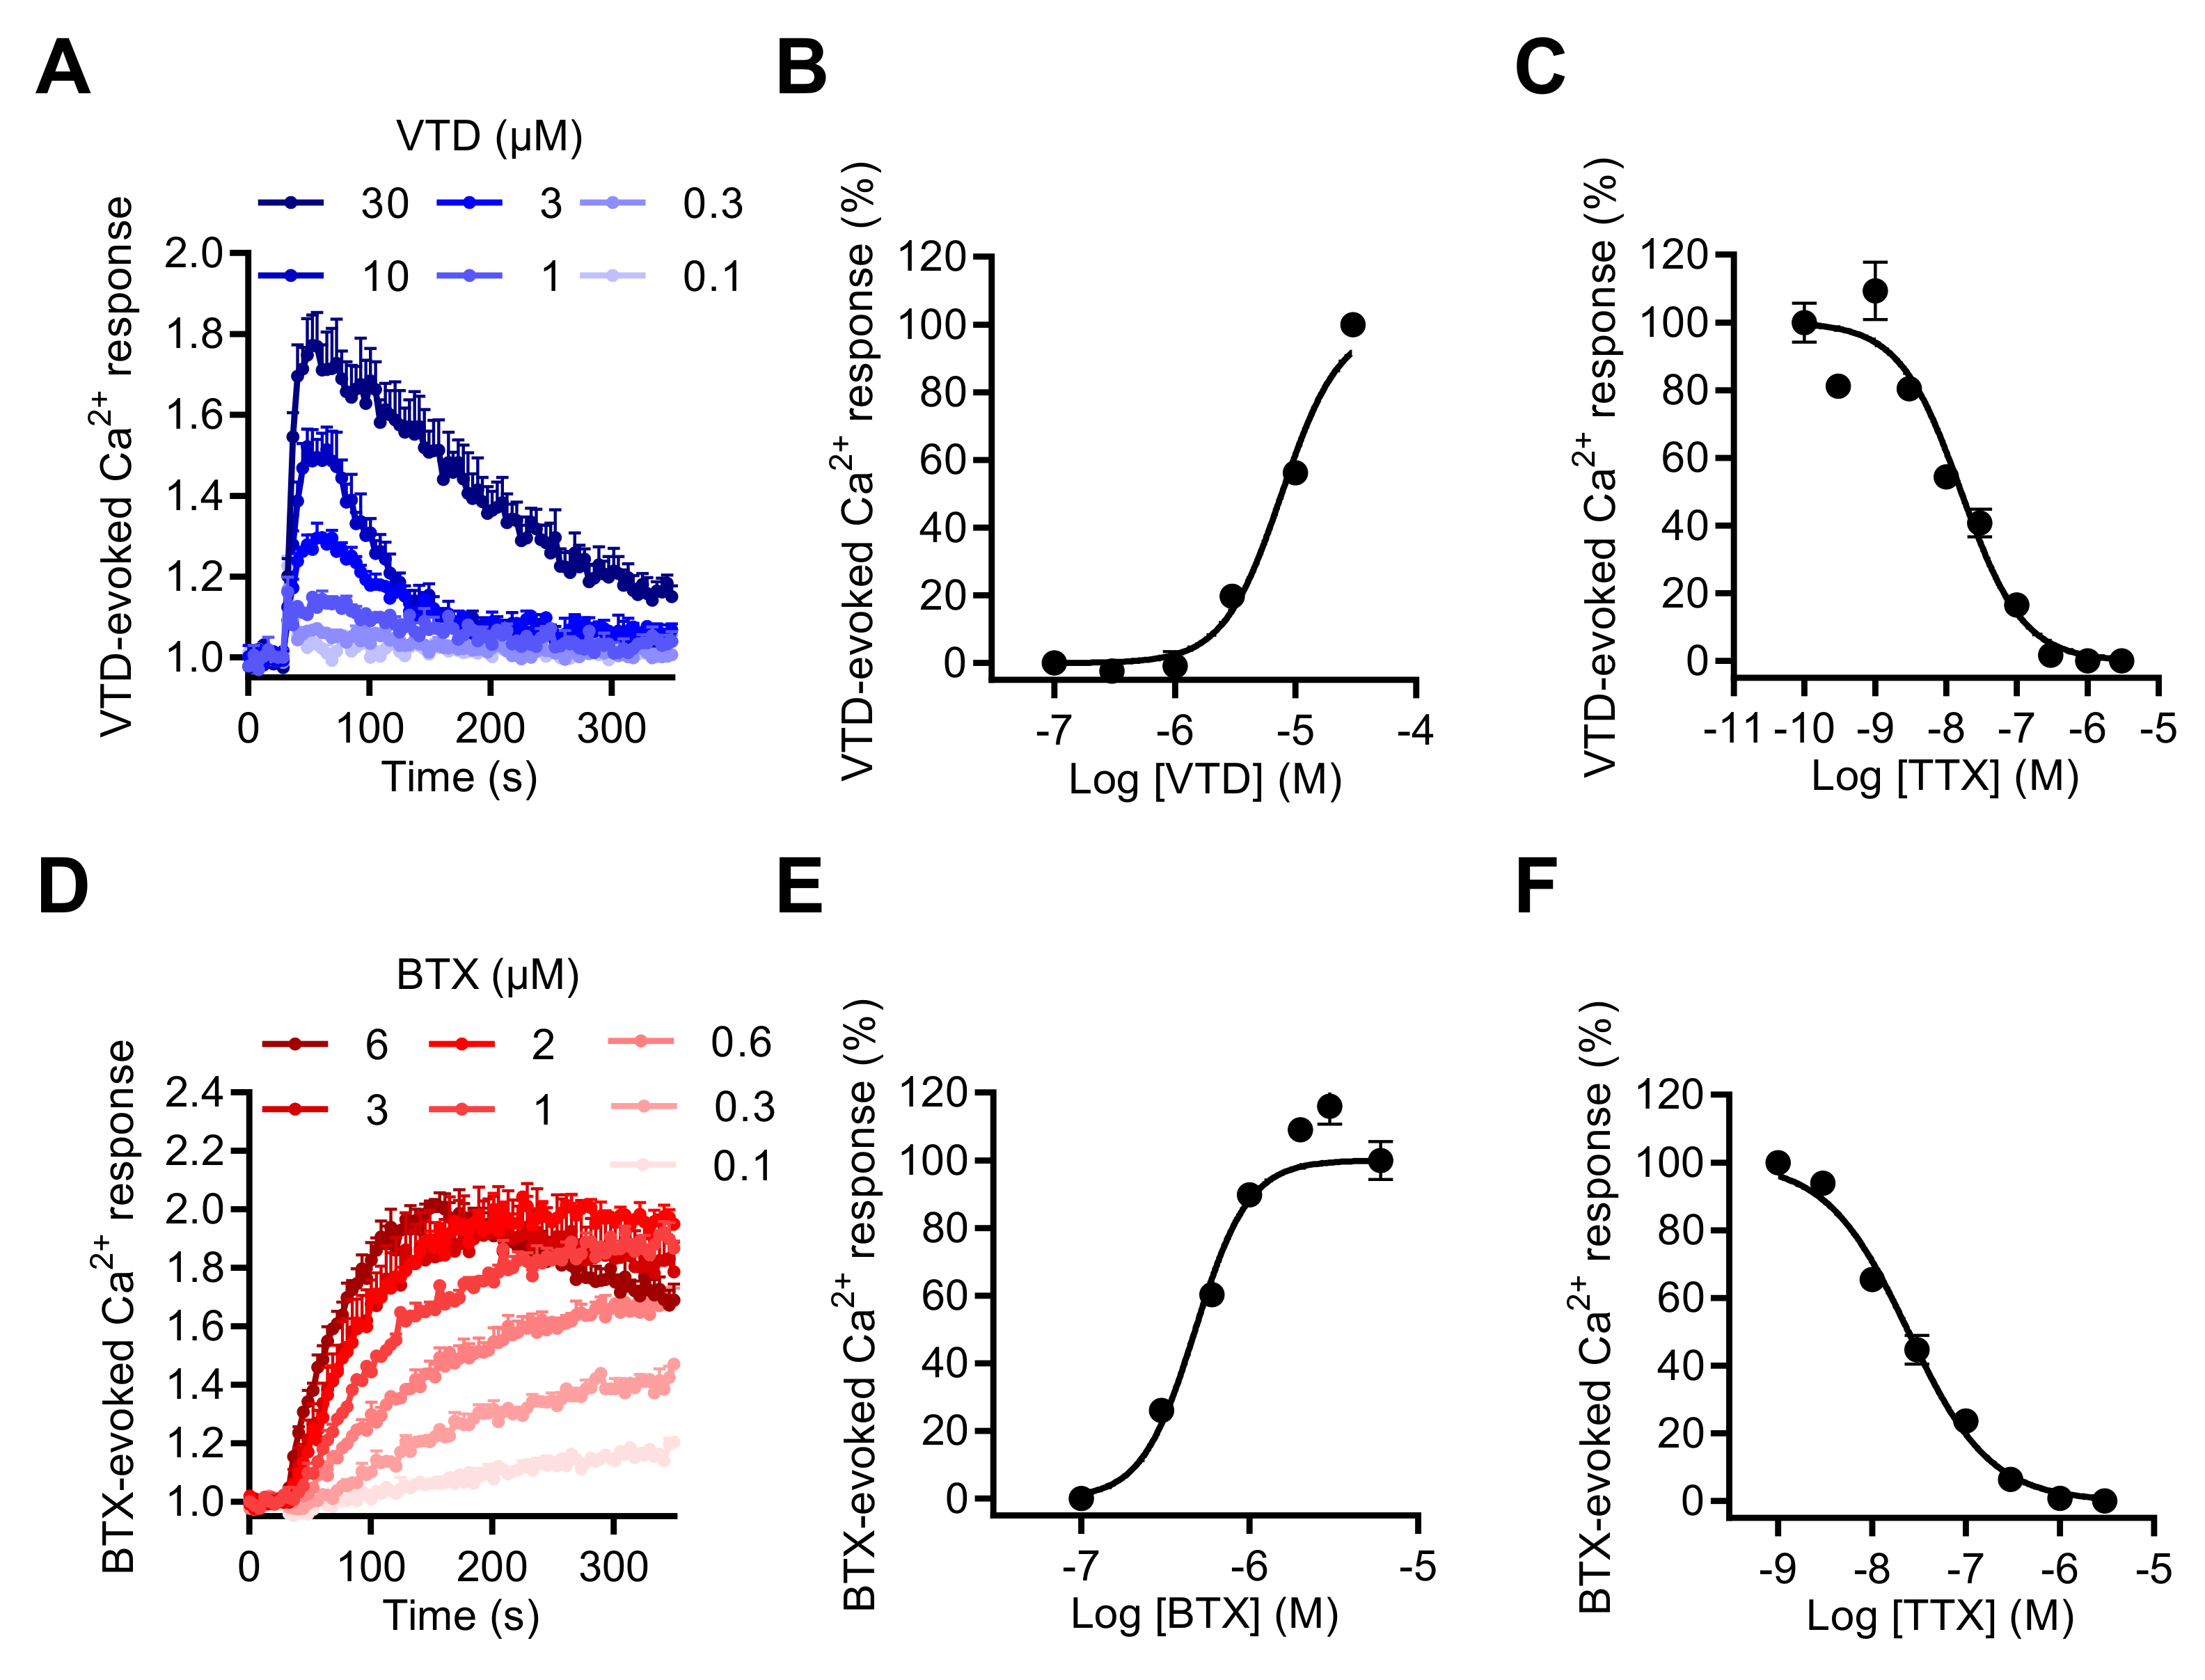
To explore the impact of NaV channel activation by neurotoxins on [Ca2+]i, we first determined whether the two most often used NaV neurotoxins, VTD and BTX, could induce [Ca2+]i elevation in GH3b6 cells. Using the Ca+ fluorescent probe, Fura 2-AM, we showed that both VTD and BTX efficiently increased Fura-2 fluorescence, which indicated [Ca2+]i elevation (Figure 5A,D). Thus, both toxins were able to induce [Ca2+]i elevation with different kinetics and in a TTX-sensitive manner (Figure 5A,D). Indeed, the BTX-induced Ca2+ response was slow and reached a plateau after 250 s of injection, while in comparison, VTD induced a transient increases in [Ca2+]i, which peaked at ~1 min. The VTD and BTX-induced Ca2+ responses were concentration dependent and best fitted by the Hill–Langmuir equation for a bimolecular reaction (Figure 5B,E). As expected, VTD exhibited a lower potency, with an EC50 of 5.39 ± 2.3 µM (Figure 5B), compared to BTX, with an EC50 of 0.66 ± 0.18 µM (Figure 4E). The TTX-induced inhibition of VTD- and BTX-evoked Ca2+ responses was fitted by a single site bimolecular equation, yielding similar IC50 values in the nanomolar range in each case (IC50 of 15.63 ± 0.72 nM with VTD and IC50 of 21.13 ± 3.32 nM with BTX), in agreement with the blockade of TTX-S NaV1.3 channels (Figure 5C,F).
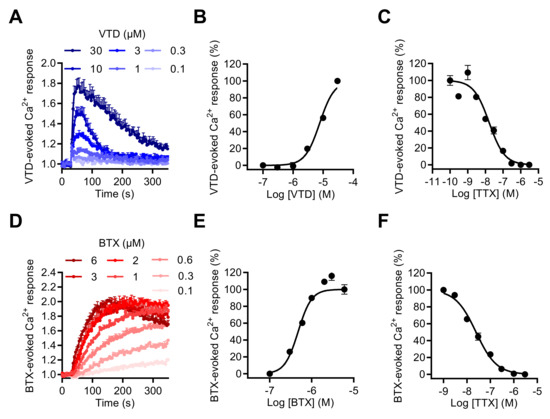
Figure 5.
Effects of VTD and BTD, two selective NaV channel activators, on the intracellular Ca2+ level in GH3b6 cells. (A,D) Representative kinetics of Fura-2 fluorescence in GH3b6 cells treated with increasing concentrations of VTD or BTX. The increase of the Fura-2 fluorescence emission ratio reflects [Ca2+]i elevation. (B,E) The Ca2+ responses induced by VTD and BTX are concentration dependent. In both cases, the concentration–response relationships were analyzed using the Hill–Langmuir equation with variable slope. The values of EC50 and the Hill coefficient were respectively 5.39 ± 2.3 µM and 2.00 ± 0.21 with VTD (R2 = 0.98) and 0.66 ± 0.18 µM, 2.88 ± 0.15 with BTX (R2 = 0.95). (C,F) The NaV channels involved in Ca2+ responses induced by VTD and BTX are TTX-S. TTX inhibits in a concentration-dependent manner the Ca2+ responses elicited by 10 µM of VTD (C) or by 1 µM of BTX (F) with similar IC50 (15.63 ± 0.72 nM, 21.13 ± 3.32 nM, respectively) and Hill coefficients (1.21 ± 0.21, R2 = 0.97 and 0.95 ± 0.04, R2 = 0.99 for VTD and BTX, respectively). Data represent the mean ± SEM (n = 3 wells) and are representative of at least two independent experiments.
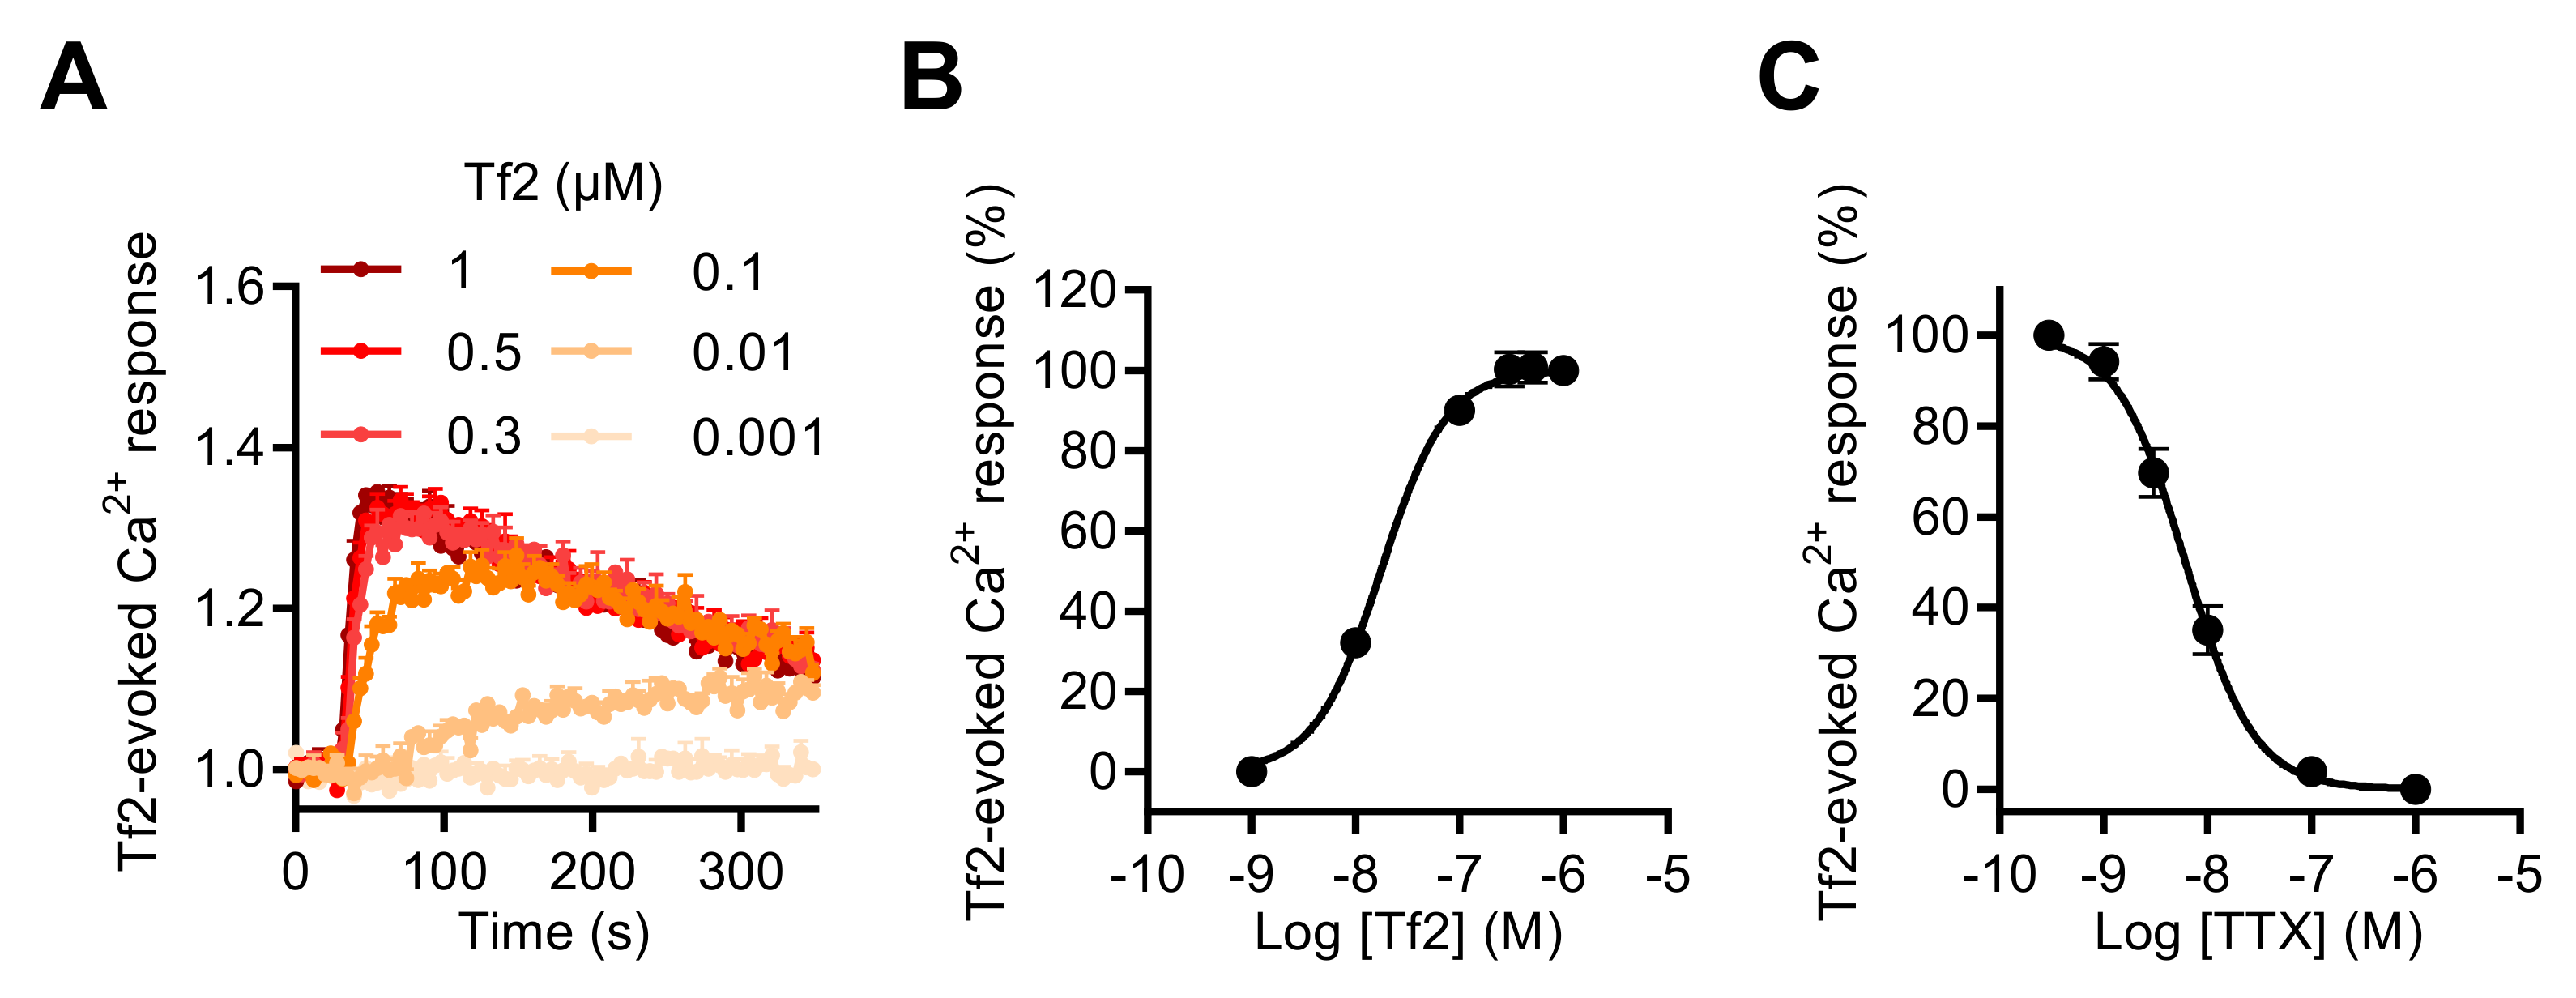
To investigate the involvement of the NaV1.3 subtype in the [Ca2+]i increase induced by NaV channel neurotoxins in GH3b6 cells, we used, as in the patch-clamp recordings of INa, the NaV1.3-selective scorpion toxin, Tf2. This toxin also induced [Ca2+]i elevation in our cell model and the Tf2-induced Ca2+ responses were concentration dependent with an EC50 value of 17.51 ± 1.4 nM and best fitted by the Hill–Langmuir equation for a bimolecular reaction with a Hill slope of 1.38 (Figure 6A,B). The TTX inhibition of Tf2-evoked Ca2+ responses was fitted by a single site bimolecular equation, giving an IC50 value of 7.9 ± 2.1 nM and a Hill coefficient of 1.31 ± 0.14, in agreement with the blockade of the TTX-S NaV1.3 channel subtype (Figure 6C).
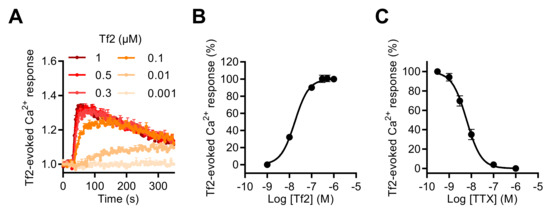
Figure 6.
Effect of Tf2, a selective β-scorpion toxin of NaV1.3, on the intracellular Ca2+ level in GH3b6 cells. (A) Representative kinetics of Fura-2 fluorescence emission in GH3b6 cells treated with increasing concentrations of Tf2. (B) The Ca2+ responses induced by Tf2 are concentration dependent. The concentration–response relationships were analyzed using the Hill–Langmuir equation with variable slope. The values of EC50 and the Hill coefficient were 17.51 ± 1.4 nM and 1.378 (R2 = 0.99). (C) TTX inhibits in a concentration-dependent manner the Ca2+ responses elicited by 0.5 µM of Tf2 with an IC50 value of 7.9 ± 2.1 nM and a Hill coefficient of 1.31 ± 0.135, R2 = 0.94. The data represent the mean ± SEM (n = 3 wells) and are representative of at least two independent experiments.
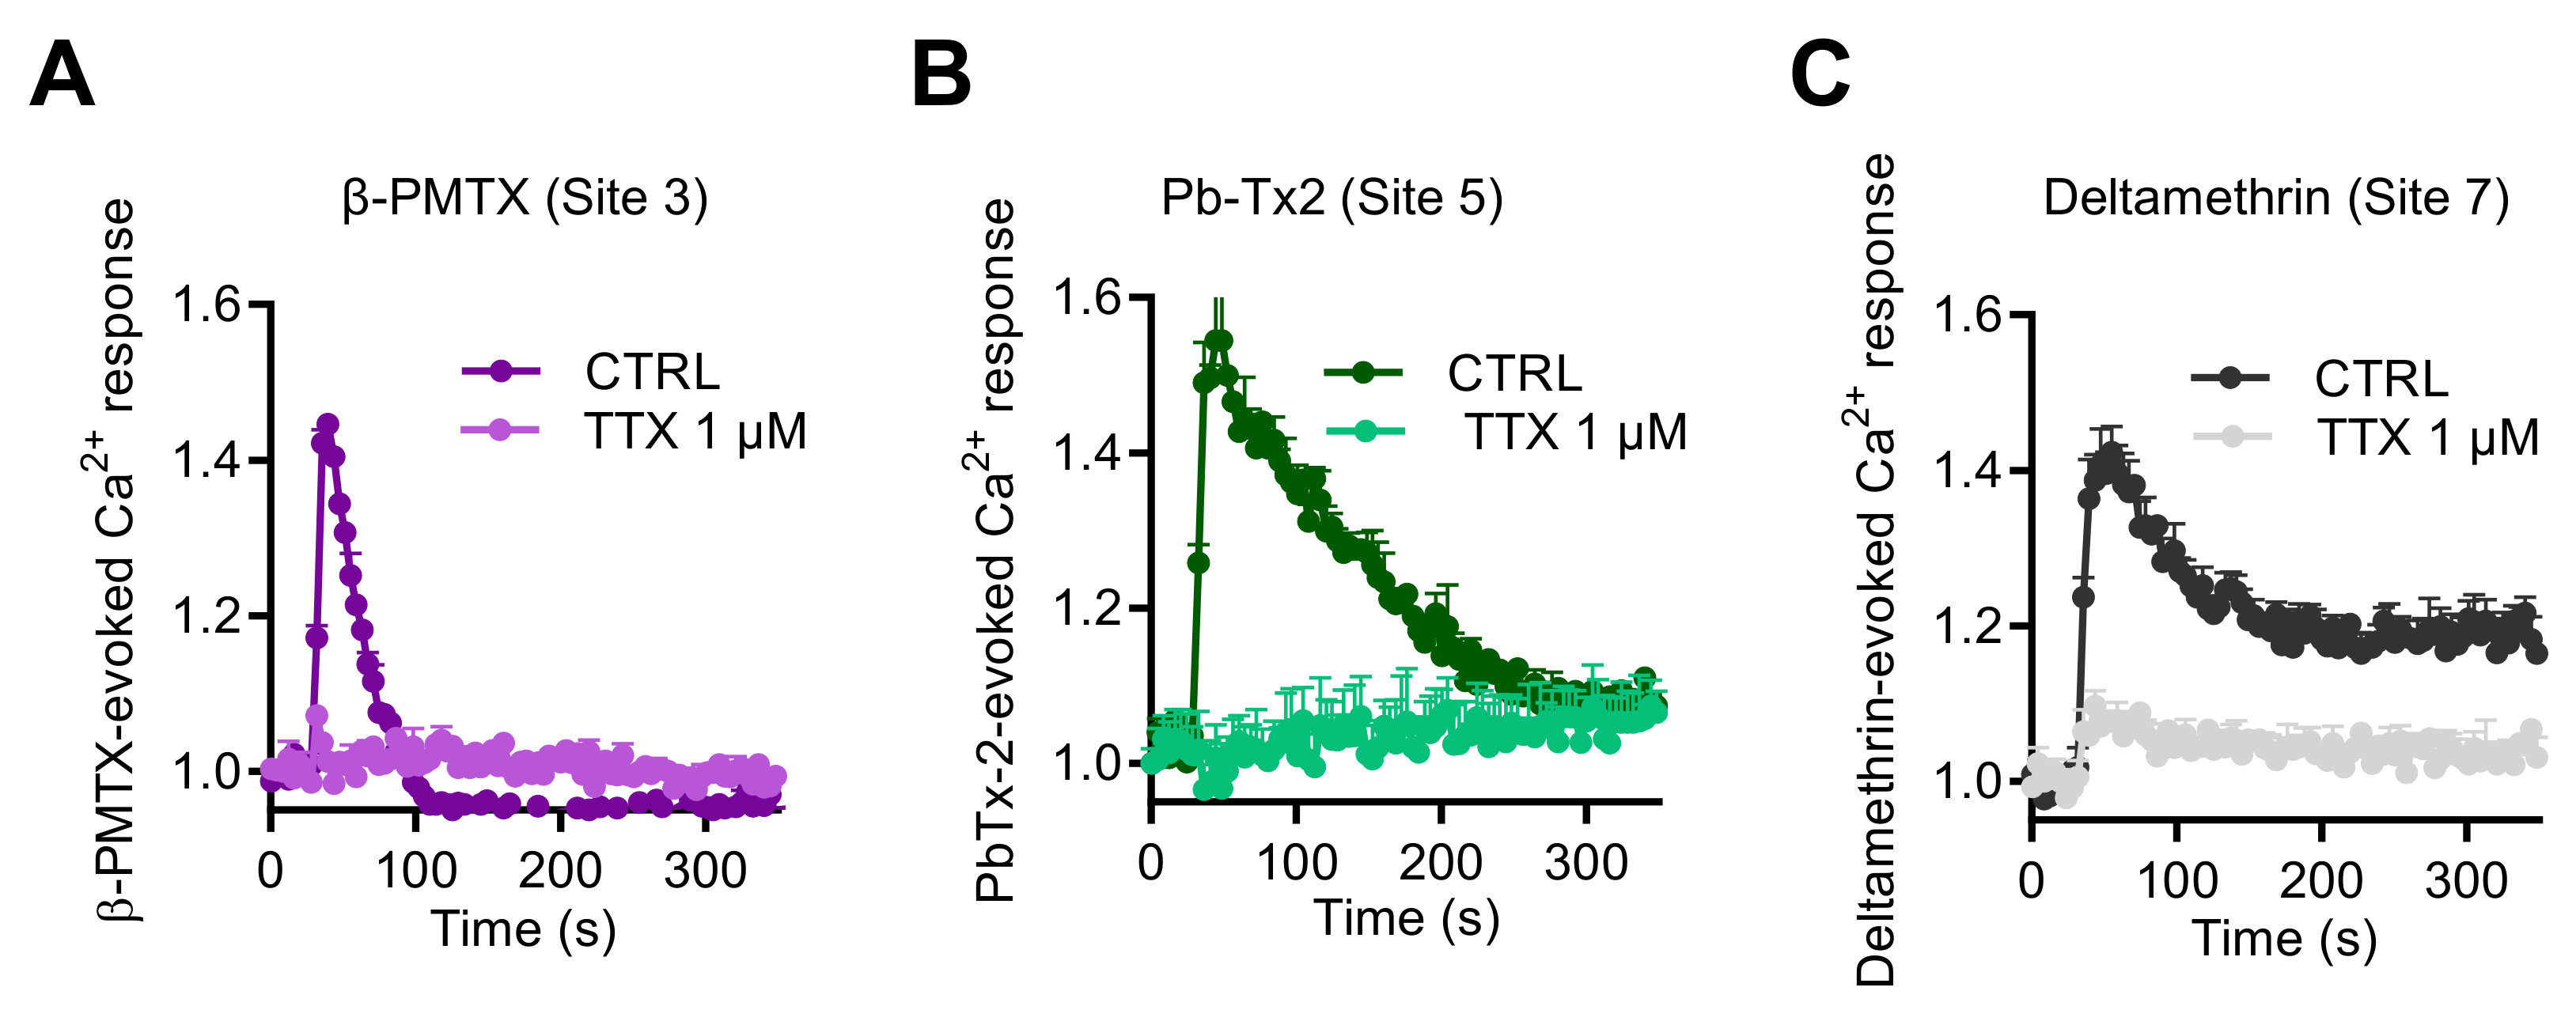
Finally, to explore if other neurotoxins, which activate NaV channels through binding to other pharmacological sites, could also enhance [Ca2+]i, we tested the wasp venom peptide β-PMTX (Site 3) [31,35,36], the marine toxin PbTx-2 (Site 5), and the pyrethroid deltamethrine (Site 7). These three molecules induced intracellular Ca2+ responses with various kinetic profiles (Figure 7). At 100 µM, β-PMTX triggered a rapid and transient Ca2+ elevation, in a concentration-dependent manner, as observed with VTD (Figure 7A). In comparison, PbTx-2 (3 µM) provoked a rapid response followed by a slower decrease of the Ca2+ signal (Figure 7B). In contrast, deltamethrine (10 µM) caused Ca2+ responses with a peak, followed by a plateau (Figure 7C). Ca2+ responses induced by these three toxins were fully blocked by TTX at 1 µM.
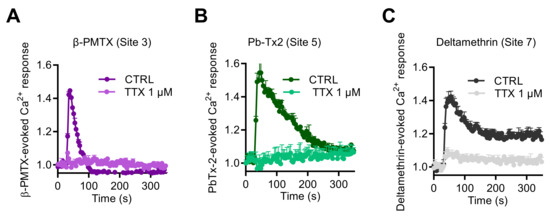
Figure 7.
Effects of NaV channel activators, which bind to Site 3, Site 5, and Site 7, on intracellular Ca2+ in GH3b6 cells. Representative Fura-2 fluorescence kinetics traces were obtained after injection of 100 µM β-PMTX (A), 3 µM of Pb-Tx2 (B), or 10 µM of deltamethrine (C). All of them were fully abolished by TTX use at 1 µM. Data represent the mean ± SEM (n = 3 wells) from at least two independent experiments.
2.3. NaV Channel Activation by Neurotoxins Triggers Ca2+ Influx Mediated by L-Type CaV Channels (LTCC)
Since it is well-known that in neurons, persistent Na+ entry induced by VTD is associated with [Ca2+]i elevation mediated by the Na+/Ca2+ exchanger NCX, and/or LTCC, and/or N-type channels [11,13,15,17,37], we challenged whether NCX and CaV channels contribute to VTD-induced Ca2+ responses. To identify the source of Ca2+ mobilized by VTD, Fura-2 experiments were performed in Ca2+-free medium. In this condition, the VTD-evoked Ca2+ response was completely suppressed (Supplementary Figure S3). Moreover, the depletion of Ca2+ stores by with thapsigargin (2 µM, 10 min prior to injection of VTD) did not modify the VTD-induced Ca2+-response (Supplementary Figure S3). Thus, NaV channel activation by VTD did not involve intracellular Ca2+ stores and leads to Ca2+ entry mediated by transport through the plasma membrane by NCX and/or CaV channels.
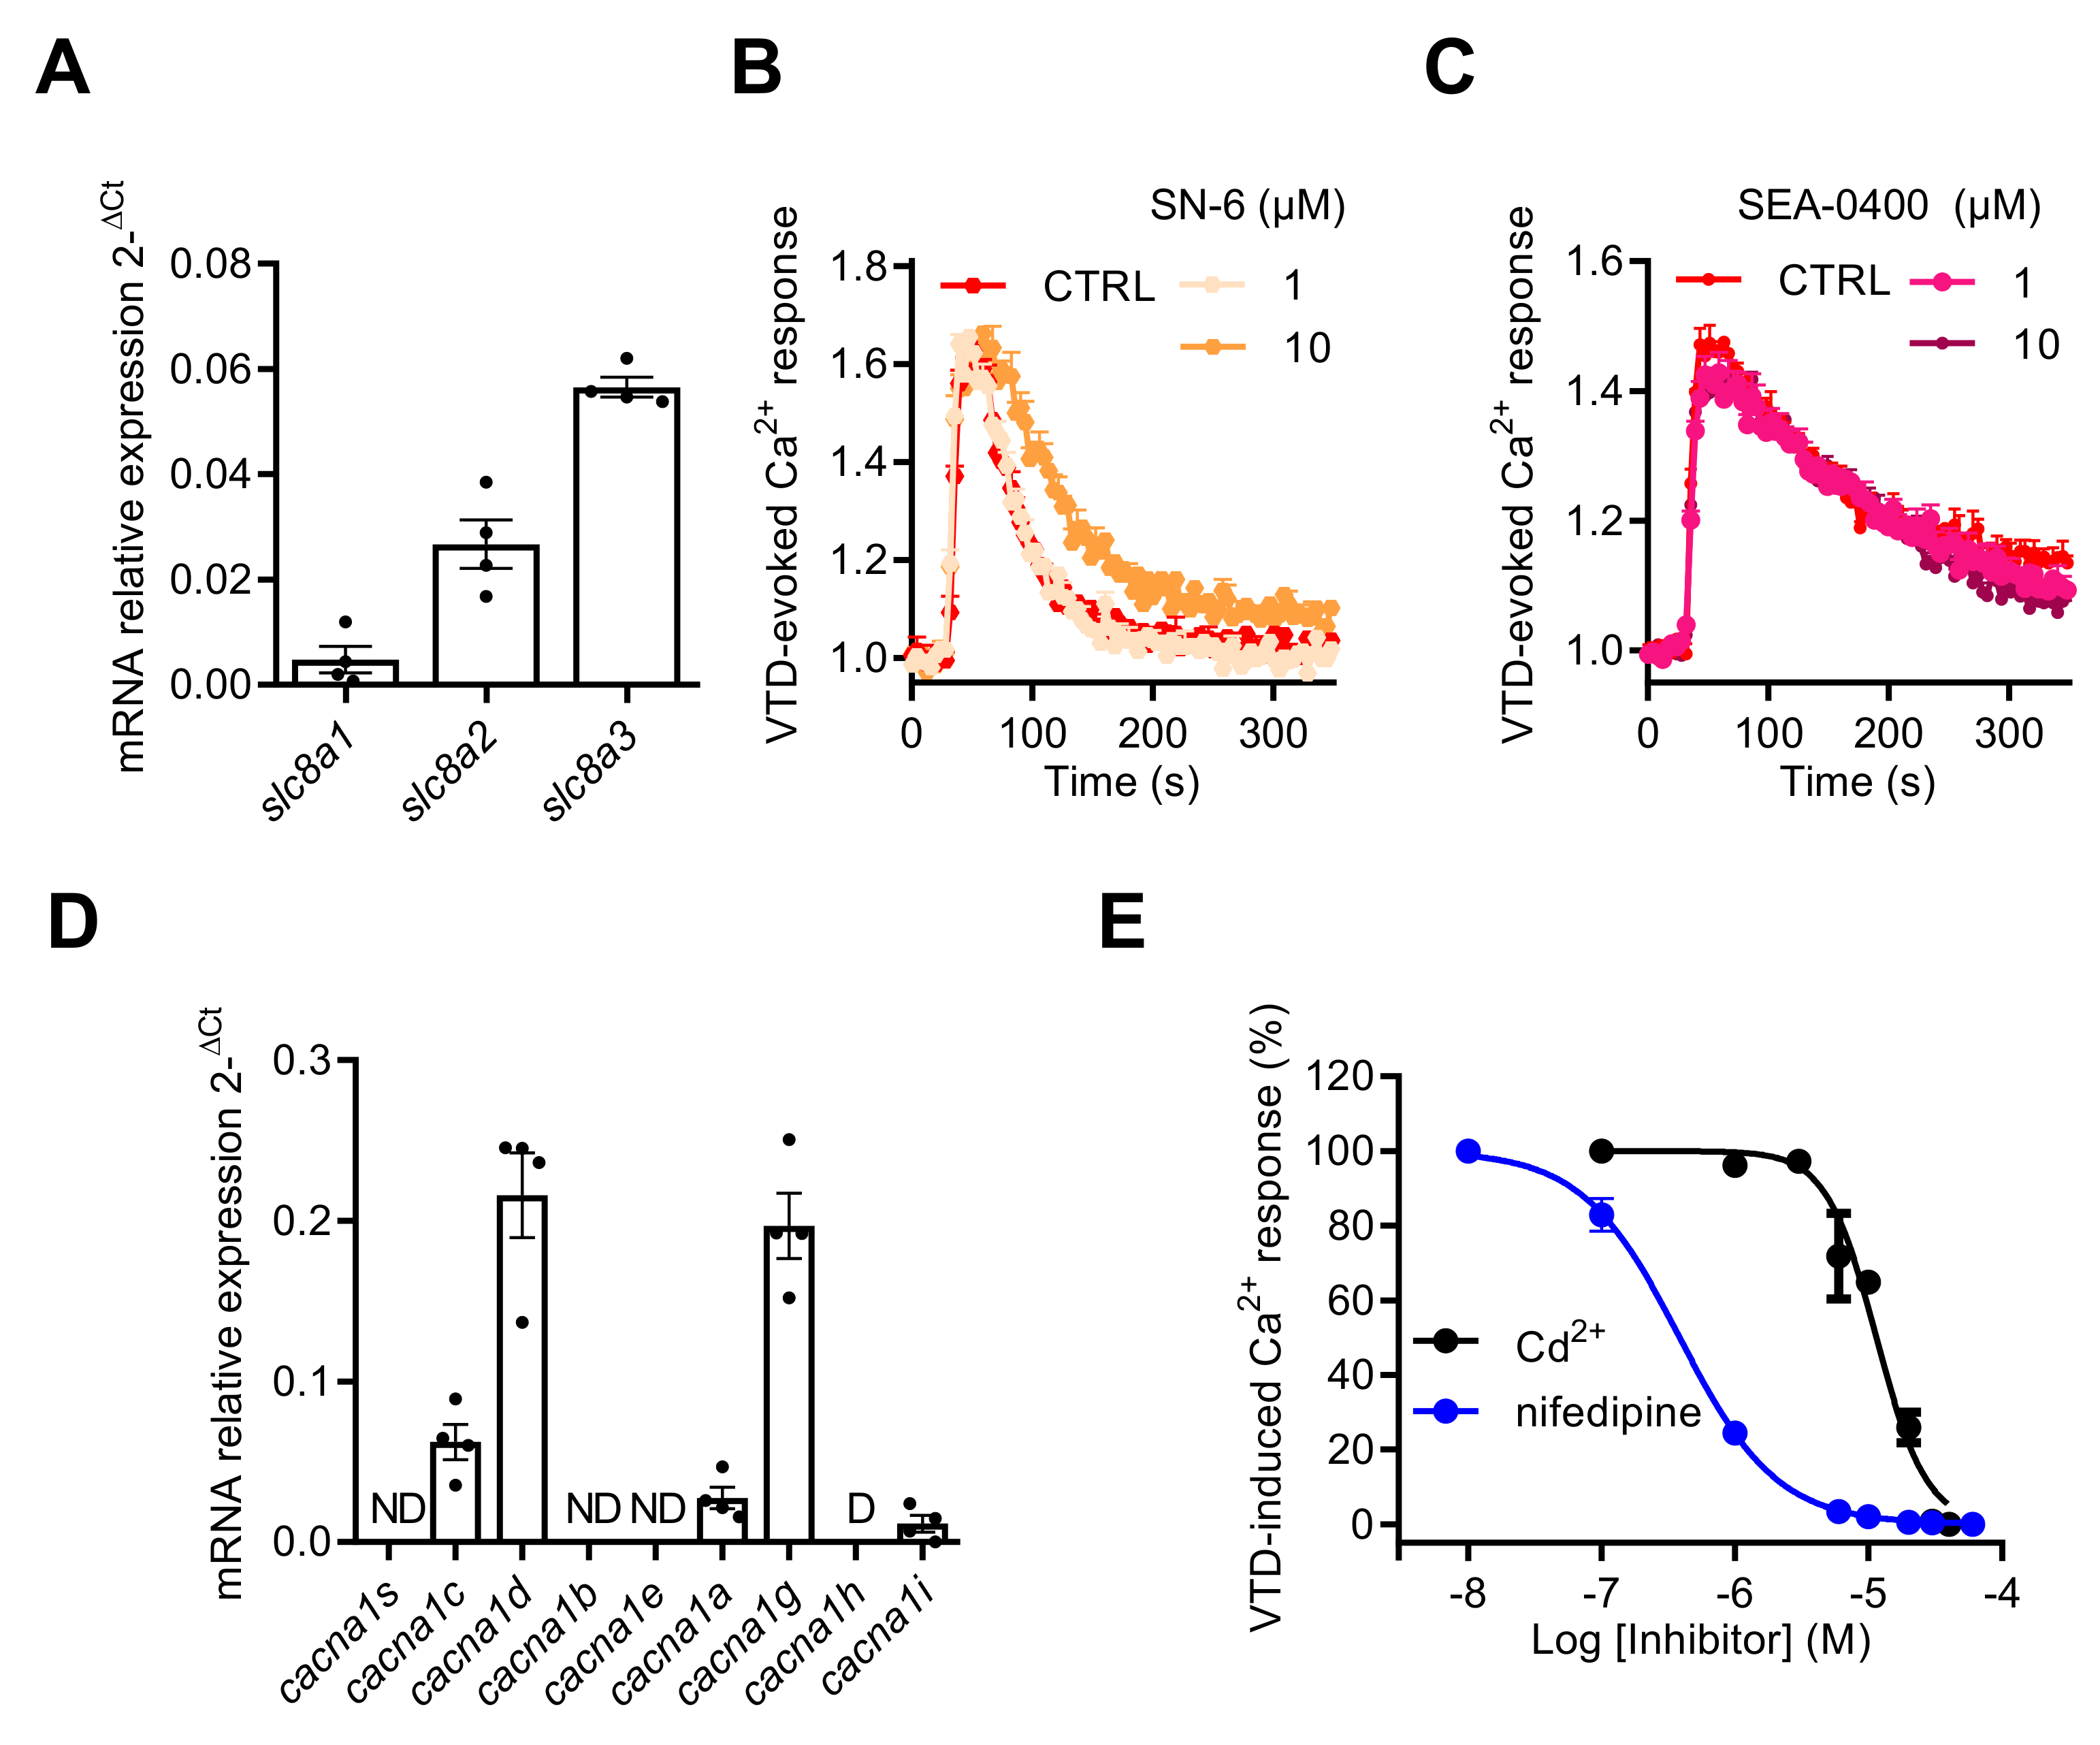
The NCX gene expression profile by RT-qPCR revealed that NCX1–3 subtype transcripts were expressed in GH3b6 cells with the following ranking order: slc8a3 > slc8a2 > slc8a1 (Figure 8A). Since KB-R7943 inhibited the Na+ current [38], we used the two other NCX inhibitors available: the selective NCX inhibitor SN-6 [39] with IC50 values of 2.9, 16, and 8.6 µM for NCX1, NCX2, and NCX3, respectively, and the selective NCX1 and NCX2 inhibitor SEA-0400 [40] with IC50 values of 0.056 and 0.98 µM, respectively. Both SN-6 and SEA-0400 did not significantly inhibit the VTD-induced Ca2+ responses, at a concentration of 10 µM (Figure 8B,C), thus excluding the implication of NCX. Next, we characterized the gene expression profiles of CaV channels by RT-qPCR in GH3b6 cells. The cDNAs of cacna1c and cacna1d, encoding two LTCC (CaV1.2 and CaV1.3), cacna1a encoding a P/Q type CaV channel (CaV2.1), cacna1g and cacna1i, encoding two t-type CaV channels (CaV3.1 and CaV3.3) (Figure 8D), were detected at significant expression levels. The highest expression levels of transcription were found for cacna1c, cacna1d, and cacna1i, indicating that both L-type and T-type CaV channels represent the main CaV channel subtypes expressed in GH3b6 cells, as previously described in GH3 or GH3b6 cells [41,42]. The VTD-evoked Ca2+ responses were totally suppressed either by Cd2+ (at ~30 µM) or nifedipine (at ~10 µM) (Figure 8E). Both compounds induced a concentration-dependent inhibition of VTD-evoked Ca2+ responses, which were best fitted with the Langmuir–Hill equation, with IC50 values of 1.04 ± 0.65 µM for nifedipine and 9.76 ± 1.74 µM for Cd2+ (Figure 8E). Taken together, our data shown that NaV channel activation by neurotoxins that triggers Ca2+ influx is fully mediated by LTCC.
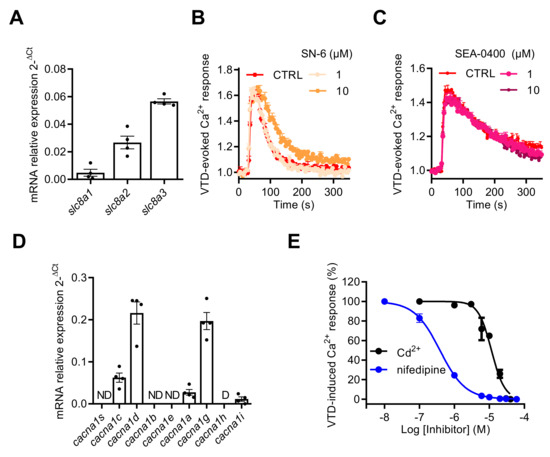
Figure 8.
Effects of NCX and CaV channel inhibitors on VTD-evoked Ca2+ responses in GH3b6 cells. (A) The expression profile of NCX1–3 genes (scl8a1–3) in GH3b6 cells was characterized by relative RT-qPCR. The data are mean of mRNA relative expression ± SEM. Effects of SN-6 (B) and SEA0400 (C), two specific inhibitors of NCX, on VTD-induced Ca2+ responses in GH3b6 cells. VTD was used at 10 µM. (D) The expression profile of CaV channel genes (cacna1a–e, g–i, and s) in GH3b6 cells was characterized by relative RT-qPCR. The data are mean ± SEM. D: Disregarded (Ct > 32); ND: Not Detected. (E) Concentration–inhibition relationship of VTD-induced Ca2+ responses by nifedipine, a specific blocker of L-type CaV channels (IC50 = 1.04 ± 0.65 µM, Hill slope = 1.30 ± 0.11, R2 = 0.98) and Cd2+, a blocker of CaV channels (IC50 = 9.76 ± 1.74 µM, Hill slope = 2.35 ± 0.03, R2 = 0.97) with VTD used at 10 µM. Data represent the mean ± SEM (n = 3) from two independent experiments.
2.4. GH3b6 Cell-Based Assay Using Fura-2 Offers a Convenient Model to Characterize NaV Channel Modulators
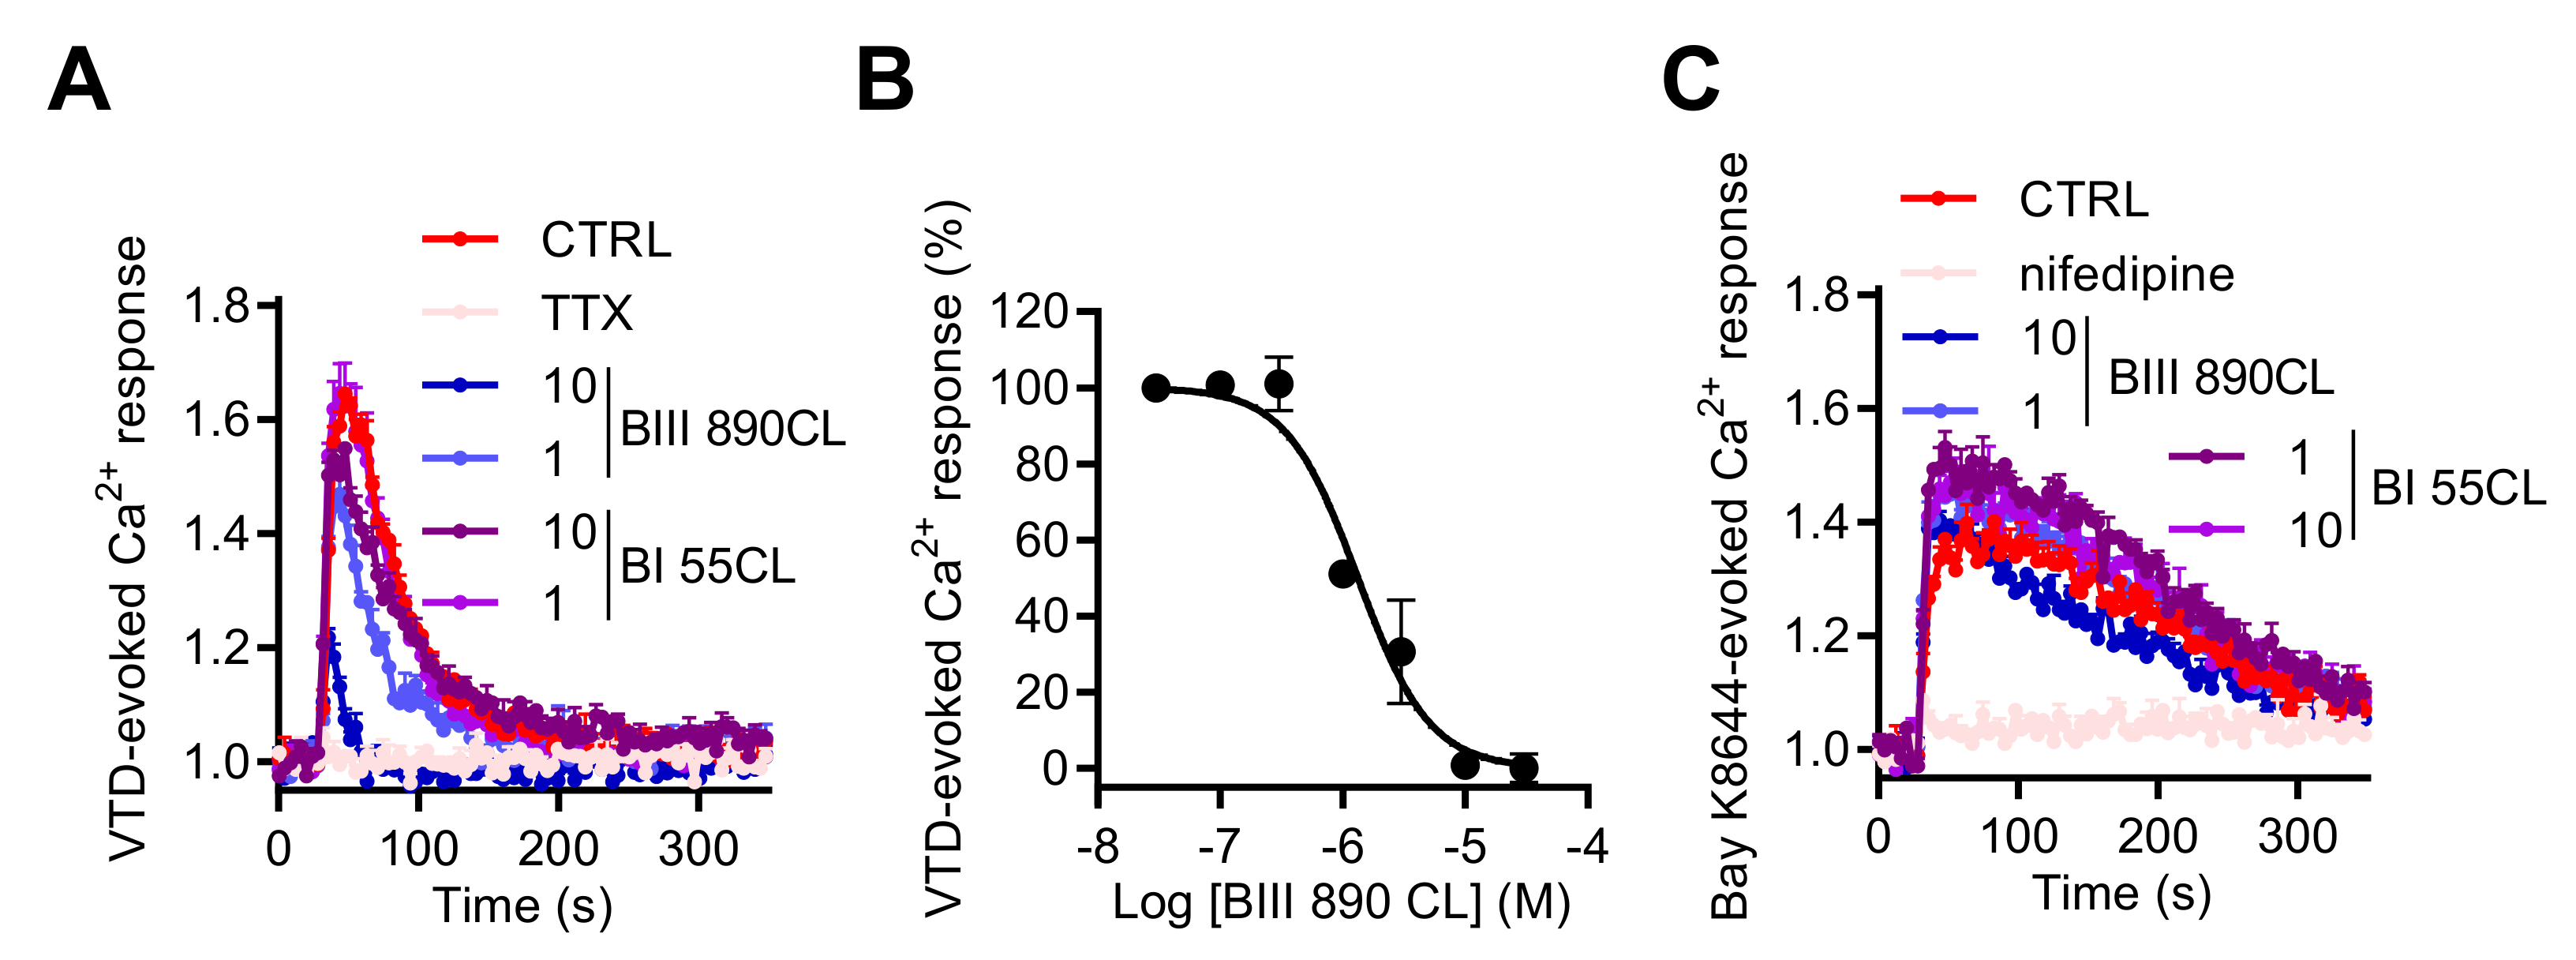
In order to validate our model as a suitable assay for NaV channel pharmacological studies, we used a novel selective blocker of Site 2 of NaV channels BIII 890 CL (crobenetine) [43,44,45] together with BI 55CL, which is a structurally close analogue of BIII 890 CL but with more than 1000-fold lower potency for NaV channels. When co-injected with VTD (10 µM), 1 or 10 µM of BIII 890 CL blocked the increase of [Ca2+]i with a percentage of inhibition of 34.9% ± 0.9% and 74.2% ± 4.2%, respectively, whereas BI 55CL did not significantly modify the Ca2+ entry induced by VTD (Figure 9A). The BIII 890 CL inhibition of VTD-evoked Ca2+ responses could be fitted by a single site bimolecular equation, giving an IC50 value of 1.47 ± 0.18 µM (Figure 9B). Importantly, Ca2+ responses induced by Bay K8644, a specific LTCC activator, were not modified by BIII 890 CL nor BI 55 CL whereas 10 µM of nifedipine totally blocked the Bay K8644-evoked Ca2+ entry in GH3b6 cells (Figure 9C), demonstrating the selectivity of BIII 890 CL toward NaV channels and the specificity of the Ca2+ monitoring when NaV channels are activated by selective neurotoxin. Taken together, the crosstalk between NaV and CaV channels in GH3b6 cells appears as a new strategy to modulate NaV channels.
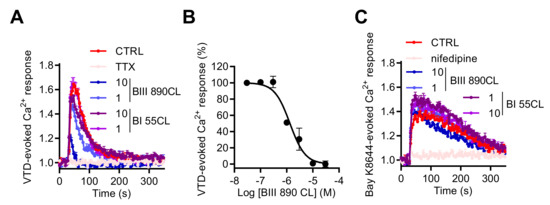
Figure 9.
Effects of BIII 890CL on Ca2+ responses triggered by VTD or Bay K8644. (A) Representative Fura-2 fluorescence kinetic traces illustrating Ca2+ response induced by 10 µM of VTD, alone or co-injected with 1 µM of TTX or with 10 or 1 µM of BIII 890 CL or with BI 55CL (10 and 1 µM), used as a negative control. (B) Concentration–inhibition relationship of VTD-induced Ca2+ responses by BIII 890CL, (IC50 = 1.47 ± 0.18 µM, Hill slope = 1.26 ± 0.23, R2 = 0.94). (C) Representative Fura-2 fluorescence kinetics traces illustrating Ca2+ response induced by 1 µM of Bay K8644, a specific L-type CaV channel activator, alone or co-injected with 10 µM of nifedipine or with 10 or 1 µM of BIII 890 CL or with BI 55CL (10 and 1 µM), used as a negative control. Data represent the mean ± SEM (n = 3) of recordings of two independent experiments.
3. Discussion
All pituitary cells, including GH3 cells and its subclone GH3b6, exhibit membrane excitability and signaling pathways similar to those observed in neurons, because they endogenously express NaV and CaV channels [22]. Here, we showed that the NaV1.3 channel is the predominant subtype expressed at the plasma membrane and endorses the voltage-gated INa in GH3b6 cells. Various neurotoxins or activators of NaV channels (VTD, BTX, β-PMTX, PbTx2, and deltamethrine) and notably Tf2, a selective neurotoxin of the NaV1.3 channel subtype, activate NaV channels in GH3b6 cells, which leads in turn to the elevation of [Ca2+]i. We determined that this [Ca2+]i elevation is due to plasmalemmal Ca2+ entry mediated by LTCC, highlighting a crosstalk between NaV channels and CaV channels in GH3b6 cells.
GH3b6 cells express TTX-S NaV channel subtype transcripts (scn2a, scn3a, scn8a) commonly expressed in neurons of the central nervous system. It appears that scn3a transcript is the most abundant and only the NaV1.3 channel subtype was detected at the protein level and at the plasma membrane in these cells. scn1b and scn3b, encoding β1 and β3 subunits, were also found, in accordance with the high level of NaV1.3 expression [46,47]. Since GH3b6 cells are a subclone of GH3 cells, it is not surprising that both share similar Nav channel gene expression profiles except for Nav1.1, which was not detected in our model [48,49]. Although we did not detect NaV1.2 and NaV1.6 channels at the protein level, NaV1.2 and NaV1.6 channels are likely expressed at very low densities and thus their contribution to INa could be disregarded. Indeed, the biophysical and pharmacological properties of INa recorded in GH3b6 cells perfectly match with those of NaV1.3 channels. This subtype produces INa with fast repriming kinetics and recovers rapidly from inactivation, ramp currents, and persistent currents [50,51]. Moreover, NaV1.3 channels are blocked by ICA-121431, and were activated at more negative Vm in the presence of the β-scorpion toxin Tf2, both being selective ligands of this NaV channel subtype.
Based on these data, the activation of NaV channels by neurotoxins could lead to [Ca2+]i elevation, as previously demonstrated in neuronal cells, through a crosslink between NaV and/or NCX and/or CaV channels [9,11,14,16,17] but never in endocrine cells. In GH3b6 cells, we found that VTD-induced [Ca2+]i elevation was totally blocked by TTX in the nanomolar range, confirming the involvement of TTX-S NaV channels. These Ca2+ responses to VTD were only sensitive to CaV channel inhibitors, such as Cd2+ and nifedipine, a selective LTCC inhibitor, which completely blocked the Ca2+ entry, with IC50 values close to those previously determined by electrophysiology [52,53]. Thus, when VTD induced Na+ entry through NaV channels and subsequent membrane depolarization, only LTCC are were and promoted a subsequent large Ca2+ influx. This is supported by the CaV channel gene expression profile, showing LTCC as one of the main abundant CaV channels in GH3b6 cells (CaV1.2 and CaV1.3). CaV3.1 encoded by cacna1g is also expressed in GH3b6 cells at a similar level to cacna1d. However, since nifedipine totally blocked VTD-induced Ca2+ elevation, T-type CaV channels certainly do not contribute to these Ca2+ entries. Thus, by inducing intracellular Ca2+ overload, neurotoxins that activate NaV channels might also alter hormone secretion in endocrine cells.
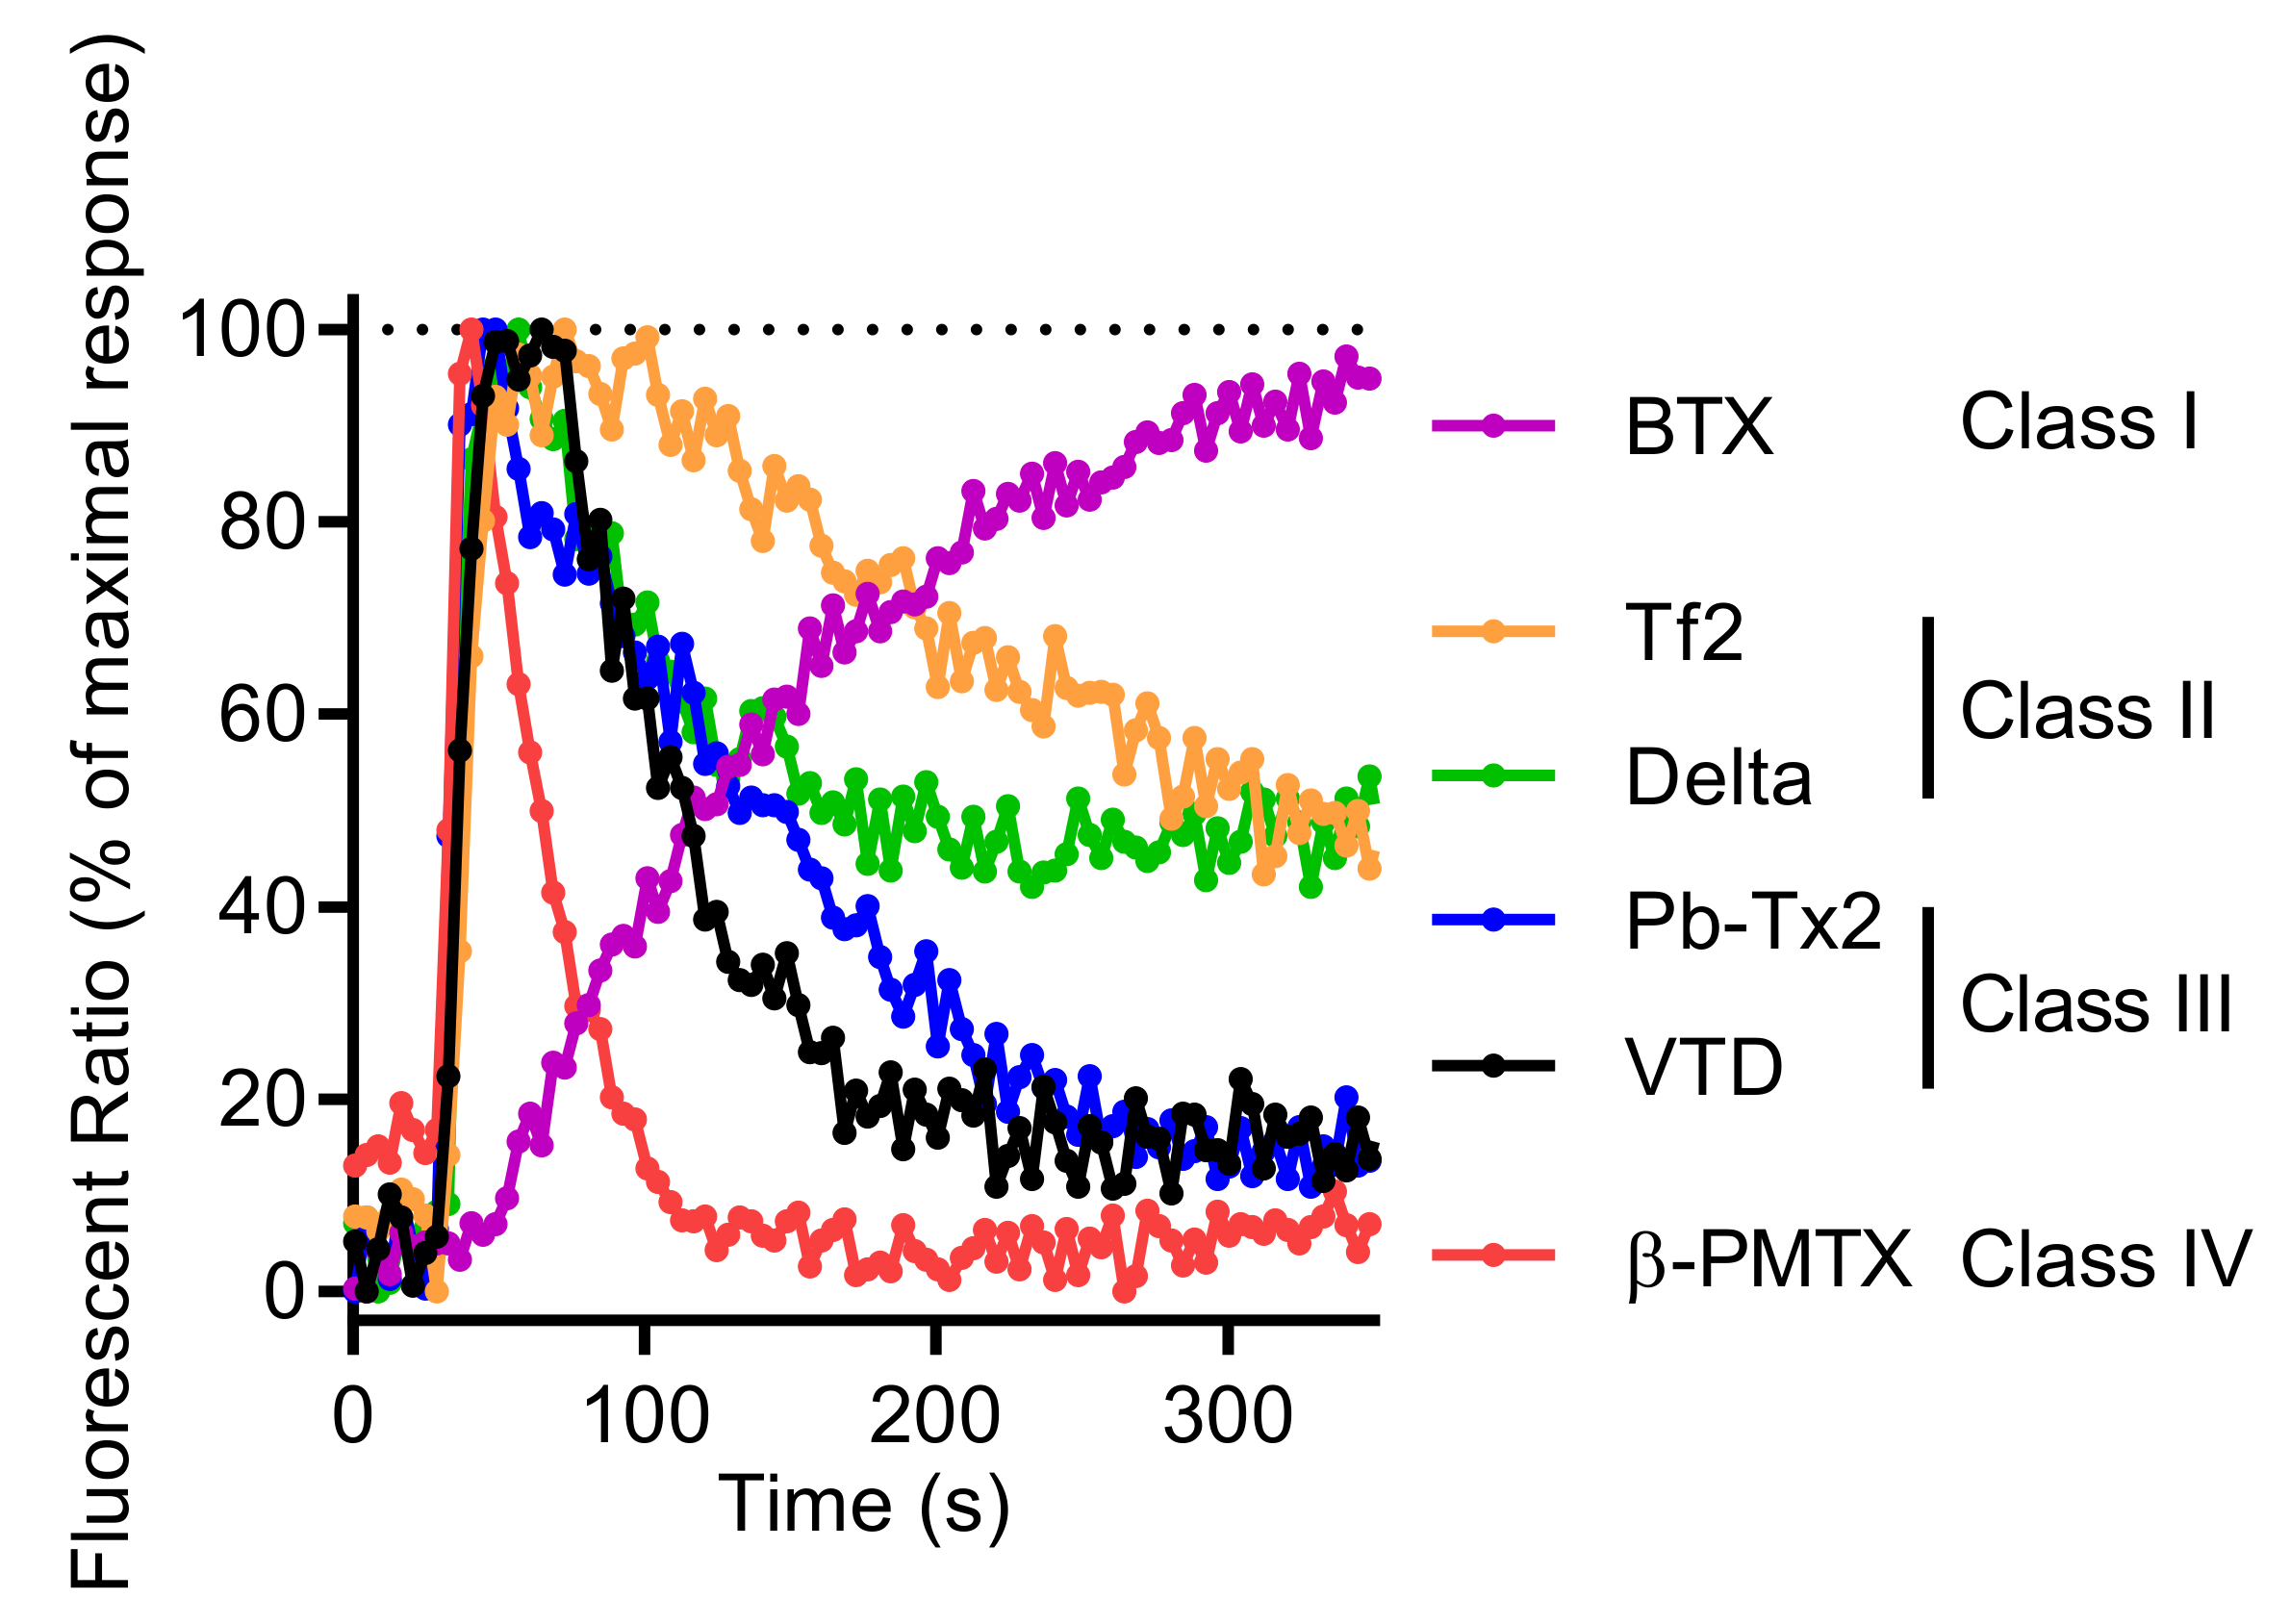
Other neurotoxins activating NaV channels, such as BTX or the β-scorpion toxin Tf2 [32,34], the wasp toxin β-PMTX [31], the marine toxin PbTx-2 [3], and the pyrethroid deltamethrin [54], are also able to increase [Ca2+]i in GH3b6 cells. Moreover, the kinetics of Ca2+ entry exhibited different patterns according to each type of neurotoxin (Figure 10). Since these Ca2+ responses result from membrane depolarization mediated by NaV channels, their distinct kinetics likely reflect the NaV channel gating modification induced by their interaction with these ion channels. For example, although BTX and VTD both bind to Site 2 of open-state NaV channels and block the inactivation process, BTX induced a slow and sustained Ca2+ responses, while VTD triggered rapid Ca2+ responses (Figure 10). This is probably because BTX permanently maintains NaV channels in the open state, whereas VTD behaves as a partial activator, triggering reversible and rapid alteration of the inactivation process [55,56]. Thus, according to the profile of [Ca2+]i elevation kinetics, four types of NaV activator “class” can be distinguished (Figure 10). For class I (BTX), a slow and sustained increase of [Ca2+]i time-rate was observed. For class II (deltamethrin and Tf2 toxin), a rapid [Ca2+]i increase was followed by a slow decrease. For class III (VTD and PbTx-2), intermediate rapid [Ca2+]i elevation kinetics with a peak were seen. Finally, for class IV (β-PMTX), the responses were characterized by a rapid and transient kinetics. Altogether, our model allows the establishment of a “fingerprint” for each class of NaV channel activators.
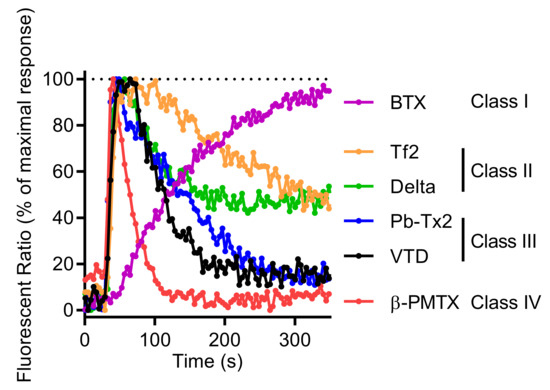
Figure 10.
Comparison of representative Fura-2 fluorescence kinetic traces illustrating the Ca2+ response induced by 0.6 µM of BTX, 0.5 µM of Tf2, 10 µM of deltamethrin (Delta), 3 µM of Pb-TX2, 10 µM of VTD, and 100 µM of 100 µM β-PMTX. Each kinetic trace was normalized against the maximum of signal, given the 100% of maximum response.
This strategy could also be useful to characterize new NaV inhibitors. Indeed, we showed that BIII 890 CL, a use-dependent NaV channel blocker [43,44,45], was able to inhibit the VTD-induced Ca2+ responses. The absence of effects of BIII 890 CL on Bay K8644-induced Ca2+ responses evidenced that BIII 890 CL selectively blocked NaV channels in GH3b6 cells. In addition, the pharmacological profile towards NaV channels has not been described. Our data showed for the first time that BIII 890 CL potently inhibits NaV1.3 channels with IC50 in the micromolar range. Since only one report has shown a similar IC50 (0.6 µM) on NaV1.8 channels [44], its selectivity towards the other NaV channel subtypes deserves to be clarified.
Thus, GH3b6 cells appear as an interesting cellular model, which mainly express the NaV1.3 channel subtype at the physiological level. This particular NaV channel subtype is now considered as an emerging pharmacological therapeutic target for neurological diseases, such as epilepsy or neuropathic pain, after channel upregulation due to spinal cord injury [57,58,59,60]. The β-scorpion toxin Tf2, which selectively activates the NaV1.3 subtype, exhibited the strongest EC50 value in the nanomolar range, highlighting the relevance of the use of this toxin for investigating the implication of this ion channel in pain [32].
The crosstalk between the NaV and CaV channel appears to be advantageous for characterizing the pharmacological properties of toxins or drugs. The pharmacological profile of BIII 890 CL, which has been claimed to be a potent blocker of the NaV channel [43], has not been extensively described. In our assay, we rapidly showed that this drug has no effects on LTCC even at high concentrations. The crosstalk between the NaV and CaV channel has been used in screening test-based assay with SH-SY5Y neuroblastoma cells, which has led to the discovery of potent and selective inhibitors of the NaV1.7 channel subtype [17,61], evidencing the interest in using such a strategy. GH3b6 cells could offer a way to follow in parallel, by monitoring [Ca2+]i with Fura-2, the possibility to screen for ligands of NaV1.3 and LTCC.
4. Materials and Methods
4.1. Chemicals
BTX and TTX were from Latoxan (Valence, France). VTD was from Santa Cruz Biotechnology (Dallas, TX, USA), Tf2 and pompilitoxin (β-PMTX) were purchased from Smartox Biotechnology (Saint Egrève, France) and PbTx-2 was a gift from Andrea Bourdelais (University of North Carolina Wilmington, Wilmington, NC, USA). BIII 890 CL, such as BI 55 CL, was kindly provided by Boehringer Ingelheim (Biberach an der Riss, Germany) and Bay K8644 was from Alomone (Jerusalem, Israel). All other reagents and solvents, including Fura-2 AM, Pluronic®-F127 acid, ICA-121431, SN-6, SEA-0400, deltamethrin, thapsigargin, nifedipine, and cadmium chloride (CdCl2), were obtained from Sigma-Aldrich Merck (Saint-Louis, MO, USA) or Thermo Fisher Scientific (Waltham, MA, USA).
4.2. Cell Line
The GH3b6 cells, a subclone of the rat GH3 pituitary cell line [62], were a generous gift of Dr Françoise Macari (IGF, Montpellier, France). GH3b6 cells were cultured from passage 14 until passage 32 at 37 °C/5% CO2 in Dubelcco’s Modified Eagle Medium (DMEM)/F12 medium (without L-glutamine, with 15 mM HEPES, with 1.2 g/L NaHCO3) (PAN-Biotech, P04-41550) supplemented with 10% fetal bovine serum (Eurobio, CVFSVF00-01), 1 mM L-glutamine (PAN-Biotech, P04-80100), and 1 mM of penicillin/streptomycin (PAN-Biotech, P06-07100) (called DMEM/F12 medium supplemented). GH3b6 cells were routinely cultivated in Flask T75, and when 80% of confluence was reached, split in a ratio of 1/5 in a new Flask T75.DMEM/F12 medium, removed every two or three days, and fresh DMEM/F12 medium supplement added (15 mL for a Flask T75).
4.3. Quantitative Real-Time PCR
First, 100,000 GH3b6 cells per cm2 were seeded in multiwell 6 plates in 2 mL of DMEM/F12 medium supplemented by well until 80% confluence. After 3 days of culture, cells were washed in ice-cold PBS and total RNA from GH3b6 cells was extracted using the RNeasy micro kit (Qiagen, Courtaboeuf, France). In total, 1 µg of total RNA was processed for cDNA synthesis using random hexamers and the QuantiTect Reverse Transcription kit (Qiagen). Real-time PCR assays were assessed on a LightCycler 480 Instrument II (Roche, Meylan, France) using Sybr® Select Master Mix (Applied Biosystems®), 2.5, 5, and 10 ng of cDNA in duplicate, and gene-specific primers (Supplementary Table S1) previously designed using the Primer3 Software. Amplicon sizes (70–106 bp) and AT% (47–55%) were chosen to allow comparison between the relative expression values obtained for each gene [63]. Differences in transcript expression levels were determined using the cycle threshold method, as described earlier [64]. Amplification specificity was confirmed by one peak–melting curve at the end of the amplification process. Relative quantification of gene expression was normalized to the mean of the expression of two validated housekeeping genes using the 2−ΔCt method, where Ct is the threshold cycle: GAPDH (glyceraldehyde-3-phosphate dehydrogenase) and GUSB (beta-glucuronidase). To perform absolute quantification, synthetic cDNA spanning each PCR amplicon were cloned into pUC57 and sequenced to check if their sequences were identical to those deposited in the GenBank (Genecust, Boynes, France). Absolute quantification of mRNA copies was then carried out using the calibration curve method, using the recombinant double-stranded plasmid DNA molecule determination as already described [65]. The plasmid copy numbers of eight dilutions of pure plasmids were used to establish the calibration curves for each gene. The calibration curves were used to evaluate PCR efficiency, which reached 100% for each gene.
4.4. Immunoblot
In total, 100,000 GH3b6 cells per cm2 were seeded in multiwell 6 plates and cultivated in 2 mL of DMEM/F12 medium supplemented by well until 80% confluence. After 3 days of culture, cells were washed, scratched in ice-cold PBS, and lysed in 100 µL of RIPA buffer (150 mM Tris-HCl, 50 mM Tris, 12 mM sodium deoxycholate, 0.1% SDS, 1% Triton X-100, pH 8), supplemented with CompleteTM Mini Protease Inhibitor cocktail (Roche Applied Science, Laval, Quebec). Lysates were centrifuged for 15 min at 15,000 rpm and supernatants were collected. After protein quantification (Pierce™ BCA Protein Assay Kit), 20–50 µg of either GH3b6 cells or rat brain protein extracts were separated by 8% SDS-polyacrylamide gel electrophoresis and were transferred onto a PVDF membrane 0.45 µM (Thermo Fisher Scientific). The primary antibodies used were anti-pan NaV (rabbit, SP19, ASC-003, Alomone labs, Jerusalem, Israel), anti-NaV1.3 (rabbit, ASC-004, Alomone labs or mouse, WH0006328M1, Sigma-Aldrich Merck), and anti-actin used as loading control (mouse, clones AC-203 or AC-74, Sigma-Aldrich Merck). Peroxidase-conjugated secondary antibodies and a PierceTM ECL-Plus Chemiluminescence kit (Thermo Fisher Scientific) were used before visualization using a LAS-3000 imager (Fujifilm, Tokyo, Japan).
4.5. Immunofluorescence Staining
In total, 200,000 cells per cm2 were seeded in a Nunc Lab-Tek chamber slide (Thermo Scientific) and cultivated for 3 days and cultivated until 80% confluence. After being washed with ice-cold PBS, the cells were fixed for 10 min with 4% paraformaldehyde, rinsed with PBS, and incubated in blocking solution (10% BSA in PBS) for one hour at room temperature (RT). Immunofluorescence staining was processed, first overnight at 4 °C using the mouse primary antibody anti-NaV1.3 (1/50, WH0006328M1, Sigma-Aldrich) and then for one hour at RT using goat anti-mouse IgG (H + L) cross-adsorbed Alexa Fluor 488-conjugated secondary antibody (1/200, Invitrogen). Nuclei were stained with DAPI 10 µg/mL (Molecular probes, Invitrogen). The localization and expression of the targeted proteins were visualized using a Nikon Eclipse TE2000S confocal microscope, and the images were analyzed using the Metamorph® software. Control experiments excluding the primary antibody were performed to verify the specificity of the fluorescence.
4.6. Measurement of Intracellular Ca2+
GH3b6 cells were plated at a density of 100,000 cells by well (96 wells black/clear bottom plate) in 100 µL of DMEM/F12 medium supplemented by well. Twenty-four hours after plating, cells were incubated with Fura-2 AM. The Fura-2 AM dye (10 mM, DMSO) was freshly prepared in a Fura-2 buffer composed of Hank’s Balanced Salt Solution (HBSS) supplemented (in mM): 2.5 CaCl2, 1 MgCl2, 10 HEPES-K, and 0.5% BSA (pH 7.4). Cells were first incubated with Fura-2 AM (4 µM) and Pluronic®-F127 acid (0.02%) in Fura-2 buffer for 60 min at RT. After washing, cells were incubated with Fura-2 buffer for 60 min for a complete de-esterification of the dye. The plates were illuminated at 340 and 380 nm excitation wavelengths and the fluorescence emission spectra was recorded at 510 nm using a FlexStation® 3 Benchtop Multi-Mode Microplate Reader. After a 30 s baseline, NaV activators including VTD, BTX, Tf2, PbTx-2, β-PMTX, and deltamethrin and Bay K8644 were automatically injected, and the fluorescence emission spectra were monitored for 320 s at an acquisition frequency of 0.25 Hz. Co-injection of NaV (TTX, BIII 890 CL, or its negative control BI 55 CL) or NCX (SN-6, SEA 0400) or LTCC (nifedipine, CdCl2) inhibitors was achieved with activators. All experiments were performed in triplicate at least twice. Data analysis was performed using the SoftMax Pro 5.4.1 software (Molecular Devices, Sunnyvale, CA, USA).
4.7. Manual Patch-Clamp Experiments
The manual whole-cell patch-clamp technique [66] was used to record inward Na+ currents, using an EPC 10 USB amplifier controlled with PATCHMASTER software (HEKA Elektronik, Lambrecht, Germany). GH3b6 cells were plated at a density of 30,000 cells by glass coverslips and placed in perfusion chamber thermostated at 27 °C. Microelectrodes were prepared by pulling glass capillaries with a resistance of 2.4–2.5 MΩ. The procedure for patch-clamp recordings used in this work followed all recommendations kindly provided by Prof. Stefan H. Heinemann (Friedrich Schiller University of Jena, Jena, Germany) and adapted from previous studies [67,68]. The intracellular solution contained (in mM): 35 CsCl, 80 CsF, 15 NaCl, 10 TEACl, 10 EGTA, and 10 HEPES (pH 7.4, osmolarity 299 mOsm), and the extracellular solution contained (in mM): 140 NaCl, 5 CsCl, 0.2 CdCl2, 2 CaCl2, 1 MgCl2, and 10 HEPES (pH 7.4, osmolarity 290 mOsm).
4.8. High-Throughput Electrophysiology
Automated patch-clamp recordings were performed using the SyncroPatch 384PE from Nanion (München, Germany). Single-hole 384-well recording chips with medium resistance (4.77 ± 0.01 MΩ, n = 384) were used for the recordings of HEK-293 cells stably expressing human NaV1.3 channel or GH3b6 cells (300,000/mL) in a whole-cell configuration. Pulse generation and data collection were performed with the PatchControl384 v1.5.2 software (Nanion) and the Biomek v1.0 interface (Beckman Coulter). Whole-cell recordings were conducted according to the recommended procedures of Nanion. Cells were stored in a cell hotel reservoir at 10 °C with a shaking speed of 60 rpm. After initiating the experiment, cell catching, sealing, whole-cell formation, buffer exchanges, recording, and data acquisition were all performed sequentially and automatically. The intracellular solution contained (in mM): 10 CsCl, 110 CsF, 10 NaCl, 10 EGTA, and 10 HEPES (pH 7.2, osmolarity 280 mOsm), and the extracellular solution contained (in mM): 140 NaCl, 4 KCl, 2 CaCl2, 1 MgCl2, 5 glucose, and 10 HEPES (pH 7.4, osmolarity 298 mOsm). For GH3b6 cells, 10 µM of nifedipine were added to the external buffer to block LTCC. Whole-cell experiments were performed at a holding potential of −100 mV at room temperature (18–22 °C). Currents were sampled at 20 kHz. Tf2 was diluted in external buffer supplemented with 0.3% BSA.
4.9. Data Analysis
All graphs and statistical analysis were established using GraphPad Prism 7.02 (La Jolla, CA, USA). Data are presented as the mean ± SEM, calculated from at least n = 3 replicates and representative of at least 2 or 3 independent experiments. The kinetic traces of Fura-2 fluorescence were plotted as an emission ratio (λex 340 nm/λex 380 nm). Non-linear analysis with variable slope was used to fit the concentration–response data with the Langmuir–Hill equation. For these analyses, the integration of the fluorescence kinetics (area under curve, AUC) obtained with increasing concentrations were used. Normality of the data distribution was evaluated using the Shapiro–Wilk test before choosing parametric or non-parametric tests. Multiple groups were compared by using a one-way analysis of variance (ANOVA) followed by Tukey post-hoc test or a two-way ANOVA followed by a Bonferroni post-hoc test, when appropriate. Differences between independent groups were assessed by using the non-parametric Mann–Whitney test. Differences with p < 0.05 were considered significant (ns: not significant, * for p < 0.05, ** for p < 0.01, *** for p < 0.001, **** for p < 0.0001).
5. Conclusions
Na+ and Ca2+ homeostasis is intimately linked in excitable cells thanks to the crosstalk between Na+ channels, Ca2+ channels, and/or Na+/Ca2+ exchanger. Here, we demonstrated this crosstalk occurs between the NaV1.3 channel subtype and LTCC in the endocrine cell line GH3b6. Thereby, neurotoxins that specifically persistently activate NaV channels induce intracellular Ca2+ overload, which could in turn alter hormone secretion. Moreover, GH3b6 cells represent a convenient model for in vitro characterization of neurotoxins targeting NaV channels and particularly those that could be selective for NaV1.3 by measuring [Ca2+]i levels, thanks to NaV–CaV channels interplay.
Supplementary Materials
The following supporting information can be downloaded at: https://www.mdpi.com/article/10.3390/ijms23020827/s1.
Author Contributions
Conceptualization, C.L. (Christian Legros) and C.L. (Claire Legendre); methodology, C.L. (Christian Legros) and C.L. (Claire Legendre); formal analysis, L.R., C.L. (Christian Legros), C.L. (Claire Legendre) and J.M.; investigation, L.R., J.P., J.M., S.N., E.L.S. and J.K.; resources, C.L. (Christian Legros), K.M., H.D.P.; writing—original draft preparation, C.L. (Christian Legros) and C.L.; writing—review and editing, C.L. (Christian Legros), C.L. (Claire Legendre), L.R., J.M., K.M., H.D.P., H.T.-L., C.M., D.H., Z.F. and M.D.W.; supervision, C.L. (Christian Legros) and C.L. (Claire Legendre); project administration, C.L. (Christian Legros); funding acquisition, C.L. (Christian Legros). All authors have read and agreed to the published version of the manuscript.
Funding
This research was funded by the “Region Pays de la Loire, Paris scientifique 2017, SODIVASC”. J.P. was a recipient PhD fellowship from this grant.
Institutional Review Board Statement
Not applicable.
Informed Consent Statement
Not applicable.
Data Availability Statement
All the data are contained within the article.
Acknowledgments
We are grateful to Andrea Bourdelais (University of North Carolina Wilmington, USA) for kindly provided brevetoxin-2 and to Françoise Macari (IGF, Montpellier, France) for the GH3b6 cell line. We are also grateful to Linda Grimaud and Louis Gourdin for their technical assistance.
Conflicts of Interest
The authors declare no conflict of interest.
Abbreviations
| AUC | area under curve |
| BTX | batrachotoxin |
| INa | Na+ current |
| PbTx | brevetoxin |
| β-PMTX | β-pompidilotoxin |
| CaV channel | voltage-gated Ca2+ channel |
| [Ca2+]i | intracellular Ca2+ concentration |
| GAPDH | glyceraldehyde-3-phosphate dehydrogenase |
| GUSB | beta-glucuronidase |
| LTCC | L-type voltage-gated Ca2+ channel |
| NaV channel | voltage-gated Na+ channel |
| NCX | Na+/Ca2+ exchanger |
| TTX | tetrodotoxin |
| TTX-S | sensitive to tetrodotoxin |
| TTX-R | resistant to tetrodotoxin; |
| VTD | veratridine |
References
- Hille, B. Ion Channels of Excitable Membranes; Sinauer: Sunderland, MA, USA, 2001; p. 507. [Google Scholar]
- De Lera Ruiz, M.; Kraus, R.L. Voltage-Gated Sodium Channels: Structure, Function, Pharmacology, and Clinical Indications. J. Med. Chem. 2015, 58, 7093–7118. [Google Scholar] [CrossRef]
- Mattei, C.; Legros, C. The Voltage-Gated Sodium Channel: A Major Target of Marine Neurotoxins. Toxicon 2014, 91, 84–95. [Google Scholar] [CrossRef] [Green Version]
- Catterall, W.A.; Goldin, A.L.; Waxman, S.G. International Union of Pharmacology. XLVII. Nomenclature and Structure-Function Relationships of Voltage-Gated Sodium Channels. Pharmacol. Rev. 2005, 57, 397–409. [Google Scholar] [CrossRef] [PubMed]
- Goldin, A.L. Evolution of Voltage-Gated Na+ Channels. J. Exp. Biol. 2002, 205, 575–584. [Google Scholar] [CrossRef] [PubMed]
- Chahine, M.; O’Leary, M.E. Regulatory Role of Voltage-Gated Na Channel β Subunits in Sensory Neurons. Front. Pharmacol. 2011, 2, 70. [Google Scholar] [CrossRef] [Green Version]
- Bajaj, S.; Ong, S.T.; Chandy, K.G. Contributions of Natural Products to Ion Channel Pharmacology. Nat. Prod. Rep. 2020, 37, 703–716. [Google Scholar] [CrossRef]
- England, S.; de Groot, M.J. Subtype-Selective Targeting of Voltage-Gated Sodium Channels. Br. J. Pharmacol. 2009, 158, 1413–1425. [Google Scholar] [CrossRef] [Green Version]
- Berman, F.W.; Murray, T.F. Brevetoxin-Induced Autocrine Excitotoxicity Is Associated with Manifold Routes of Ca2+ Influx. J. Neurochem. 2000, 74, 1443–1451. [Google Scholar] [CrossRef] [PubMed] [Green Version]
- Dravid, S.M.; Baden, D.G.; Murray, T.F. Brevetoxin Activation of Voltage-Gated Sodium Channels Regulates Ca Dynamics and ERK1/2 Phosphorylation in Murine Neocortical Neurons. J. Neurochem. 2004, 89, 739–749. [Google Scholar] [CrossRef] [Green Version]
- Fekete, Á.; Franklin, L.; Ikemoto, T.; Rózsa, B.; Lendvai, B.; Vizi, E.S.; Zelles, T. Mechanism of the Persistent Sodium Current Activator Veratridine-evoked Ca2+ Elevation: Implication for Epilepsy. J. Neurochem. 2009, 111, 745–756. [Google Scholar] [CrossRef] [PubMed]
- Li, W.I.; Berman, F.W.; Okino, T.; Yokokawa, F.; Shioiri, T.; Gerwick, W.H.; Murray, T.F. Antillatoxin Is a Marine Cyanobacterial Toxin That Potently Activates Voltage-Gated Sodium Channels. Proc. Natl. Acad. Sci. USA 2001, 98, 7599–7604. [Google Scholar] [CrossRef] [Green Version]
- Meder, W.; Fink, K.; Zentner, J.; Göthert, M. Calcium Channels Involved in K+- and Veratridine-Induced Increase of Cytosolic Calcium Concentration in Human Cerebral Cortical Synaptosomes. J. Pharmacol. Exp. Ther. 1999, 290, 1126–1131. [Google Scholar] [PubMed]
- George, J.; Baden, D.G.; Gerwick, W.H.; Murray, T.F. Bidirectional Influence of Sodium Channel Activation on NMDA Receptor-Dependent Cerebrocortical Neuron Structural Plasticity. Proc. Natl. Acad. Sci. USA 2012, 109, 19840–19845. [Google Scholar] [CrossRef] [PubMed] [Green Version]
- Kopper, K.L.; Adorante, J.S. Regulation of Intracellular Calcium in N1E-115 Neuroblastoma Cells: The Role of Na+/Ca2+ Exchange. Am. J. Physiol. Cell Physiol. 2002, 282, C1000–C1008. [Google Scholar] [CrossRef] [Green Version]
- LePage, K.T.; Goeger, D.; Yokokawa, F.; Asano, T.; Shioiri, T.; Gerwick, W.H.; Murray, T.F. The Neurotoxic Lipopeptide Kalkitoxin Interacts with Voltage-Sensitive Sodium Channels in Cerebellar Granule Neurons. Toxicol. Lett. 2005, 158, 133–139. [Google Scholar] [CrossRef]
- Vetter, I.; Mozar, C.A.; Durek, T.; Wingerd, J.S.; Alewood, P.F.; Christie, M.J.; Lewis, R.J. Characterisation of Na(v) Types Endogenously Expressed in Human SH-SY5Y Neuroblastoma Cells. Biochem. Pharmacol. 2012, 83, 1562–1571. [Google Scholar] [CrossRef]
- Fletcher, P.A.; Sherman, A.; Stojilkovic, S.S. Common and Diverse Elements of Ion Channels and Receptors Underlying Electrical Activity in Endocrine Pituitary Cells. Mol. Cell. Endocrinol. 2018, 463, 23–36. [Google Scholar] [CrossRef] [PubMed]
- Verkhratsky, A.; Trebak, M.; Perocchi, F.; Khananshvili, D.; Sekler, I. Crosslink between Calcium and Sodium Signalling. Exp. Physiol. 2018, 103, 157–169. [Google Scholar] [CrossRef]
- Szabat, M.; Modi, H.; Ramracheya, R.; Girbinger, V.; Chan, F.; Lee, J.T.C.; Piske, M.; Kamal, S.; Carol Yang, Y.H.; Welling, A.; et al. High-Content Screening Identifies a Role for Na+ Channels in Insulin Production. R. Soc. Open Sci. 2015, 2, 150306. [Google Scholar] [CrossRef] [PubMed] [Green Version]
- Vandael, D.H.F.; Ottaviani, M.M.; Legros, C.; Lefort, C.; Guérineau, N.C.; Allio, A.; Carabelli, V.; Carbone, E. Reduced Availability of Voltage-Gated Sodium Channels by Depolarization or Blockade by Tetrodotoxin Boosts Burst Firing and Catecholamine Release in Mouse Chromaffin Cells. J. Physiol. 2015, 593, 905–927. [Google Scholar] [CrossRef] [Green Version]
- Stojilkovic, S.S.; Bjelobaba, I.; Zemkova, H. Ion Channels of Pituitary Gonadotrophs and Their Roles in Signaling and Secretion. Front. Endocrinol. 2017, 8, 126. [Google Scholar] [CrossRef] [Green Version]
- Zhang, Q.; Chibalina, M.V.; Bengtsson, M.; Groschner, L.N.; Ramracheya, R.; Rorsman, N.J.G.; Leiss, V.; Nassar, M.A.; Welling, A.; Gribble, F.M.; et al. Na+ Current Properties in Islet α- and β-Cells Reflect Cell-Specific Scn3a and Scn9a Expression. J. Physiol. 2014, 592, 4677–4696. [Google Scholar] [CrossRef] [PubMed]
- Beltran-Parrazal, L.; Charles, A. Riluzole Inhibits Spontaneous Ca2+ Signaling in Neuroendocrine Cells by Activation of K+ Channels and Inhibition of Na+ Channels. Br. J. Pharmacol. 2003, 140, 881–888. [Google Scholar] [CrossRef] [Green Version]
- Campos, F.V.; Coronas, F.I.V.; Beirão, P.S.L. Voltage-Dependent Displacement of the Scorpion Toxin Ts3 from Sodium Channels and Its Implication on the Control of Inactivation. Br. J. Pharmacol. 2004, 142, 1115–1122. [Google Scholar] [CrossRef] [Green Version]
- Kushmerick, C.; Romano-Silva, M.A.; Gomez, M.V.; Prado, M.A. Changes in Ca2+ Channel Expression upon Differentiation of SN56 Cholinergic Cells. Brain Res. 2001, 916, 199–210. [Google Scholar] [CrossRef]
- Dubinsky, J.M.; Oxford, G.S. Ionic Currents in Two Strains of Rat Anterior Pituitary Tumor Cells. J. Gen. Physiol. 1984, 83, 309–339. [Google Scholar] [CrossRef] [PubMed] [Green Version]
- Matteson, D.R.; Armstrong, C.M. Na and Ca Channels in a Transformed Line of Anterior Pituitary Cells. J. Gen. Physiol. 1984, 83, 371–394. [Google Scholar] [CrossRef] [PubMed] [Green Version]
- Kushmerick, C.; Kalapothakis, E.; Beirão, P.S.; Penaforte, C.L.; Prado, V.F.; Cruz, J.S.; Diniz, C.R.; Cordeiro, M.N.; Gomez, M.V.; Romano-Silva, M.A.; et al. Phoneutria Nigriventer Toxin Tx3-1 Blocks A-Type K+ Currents Controlling Ca2+ Oscillation Frequency in GH3 Cells. J. Neurochem. 1999, 72, 1472–1481. [Google Scholar] [CrossRef] [PubMed]
- Theile, J.W.; Cummins, T.R. Recent Developments Regarding Voltage-Gated Sodium Channel Blockers for the Treatment of Inherited and Acquired Neuropathic Pain Syndromes. Front. Pharmacol. 2011, 2, 54. [Google Scholar] [CrossRef] [Green Version]
- Garrison, C.E.; Guan, W.; Kato, M.; Tamsett, T.; Patel, T.; Sun, Y.; Pathak, T.P. Structure-Activity Relationship Evaluation of Wasp Toxin β-PMTX Leads to Analogs with Superior Activity for Human Neuronal Sodium Channels. ACS Med. Chem. Lett. 2020, 11, 353–357. [Google Scholar] [CrossRef]
- Israel, M.R.; Dash, T.S.; Bothe, S.N.; Robinson, S.D.; Deuis, J.R.; Craik, D.J.; Lampert, A.; Vetter, I.; Durek, T. Characterization of Synthetic Tf2 as a NaV1.3 Selective Pharmacological Probe. Biomedicines 2020, 8, 155. [Google Scholar] [CrossRef]
- McCormack, K.; Santos, S.; Chapman, M.L.; Krafte, D.S.; Marron, B.E.; West, C.W.; Krambis, M.J.; Antonio, B.M.; Zellmer, S.G.; Printzenhoff, D.; et al. Voltage Sensor Interaction Site for Selective Small Molecule Inhibitors of Voltage-Gated Sodium Channels. Proc. Natl. Acad. Sci. USA 2013, 110, E2724–E2732. [Google Scholar] [CrossRef] [Green Version]
- Camargos, T.S.; Bosmans, F.; Rego, S.C.; Mourão, C.B.F.; Schwartz, E.F. The Scorpion Toxin Tf2 from Tityus Fasciolatus Promotes Nav1.3 Opening. PLoS ONE 2015, 10, e0128578. [Google Scholar] [CrossRef] [Green Version]
- Kinoshita, E.; Maejima, H.; Yamaoka, K.; Konno, K.; Kawai, N.; Shimizu, E.; Yokote, S.; Nakayama, H.; Seyama, I. Novel Wasp Toxin Discriminates between Neuronal and Cardiac Sodium Channels. Mol. Pharmacol. 2001, 59, 1457–1463. [Google Scholar] [CrossRef] [PubMed] [Green Version]
- Schiavon, E.; Stevens, M.; Zaharenko, A.J.; Konno, K.; Tytgat, J.; Wanke, E. Voltage-Gated Sodium Channel Isoform-Specific Effects of Pompilidotoxins. FEBS J. 2010, 277, 918–930. [Google Scholar] [CrossRef]
- White, R.J.; Reynolds, I.J. Mitochondria and Na+/Ca2+ Exchange Buffer Glutamate-Induced Calcium Loads in Cultured Cortical Neurons. J. Neurosci. 1995, 15, 1318–1328. [Google Scholar] [CrossRef] [Green Version]
- Tanaka, H.; Nishimaru, K.; Aikawa, T.; Hirayama, W.; Tanaka, Y.; Shigenobu, K. Effect of SEA0400, a Novel Inhibitor of Sodium-Calcium Exchanger, on Myocardial Ionic Currents. Br. J. Pharmacol. 2002, 135, 1096–1100. [Google Scholar] [CrossRef] [Green Version]
- Iwamoto, T.; Inoue, Y.; Ito, K.; Sakaue, T.; Kita, S.; Katsuragi, T. The Exchanger Inhibitory Peptide Region-Dependent Inhibition of Na+/Ca2+ Exchange by SN-6 [2-[4-(4-Nitrobenzyloxy)Benzyl]Thiazolidine-4-Carboxylic Acid Ethyl Ester], a Novel Benzyloxyphenyl Derivative. Mol. Pharmacol. 2004, 66, 45–55. [Google Scholar] [CrossRef] [PubMed] [Green Version]
- Iwamoto, T.; Kita, S.; Uehara, A.; Imanaga, I.; Matsuda, T.; Baba, A.; Katsuragi, T. Molecular Determinants of Na+/Ca2+ Exchange (NCX1) Inhibition by SEA0400. J. Biol. Chem. 2004, 279, 7544–7553. [Google Scholar] [CrossRef] [PubMed] [Green Version]
- Glassmeier, G.; Hauber, M.; Wulfsen, I.; Weinsberg, F.; Bauer, C.K.; Schwarz, J.R. Ca2+ Channels in Clonal Rat Anterior Pituitary Cells (GH3/B6). Pflug. Arch. 2001, 442, 577–587. [Google Scholar]
- Safa, P.; Boulter, J.; Hales, T.G. Functional Properties of Cav1.3 (Alpha1D) L-Type Ca2+ Channel Splice Variants Expressed by Rat Brain and Neuroendocrine GH3 Cells. J. Biol. Chem. 2001, 276, 38727–38737. [Google Scholar] [CrossRef] [PubMed] [Green Version]
- Carter, A.J.; Grauert, M.; Pschorn, U.; Bechtel, W.D.; Bartmann-Lindholm, C.; Qu, Y.; Scheuer, T.; Catterall, W.A.; Weiser, T. Potent Blockade of Sodium Channels and Protection of Brain Tissue from Ischemia by BIII 890 CL. Proc. Natl. Acad. Sci. USA 2000, 97, 4944–4949. [Google Scholar] [CrossRef] [PubMed] [Green Version]
- Dekker, L.V.; Daniels, Z.; Hick, C.; Elsegood, K.; Bowden, S.; Szestak, T.; Burley, J.R.; Southan, A.; Cronk, D.; James, I.F. Analysis of Human Nav1.8 Expressed in SH-SY5Y Neuroblastoma Cells. Eur. J. Pharmacol. 2005, 528, 52–58. [Google Scholar] [CrossRef]
- Laird, J.M.A.; Carter, A.J.; Grauert, M.; Cervero, F. Analgesic Activity of a Novel Use-Dependent Sodium Channel Blocker, Crobenetine, in Mono-Arthritic Rats: Sodium Channel Blockers in Arthritic Rats. Br. J. Pharmacol. 2001, 134, 1742–1748. [Google Scholar] [CrossRef] [Green Version]
- Cusdin, F.S.; Nietlispach, D.; Maman, J.; Dale, T.J.; Powell, A.J.; Clare, J.J.; Jackson, A.P. The Sodium Channel {beta}3-Subunit Induces Multiphasic Gating in NaV1.3 and Affects Fast Inactivation via Distinct Intracellular Regions. J. Biol. Chem. 2010, 285, 33404–33412. [Google Scholar] [CrossRef] [PubMed] [Green Version]
- Shah, B.S.; Stevens, E.B.; Pinnock, R.D.; Dixon, A.K.; Lee, K. Developmental Expression of the Novel Voltage-Gated Sodium Channel Auxiliary Subunit Beta3, in Rat CNS. J. Physiol. 2001, 534, 763–776. [Google Scholar] [CrossRef]
- Baroni, D.; Moran, O. Molecular Differential Expression of Voltage-Gated Sodium Channel α and β Subunit MRNAs in Five Different Mammalian Cell Lines. J. Bioenerg. Biomembr. 2011, 43, 729–738. [Google Scholar] [CrossRef]
- Vega, A.V.; Espinosa, J.L.; López-Domínguez, A.M.; López-Santiago, L.F.; Navarrete, A.; Cota, G. L-Type Calcium Channel Activation up-Regulates the MRNAs for Two Different Sodium Channel α Subunits (Nav1.2 and Nav1.3) in Rat Pituitary GH3 Cells. Brain Res. 2003, 116, 115–125. [Google Scholar] [CrossRef]
- Cummins, T.R.; Aglieco, F.; Renganathan, M.; Herzog, R.I.; Dib-Hajj, S.D.; Waxman, S.G. Nav1.3 Sodium Channels: Rapid Repriming and Slow Closed-State Inactivation Display Quantitative Differences after Expression in a Mammalian Cell Line and in Spinal Sensory Neurons. J. Neurosci. 2001, 21, 5952–5961. [Google Scholar] [CrossRef] [Green Version]
- Estacion, M.; Waxman, S.G. The Response of Na V 1.3 Sodium Channels to Ramp Stimuli: Multiple Components and Mechanisms. J. Neurophysiol. 2013, 109, 306–314. [Google Scholar] [CrossRef] [Green Version]
- Hobai, I.A.; Bates, J.A.; Howarth, F.C.; Levi, A.J. Inhibition by External Cd2+ of Na/Ca Exchange and L-Type Ca Channel in Rabbit Ventricular Myocytes. Am. J. Physiol. 1997, 272, H2164–H2172. [Google Scholar] [CrossRef] [PubMed]
- Shen, J.B.; Jiang, B.; Pappano, A.J. Comparison of L-Type Calcium Channel Blockade by Nifedipine and/or Cadmium in Guinea Pig Ventricular Myocytes. J. Pharmacol. Exp. Ther. 2000, 294, 562–570. [Google Scholar] [PubMed]
- Meacham, C.; Brodfuehrer, P.; Watkins, J.; Shafer, T. Developmentally-Regulated Sodium Channel Subunits Are Differentially Sensitive to α-Cyano Containing Pyrethroids. Toxicol. Appl. Pharmacol. 2008, 231, 273–281. [Google Scholar] [CrossRef] [PubMed]
- Catterall, W.A. Membrane Potential-Dependent Binding of Scorpion Toxin to the Action Potential Na+ Ionophore. Studies with a Toxin Derivative Prepared by Lactoperoxidase-Catalyzed Iodination. J. Biol. Chem. 1977, 252, 8660–8668. [Google Scholar] [CrossRef]
- Weinsberg, F.; Bauer, C.K.; Schwarz, J.R. The Class III Antiarrhythmic Agent E-4031 Selectively Blocks the Inactivating Inward-Rectifying Potassium Current in Rat Anterior Pituitary Tumor Cells (GH3/B6 Cells). Pflug. Arch. 1997, 434, 1–10. [Google Scholar] [CrossRef]
- Hains, B.C.; Waxman, S.G. Sodium Channel Expression and the Molecular Pathophysiology of Pain after SCI. Prog. Brain Res. 2007, 161, 195–203. [Google Scholar] [CrossRef]
- Luiz, A.P.; Wood, J.N. Sodium Channels in Pain and Cancer: New Therapeutic Opportunities. Adv. Pharmacol. 2016, 75, 153–178. [Google Scholar] [CrossRef]
- Su, S.; Shao, J.; Zhao, Q.; Ren, X.; Cai, W.; Li, L.; Bai, Q.; Chen, X.; Xu, B.; Wang, J.; et al. MiR-30b Attenuates Neuropathic Pain by Regulating Voltage-Gated Sodium Channel Nav1.3 in Rats. Front. Mol. Neurosci. 2017, 10, 126. [Google Scholar] [CrossRef]
- Yang, L.; Li, Q.; Liu, X.; Liu, S. Roles of Voltage-Gated Tetrodotoxin-Sensitive Sodium Channels NaV1.3 and NaV1.7 in Diabetes and Painful Diabetic Neuropathy. Int. J. Mol. Sci. 2016, 17, 1479. [Google Scholar] [CrossRef] [PubMed] [Green Version]
- Klint, J.K.; Smith, J.J.; Vetter, I.; Rupasinghe, D.B.; Er, S.Y.; Senff, S.; Herzig, V.; Mobli, M.; Lewis, R.J.; Bosmans, F.; et al. Seven Novel Modulators of the Analgesic Target NaV 1.7 Uncovered Using a High-Throughput Venom-Based Discovery Approach. Br. J. Pharmacol. 2015, 172, 2445–2458. [Google Scholar] [CrossRef] [Green Version]
- Tashjian, A.H. Clonal Strains of Hormone-Producing Pituitary Cells. Meth. Enzymol. 1979, 58, 527–535. [Google Scholar]
- Colborn, J.M.; Byrd, B.D.; Koita, O.A.; Krogstad, D.J. Estimation of Copy Number Using SYBR Green: Confounding by AT-Rich DNA and by Variation in Amplicon Length. Am. J. Trop. Med. Hyg. 2008, 79, 887–892. [Google Scholar] [CrossRef]
- Morrison, T.B.; Weis, J.J.; Wittwer, C.T. Quantification of Low-Copy Transcripts by Continuous SYBR Green I Monitoring during Amplification. BioTechniques 1998, 24, 954–958. [Google Scholar]
- Pfaffl, M.W. A New Mathematical Model for Relative Quantification in Real-Time RT-PCR. Nucleic Acids Res. 2001, 29, e45. [Google Scholar] [CrossRef]
- Hamill, O.P.; Marty, A.; Neher, E.; Sakmann, B.; Sigworth, F.J. Improved Patch-Clamp Techniques for High-Resolution Current Recording from Cells and Cell-Free Membrane Patches. Pflug. Arch.-Eur. J. Physiol. 1981, 391, 85–100. [Google Scholar] [CrossRef] [PubMed]
- Leipold, E.; Hansel, A.; Borges, A.; Heinemann, S.H. Subtype Specificity of Scorpion β-Toxin Tz1 Interaction with Voltage-Gated Sodium Channels Is Determined by the Pore Loop of Domain 3. Mol. Pharmacol. 2006, 70, 340–347. [Google Scholar] [CrossRef] [PubMed] [Green Version]
- Leipold, E.; Borges, A.; Heinemann, S.H. Scorpion β-Toxin Interference with NaV Channel Voltage Sensor Gives Rise to Excitatory and Depressant Modes. J. Gen. Physiol. 2012, 139, 305–319. [Google Scholar] [CrossRef] [Green Version]
Publisher’s Note: MDPI stays neutral with regard to jurisdictional claims in published maps and institutional affiliations. |
© 2022 by the authors. Licensee MDPI, Basel, Switzerland. This article is an open access article distributed under the terms and conditions of the Creative Commons Attribution (CC BY) license (https://creativecommons.org/licenses/by/4.0/).

