
Dynamic Regulation of Mitochondrial [Ca2+] in Hippocampal Neurons
 , and
, and 
Abstract
:1. Introduction
2. Results
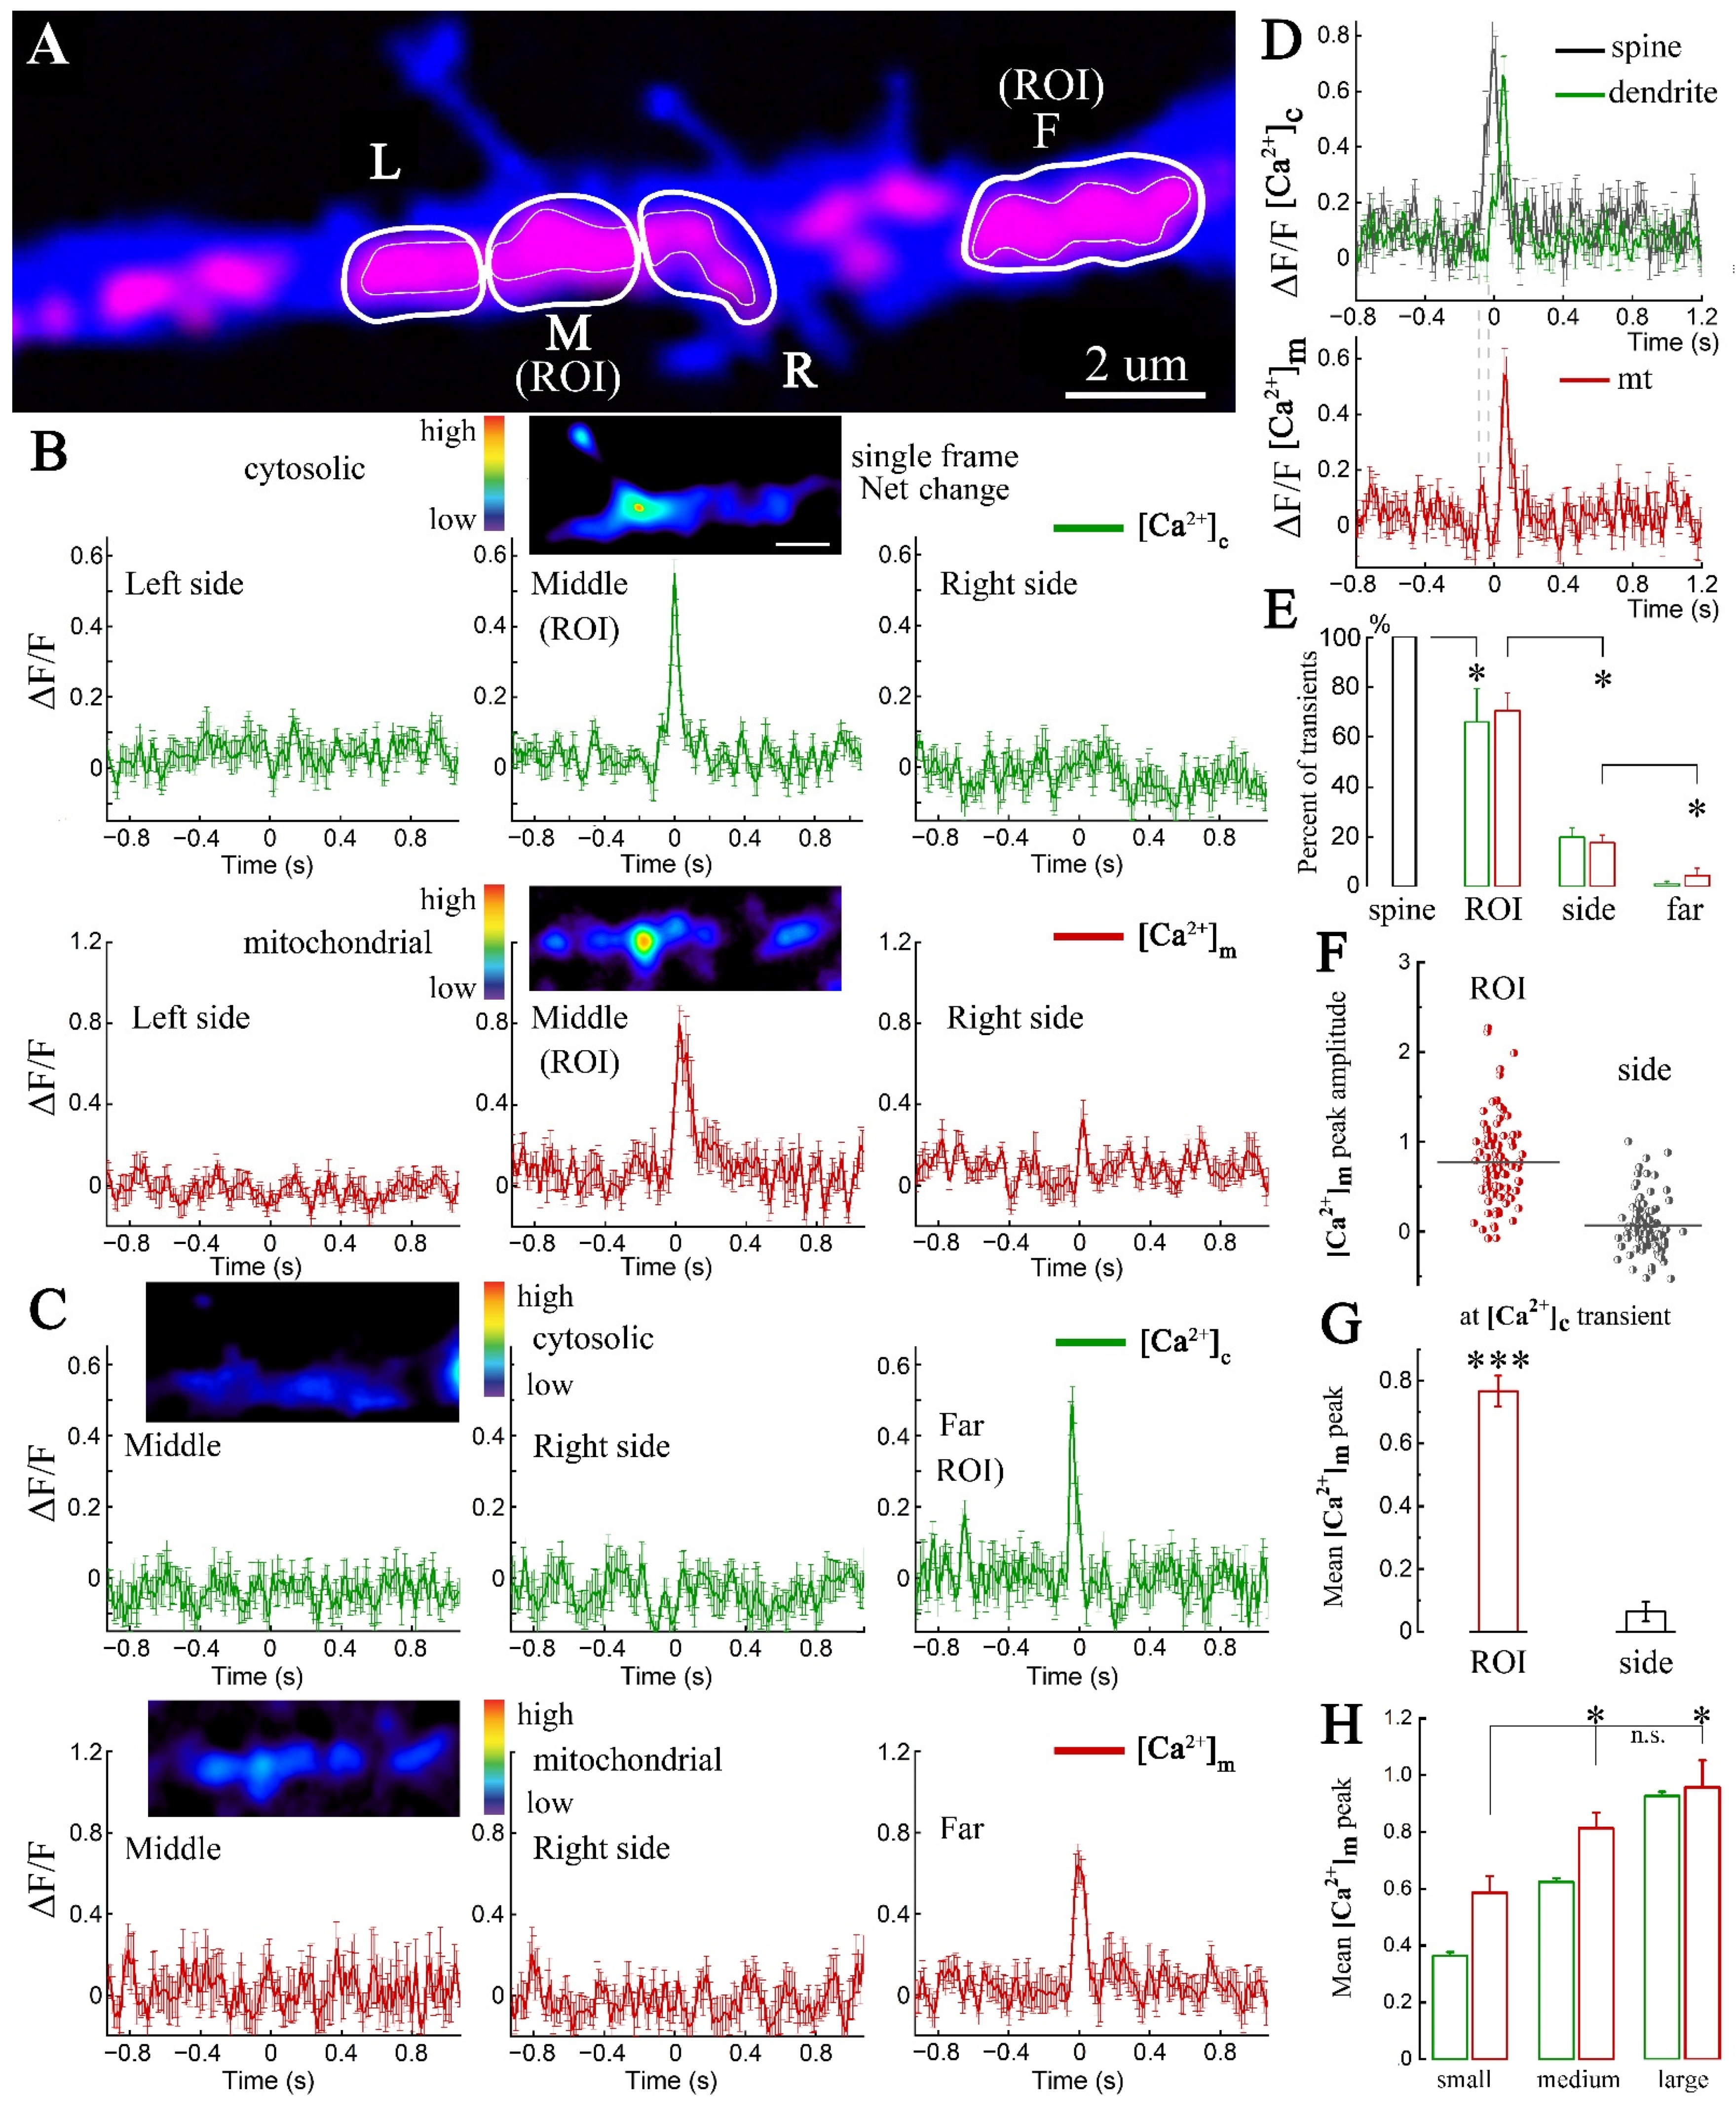
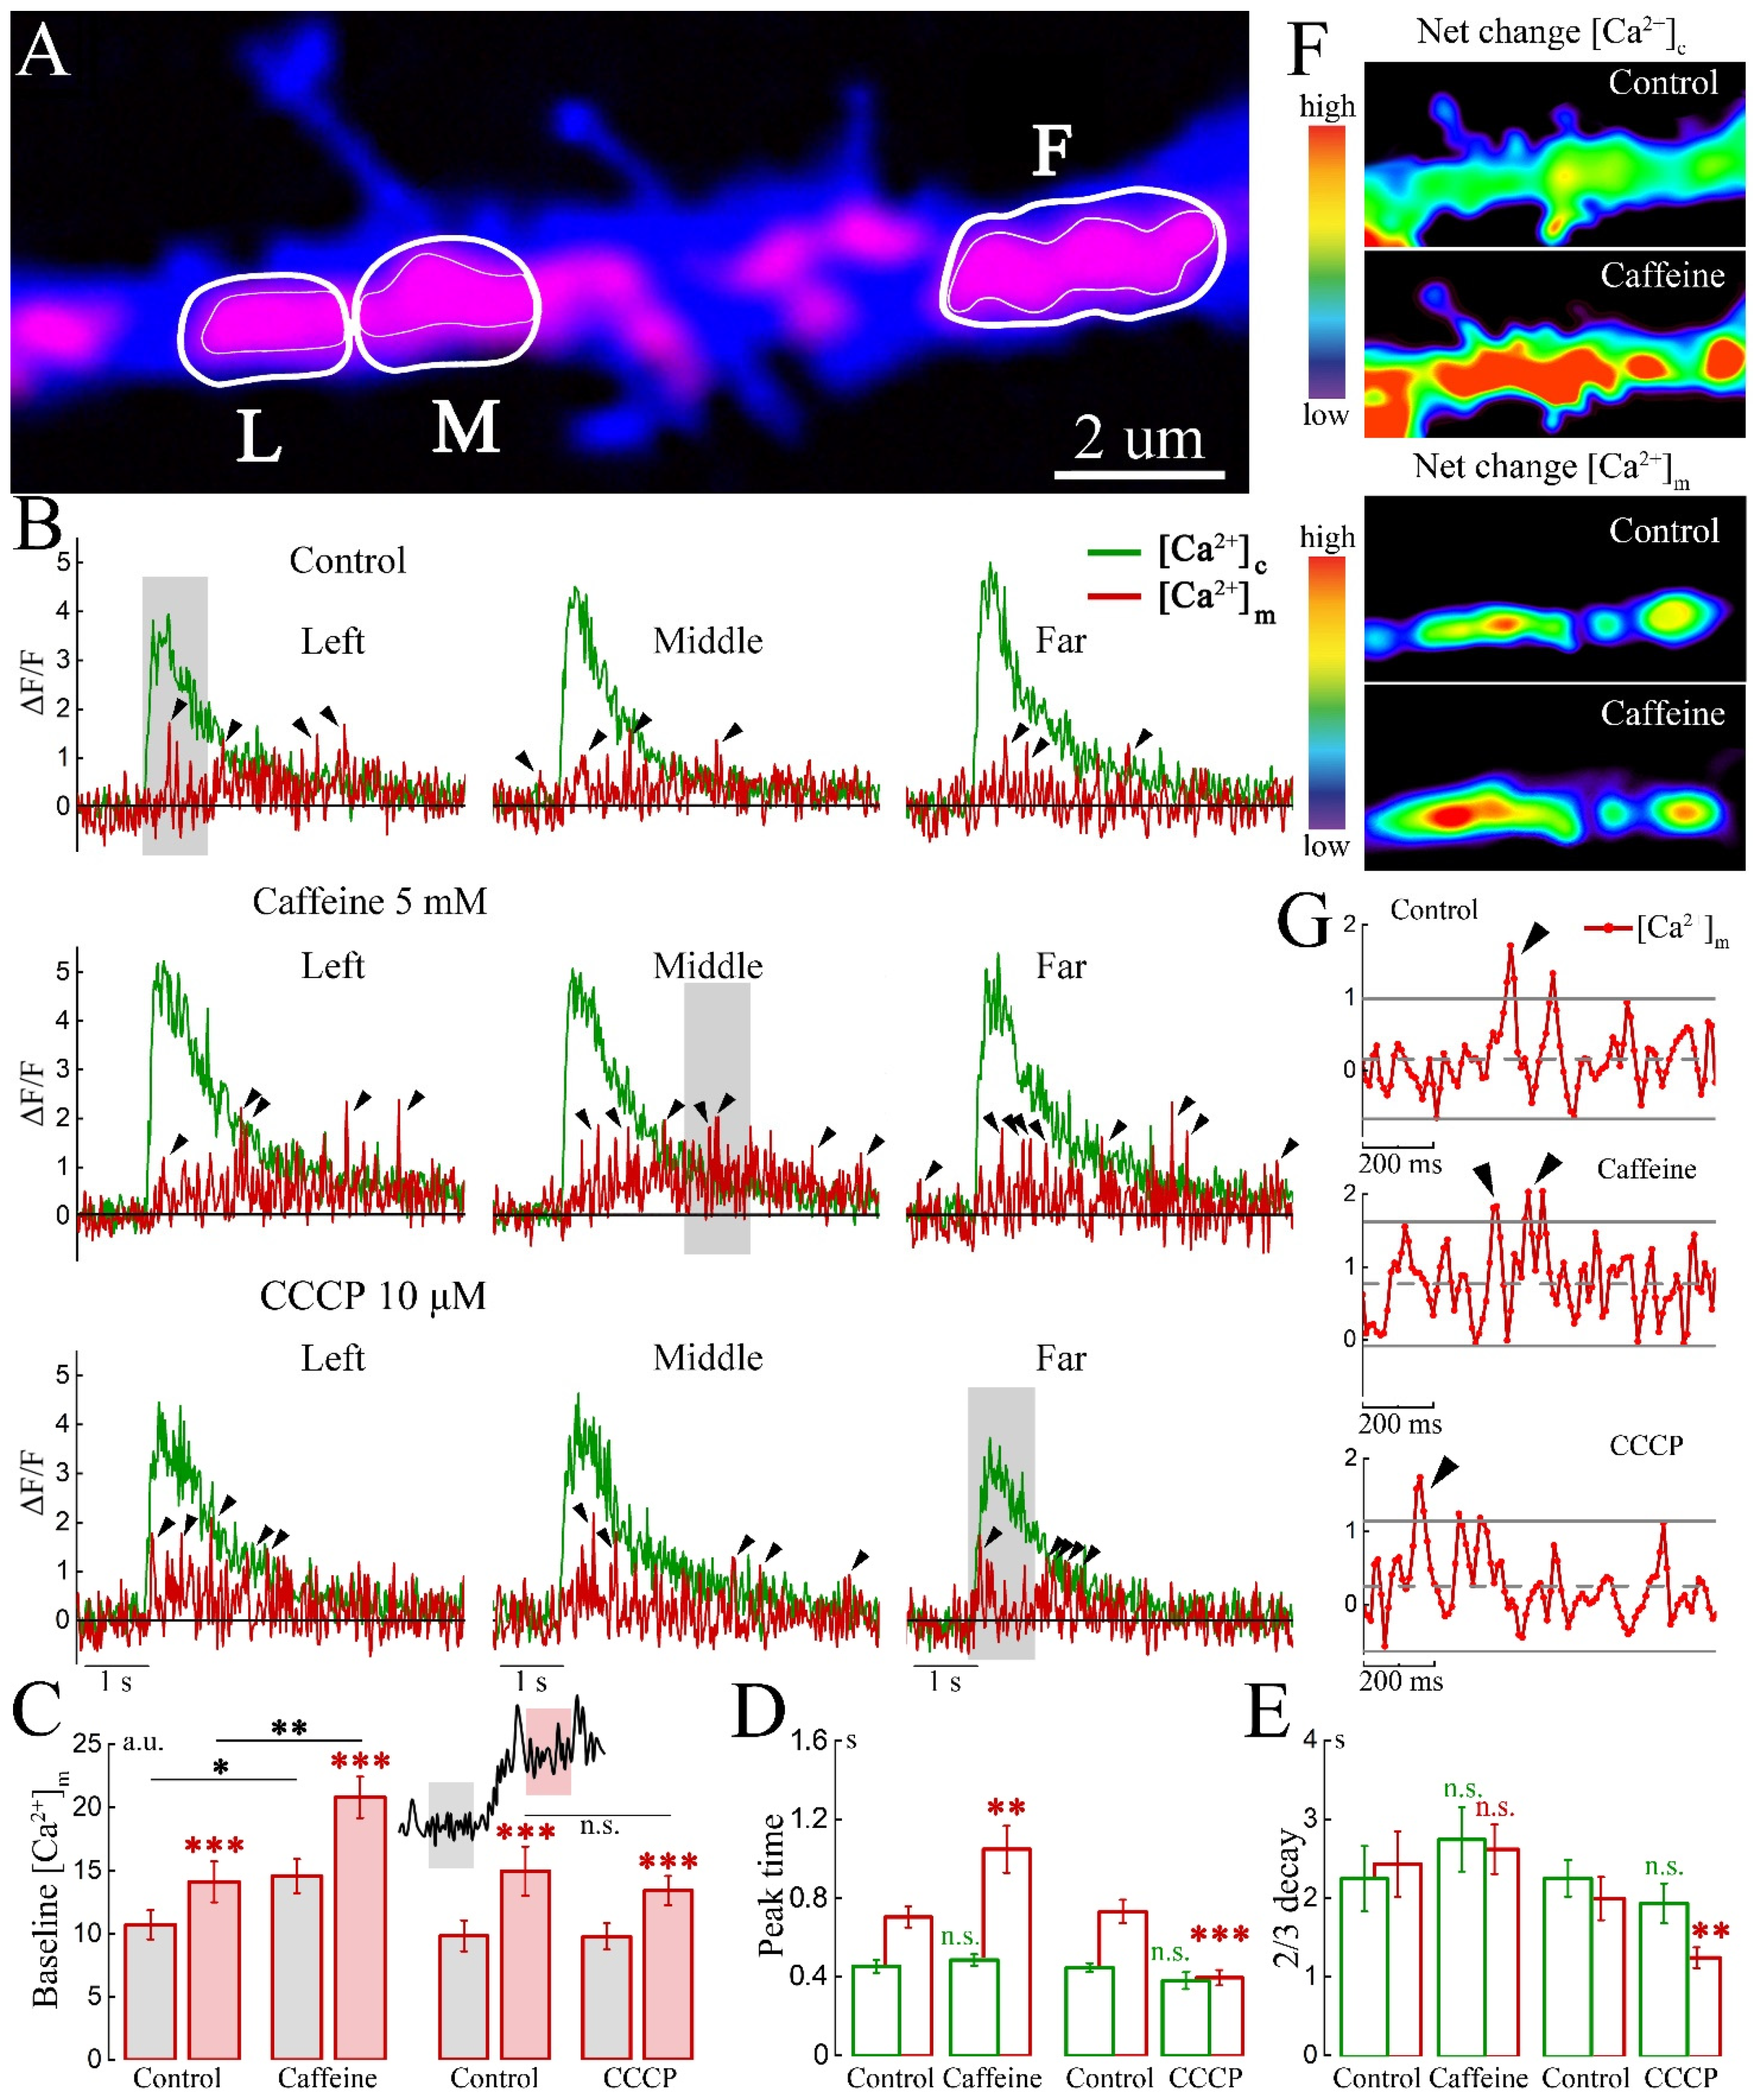
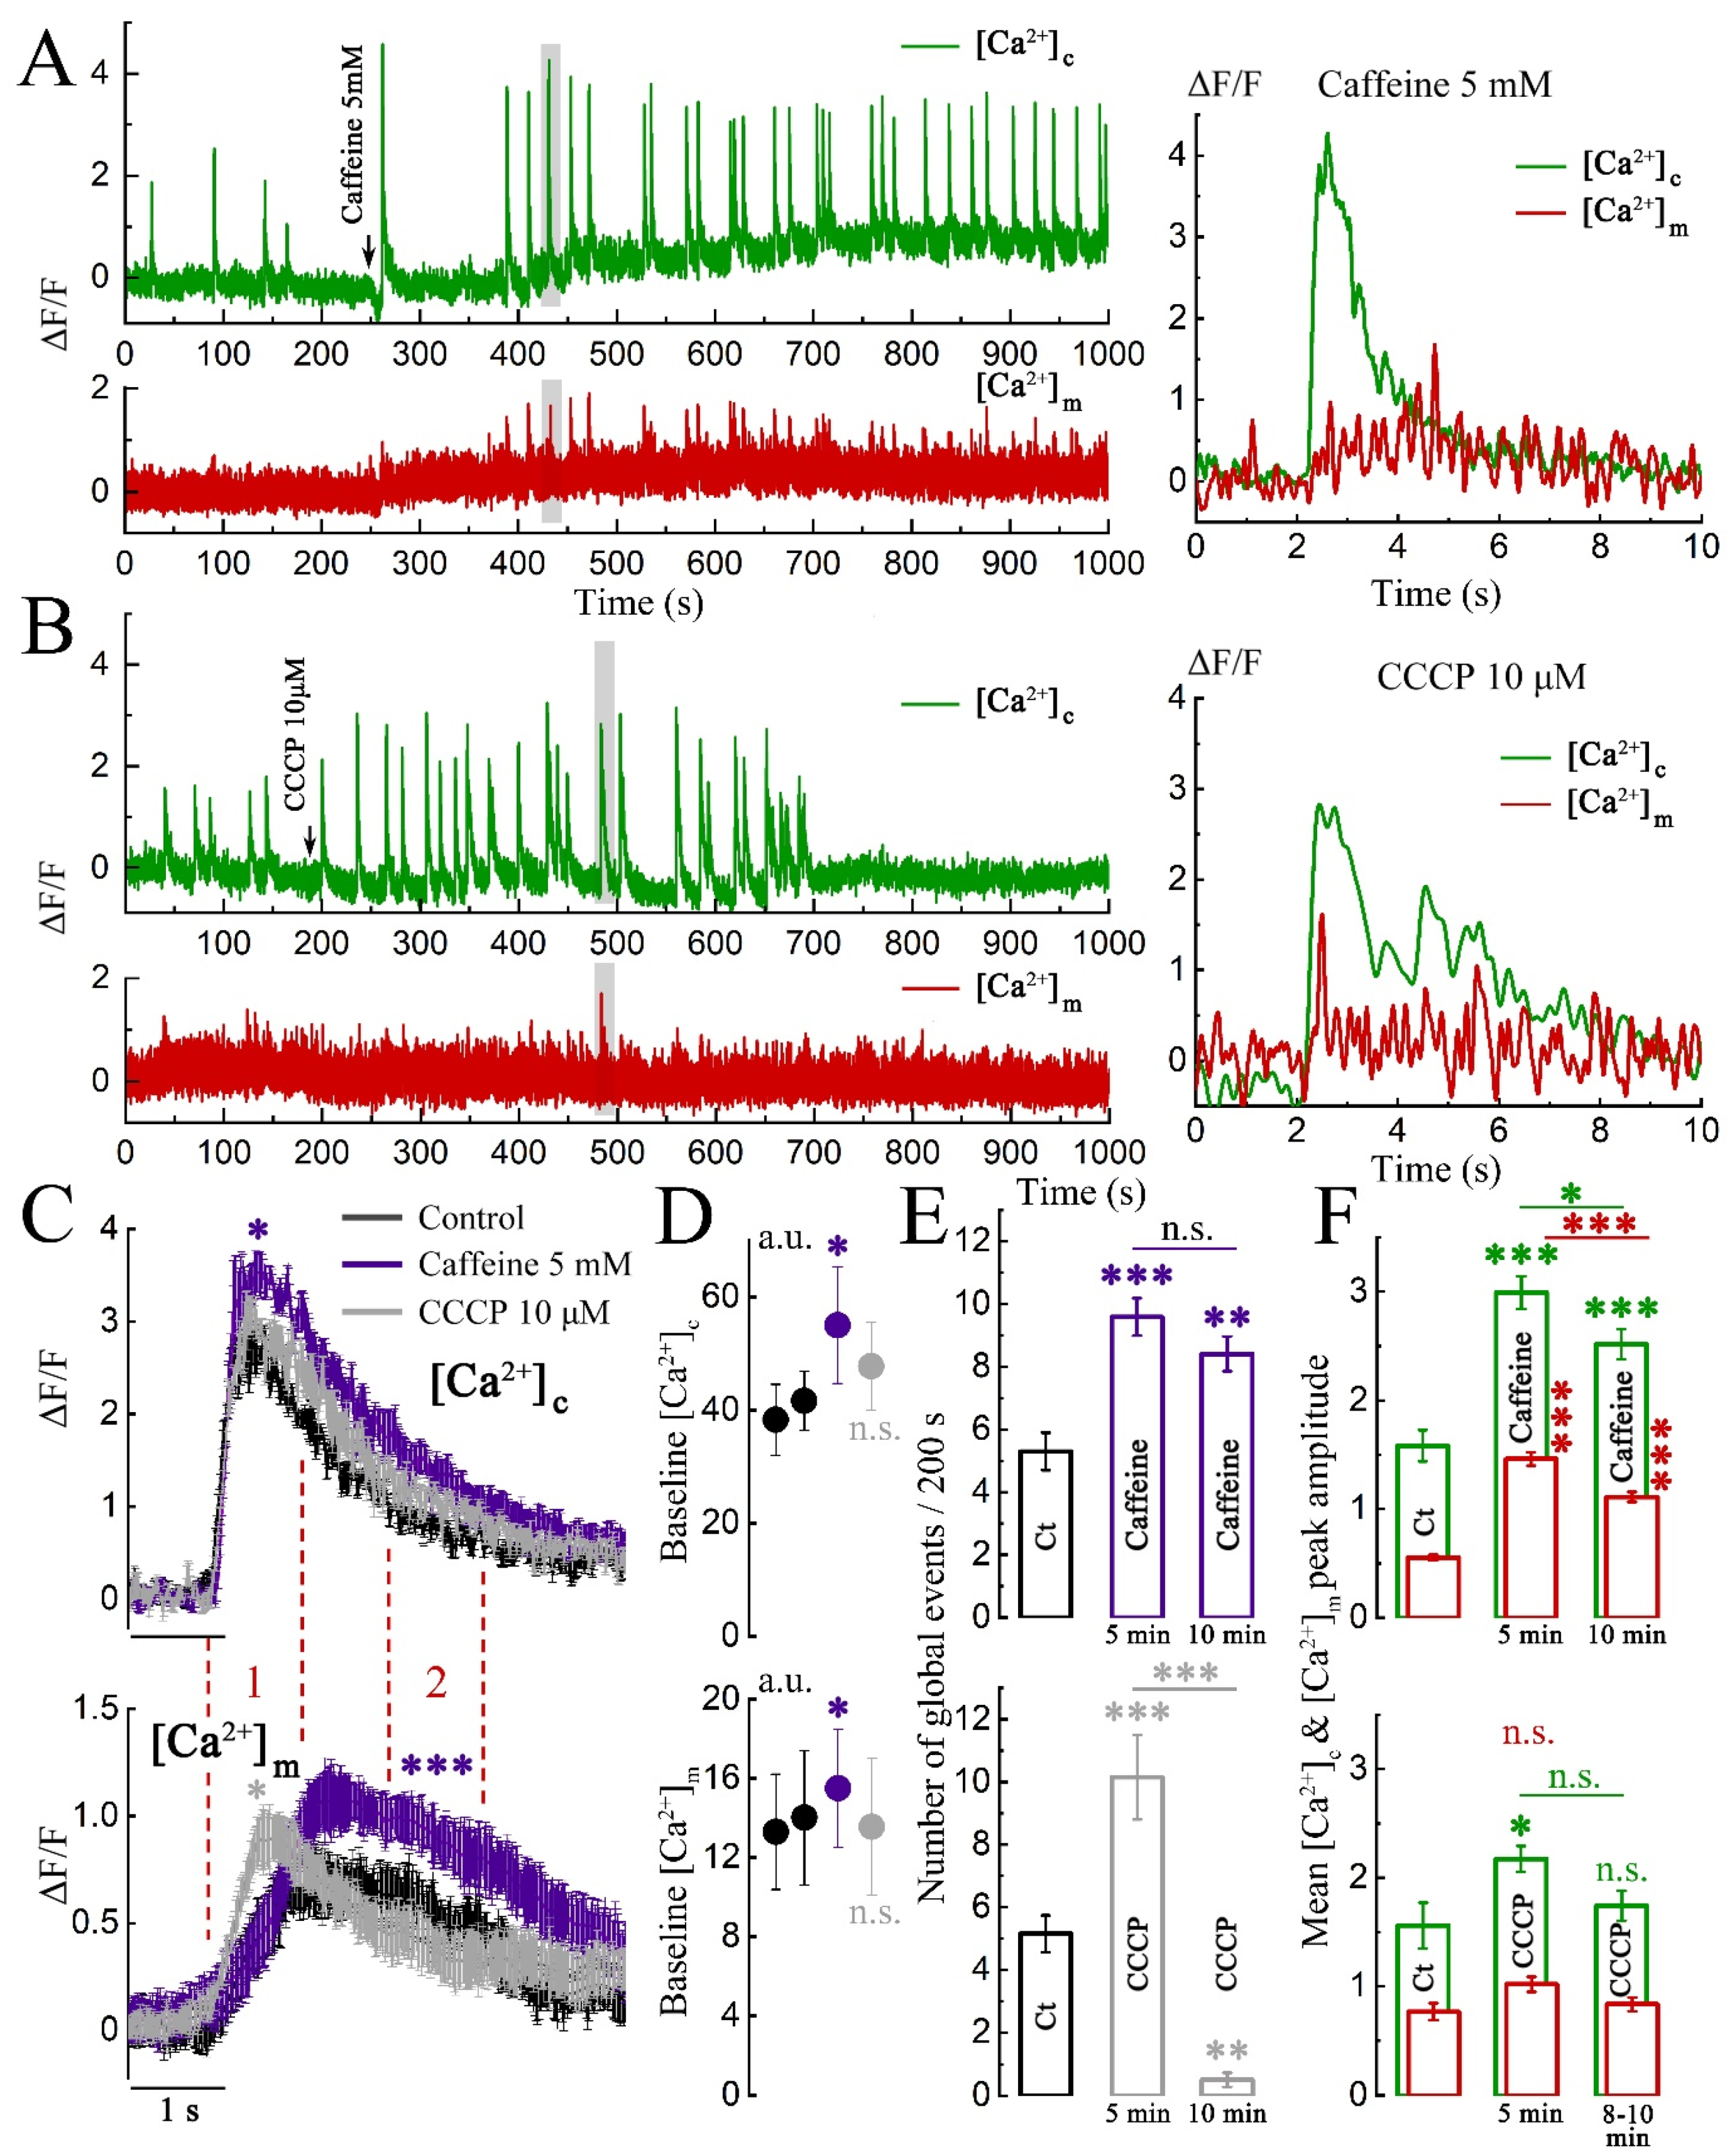
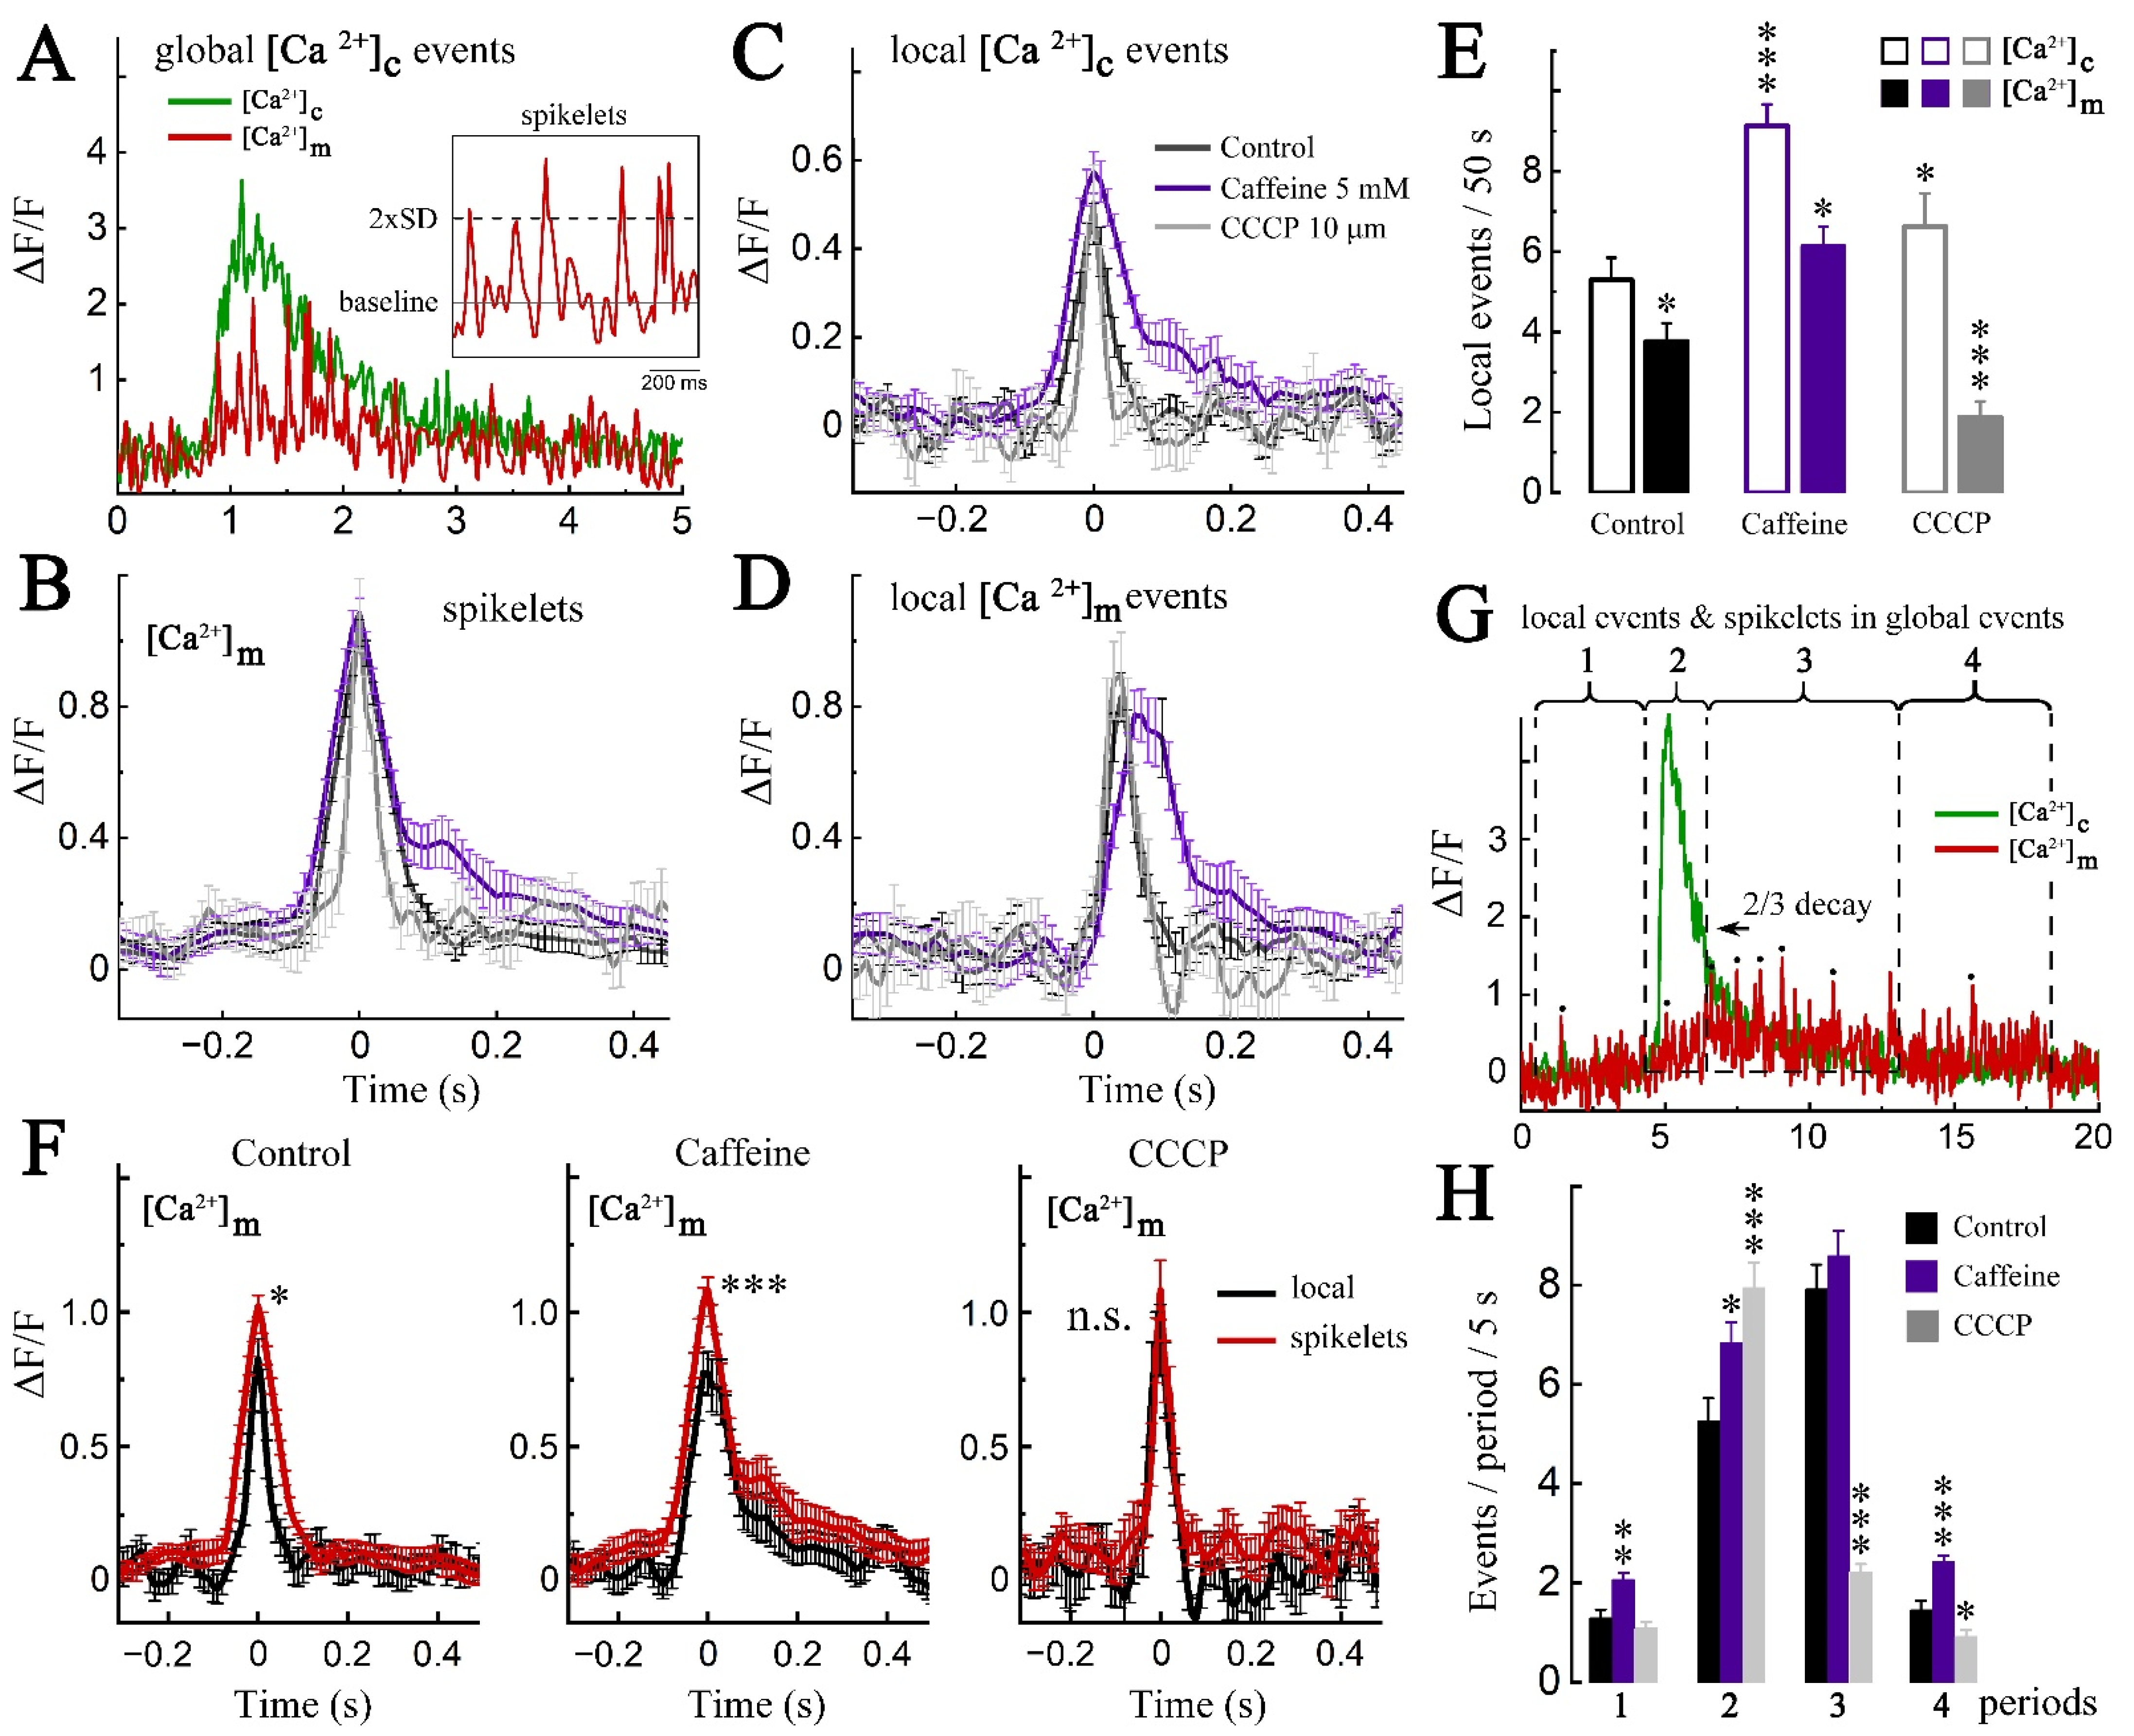
2.1. Imaging
2.2. Computational Modeling
3. Discussion
4. Materials and Methods
4.1. Tissue
4.2. Plasmids and Drugs
4.3. Imaging
4.4. Statistical Analysis
4.5. Modeling
Supplementary Materials
Author Contributions
Funding
Institutional Review Board Statement
Informed Consent Statement
Acknowledgments
Conflicts of Interest
References
- Brand, M.D.; Orr, A.L.; Perevoshchikova, I.V.; Quinlan, C.L. The role of mitochondrial function and cellular bioenergetics in ageing and disease. Br. J. Dermatol. 2013, 169 (Suppl. 2), 1–8. [Google Scholar] [CrossRef] [Green Version]
- Dragicevic, N.; Delic, V.; Cao, C.; Copes, N.; Lin, X.; Mamcarz, M.; Wang, L.; Arendash, G.W.; Bradshaw, P.C. Caffeine increases mitochondrial function and blocks melatonin signaling to mitochondria in Alzheimer’s mice and cells. Neuropharmacology 2012, 63, 1368–1379. [Google Scholar] [CrossRef] [PubMed]
- Huang, D.-X.; Yu, X.; Yu, W.-J.; Zhang, X.-M.; Liu, C.; Liu, H.-P.; Sun, Y.; Jiang, Z.-P. Calcium Signaling Regulated by Cellular Membrane Systems and = Calcium Homeostasis Perturbed in Alzheimer’s Disease. Front. Cell Dev. Biol. 2022, 10, 834962. [Google Scholar] [CrossRef] [PubMed]
- Stazi, M.; Lehmann, S.; Sakib, M.S.; Pena-Centeno, T.; Büschgens, L.; Fischer, A.; Weggen, S.; Wirths, O. Long-term caffeine treatment of Alzheimer mouse models ameliorates behavioural deficits and neuron loss and promotes cellular and molecular markers of neurogenesis. Cell Mol. Life Sci. 2022, 79, 55. [Google Scholar] [CrossRef]
- Zhao, W.; Hou, Y.; Song, X.; Wang, L.; Zhang, F.; Zhang, H.; Yu, H.; Zhou, Y. Estrogen Deficiency Induces Mitochondrial Damage Prior to Emergence of Cognitive Deficits in a Postmenopausal Mouse Model. Front. Aging Neurosci. 2021, 13, 713819. [Google Scholar] [CrossRef]
- Martín-Maestro, P.; Gargini, R.; García, E.; Perry, G.; Avila, J.; García-Escudero, V. Slower Dynamics and Aged Mitochondria in Sporadic Alzheimer’s Disease. Oxidative Med. Cell. Longev. 2017, 2017, 9302761. [Google Scholar] [CrossRef] [PubMed] [Green Version]
- Paillusson, S.; Stoica, R.; Gomez-Suaga, P.; Lau, D.H.; Mueller, S.; Miller, T.; Miller, C.C. There’s Something Wrong with my MAM; the ER-Mitochondria Axis and Neurodegenerative Diseases. Trends Neurosci. 2016, 39, 146–157. [Google Scholar] [CrossRef] [PubMed] [Green Version]
- Dromard, Y.; Arango-Lievano, M.; Fontanaud, P.; Tricaud, N.; Jeanneteau, F. Dual imaging of dendritic spines and mitochondria in vivo reveals hotspots of plasticity and metabolic adaptation to stress. Neurobiol. Stress 2021, 15, 100402. [Google Scholar] [CrossRef] [PubMed]
- Leung, A.; Ohadi, D.; Pekkurnaz, G.; Rangamani, P. Systems modeling predicts that mitochondria ER contact sites regulate the postsynaptic energy landscape. NPJ Syst. Biol. Appl. 2021, 7, 26. [Google Scholar] [CrossRef]
- Segal, M.; Korkotian, E. Roles of Calcium Stores and Store-Operated Channels in Plasticity of Dendritic Spines. Neuroscientist 2016, 22, 477–485. [Google Scholar] [CrossRef]
- Akerboom, J.; Calderón, N.C.; Tian, L.; Wabnig, S.; Prigge, M.; Tolö, J.; Gordus, A.; Orger, M.B.; Severi, K.E.; Macklin, J.J.; et al. Genetically encoded calcium indicators for multi-color neural activity imaging and combination with optogenetics. Front. Mol. Neurosci. 2013, 6, 2. [Google Scholar] [CrossRef] [PubMed] [Green Version]
- Pacher, P.; Thomas, A.P.; Hajnóczky, G. Ca2+ marks: Miniature calcium signals in single mitochondria driven by ryanodine receptors. Proc. Natl. Acad. Sci. USA 2002, 99, 2380–2385. [Google Scholar] [CrossRef] [PubMed] [Green Version]
- Csordás, G.; Thomas, A.P.; Hajnóczky, G. Calcium signal transmission between ryanodine receptors and mitochondria in cardiac muscle. Trends Cardiovasc. Med. 2001, 11, 269–275. [Google Scholar] [CrossRef]
- Kann, O.; Kovács, R.; Heinemann, U. Metabotropic receptor-mediated Ca2+ signaling elevates mitochondrial Ca2+ and stimulates oxidative metabolism in hippocampal slice cultures. J. Neurophysiol. 2003, 90, 613–621. [Google Scholar] [CrossRef] [PubMed] [Green Version]
- Kann, O.; Schuchmann, S.; Buchheim, K.; Heinemann, U. Coupling of neuronal activity and mitochondrial metabolism as revealed by NAD(P)H fluorescence signals in organotypic hippocampal slice cultures of the rat. Neuroscience 2003, 119, 87–100. [Google Scholar] [CrossRef]
- Koncha, R.R.; Ramachandran, G.; Sepuri, N.B.V.; Ramaiah, K.V.A. CCCP-induced mitochondrial dysfunction—Characterization and analysis of integrated stress response to cellular signaling and homeostasis. J. FEBS 2021, 288, 5737–5754. [Google Scholar] [CrossRef]
- Storozhuk, M.V.; Ivanova, S.Y.; Balaban, P.M.; Kostyuk, P.G. Possible role of mitochondria in posttetanic potentiation of GABAergic synaptic transmission in rat neocortical cell cultures. Synapse 2005, 58, 45–52. [Google Scholar] [CrossRef] [PubMed]
- Tonkikh, A.; Carlen, P. Impaired presynaptic cytosolic and mitochondrial calcium dynamics in aged compared to young adult hippocampal CA1 synapses ameliorated by calcium chelation. Neuroscience 2009, 159, 1300–1308. [Google Scholar] [CrossRef] [PubMed]
- Ganote, C.E.; Armstrong, S.C. Effects of CCCP-induced mitochondrial uncoupling and cyclosporin A on cell volume, cell injury and preconditioning protection of isolated rabbit cardiomyocytes. J. Mol. Cell Cardiol. 2003, 35, 749–759. [Google Scholar] [CrossRef]
- Ding, W.X.; Li, M.; Biazik, J.M.; Morgan, D.G.; Guo, F.; Ni, H.M.; Goheen, M.; Eskelinen, E.L.; Yin, X.M. Electron microscopic analysis of a spherical mitochondrial structure. J. Biol. Chem. 2012, 287, 42373–42378. [Google Scholar] [CrossRef]
- Miyazono, Y.; Hirashima, S.; Ishihara, N.; Kusukawa, J.; Nakamura, K.-I.; Ohta, K. Uncoupled mitochondria quickly shorten along their long axis to form indented spheroids, instead of rings, in a fission-independent manner. Sci. Rep. 2018, 8, 350. [Google Scholar] [CrossRef] [PubMed] [Green Version]
- Brown, M.R.; Sullivan, P.G.; Geddes, J.W. Synaptic mitochondria are more susceptible to Ca2+overload than nonsynaptic mitochondria. J. Biol. Chem. 2006, 281, 11658–11668. [Google Scholar] [CrossRef] [Green Version]
- Korkotian, E.; Segal, M. Structure-function relations in dendritic spines: Is size important? Hippocampus 2000, 10, 587–595. [Google Scholar] [CrossRef]
- Kushnireva, L.; Korkotian, E.; Segal, M. Calcium sensors STIM1 and STIM2 regulate different calcium functions in cultured hippocampal neurons. Front. Synaptic Neurosci. 2021, 12, 573714. [Google Scholar] [CrossRef]
- Chvanov, M.; Voronina, S.; Zhang, X.; Telnova, S.; Chard, R.; Ouyang, Y.; Armstrong, J.; Tanton, H.; Awais, M.; Latawiec, D.; et al. Knockout of the Mitochondrial Calcium Uniporter Strongly Suppresses Stimulus-Metabolism Coupling in Pancreatic Acinar Cells but Does not Reduce Severity of Experimental Acute Pancreatitis. Cells 2020, 9, 1407. [Google Scholar] [CrossRef] [PubMed]
- Lin, Y.; Li, L.-L.; Nie, W.; Liu, X.; Adler, A.; Xiao, C.; Lu, F.; Wang, L.; Han, H.; Wang, X.; et al. Brain activity regulates loose coupling between mitochondrial and cytosolic Ca2+ transients. Nat. Commun. 2019, 10, 5277. [Google Scholar] [CrossRef] [PubMed] [Green Version]
- Mahalaxmi, G.; Ashok, S.; Arun, G.; Srinivas, G. Albumin binds to uncoupler CCCP to diminish depolarization of mitochondria. Toxicol. Vitro 2022, 80, 105325. [Google Scholar] [CrossRef]
- Korkotian, E.; Meshcheriakova, A.; Segal, M. Presenilin 1 Regulates [Ca2+]i and Mitochondria/ER Interaction in Cultured Rat Hippocampal Neurons. Oxidative Med. Cell. Longev. 2019, 7284967. [Google Scholar] [CrossRef] [Green Version]
- Korkotian, E.; Oni-Biton, E.; Segal, M. The role of the store-operated calcium entry channel Orai1 in cultured rat hippocampal synapse formation and plasticity. J. Physiol. 2017, 595, 125–140. [Google Scholar] [CrossRef] [PubMed] [Green Version]
- Basnayake, K.; Mazaud, D.; Bemelmans, A.; Rouach, N.; Korkotian, E.; Holcman, D. Fast calcium transients in dendritic spines driven by extreme statistics. PLoS Biol. 2019, 17, e2006202. [Google Scholar] [CrossRef] [PubMed]
Publisher’s Note: MDPI stays neutral with regard to jurisdictional claims in published maps and institutional affiliations. |
© 2022 by the authors. Licensee MDPI, Basel, Switzerland. This article is an open access article distributed under the terms and conditions of the Creative Commons Attribution (CC BY) license (https://creativecommons.org/licenses/by/4.0/).
Share and Cite
Kushnireva, L.; Basnayake, K.; Holcman, D.; Segal, M.; Korkotian, E. Dynamic Regulation of Mitochondrial [Ca2+] in Hippocampal Neurons. Int. J. Mol. Sci. 2022, 23, 12321. https://doi.org/10.3390/ijms232012321
Kushnireva L, Basnayake K, Holcman D, Segal M, Korkotian E. Dynamic Regulation of Mitochondrial [Ca2+] in Hippocampal Neurons. International Journal of Molecular Sciences. 2022; 23(20):12321. https://doi.org/10.3390/ijms232012321
Chicago/Turabian StyleKushnireva, Liliya, Kanishka Basnayake, David Holcman, Menahem Segal, and Eduard Korkotian. 2022. "Dynamic Regulation of Mitochondrial [Ca2+] in Hippocampal Neurons" International Journal of Molecular Sciences 23, no. 20: 12321. https://doi.org/10.3390/ijms232012321