
Identification of Candidate Genes and Regulatory Competitive Endogenous RNA (ceRNA) Networks Underlying Intramuscular Fat Content in Yorkshire Pigs with Extreme Fat Deposition Phenotypes

 and
and
Abstract
:1. Introduction
2. Results
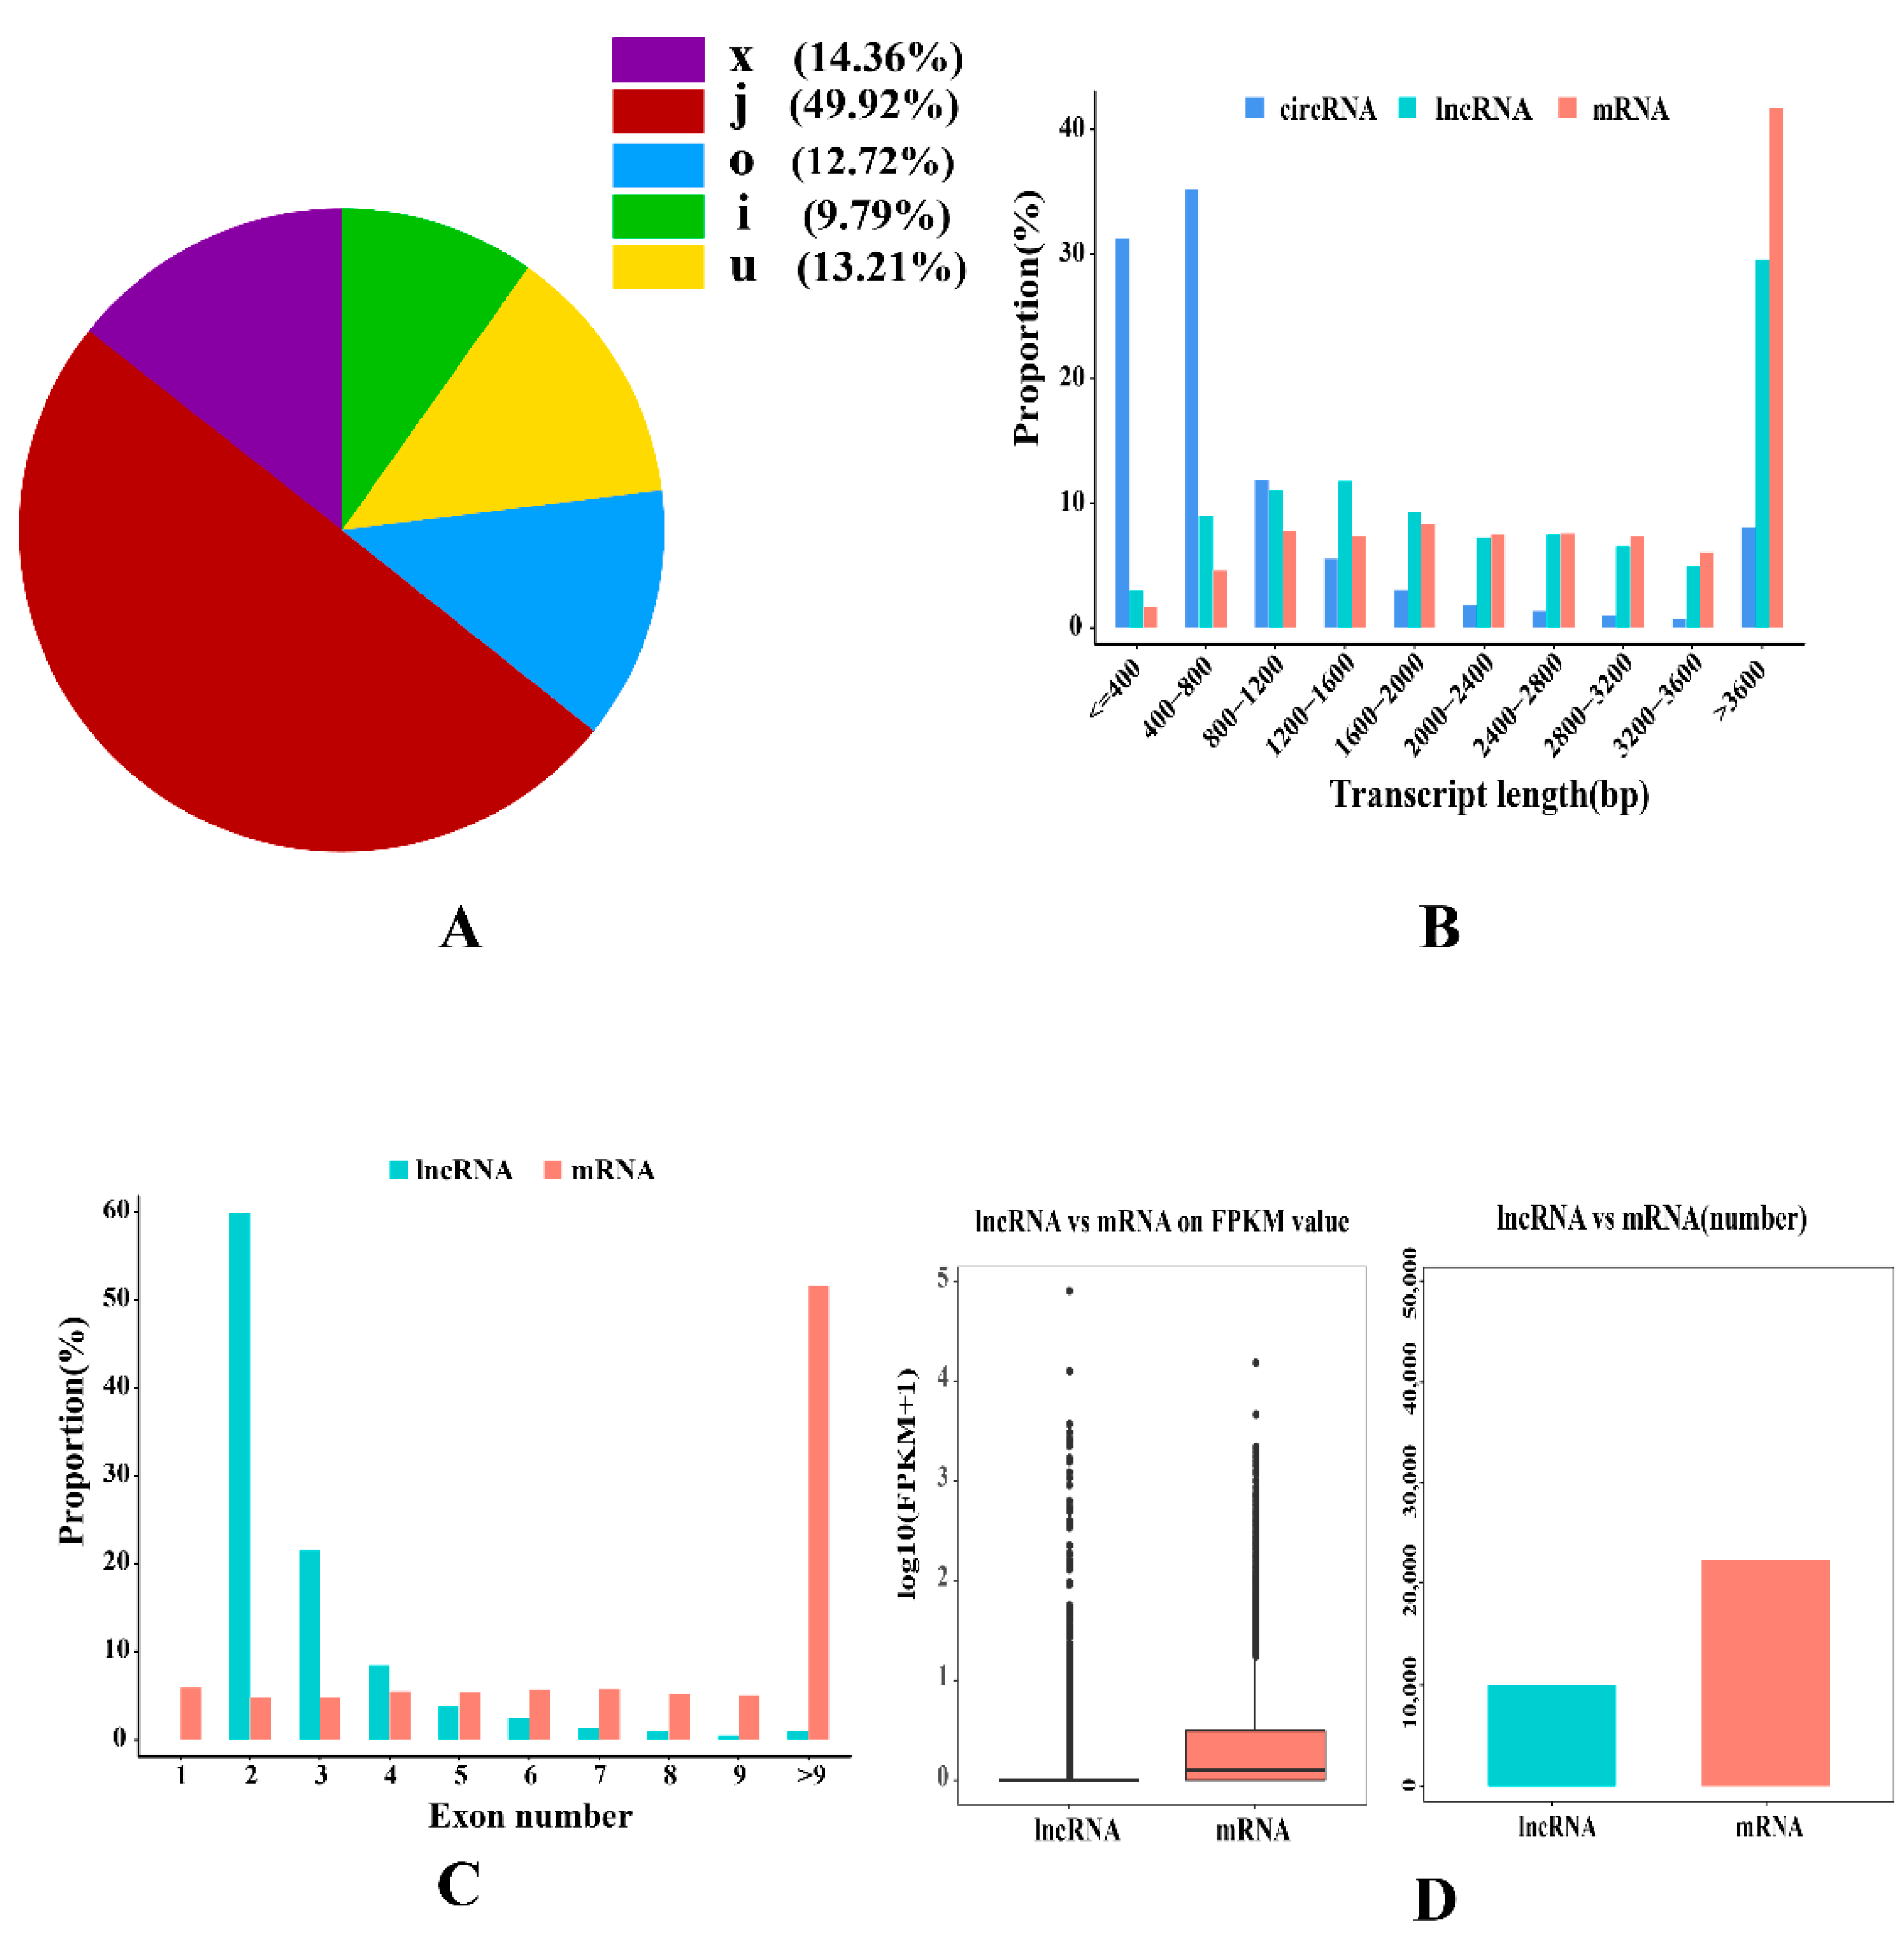
2.1. Characterization of the Longissimus Dorsi Transcription
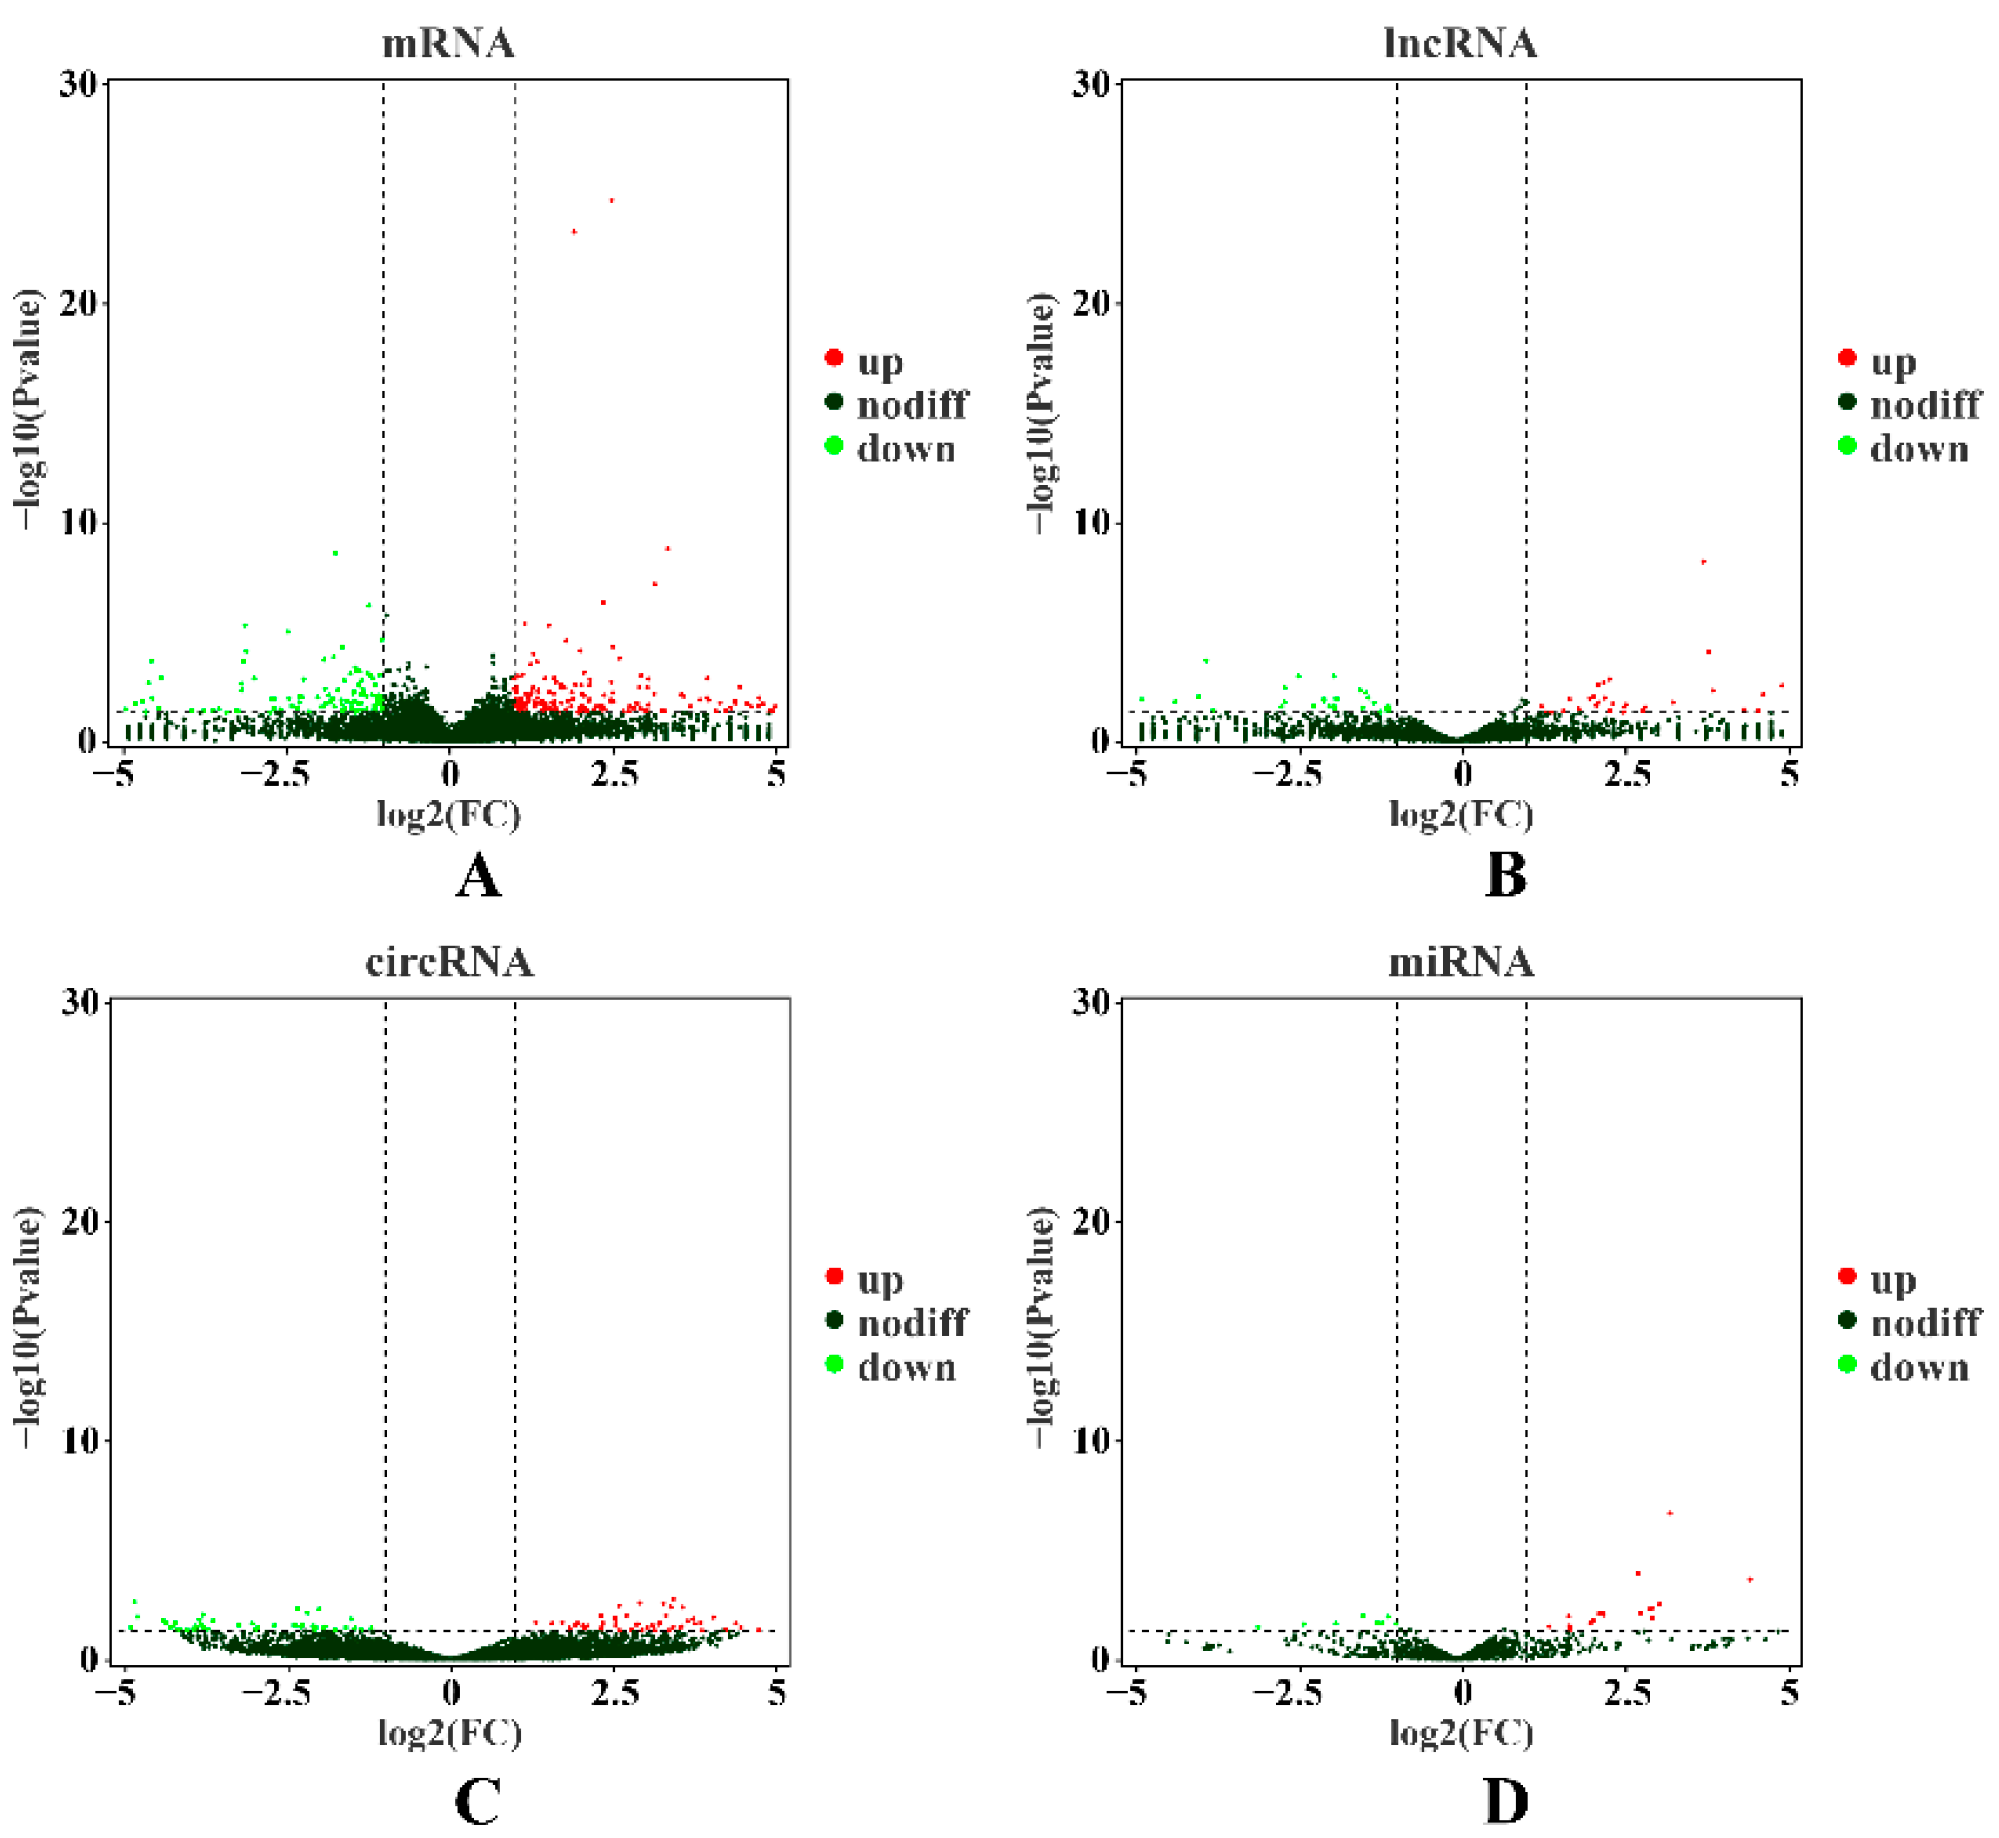
2.2. Transcriptional Profiling of mRNAs
2.3. Expression Patterns of lncRNAs
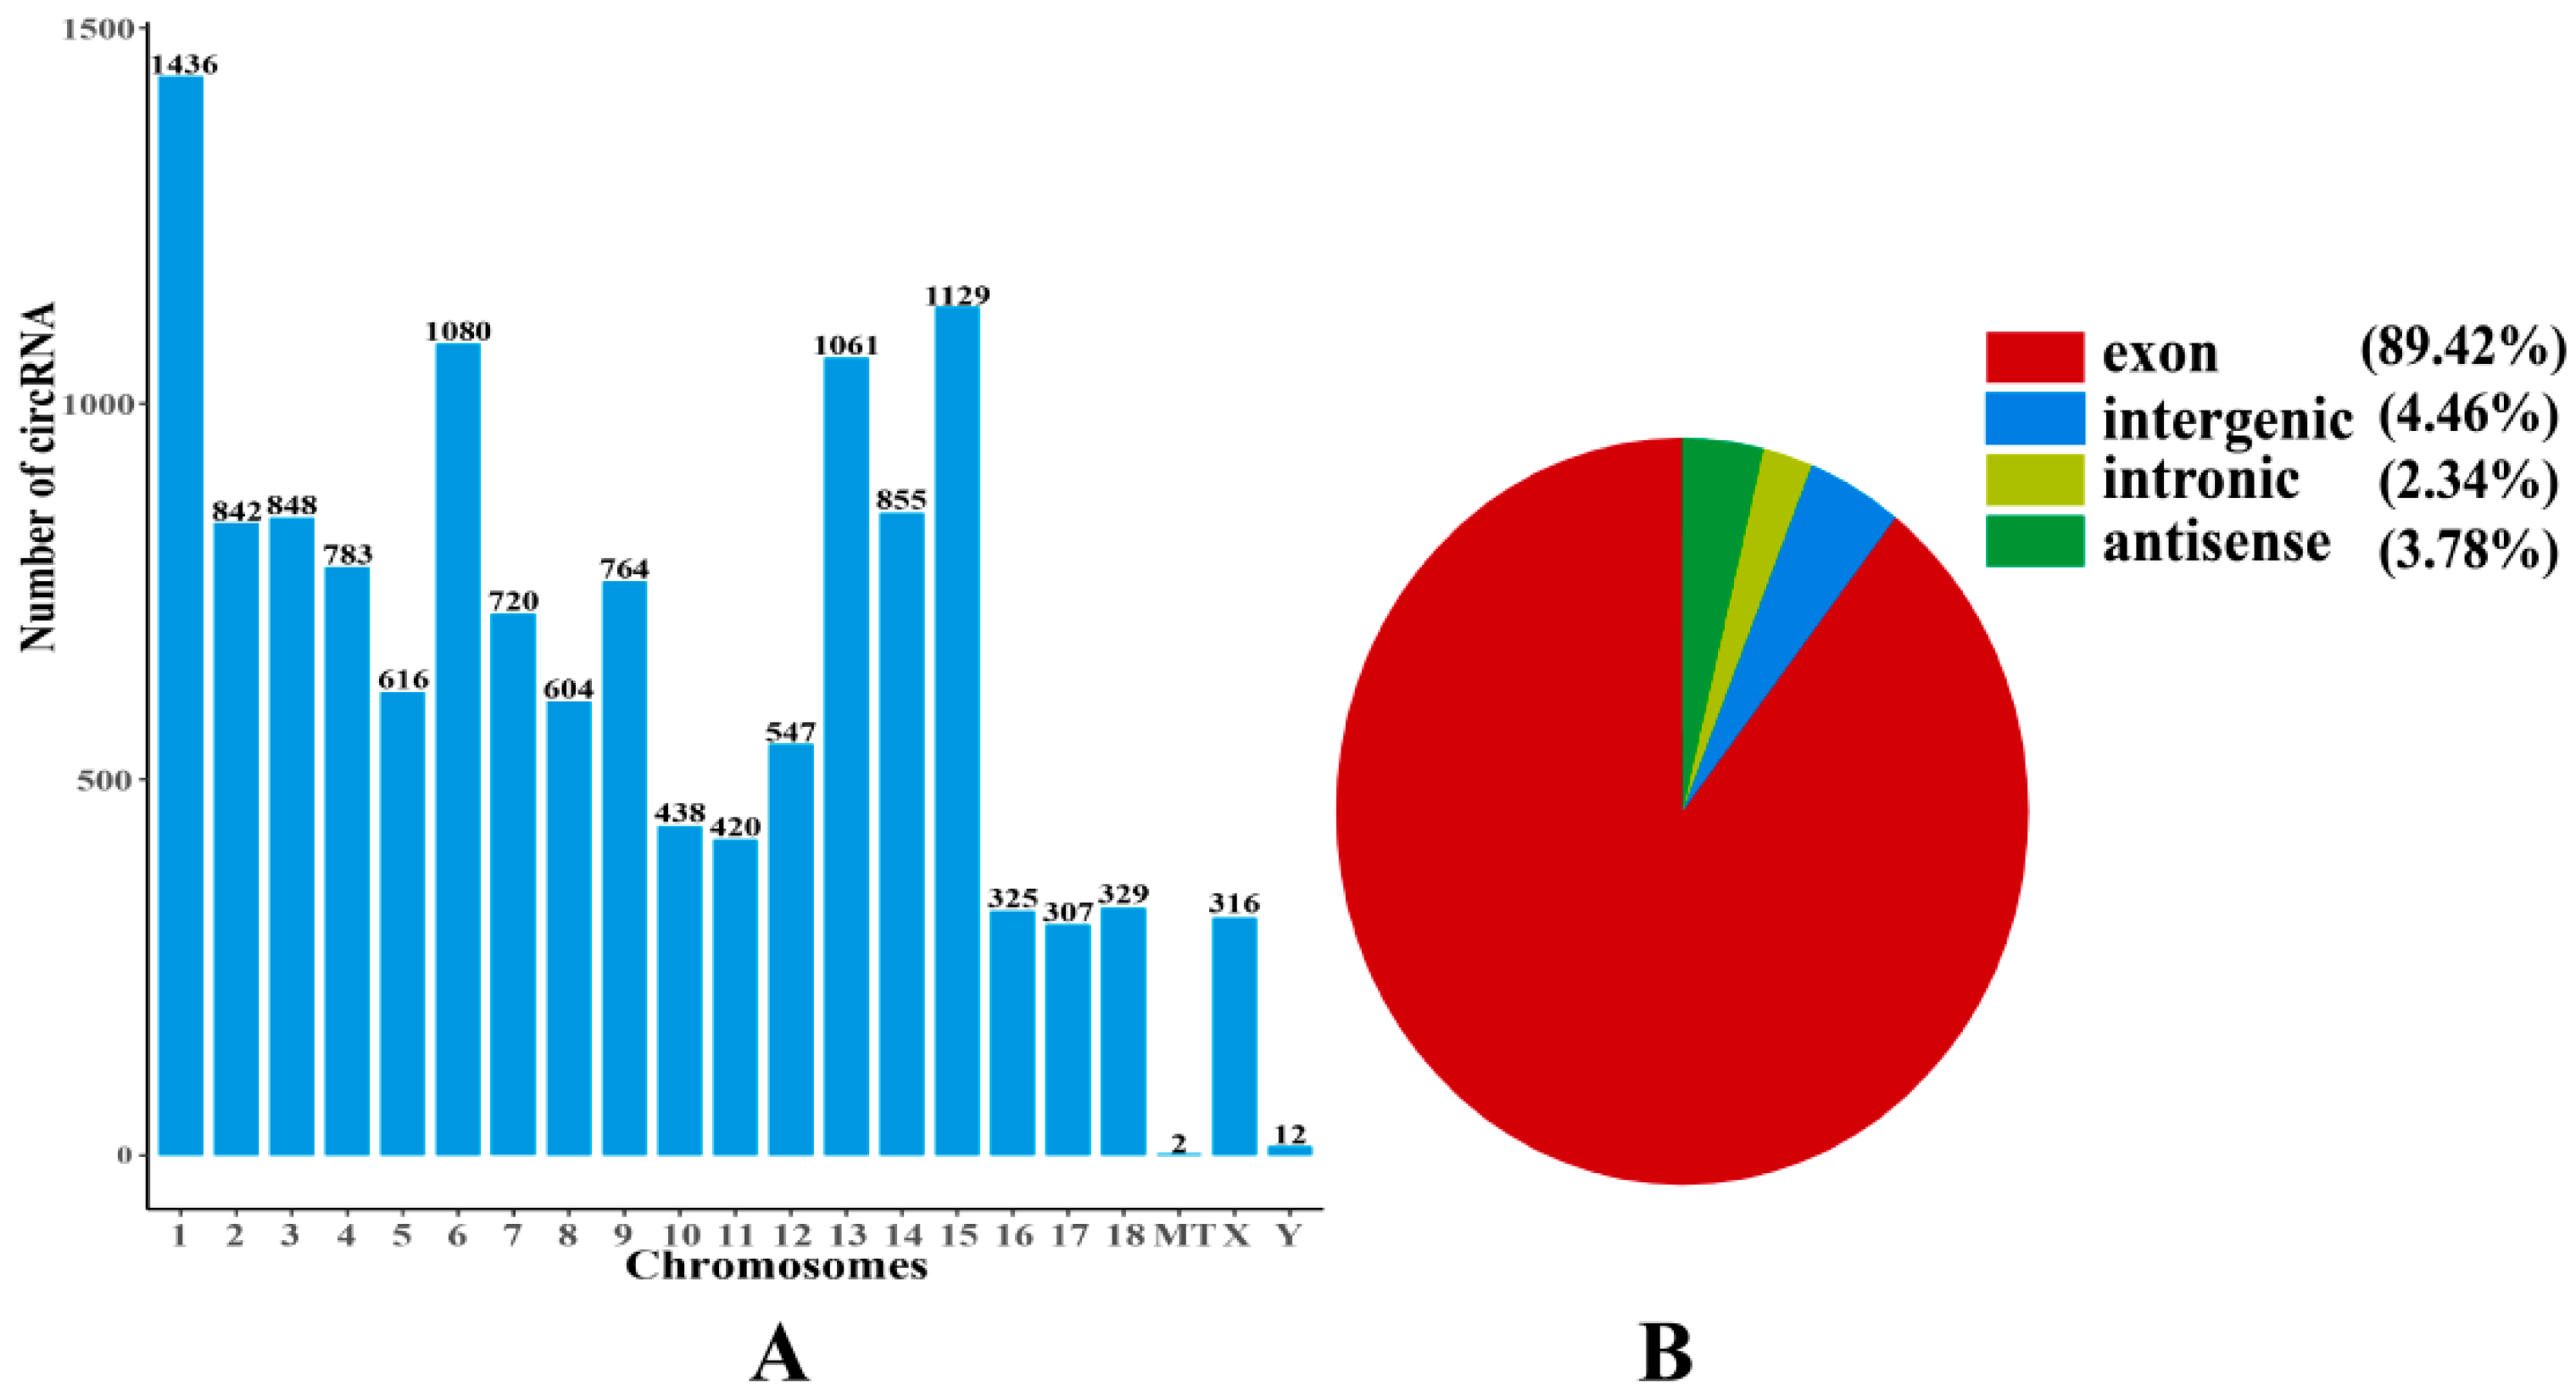
2.4. Expression Patterns of circRNAs
2.5. Detection of miRNA Expression
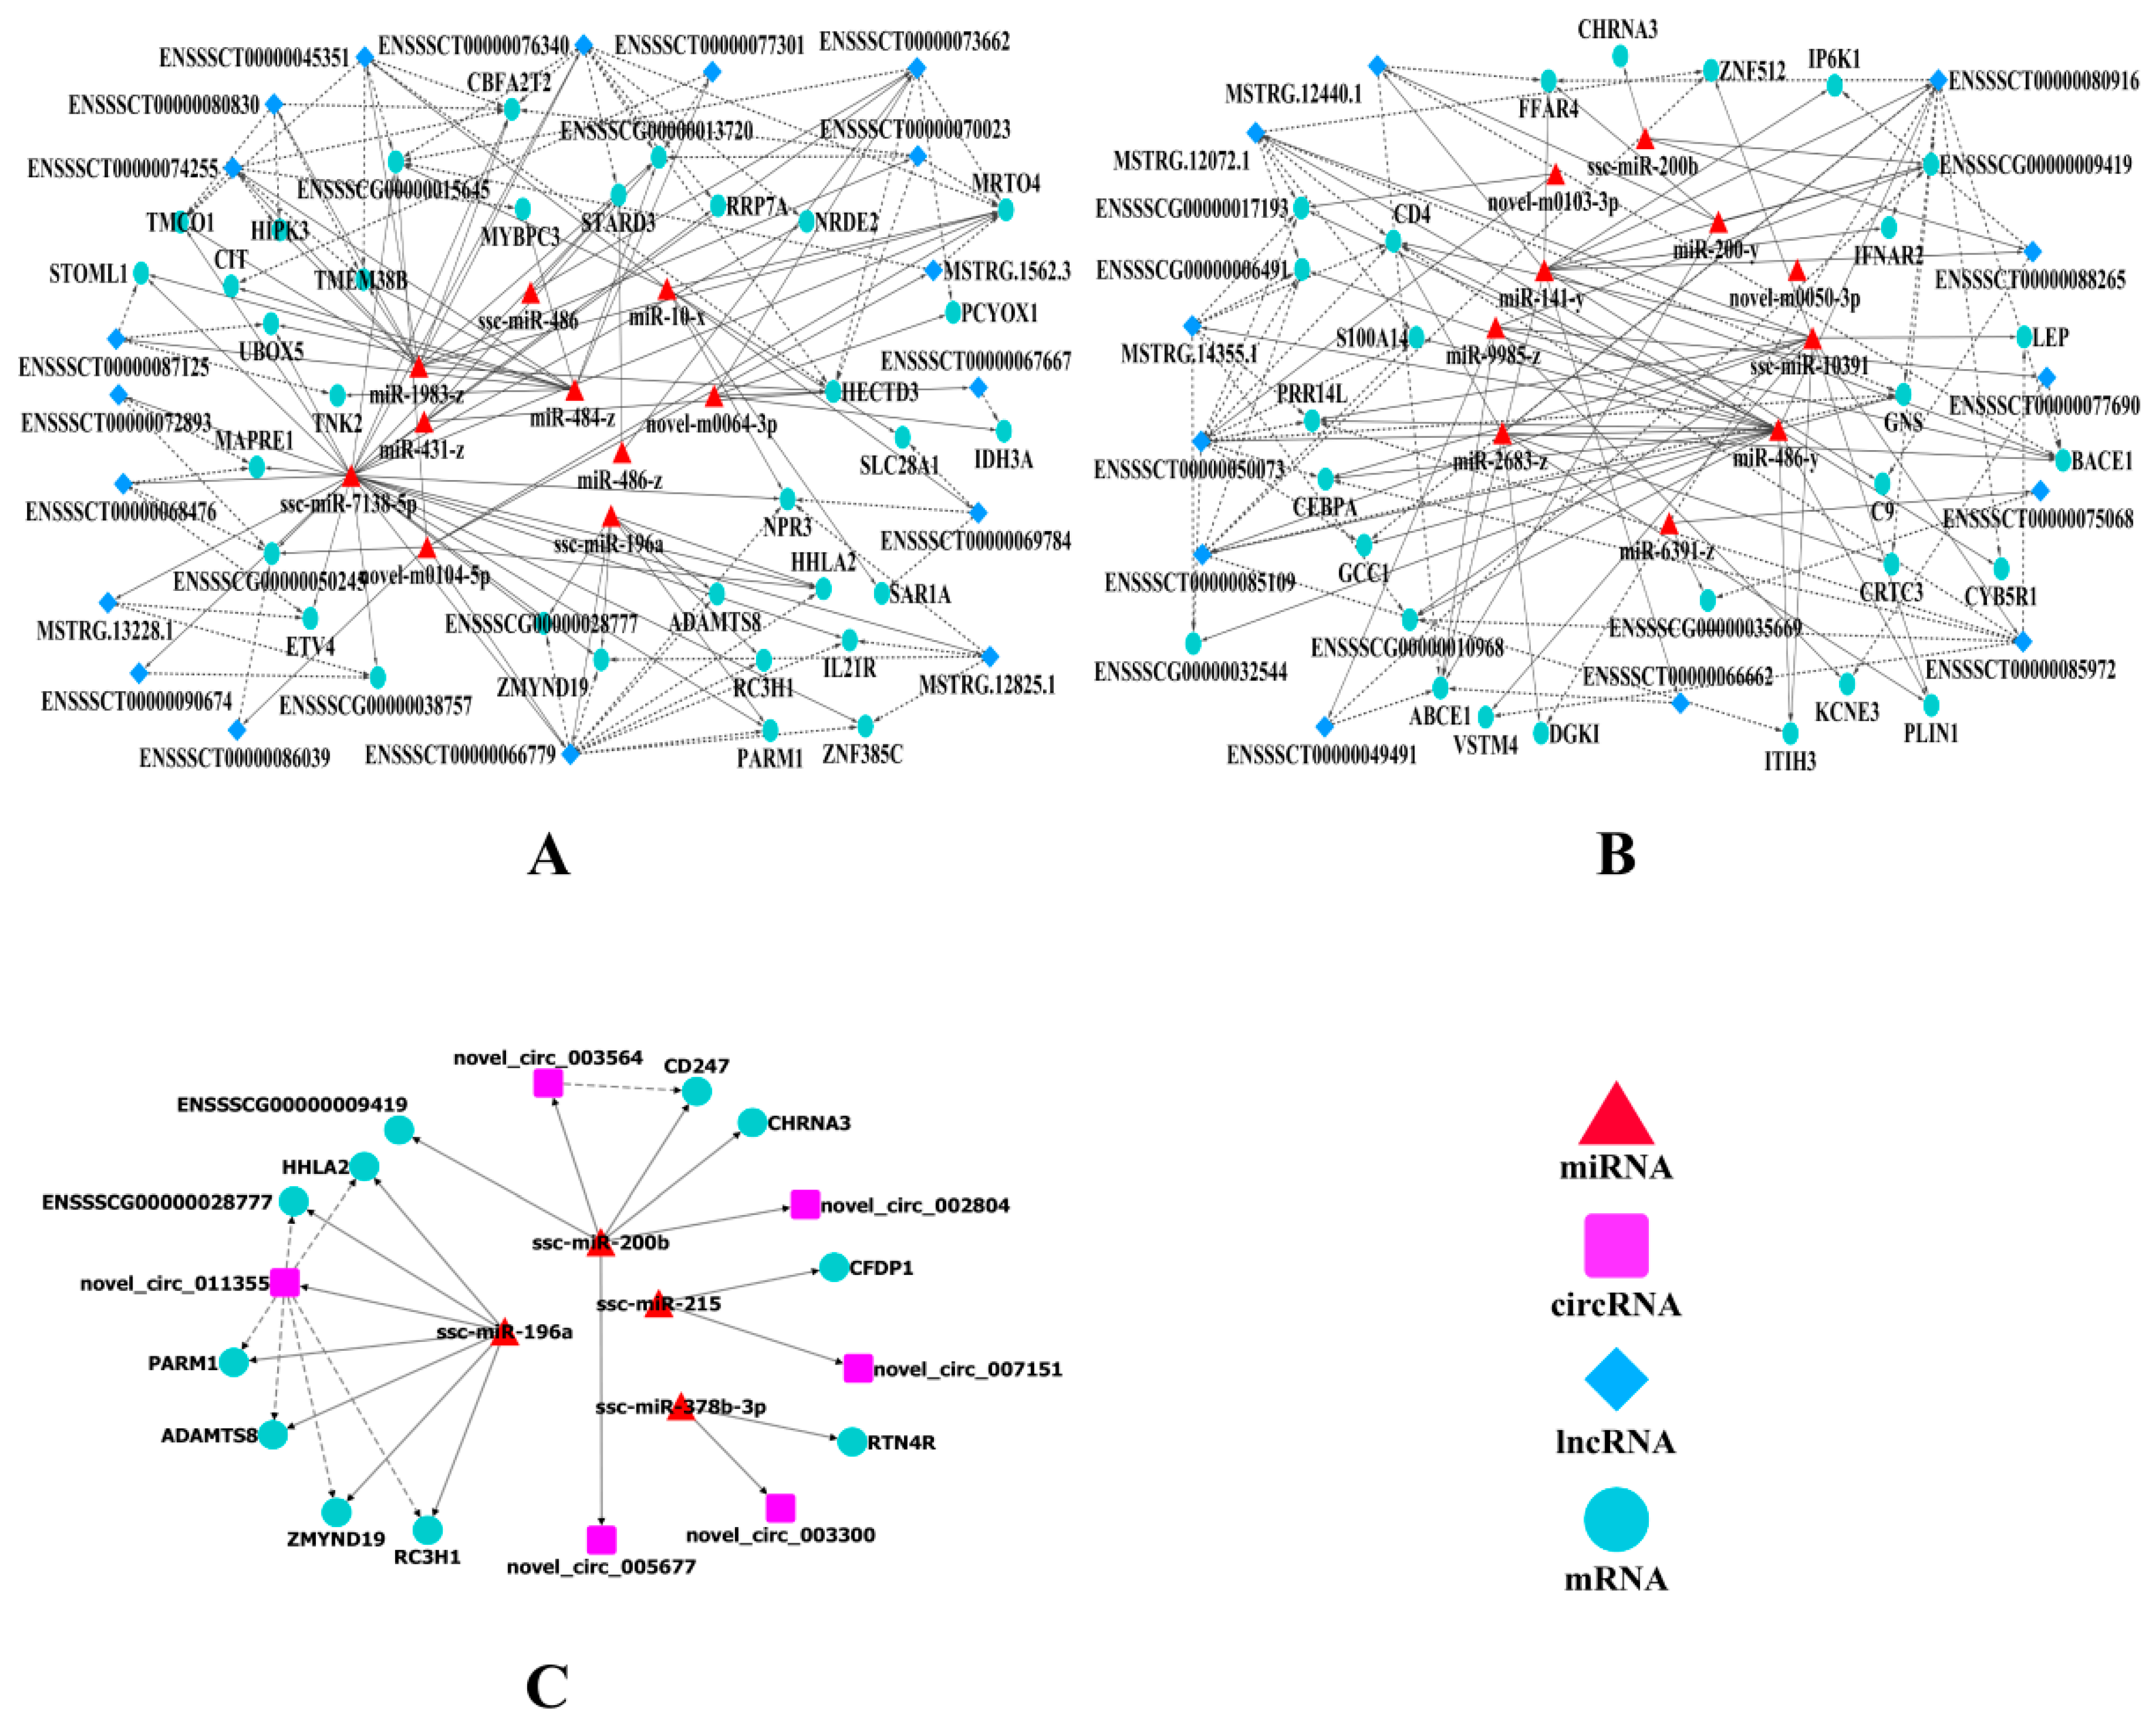
2.6. Construction of the ceRNA Co-Regulatory Network
2.7. qRT-PCR Validation
3. Discussion
4. Materials and Methods
4.1. The Experimental Animals and Sample Collection
4.2. mRNA/lncRNA/circRNA Sequencing and Data Analysis
4.3. Identification of lncRNAs
4.4. Identification of circRNAs
4.5. Small RNA Library Construction and Sequencing
4.6. Alignment and Identification of Small RNA
4.7. Prediction of Target Genes of miRNAs
4.8. Differentially Expressed RNA Identification and Pathway Analysis
4.9. Protein–Protein Interaction (PPI) Analysis of Differentially Expressed mRNAs
4.10. Construction of the lncRNA/circRNA–miRNA–mRNA Network
4.11. qRT-PCR
5. Conclusions
Supplementary Materials
Author Contributions
Funding
Institutional Review Board Statement
Informed Consent Statement
Data Availability Statement
Conflicts of Interest
Abbreviations
References
- Zhang, Y.; Sun, Y.; Wu, Z.; Xiong, X.; Zhang, J.; Ma, J.; Xiao, S.; Huang, L.; Yang, B. Subcutaneous and intramuscular fat transcriptomes show large differences in network organization and associations with adipose traits in pigs. Sci. China Life Sci. 2021, 64, 1732–1746. [Google Scholar] [CrossRef] [PubMed]
- Zhan, H.; Xiong, Y.; Wang, Z.; Dong, W.; Zhou, Q.; Xie, S.; Li, X.; Zhao, S.; Ma, Y. Integrative analysis of transcriptomic and metabolomic profiles reveal the complex molecular regulatory network of meat quality in Enshi black pigs. Meat Sci. 2022, 183, 108642. [Google Scholar] [CrossRef] [PubMed]
- Song, B.; Zheng, C.; Zheng, J.; Zhang, S.; Zhong, Y.; Guo, Q.; Li, F.; Long, C.; Xu, K.; Duan, Y.; et al. Comparisons of carcass traits, meat quality, and serum metabolome between Shaziling and Yorkshire pigs. Anim. Nutr. 2022, 8, 125–134. [Google Scholar] [CrossRef] [PubMed]
- Liu, Y.; Long, H.; Feng, S.; Ma, T.; Wang, M.; Niu, L.; Zhang, X.; Wang, L.; Lei, Y.; Chen, Y.; et al. Trait correlated expression combined with eQTL and ASE analyses identified novel candidate genes affecting intramuscular fat. BMC Genom. 2021, 22, 805. [Google Scholar] [CrossRef]
- Wang, L.; Li, J.; Hou, X.; Yan, H.; Zhang, L.; Liu, X.; Gao, H.; Zhao, F.; Wang, L. Genome-Wide Identification of RNA Editing Sites Affecting Intramuscular Fat in Pigs. Animals 2020, 10, 1616. [Google Scholar] [CrossRef]
- Won, S.; Jung, J.; Park, E.; Kim, H. Identification of genes related to intramuscular fat content of pigs using genome-wide association study. Anim. Biosci. 2018, 31, 157–162. [Google Scholar] [CrossRef]
- Ding, R.; Yang, M.; Quan, J.; Li, S.; Zhuang, Z.; Zhou, S.; Zheng, E.; Hong, L.; Li, Z.; Cai, G.; et al. Single-Locus and Multi-Locus Genome-Wide Association Studies for Intramuscular Fat in Duroc Pigs. Front. Genet. 2019, 10, 619. [Google Scholar] [CrossRef] [Green Version]
- Zhou, J.; Zhang, Y.; Wu, J.; Qiao, M.; Xu, Z.; Peng, X.; Mei, S. Proteomic and lipidomic analyses reveal saturated fatty acids, phosphatidylinositol, phosphatidylserine, and associated proteins contributing to intramuscular fat deposition. J. Proteom. 2021, 241, 104235. [Google Scholar] [CrossRef]
- Zhang, Y.; Liu, X.; Zhang, L.; Wang, L.; He, J.; Ma, H.; Wang, L. Preliminary identification and analysis of differential RNA editing between higher and lower backfat thickness pigs using DNA-seq and RNA-seq data. Anim. Genet. 2022, 53, 327–339. [Google Scholar] [CrossRef]
- Albrecht, E.; Schering, L.; Liu, Y.; Komolka, K.; Kühn, C.; Wimmers, K.; Gotoh, T.; Maak, S. TRIENNIAL GROWTH AND DEVELOPMENT SYMPOSIUM: Factors influencing bovine intramuscular adipose tissue development and cellularity. J. Anim. Sci. 2017, 95, 2244–2254. [Google Scholar] [CrossRef]
- Li, B.; He, Y.; Wu, W.; Tan, X.; Wang, Z.; Irwin, D.M.; Wang, Z.; Zhang, S. Circular RNA Profiling Identifies Novel circPPARA that Promotes Intramuscular Fat Deposition in Pigs. J. Agric. Food Chem. 2022, 70, 4123–4137. [Google Scholar] [CrossRef] [PubMed]
- Zhang, P.; Li, Q.; Wu, Y.; Zhang, Y.; Zhang, B.; Zhang, H. Identification of candidate genes that specifically regulate subcutaneous and intramuscular fat deposition using transcriptomic and proteomic profiles in Dingyuan pigs. Sci. Rep. 2022, 12, 2844. [Google Scholar] [CrossRef] [PubMed]
- Zhang, Q.; Cai, R.; Tang, G.; Zhang, W.; Pang, W. MiR-146a-5p targeting SMAD4 and TRAF6 inhibits adipogenensis through TGF-β and AKT/mTORC1 signal pathways in porcine intramuscular preadipocytes. J. Anim. Sci. Biotechnol. 2021, 12, 12. [Google Scholar] [CrossRef]
- Wang, J.; Chen, M.Y.; Chen, J.F.; Ren, Q.L.; Zhang, J.Q.; Cao, H.; Xing, B.S.; Pan, C.Y. LncRNA IMFlnc1 promotes porcine intramuscular adipocyte adipogenesis by sponging miR-199a-5p to up-regulate CAV-1. BMC Mol. Cell Biol. 2020, 21, 77. [Google Scholar] [CrossRef] [PubMed]
- Wang, L.; Xie, Y.; Chen, W.; Zhang, Y.; Zeng, Y. Identification and functional prediction of long noncoding RNAs related to intramuscular fat content in Laiwu pigs. Anim. Biosci. 2022, 35, 115–125. [Google Scholar] [CrossRef] [PubMed]
- Sun, Y.; Wang, S.; Liu, H.; Ren, R.; Dong, Q.; Xie, J.; Cao, J. Profiling and characterization of miRNAs associated with intramuscular fat content in Yorkshire pigs. Anim. Biotechnol. 2020, 31, 256–263. [Google Scholar] [CrossRef]
- Li, Q.; Huang, Z.; Zhao, W.; Li, M.; Li, C. Transcriptome Analysis Reveals Long Intergenic Non-Coding RNAs Contributed to Intramuscular Fat Content Differences between Yorkshire and Wei Pigs. Int. J. Mol. Sci. 2020, 21, 1732. [Google Scholar] [CrossRef] [Green Version]
- Chen, Q.; Zhang, W.; Cai, J.; Ni, Y.; Xiao, L.; Zhang, J. Transcriptome analysis in comparing carcass and meat quality traits of Jiaxing Black Pig and Duroc × Duroc × Berkshire × Jiaxing Black Pig crosses. Gene 2022, 808, 145878. [Google Scholar] [CrossRef]
- Qi, K.; Liu, Y.; Li, C.; Li, X.; Li, X.; Wang, K.; Qiao, R.; Han, X. Construction of circRNA-related ceRNA networks in longissimus dorsi muscle of Queshan Black and Large White pigs. Mol. Genet. Genom. 2022, 297, 101–112. [Google Scholar] [CrossRef]
- Hocquette, J.F.; Gondret, F.; Baéza, E.; Médale, F.; Jurie, C.; Pethick, D.W. Intramuscular fat content in meat-producing animals: Development, genetic and nutritional control, and identification of putative markers. Animal 2010, 4, 303–319. [Google Scholar] [CrossRef]
- Zou, C.; Li, L.; Cheng, X.; Li, C.; Fu, Y.; Fang, C.; Li, C. Identification and Functional Analysis of Long Intergenic Non-coding RNAs Underlying Intramuscular Fat Content in Pigs. Front. Genet. 2018, 9, 102. [Google Scholar] [CrossRef] [Green Version]
- Fernandez, X.; Monin, G.; Talmant, A.; Mourot, J.; Lebret, B. Influence of intramuscular fat content on the quality of pig meat-1. Composition of the lipid fraction and sensory characteristics of m. longissimus lumborum. Meat Sci. 1999, 53, 59–65. [Google Scholar] [CrossRef]
- Straadt, I.K.; Aaslyng, M.D.; Bertram, H.C. An NMR-based metabolomics study of pork from different crossbreeds and relation to sensory perception. Meat Sci. 2014, 96, 719–728. [Google Scholar] [CrossRef] [PubMed]
- Wang, Y.; Ma, C.; Sun, Y.; Li, Y.; Kang, L.; Jiang, Y. Dynamic transcriptome and DNA methylome analyses on longissimus dorsi to identify genes underlying intramuscular fat content in pigs. BMC Genom. 2017, 1, 780. [Google Scholar] [CrossRef] [PubMed] [Green Version]
- Chen, P.; Baas, T.J.; Dekkers, J.C.M.; Christian, L.L. Selection for lean growth rate and correlated responses in litter traits in a synthetic line of Yorkshire-Meishan pigs. Can. J. Anim. Sci. 2001, 2, 205–214. [Google Scholar] [CrossRef]
- Corominas, J.; Ramayo-Caldas, Y.; Puig-Oliveras, A.; Estellé, J.; Castelló, A.; Alves, E.; Pena, R.N.; Ballester, M.; Folch, J.M. Analysis of porcine adipose tissue transcriptome reveals differences in de novo fatty acid synthesis in pigs with divergent muscle fatty acid composition. BMC Genom. 2013, 14, 843. [Google Scholar] [CrossRef]
- Piórkowska, K.; Małopolska, M.; Ropka-Molik, K.; Szyndler-Nędza, M.; Wiechniak, A.; Żukowski, K.; Lambert, B.; Tyra, M. Evaluation of SCD, ACACA and FASN Mutations: Effects on Pork Quality and Other Production Traits in Pigs Selected Based on RNA-Seq Results. Animals 2020, 10, 123. [Google Scholar] [CrossRef] [Green Version]
- Castro-Gil, M.P.; Torres-Mena, J.E.; Salgado, R.M.; Muñoz-Montero, S.A.; Martínez-Garcés, J.M.; López-Torres, C.D.; Mendoza-Vargas, A.; Gabiño-López, N.B.; Villa-Treviño, S.; del Pozo-Yauner, L.; et al. The transcriptome of early GGT/KRT19-positive hepatocellular carcinoma reveals a downregulated gene expression profile associated with fatty acid metabolism. Genomics 2022, 114, 72–83. [Google Scholar] [CrossRef]
- Zhao, X.; Hu, H.; Lin, H.; Wang, C.; Wang, Y.; Wang, J. Muscle Transcriptome Analysis Reveals Potential Candidate Genes and Pathways Affecting Intramuscular Fat Content in Pigs. Front. Genet. 2020, 11, 877. [Google Scholar] [CrossRef]
- Albuquerque, A.; Óvilo, C.; Núñez, Y.; Benítez, R.; López-Garcia, A.; García, F.; Félix, M.d.R.; Laranjo, M.; Charneca, R.; Martins, J.M. Transcriptomic Profiling of Skeletal Muscle Reveals Candidate Genes Influencing Muscle Growth and Associated Lipid Composition in Portuguese Local Pig Breeds. Animals 2021, 11, 1423. [Google Scholar] [CrossRef]
- Yanai, H.; Yoshida, H. Beneficial effects of adiponectin on glucose and lipid metabolism and atherosclerotic progression: Mechanisms and perspectives. Int. J. Mol. Sci. 2019, 20, 1190. [Google Scholar] [CrossRef] [PubMed] [Green Version]
- Yu, K.; Shu, G.; Yuan, F.; Zhu, X.; Gao, P.; Wang, S.; Wang, L.; Xi, Q.; Zhang, S.; Zhang, Y.; et al. Fatty acid and transcriptome profiling of longissimus dorsi muscles between pig breeds differing in meat quality. Int. J. Biol. Sci. 2013, 9, 108–118. [Google Scholar] [CrossRef] [PubMed]
- Seth, G.; McIvor, R.S.; Hu, W.S. 17Beta-hydroxysteroid dehydrogenase type 7 (Hsd17b7) reverts cholesterol auxotrophy in NS0 cells. J. Biotechnol. 2006, 121, 241–252. [Google Scholar] [CrossRef] [PubMed]
- Wang, Y.; Peng, Y.; Yang, Y.; Hu, Y.; Wang, H.; Xu, L.; Ju, H. The effect of the PLIN1 gene on the metabolism and mitochondria of porcine skeletal muscle satellite cells. Genes Genom. 2022. [Google Scholar] [CrossRef] [PubMed]
- Zhang, Y.F.; Yuan, Z.Q.; Song, D.G.; Zhou, X.H.; Wang, Y.Z. Effects of cannabinoid receptor 1 (brain) on lipid accumulation by transcriptional control of CPT1A and CPT1B. Anim. Genet. 2014, 45, 38–47. [Google Scholar] [CrossRef] [PubMed]
- Zappaterra, M.; Deserti, M.; Mazza, R.; Braglia, S.; Zambonelli, P.; Davoli, R. A gene and protein expression study on four porcine genes related to intramuscular fat deposition. Meat Sci. 2016, 121, 27–32. [Google Scholar] [CrossRef] [PubMed]
- Wang, H.; Xiong, K.; Sun, W.; Fu, Y.; Jiang, Z.; Yu, D.; Liu, H.; Chen, J. Two completely linked polymorphisms in the PPARG transcriptional regulatory region significantly affect gene expression and intramuscular fat deposition in the longissimus dorsi muscle of Erhualian pigs. Anim. Genet. 2013, 44, 458–462. [Google Scholar] [CrossRef]
- Cánovas, A.; Quintanilla, R.; Gallardo, D.; Díaz, I.; Noguera, J.L.; Ramírez, O.; Pena, R.N. Functional and association studies on the pig HMGCR gene, a cholesterol-synthesis limiting enzyme. Animal 2010, 4, 224–233. [Google Scholar] [CrossRef] [Green Version]
- Chen, J.; Yang, X.J.; Xia, D.; Chen, J.; Wegner, J.; Jiang, Z.; Zhao, R.Q. Sterol regulatory element binding transcription factor 1 expression and genetic polymorphism significantly affect intramuscular fat deposition in the longissimus muscle of Erhualian and Sutai pigs. J. Anim. Sci. 2008, 86, 57–63. [Google Scholar] [CrossRef]
- Marco-Ramell, A.; Hummel, K.; Razzazi-Fazeli, E.; Bassols, A.; Miller, I. Concentration and pattern changes of porcine serum apolipoprotein A-I in four different infectious diseases. Electrophoresis 2015, 36, 543–551. [Google Scholar] [CrossRef]
- Lopez-Miranda, J.; Ordovas, J.M.; Ostos, M.A.; Marin, C.; Jansen, S.; Salas, J.; Blanco-Molina, A.; Jimenez-Pereperez, J.A.; Lopez-Segura, F.; Perez-Jimenez, F. Dietary fat clearance in normal subjects is modulated by genetic variation at the apolipoprotein B gene locus. Arter. Thromb. Vasc. Biol. 1997, 17, 1765–1773. [Google Scholar] [CrossRef] [PubMed]
- Stellé, J.; Fernández, A.I.; Pérez-Enciso, M.; Fernández, A.; Rodríguez, C.; Sánchez, A.; Noguera, J.L.; Folch, J.M. A non-synonymous mutation in a conserved site of the MTTP gene is strongly associated with protein activity and fatty acid profile in pigs. Anim. Genet. 2009, 40, 813–820. [Google Scholar] [CrossRef] [PubMed]
- Dean, M.; Hamon, Y.; Chimini, G. The human ATP-binding cassette (ABC) transporter superfamily. J. Lipid Res. 2001, 42, 1007–1017. [Google Scholar] [CrossRef]
- Berge, K.E.; Tian, H.; Graf, G.A.; Yu, L.; Grishin, N.V.; Schultz, J.; Kwiterovich, P.; Shan, B.; Barnes, R.; Hobbs, H.H. Accumulation of dietary cholesterol in sitosterolemia caused by mutations in adjacent ABC transporters. Science 2000, 290, 1771–1775. [Google Scholar] [CrossRef] [Green Version]
- Zhu, Y.; Gui, W.; Lin, X.; Li, H. Knock-down of circular RNA H19 induces human adipose-derived stem cells adipogenic differentiation via a mechanism involving the polypyrimidine tract-binding protein 1. Exp. Cell Res. 2020, 387, 111753. [Google Scholar] [CrossRef]
- Chen, C.; Zhang, X.; Deng, Y.; Cui, Q.; Zhu, J.; Ren, H.; Liu, Y.; Hu, X.; Zuo, J.; Peng, Y. Regulatory roles of circRNAs in adipogenesis and lipid metabolism: Emerging insights into lipid-related diseases. FEBS J. 2021, 288, 3663–3682. [Google Scholar] [CrossRef]
- Liu, W.; Singh, R.; Choi, C.S.; Lee, H.Y.; Keramati, A.R.; Samuel, V.T.; Lifton, R.P.; Shulman, G.I.; Mani, A. Low density lipoprotein (LDL) receptor-related protein 6 (LRP6) regulates body fat and glucose homeostasis by modulating nutrient sensing pathways and mitochondrial energy expenditure. J. Biol. Chem. 2012, 287, 7213–7223. [Google Scholar] [CrossRef] [Green Version]
- Li, B.; Weng, Q.; Dong, C.; Zhang, Z.; Li, R.; Liu, J.; Jiang, A.; Li, Q.; Jia, C.; Wu, W.; et al. A Key Gene, PLIN1, Can Affect Porcine Intramuscular Fat Content Based on Transcriptome Analysis. Genes 2018, 9, 194. [Google Scholar] [CrossRef] [Green Version]
- Ivanov, I.; Kuhn, H.; Heydeck, D. Structural and functional biology of arachidonic acid 15-lipoxygenase-1 (ALOX15). Gene 2015, 573, 1–32. [Google Scholar] [CrossRef]
- Luo, X.; Li, C.; Tan, R.; Xu, X.; Wu, W.K.K.; Satoh, A.; Wang, T.; Yu, S. A RasGAP, DAB2IP, regulates lipid droplet homeostasis by serving as GAP toward RAB40C. Oncotarget 2017, 8, 85415–85427. [Google Scholar] [CrossRef]
- Sharma, N.K.; Langberg, K.A.; Mondal, A.K.; Das, S.K. Phospholipid biosynthesis genes and susceptibility to obesity: Analysis of expression and polymorphisms. PLoS ONE 2013, 8, e65303. [Google Scholar] [CrossRef]
- Rivera-Gonzalez, G.C.; Shook, B.A.; Andrae, J.; Holtrup, B.; Bollag, K.; Betsholtz, C.; Rodeheffer, M.S.; Horsley, V. Skin Adipocyte Stem Cell Self-Renewal Is Regulated by a PDGFA/AKT-Signaling Axis. Cell Stem Cell 2016, 19, 738–751. [Google Scholar] [CrossRef] [PubMed] [Green Version]
- Qiu, Y.; Ding, R.; Zhuang, Z.; Wu, J.; Yang, M.; Zhou, S.; Ye, Y.; Geng, Q.; Xu, Z.; Huang, S.; et al. Genome-wide detection of CNV regions and their potential association with growth and fatness traits in Duroc pigs. BMC Genom. 2021, 22, 332. [Google Scholar]
- Cheng, X.; Chen, X.; Wang, P.; Chen, T.; Sun, J.; Xi, Q.; Zhang, Y. Exploration of targets regulated by miR-125b in porcine adipocytes. In Vitro Cell. Dev. Biol. Anim. 2020, 2, 103–111. [Google Scholar] [CrossRef] [PubMed]
- Wang, K.; Li, W.; Bai, Y.; Yang, W.; Ling, Y.; Fang, M. ssc-miR-7134-3p regulates fat accumulation in castrated male pigs by targeting MARK4 gene. Int. J. Biol. Sci. 2017, 13, 189–197. [Google Scholar] [CrossRef] [PubMed] [Green Version]
- Peng, Y.; Li, H.; Li, X.; Yu, S.; Xiang, H.; Peng, J.; Jiang, S. MicroRNA-215 impairs adipocyte differentiation and co-represses FNDC3B and CTNNBIP1. Int. J. Biochem. Cell Biol. 2016, 79, 104–112. [Google Scholar] [CrossRef]
- Liu, L.; Qian, K.; Wang, C. Discovery of porcine miRNA-196a/b may influence porcine adipogenesis in longissimus dorsi muscle by miRNA sequencing. Anim. Genet. 2017, 48, 175–181. [Google Scholar] [CrossRef]
- Xing, K.; Zhao, X.; Liu, Y.; Zhang, F.; Tan, Z.; Qi, X.; Wang, X.; Ni, H.; Guo, Y.; Sheng, X.; et al. Identification of Differentially Expressed MicroRNAs and Their Potential Target Genes in Adipose Tissue from Pigs with Highly Divergent Backfat Thickness. Animals 2020, 10, 624. [Google Scholar] [CrossRef] [Green Version]
- Zhang, X.; Huang, W.; Guo, Y.; Miao, X. An integrated analysis of microRNAs involved in fat deposition in different pig breeds. Oncotarget 2017, 29, 114787–114800. [Google Scholar] [CrossRef] [Green Version]
- Ai, Y.; Yan, B.; Wang, X. The oxidoreductases POR and CYB5R1 catalyze lipid peroxidation to execute ferroptosis. Mol. Cell. Oncol. 2021, 8, 1881393. [Google Scholar] [CrossRef]
- Wang, X.; Cheng, J.; Qin, W.; Chen, H.; Chen, G.; Shang, X.; Zhang, M.; Balsai, N.; Chen, H. Polymorphisms in 5’ proximal regulating region of THRSP gene are associated with fat production in pigs. 3 Biotech 2020, 10, 267. [Google Scholar] [CrossRef] [PubMed]
- Metzler-Zebeli, B.U.; Klinsoda, J.; Vötterl, J.; Sharma, S.; Koger, S.; Sener-Aydemir, A. Short-, medium-, and long-chain fatty acid profiles and signaling is responsive to dietary phytase and lactic acid treatment of cereals along the gastrointestinal tract of growing pigs. J. Anim. Sci. 2021, 99, skab117. [Google Scholar] [CrossRef] [PubMed]
- Pan, S.; Chen, Y.; Zhang, L.; Liu, Z.; Xu, X.; Xing, H. Curcumin represses lipid accumulation through inhibiting ERK1/2-PPAR-γ signaling pathway and triggering apoptosis in porcine subcutaneous preadipocytes. Anim. Biosci. 2022, 5, 763–777. [Google Scholar] [CrossRef] [PubMed]
- Guo, Y.X.; Mo, D.L.; Chen, Y.S.; Zhang, Y.; Zhang, Y.; Xiao, S.Q.; Liu, X.H. Effects of PI3K/AKT inhibitor wortmannin on proliferation and apoptosis of primary porcine preadipocytes. Hereditas 2012, 34, 1282–1290. [Google Scholar] [CrossRef] [PubMed]
- Liu, Z.; Liao, W.; Yin, X.; Zheng, X.; Li, Q.; Zhang, H.; Zheng, L.; Feng, X. Resveratrol-induced brown fat-like phenotype in 3T3-L1 adipocytes partly via mTOR pathway. Food Nutr. Res. 2020, 64, 1029219. [Google Scholar] [CrossRef] [Green Version]
- Bagchi, D.P.; MacDougald, O.A. Wnt Signaling: From Mesenchymal Cell Fate to Lipogenesis and Other Mature Adipocyte Functions. Diabetes 2021, 70, 1419–1430. [Google Scholar] [CrossRef]
- Li, M.; Sun, X.; Cai, H.; Sun, Y.; Plath, M.; Li, C.; Lan, X.; Lei, C.; Lin, F.; Bai, Y.; et al. Long non-coding RNA ADNCR suppresses adipogenic differentiation by targeting miR-204. BBA Gene Regul. Mech. 2016, 1859, 871–882. [Google Scholar] [CrossRef]
- Kang, Z.; Zhang, S.; Jiang, E.; Wang, X.; Wang, Z.; Chen, H.; Lan, X. circFLT1 and lncCCPG1 Sponges miR-93 to Regulate the Proliferation and Differentiation of Adipocytes by Promoting lncSLC30A9 Expression. Mol.Ther. Nucleic Acids 2020, 22, 484–499. [Google Scholar] [CrossRef]
- Wang, J.; Ren, Q.; Hua, L.; Chen, J.; Zhang, J.; Bai, H.; Li, H.; Xu, B.; Shi, Z.; Cao, H.; et al. Comprehensive Analysis of Differentially Expressed mRNA, lncRNA and circRNA and Their ceRNA Networks in the Longissimus Dorsi Muscle of Two Different Pig Breeds. Int. J. Mol. Sci. 2019, 20, 1107. [Google Scholar] [CrossRef] [Green Version]
- Pujar, M.K.; Vastrad, B.; Vastrad, C. Integrative Analyses of Genes Associated with Subcutaneous Insulin Resistance. Biomolecules 2019, 9, 37. [Google Scholar] [CrossRef] [Green Version]
- Francke, F.; Buck, F.; Bächner, D. MYND domain specific interaction of the melanin-concentrating hormone receptor 1 interacting zinc-finger protein with alpha- and beta-tubulin. Biochem. Biophys. Res. Commun. 2005, 334, 1292–1298. [Google Scholar] [CrossRef] [PubMed]
- Christiaens, V.; Lijnen, H.R. Angiogenesis and development of adipose tissue. Mol. Cell. Endocrinol. 2010, 318, 2–9. [Google Scholar] [CrossRef] [PubMed] [Green Version]
- Xu, J.; Wang, C.; Jin, E.; Gu, Y.; Li, S.; Li, Q. Identification of differentially expressed genes in longissimus dorsi muscle between Wei and Yorkshire pigs using RNA sequencing. Genes Genom. 2018, 4, 413–421. [Google Scholar] [CrossRef] [PubMed]
- Xie, L.; Qin, J.; Rao, L.; Tang, X.; Cui, D.; Chen, L.; Xu, W.; Xiao, S.; Zhang, Z.; Huang, L. Accurate prediction and genome-wide association analysis of digital intramuscular fat content in longissimus muscle of pigs. Anim. Genet. 2021, 52, 633–644. [Google Scholar] [CrossRef] [PubMed]
- Kim, D.; Langmead, B.; Salzberg, S.L. HISAT: A fast spliced aligner with low memory requirements. Nat. Methods 2015, 4, 357–360. [Google Scholar] [CrossRef] [PubMed] [Green Version]
- Li, B.; Dewey, C.N. RSEM: Accurate transcript quantification from RNA-Seq data with or without a reference genome. BMC Bioinform. 2011, 12, 323. [Google Scholar] [CrossRef] [Green Version]
- Trapnell, C.; Williams, B.A.; Pertea, G.; Mortazavi, A.; Kwan, G.; van Baren, M.J.; Salzberg, S.L.; Wold, B.J.; Pachter, L. Transcript assembly and quantification by RNA-Seq reveals unannotated transcripts and isoform switching during cell differentiation. Nat. Biotechnol. 2010, 5, 511–515. [Google Scholar] [CrossRef] [Green Version]
- Pertea, M.; Pertea, G.M.; Antonescu, C.M.; Chang, T.C.; Mendell, J.T.; Salzberg, S.L. StringTie enables improved reconstruction of a transcriptome from RNA-seq reads. Nat. Biotechnol. 2015, 3, 290–295. [Google Scholar] [CrossRef] [Green Version]
- Sun, L.; Luo, H.; Bu, D.; Zhao, G.; Yu, K.; Zhang, C.; Liu, Y.; Chen, R.; Zhao, Y. Utilizing sequence intrinsic composition to classify protein-coding and long non-coding transcripts. Nucleic Acids Res. 2013, 17, e166. [Google Scholar] [CrossRef]
- Kong, L.; Zhang, Y.; Ye, Z.Q.; Liu, X.Q.; Zhao, S.Q.; Wei, L.; Gao, G. CPC: Assess the protein-coding potential of transcripts using sequence features and support vector machine. Nucleic Acids Res. 2007, 35, W345-9. [Google Scholar] [CrossRef]
- Memczak, S.; Jens, M.; Elefsinioti, A.; Torti, F.; Krueger, J.; Rybak, A.; Maier, L.; Mackowiak, S.D.; Gregersen, L.H.; Munschauer, M.; et al. Circular RNAs are a large class of animal RNAs with regulatory potency. Nature 2013, 7441, 333–338. [Google Scholar] [CrossRef] [PubMed]
- Li, B.; Yang, J.; He, J.; Peng, X.; Zeng, Q.; Song, Y.; Xu, K.; Ma, H. Characterization of the whole transcriptome of spleens from Chinese indigenous breed Ningxiang pig reveals diverse coding and non-coding RNAs for immunity regulation. Genomics 2021, 113, 2468–2482. [Google Scholar] [CrossRef] [PubMed]
- Love, M.I.; Huber, W.; Anders, S. Moderated estimation of fold change and dispersion for RNA-seq data with DESeq2. Genome Biol. 2014, 12, 550. [Google Scholar] [CrossRef] [PubMed] [Green Version]
- Shannon, P.; Markiel, A.; Ozier, O.; Baliga, N.S.; Wang, J.T.; Ramage, D.; Amin, N.; Schwikowski, B.; Ideker, T. Cytoscape: A software environment for integrated models of biomolecular interaction networks. Genome Res. 2003, 11, 2498–2504. [Google Scholar] [CrossRef] [PubMed]


| Terms | UR mRNAs | DR mRNAs | UR lncRNAs | DR lncRNAs | UR circRNAs | DR circRNAs | UR miRNAs | DR miRNAs |
|---|---|---|---|---|---|---|---|---|
| H vs. L | 207 | 134 | 44 | 47 | 92 | 86 | 26 | 10 |
| GO ID | Description | p Value | Genes |
|---|---|---|---|
| 0048871 | multicellular organismal homeostasis | 0.0001 | COL11A2; NR1H2; TRIM32; ABCA3; FFAR4; RBP4; IP6K1; ACACA; ALOX12B; COL2A1; PBLD; DLL1; CRTC3; NPR3; ADIPOQ; LEP; DIO2 |
| 0032368 | regulation of lipid transport | 0.0001 | FURIN; NR1H2; ABCA3; LRAT; SPP1; SREBF2; ADIPOQ; LEP |
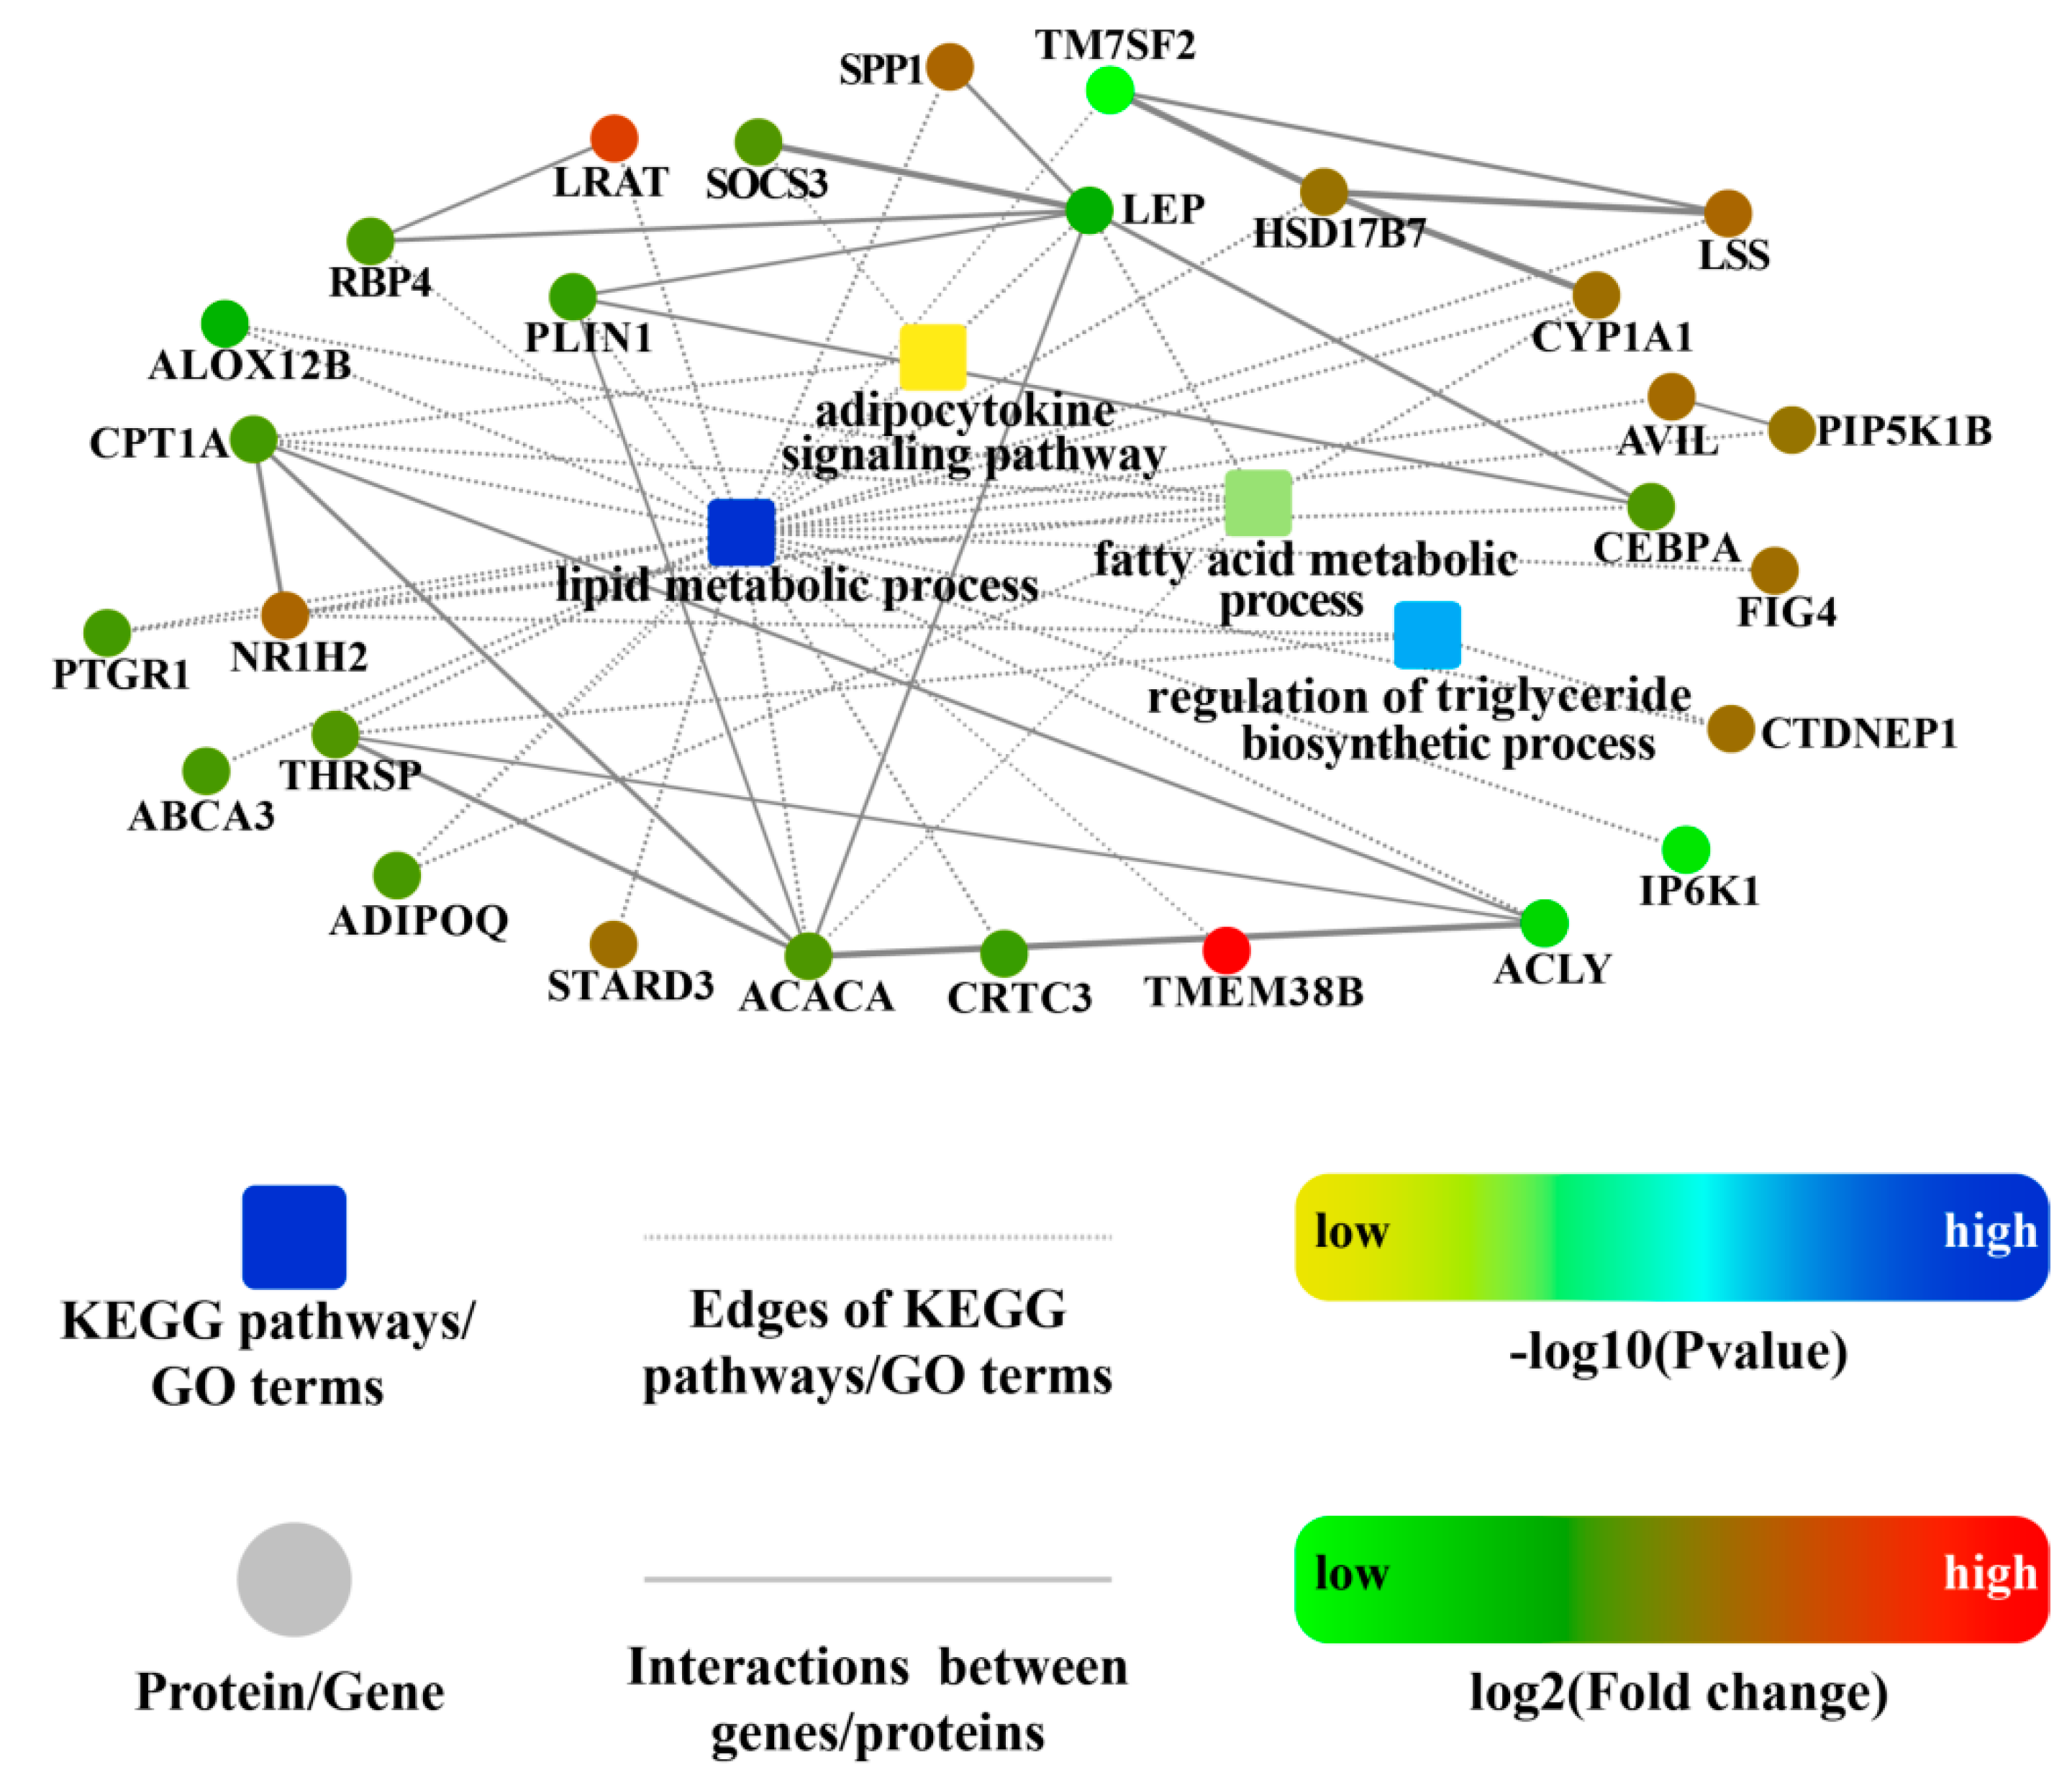
| 0006629 | lipid metabolic process | 0.0002 | PLIN1; CYP1A1; CEBPA; NR1H2; FIG4; HSD17B7; ABCA3; LRAT; SPP1; RBP4; IP6K1; CPT1A; TM7SF2; ACLY; STARD3; ACACA; CTDNEP1; ALOX12B; PTGR1; LSS; PIP5K1B; AVIL; THRSP; CRTC3; ADIPOQ; TMEM38B; LEP |
| 0050873 | brown fat cell differentiation | 0.0004 | CEBPA; FFAR4; ADIPOQ; LEP; DIO2 |
| 1905952 | regulation of lipid localization | 0.0004 | FURIN; NR1H2; ABCA3; LRAT; SPP1; SREBF2; ADIPOQ; LEP |
| 0042445 | hormone metabolic process | 0.0004 | FURIN; CYP1A1; HSD17B7; LRAT; SPP1; RBP4; STARD3; LEP; DIO2 |
| 0032371 | regulation of sterol transport | 0.0005 | FURIN; NR1H2; SREBF2; ADIPOQ; LEP |
| 0032374 | regulation of cholesterol transport | 0.0005 | FURIN; NR1H2; SREBF2; ADIPOQ; LEP |
| 0034754 | cellular hormone metabolic process | 0.0006 | CYP1A1; HSD17B7; LRAT; SPP1; RBP4; STARD3 |
| 0008610 | lipid biosynthetic process | 0.0009 | NR1H2; HSD17B7; ABCA3; TM7SF2; ACLY; STARD3; ACACA; CTDNEP1; ALOX12B; LSS; PIP5K1B; AVIL; THRSP; TMEM38B; LEP |
| 0010866 | regulation of triglyceride biosynthetic process | 0.0012 | NR1H2; CTDNEP1; THRSP |
| 0046460 | neutral lipid biosynthetic process | 0.0012 | NR1H2; CTDNEP1; AVIL; THRSP |
| 0046463 | acylglycerol biosynthetic process | 0.0012 | NR1H2; CTDNEP1; AVIL; THRSP |
| 0106106 | cold-induced thermogenesis | 0.0013 | NR1H2; FFAR4; IP6K1; NPR3; ADIPOQ; LEP; DIO2 |
| 0120161 | regulation of cold-induced thermogenesis | 0.0013 | NR1H2; FFAR4; IP6K1; NPR3; ADIPOQ; LEP; DIO2 |
| GO ID | Description | p Value | Genes |
|---|---|---|---|
| 0044241 | lipid digestion | 0.0006 | ABCG8; ENSSSCG00000010432; NPC1L1; APOA1; LIMA1; ENSSSCG00000033190; ABCG5; LEP; APOA4 |
| 0098856 | intestinal lipid absorption | 0.0019 | ABCG8; NPC1L1; APOA1; LIMA1; ABCG5; FABP2; LEP; APOA4 |
| 0042953 | lipoprotein transport | 0.0137 | APOBEC1; APOB; MTTP; PPARG; UNC119 |
| 0034370 | triglyceride-rich lipoprotein particle remodeling | 0.0213 | NR1H4; APOA1; LPL; APOA4 |
| 0055088 | lipid homeostasis | 0.0240 | NR1H4; MYLIP; NR1H2; ANGPTL3; LIPG; LIPC; HNF4A; ABCA3; ABCG8; APOB; MTTP; LAMTOR1; ITGB6; ABCB11; MED13; ACACA; NUS1; SOAT1; SREBF2; APOA1; RTN4; LIMA1; ABCG5; LPL; APOA4 |
| 0019433 | triglyceride catabolic process | 0.0261 | APOB; PNLIPRP2; PNPLA3; AADAC; LPL; APOA4 |
| 0008203 | cholesterol metabolic process | 0.0308 | ANGPTL3; LIPC; GBA2; HSD17B7; APOB; NSDHL; TM7SF2; HMGCR; CFTR; NPC1L1; LSS; SOAT1; CLN8; ULT2B1; CYP11A1; SCAP; CEL; APOA1; SREBF1; PIP4P1; LEP; APOA4 |
| 0030301 | cholesterol transport | 0.0353 | FURIN; NR1H2; LIPG; LIPC; RELCH; ABCG8; APOB; PIP4K2A; LAMTOR1; CFTR; NPC1L1; NUS1; SOAT1; STX12; SREBF2; APOA1; STARD4; LIMA1; ABCG5; LEP; APOA4 |
| 0006084 | acetyl-CoA metabolic process | 0.0366 | ACSS1; PDK1; ACLY; ACACA; PIPOX; ACOT12; HMGCS2 |
| 0090208 | positive regulation of triglyceride metabolic process | 0.0399 | NR1H2; MFSD2A; CTDNEP1; AADAC; SREBF1; APOA4 |
| 0016406 | carnitine O-acyltransferase activity | 0.0304 | CRAT; CPT1A; CROT |
| 0106018 | phosphatidylinositol-3,5-bisphosphate phosphatase activity | 0.0304 | MTM1; MTMR2; MTMR6 |
| 0005319 | lipid transporter activity | 0.0370 | SLC5A8; STRA6; MFSD2A; ENSSSCG00000005307; ABCA3; ABCG8; APOB; MTTP; PITPNB; SLC51A; ABCB11; ANO9; APOA1; STARD4; ABCC11; ABCG5; GLTP; APOA4 |
| 0034040 | lipid-transporting ATPase activity | 0.0433 | ABCB11; ABCC11 |
| 0042627 | chylomicron | 0.0298 | APOB; APOA4; APOH |
| GO ID | Description | p Value | Genes |
|---|---|---|---|
| 1903726 | negative regulation of phospholipid metabolic process | 0.0037 | DAB2IP; PDGFA |
| 0006644 | phospholipid metabolic process | 0.0039 | DAB2IP; PDGFA; PCYT1A; AMBRA1; PIK3C2B; ALOX15; SMG1 |
| 0046474 | glycerophospholipid biosynthetic process | 0.0043 | PDGFA; PCYT1A; PIK3C2B; ALOX15 |
| 1903725 | regulation of phospholipid metabolic process | 0.0107 | DAB2IP; PDGFA; AMBRA1 |
| 0036314 | response to sterol | 0.0108 | LRP6; RORA |
| 0008654 | phospholipid biosynthetic process | 0.0108 | PDGFA; PCYT1A; PIK3C2B; ALOX15 |
| 0045017 | glycerolipid biosynthetic process | 0.0112 | PDGFA; PCYT1A; PIK3C2B; ALOX15 |
| 0006650 | glycerophospholipid metabolic process | 0.0139 | PDGFA; PCYT1A; PIK3C2B; ALOX15; SMG1 |
| 0046488 | phosphatidylinositol metabolic process | 0.0267 | PDGFA; PIK3C2B; SMG1 |
| 0043553 | negative regulation of phosphatidylinositol 3-kinase activity | 0.0278 | DAB2IP |
| 2001300 | lipoxin metabolic process | 0.0278 | ALOX15 |
| 0006661 | phosphatidylinositol biosynthetic process | 0.0445 | PDGFA; PIK3C2B |
| 0010511 | regulation of phosphatidylinositol biosynthetic process | 0.0459 | PDGFA |
| 0019321 | pentose metabolic process | 0.0459 | FGGY |
| 0019372 | lipoxygenase pathway | 0.0459 | ALOX15 |
| GO ID | Description | p Value | Gene Number |
|---|---|---|---|
| 0006631 | fatty acid metabolic process | 0.0026 | 139 |
| 0045444 | fat cell differentiation | 0.0040 | 126 |
| 0046486 | glycerolipid metabolic process | 0.0070 | 161 |
| 0050994 | regulation of lipid catabolic process | 0.0091 | 27 |
| 0032365 | intracellular lipid transport | 0.0136 | 15 |
| 0046890 | regulation of lipid biosynthetic process | 0.0171 | 79 |
| 0046320 | regulation of fatty acid oxidation | 0.0192 | 14 |
| 0016055 | Wnt signaling pathway | 0.0229 | 199 |
| 0030497 | fatty acid elongation | 0.0259 | 9 |
| 0050873 | brown fat cell differentiation | 0.0269 | 29 |
| 0006633 | fatty acid biosynthetic process | 0.0288 | 53 |
| 0019395 | fatty acid oxidation | 0.0298 | 45 |
| 1905952 | regulation of lipid localization | 0.0364 | 74 |
| 0034440 | lipid oxidation | 0.0401 | 46 |
| 0006635 | fatty acid beta-oxidation | 0.0476 | 32 |
Publisher’s Note: MDPI stays neutral with regard to jurisdictional claims in published maps and institutional affiliations. |
© 2022 by the authors. Licensee MDPI, Basel, Switzerland. This article is an open access article distributed under the terms and conditions of the Creative Commons Attribution (CC BY) license (https://creativecommons.org/licenses/by/4.0/).
Share and Cite
Ding, Y.; Hou, Y.; Ling, Z.; Chen, Q.; Xu, T.; Liu, L.; Yu, N.; Ni, W.; Ding, X.; Zhang, X.; et al. Identification of Candidate Genes and Regulatory Competitive Endogenous RNA (ceRNA) Networks Underlying Intramuscular Fat Content in Yorkshire Pigs with Extreme Fat Deposition Phenotypes. Int. J. Mol. Sci. 2022, 23, 12596. https://doi.org/10.3390/ijms232012596
Ding Y, Hou Y, Ling Z, Chen Q, Xu T, Liu L, Yu N, Ni W, Ding X, Zhang X, et al. Identification of Candidate Genes and Regulatory Competitive Endogenous RNA (ceRNA) Networks Underlying Intramuscular Fat Content in Yorkshire Pigs with Extreme Fat Deposition Phenotypes. International Journal of Molecular Sciences. 2022; 23(20):12596. https://doi.org/10.3390/ijms232012596
Chicago/Turabian StyleDing, Yueyun, Yinhui Hou, Zijing Ling, Qiong Chen, Tao Xu, Lifei Liu, Na Yu, Wenliang Ni, Xiaoling Ding, Xiaodong Zhang, and et al. 2022. "Identification of Candidate Genes and Regulatory Competitive Endogenous RNA (ceRNA) Networks Underlying Intramuscular Fat Content in Yorkshire Pigs with Extreme Fat Deposition Phenotypes" International Journal of Molecular Sciences 23, no. 20: 12596. https://doi.org/10.3390/ijms232012596