Article

Identification of Key Genes during Ethylene-Induced Adventitious Root Development in Cucumber (Cucumis sativus L.)

1
College of Horticulture, Gansu Agricultural University, Lanzhou 730070, China
2
College of Science, Gansu Agricultural University, Lanzhou 730070, China
*
Author to whom correspondence should be addressed.
Int. J. Mol. Sci. 2022, 23(21), 12981; https://doi.org/10.3390/ijms232112981
Submission received: 28 September 2022 / Revised: 20 October 2022 / Accepted: 24 October 2022 / Published: 26 October 2022
(This article belongs to the Special Issue Omics Study to Uncover Signalling and Gene Regulation in Plants)

Abstract

:
Ethylene (ETH), as a key plant hormone, plays critical roles in various processes of plant growth and development. ETH has been reported to induce adventitious rooting. Moreover, our previous studies have shown that exogenous ETH may induce plant adventitious root development in cucumber (Cucumis sativus L.). However, the key genes involved in this process are still unclear. To explore the key genes in ETH-induced adventitious root development, we employed a transcriptome technique and revealed 1415 differentially expressed genes (DEGs), with 687 DEGs up-regulated and 728 DEGs down-regulated. Using Kyoto Encyclopedia of Genes and Genomes (KEGG) pathway analysis, we further identified critical pathways that were involved in ETH-induced adventitious root development, including carbon metabolism (starch and sucrose metabolism, glycolysis/gluconeogenesis, citrate cycle (TCA cycle), oxidative phosphorylation, fatty acid biosynthesis, and fatty acid degradation), secondary metabolism (phenylalanine metabolism and flavonoid biosynthesis) and plant hormone signal transduction. In carbon metabolism, ETH reduced the content of sucrose, glucose, starch, the activity of sucrose synthase (SS), sucrose–phosphate synthase (SPS) and hexokinase (HK), and the expressions of CsHK2, pyruvate kinase 2 (CsPK2), and CsCYP86A1, whereas it enhanced the expressions of β-amylase 1 (CsBAM1) and β-amylase 3 (CsBAM3). In secondary metabolism, the transcript levels of phenylalanine ammonia-lyase (CsPAL) and flavonoid 3′-monooxygenase (CsF3′M) were negatively regulated, and that of primary-amine oxidase (CsPAO) was positively regulated by ETH. Additionally, the indole-3-acetic acid (IAA) content and the expressions of auxin and ETH signaling transduction-related genes (auxin transporter-like protein 5 (CsLAX5), CsGH3.17, CsSUAR50, and CsERS) were suppressed, whereas the abscisic acid (ABA) content and the expressions of ABA and BR signaling transduction-related genes (CsPYL1, CsPYL5, CsPYL8, BRI1-associated kinase 1 (CsBAK1), and CsXTH3) were promoted by ETH. Furthermore, the mRNA levels of these genes were confirmed by real-time PCR (RT-qPCR). These results indicate that genes related to carbon metabolism, secondary metabolite biosynthesis, and plant hormone signaling transduction are involved in ETH-induced adventitious root development. This work identified the key pathways and genes in ETH-induced adventitious rooting in cucumber, which may provide new insights into ETH-induced adventitious root development and will be useful for investigating the molecular roles of key genes in this process in further studies.

1. Introduction

An adventitious root is a kind of lateral root that often arises from leafstalk, stems, and some non-pericycle tissue [1,2]. The developmental process of an adventitious root is complicated and can be divided into three successive phases: induction, formation, and expression [3]. Adventitious rooting represents the regenerative ability of plants and these roots can obtain water and nutrients from the soil, fix plants on the substrate, and store food [3]. Hence, adventitious rooting has a pivotal role in vegetative propagation. Adventitious root development is influenced by various environmental and endogenous factors, such as mineral nutrition, light, temperature, ectomycorrhizas, aging, phenolic compounds, and phytohormones [4].
Ethylene (ETH), a gaseous signaling phytohormone, is involved in many processes of plant growth and development, including seed dormancy and germination [5], seedling growth [6], primary root development [7], adventitious root formation [8], sex expression [9], fruit set [10], fruit firmness [11], and fruit and vegetable preservation [12]. Moreover, ETH is a key stress signal molecule that responds to many adverse ecological conditions, including cold and freezing stress, heat stress, drought stress, flooding, salt stress, and heavy metal stress [13,14].
Although ETH may influence many aspects of plant growth and development, the roles of ETH in adventitious root development are still unclear. Our previous studies have demonstrated that 10 μM ETH could significantly induce adventitious root development in cucumber and marigold (Tagetes erecta L.) [1,15,16]. Moreover, ETH is associated with other signal molecules, such as nitric oxide (NO), auxin, and calcium ions (Ca2+) in the promotion of adventitious rooting [1,8,17,18]. For example, NO could be involved in ETH-promoting adventitious root development by enhancing the activities of nitric oxide synthase (NOS) and nitrate reductase (NR), and by regulating rooting-related genes [CsDNAJ-1 and calcium-dependent protein kinases 1/5 (CsCDPK1/5)] [1]. The application of indole-3-butyric acid (IBA) could promote the adventitious rooting in apple (Malus domestica Borkh.) rootstock by regulating ETH synthesis. Both auxin and ETH inhibitors significantly prevented adventitious rooting in apple [17]. Auxin increased the transcript levels of ETH biosynthesis genes, including 1-aminocyclopropane-l-carboxylic acid synthase (ACS) and ACC oxidase (ACO), which resulted in the retention of ETH [8]. Therefore, auxin could trigger the development of an adventitious root through the ETH synthesis pathway. Under salt stress, ETH may be involved in adventitious rooting induced by Ca2+ [18]. The application of calcium chloride (CaCl2) enhanced the activities of ETH synthesis enzymes and increased the content of ETH precursor 1-aminocyclopropane-1-carboxylic acid (ACC) and endogenous ETH under salt stress, indicating that ETH might act as the downstream molecule in Ca2+-induced adventitious root development in cucumber.
ETH and its crosstalk with other signaling molecules could regulate adventitious root development. However, many studies have only elucidated its mechanism from the perspective of pharmacology, and the genes or proteins in ETH-induced adventitious rooting are still unknown. Proteomic analysis found that exogenous ETH could promote adventitious rooting in cucumber by regulating some important proteins [16]. However, the key genes of ETH-induced adventitious rooting are still unclear. Transcriptome, an effective genetic research technique, has been widely applied to identify and analyze some key genes in plants and animals. The method has the characteristics of low cost, high efficiency, and high precision. [19]. Hence, to illustrate the key genes affecting ETH in adventitious root development in cucumber, the transcriptome technique was used in the present study. Using KEGG pathway analysis, some critical differentially expressed genes (DEGs) in enriched pathways, such as carbon metabolism, secondary metabolism, and plant hormone signal transduction, were analyzed. To verify the reliability of the transcriptome data, the contents of sucrose, glucose, starch, and endogenous indole-3-acetic acid (IAA) and abscisic acid (ABA), the activity of enzymes, including sucrose synthase (SS), sucrose–phosphate synthase (SPS), hexokinase (HK), and phenylalanine ammonia-lyase (PAL), and the expressions of key genes were determined. Therefore, this work may provide new insights into ETH-induced adventitious root development and be useful for further study of ETH-prompted rooting at the molecular level.

2. Results

2.1. DEGs, GO, and KEGG Analysis

In this study, we identified a total of 1415 DEGs in the cucumber transcriptome under ETH treatment, among which 687 DEGs were up-regulated and 728 DEGs were down-regulated (Figure 1A and Supplementary Figure S2). These DEGs are specific to the ETH-induced adventitious root development process. The number of non-ETH-induced adventitious rooting DEGs was 19,256 (Figure 1A). GO annotation of the DEGs showed that 634 terms were classified as BP, CC, and MF (Figure 1B, Supplementary Table S3). In the BP category, the “carbohydrate catabolic process (11 DEGs)”, “nucleotide catabolic process (nine DEGs)”, “nucleoside phosphate catabolic process (nine DEGs)”, “nucleobase-containing small molecule biosynthetic process (10 DEGs)” and “pyruvate metabolic process (nine DEGs)” were enriched. In the CC category, the “extracellular region (seven DEGs)”, “cell wall (10 DEGs)”, and “external encapsulating structure (10 DEGs)” were enriched. In the MF category, “hydrolase activity, hydrolyzing O-glycosyl compounds (30 DEGs)”, “protein heterodimerization activity (11 DEGs)”, “hydrolase activity, acting on glycosyl bonds (30 DEGs)”, “sulfate transmembrane transporter activity (four DEGs)”, and “sulfur compound transmembrane transporter activity (four DEGs)” were the top five enriched terms (Figure 1B).
The top 20 KEGG pathways corresponding to the most abundant DEGs are displayed in Table 1. Among them, “linoleic acid metabolism (6 DEGs)”, “starch and sucrose metabolism (17 DEGs)”, “sesquiterpenoid and triterpenoid biosynthesis (5 DEGs)”, “fatty acid degradation (8 DEGs)”, “isoquinoline alkaloid biosynthesis (4 DEGs)”, “phenylalanine metabolism (7 DEGs)”, “plant hormone signal transduction (26 DEGs)”, “fatty acid metabolism (9 DEGs)”, “pentose and glucuronate interconversions (10 DEGs)” and “cutin, suberin and wax biosynthesis (5 DEGs)” were the top 10 enriched terms in the KEGG pathways (Table 1 and Supplementary Table S4).

2.2. Carbon Metabolism

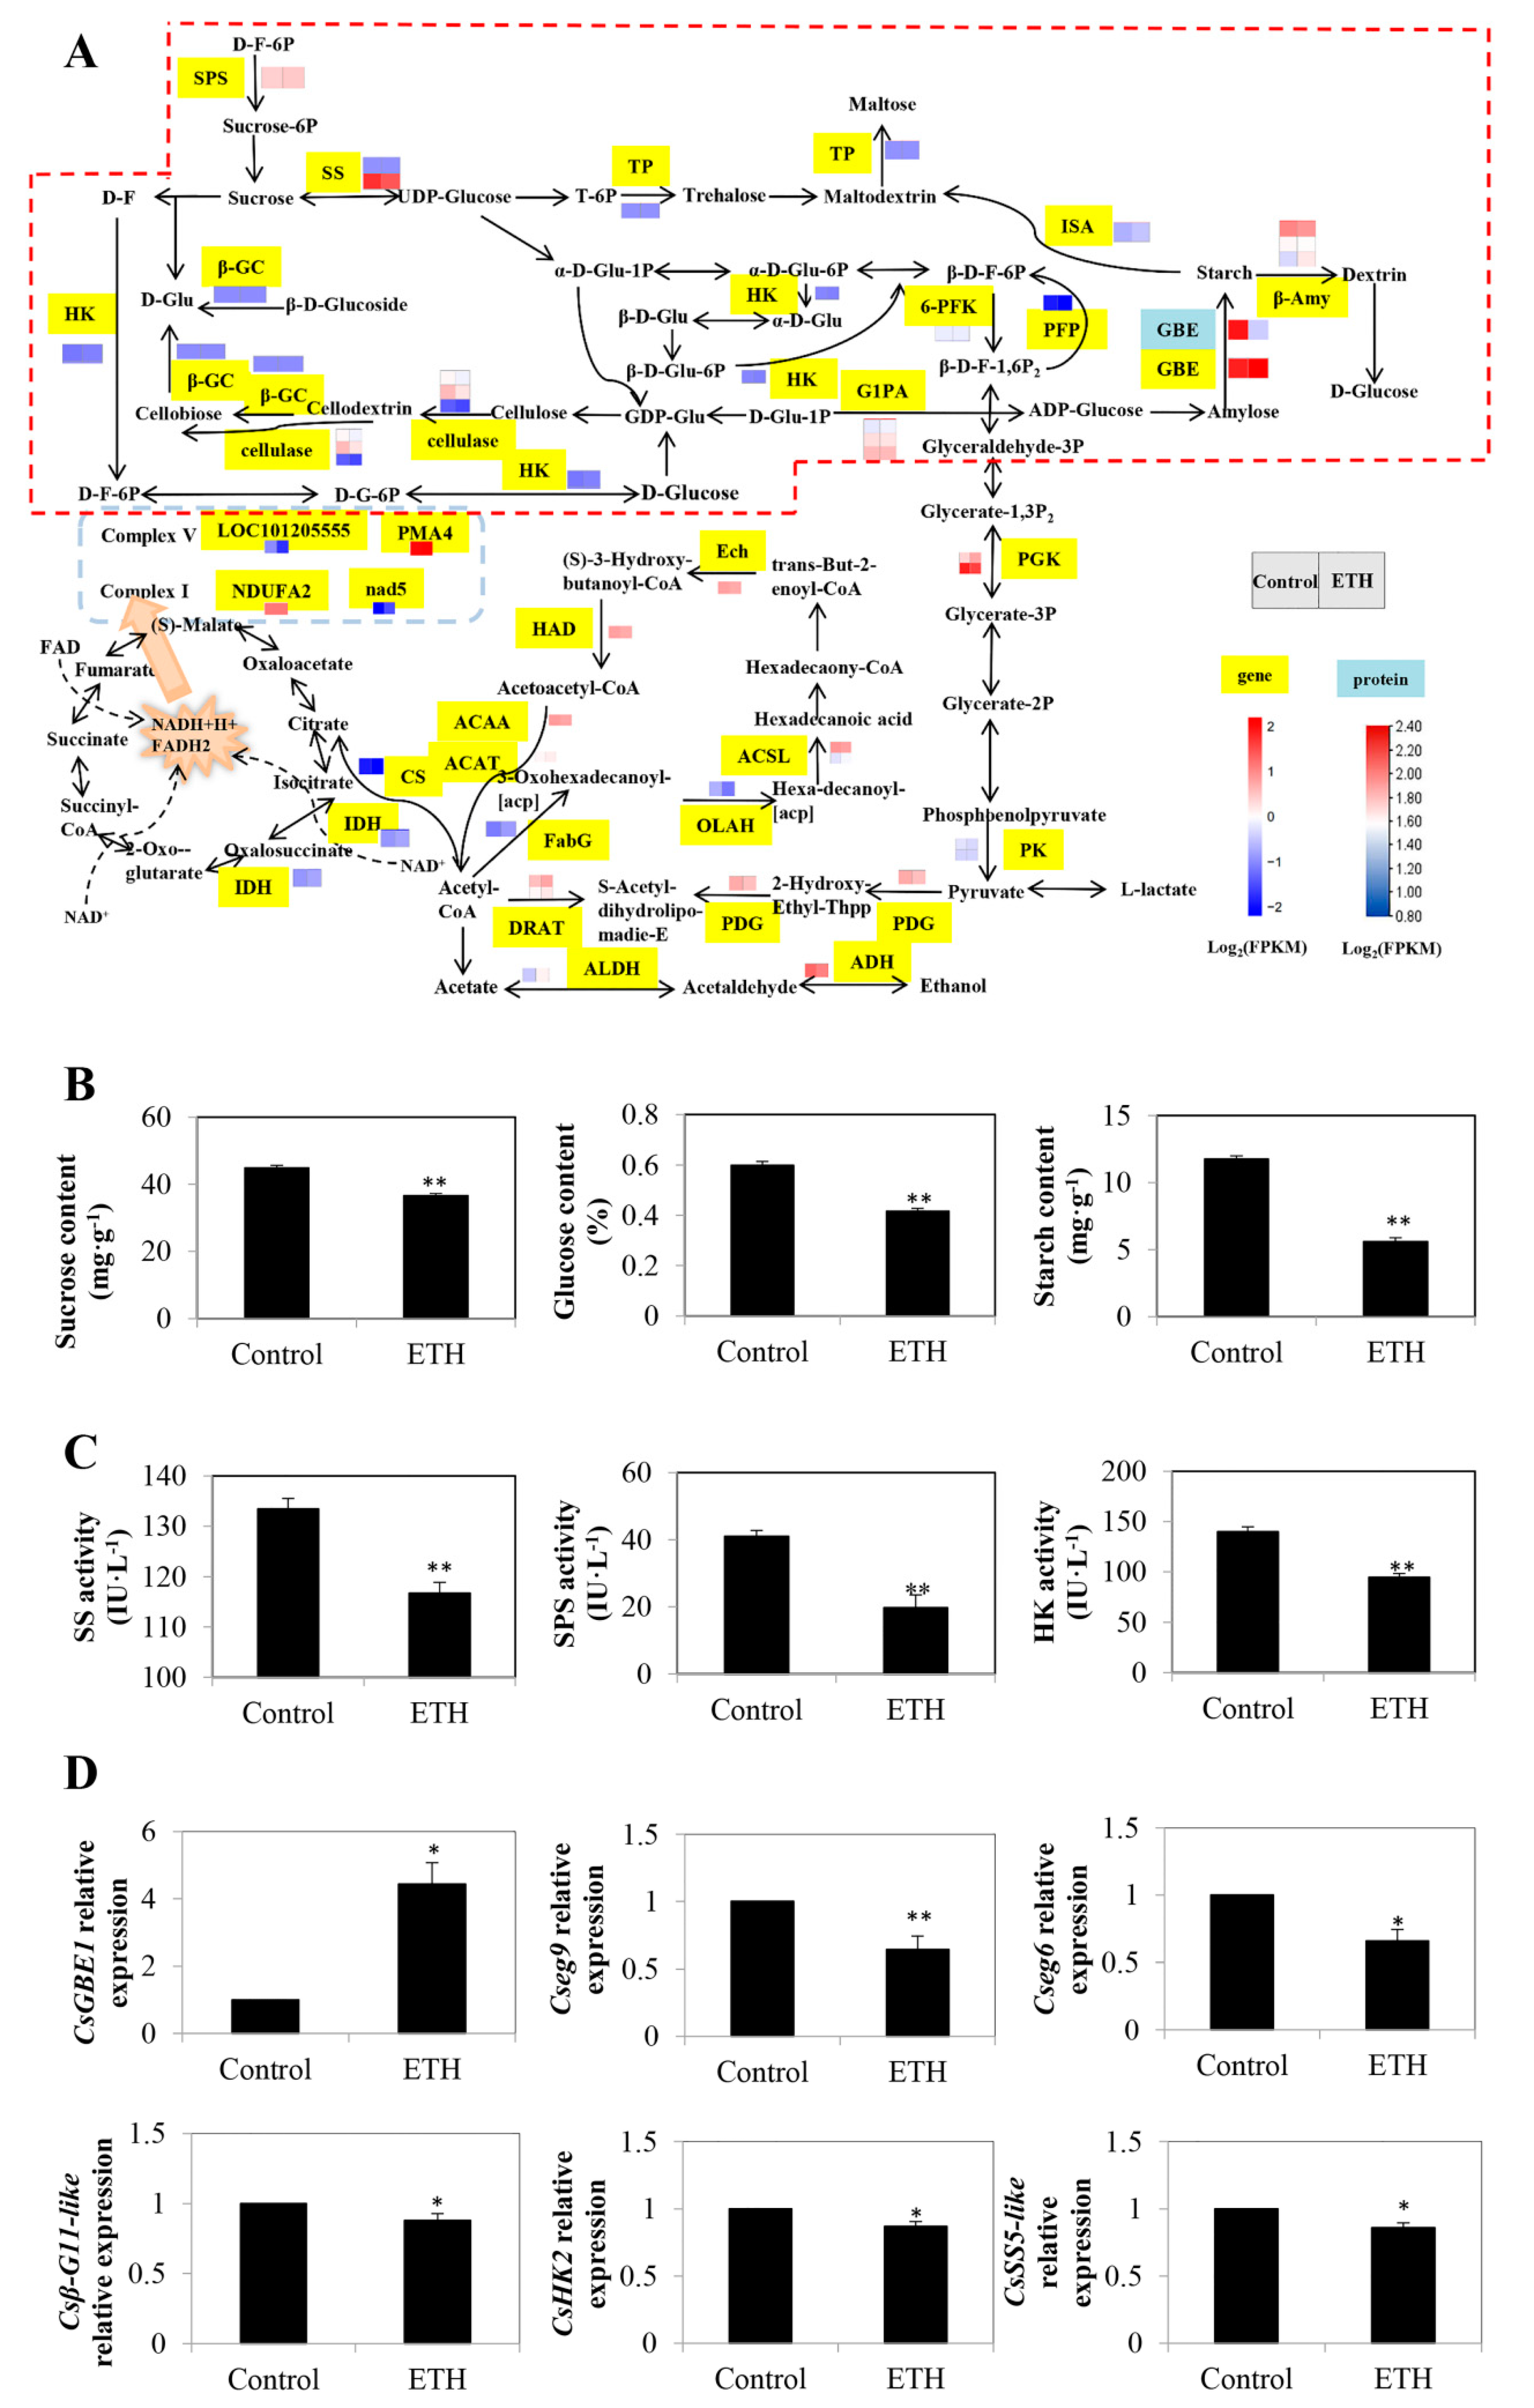
2.2.1. Starch and Sucrose Metabolism

As shown in Figure 2A, 17 DEGs and 1 DEP were detected in starch and sucrose metabolism (Supplementary Table S5). In the sucrose metabolism pathway, one hexokinase (HK) gene, HK2 (LOC101216058), one beta-glucosidase (β-GC) gene named beta-glucosidase 11-like (LOC101214838), and three cellulose genes, endoglucanase 17 (eg17; LOC101204921), endoglucanase 6 (eg6; LOC101203271), and endoglucanase 9 (eg9; LOC101203271), were down-regulated by ETH treatment. Moreover, exogenous ETH suppressed the transcript level of two sucrose synthesis-related genes sucrose synthase (SS; LOC101211461) and sucrose-phosphate synthase (SPS; LOC101221022), and two trehalose synthesis-related genes trehalose phosphatase (TP; LOC101211097 and LOC101212172). Furthermore, the transcript levels of three glucose-1-phosphate adenylyltransferase (G1PA) genes (LOC101221562, LOC101208904, and LOC101208605) were down-regulated by ETH treatment (Figure 2A).
In starch metabolism, the 1,4-alpha-glucan branching enzyme (GBE1) gene (LOC101215687) for starch synthesis in ETH was up-regulated. ETH treatment down-regulated the expression of two beta-amylase (β-Amy) genes (LOC101221739 and LOC101213455) for dextrin synthesis and up-regulated that of the β-Amy gene (LOC101222005). The transcript level of isoamylase (ISA; LOC 101209348) was decreased (Figure 2A and Supplementary Table S5).
In order to verify the reliability of the transcriptome data, we measured the sucrose, glucose, and starch contents, relevant enzyme activity, and gene expression during ETH-induced adventitious rooting in cucumber. As shown in Figure 2B, compared with the control, ETH treatment significantly decreased the sucrose, glucose, and starch contents in cucumber explants. Moreover, the activities of SS, SPS, and HK with ETH treatment were significantly lower than those in the control (Figure 2C). Additionally, the expressions of six DEGs were determined by quantitative real-time PCR (RT-qPCR) assays (Figure 2D). Among them, except for CsGBE1, the expressions of other genes, including Cseg9, Cseg6, Csβ-G11-like, CsHK2, and CsSS5-like were decreased with ETH treatment.

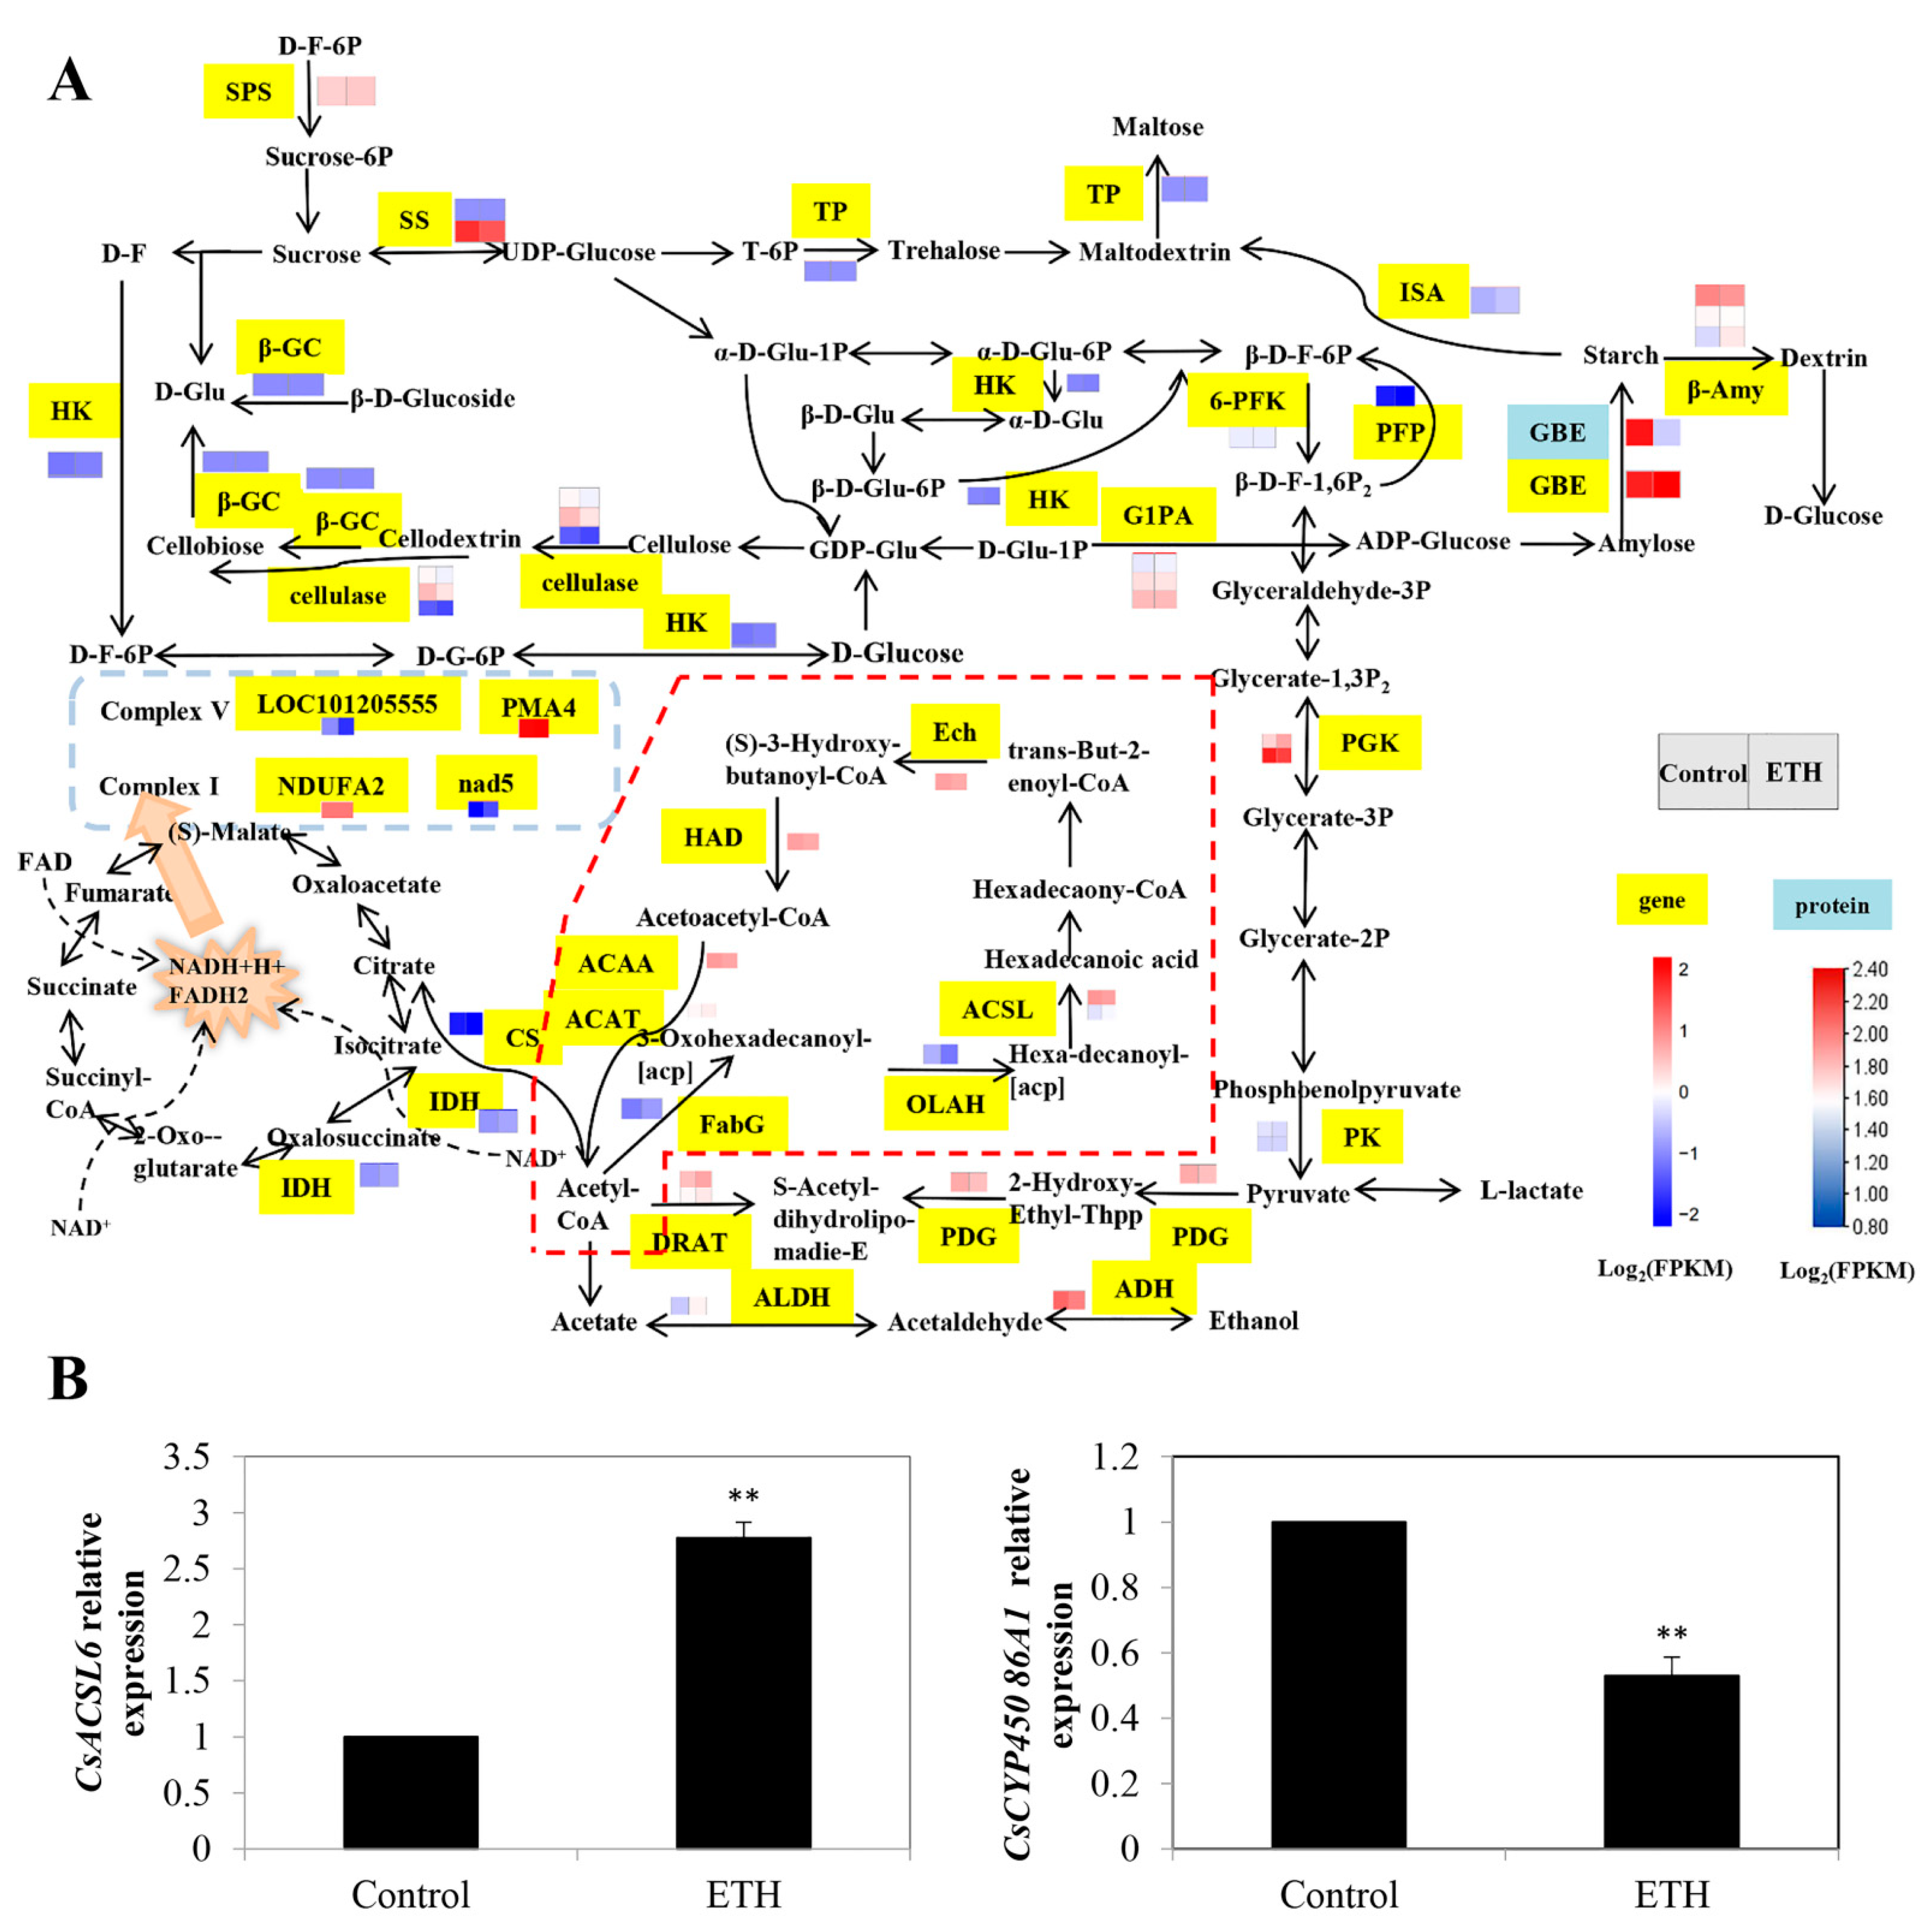
2.2.2. Glycolysis/Gluconeogenesis, Citrate Cycle (TCA Cycle) and Oxidative Phosphorylation

Twelve DEGs in the glycolysis/gluconeogenesis pathway were identified (Figure 3A and Supplementary Table S6). The 6-phosphofructokinase (6-PFK) gene (LOC101202739) and diphosphate-fructose-6-phosphate 1-phosphotransferase (DF-6P-1P) gene (LOC101215219) were both down-regulated in ETH treatment. Additionally, two phosphoglycerate kinase (PGK) genes (LOC101219631 and LOC101215513) were up-regulated and down-regulated, respectively. Two pyruvate biosynthesis-related genes pyruvate kinase (PK; LOC101206620 and LOC101220786) were down-regulated. The relative expressions of pyruvate dehydrogenase (PDG; LOC101204247) and dihydrolipoyllysine-residue acetyltransferase (DRAT; LOC101215151 and LOC101220730) were down-regulated by ETH. Meanwhile, ETH increased the transcript level of aldehyde dehydrogenase ((NAD+) ALDH; LOC101219569), whereas it decreased the transcript level of alcohol dehydrogenase (ADH; LOC101211996).
In the TCA cycle, five DEGs were detected. Among them, one PDG and two DRAT genes appeared in the glycolysis pathway (Figure 3B and Supplementary Table S6). Exogenous ETH down-regulated the expression of ATP citrate synthase (CS; LOC101209539) for citrate synthesis and isocitrate dehydrogenase NADP+ (IDH; LOC101202770).
There were four DEGs in the oxidative phosphorylation pathway (Figure 3C and Supplementary Table S6). Among them, the transcript levels of NADH dehydrogenase [ubiquinone] 1 alpha subcomplex subunit 2 (NDUFA2; LOC 101208633) and NADH dehydrogenase subunit 5 (nad5; LOC11123919) in complex I were enhanced. In complex V, the expression of uncharacterized gene LOC101205555 was down-regulated, whereas the expression of plasma membrane ATPase 4 (PMA4; LOC101213505) was up-regulated by ETH treatment.
Compared with the control, ETH treatment significantly decreased PK activity (Figure 3D). Moreover, the relative expression of Csnad5 with ETH treatment was remarkably enhanced in comparison with the control, whereas the relative expressions of CsPFP, CsPK2, CsACS2, and CsIDH were decreased (Figure 3E). These results are consistent with those of the transcriptome analysis.

2.2.3. Fatty Acid Biosynthesis and Fatty Acid Degradation

Totals of four and eight DEGs were mapped to the pathways of fatty acid biosynthesis and fatty acid degradation, respectively (Figure 4A and Supplementary Table S7). In the fatty acid biosynthesis pathway, ETH increased the transcript levels of FabG (LOC101221009) and long-chain-fatty-acid-CoA ligase (ACSL; LOC101207461 and LOC101212158), whereas it down-regulated the expression of oleoyl-[acyl-carrier-protein] hydrolase (OLAH; LOC101210955). In the fatty acid degradation pathway, except for ADH and long-chain fatty acid omega-monooxygenase (CYP86A), the other gene expressions were up-regulated by ETH treatment (Figure 4A).
According to the RT-qPCR analysis, the relative expression of CsACSL6 with ETH treatment had a significant increase compared with the control, whereas the relative expression of CsCYP86A1 in the pathway of fatty acid degradation significantly declined with ETH treatment in comparison with the control (Figure 4B).

2.3. Secondary Metabolism

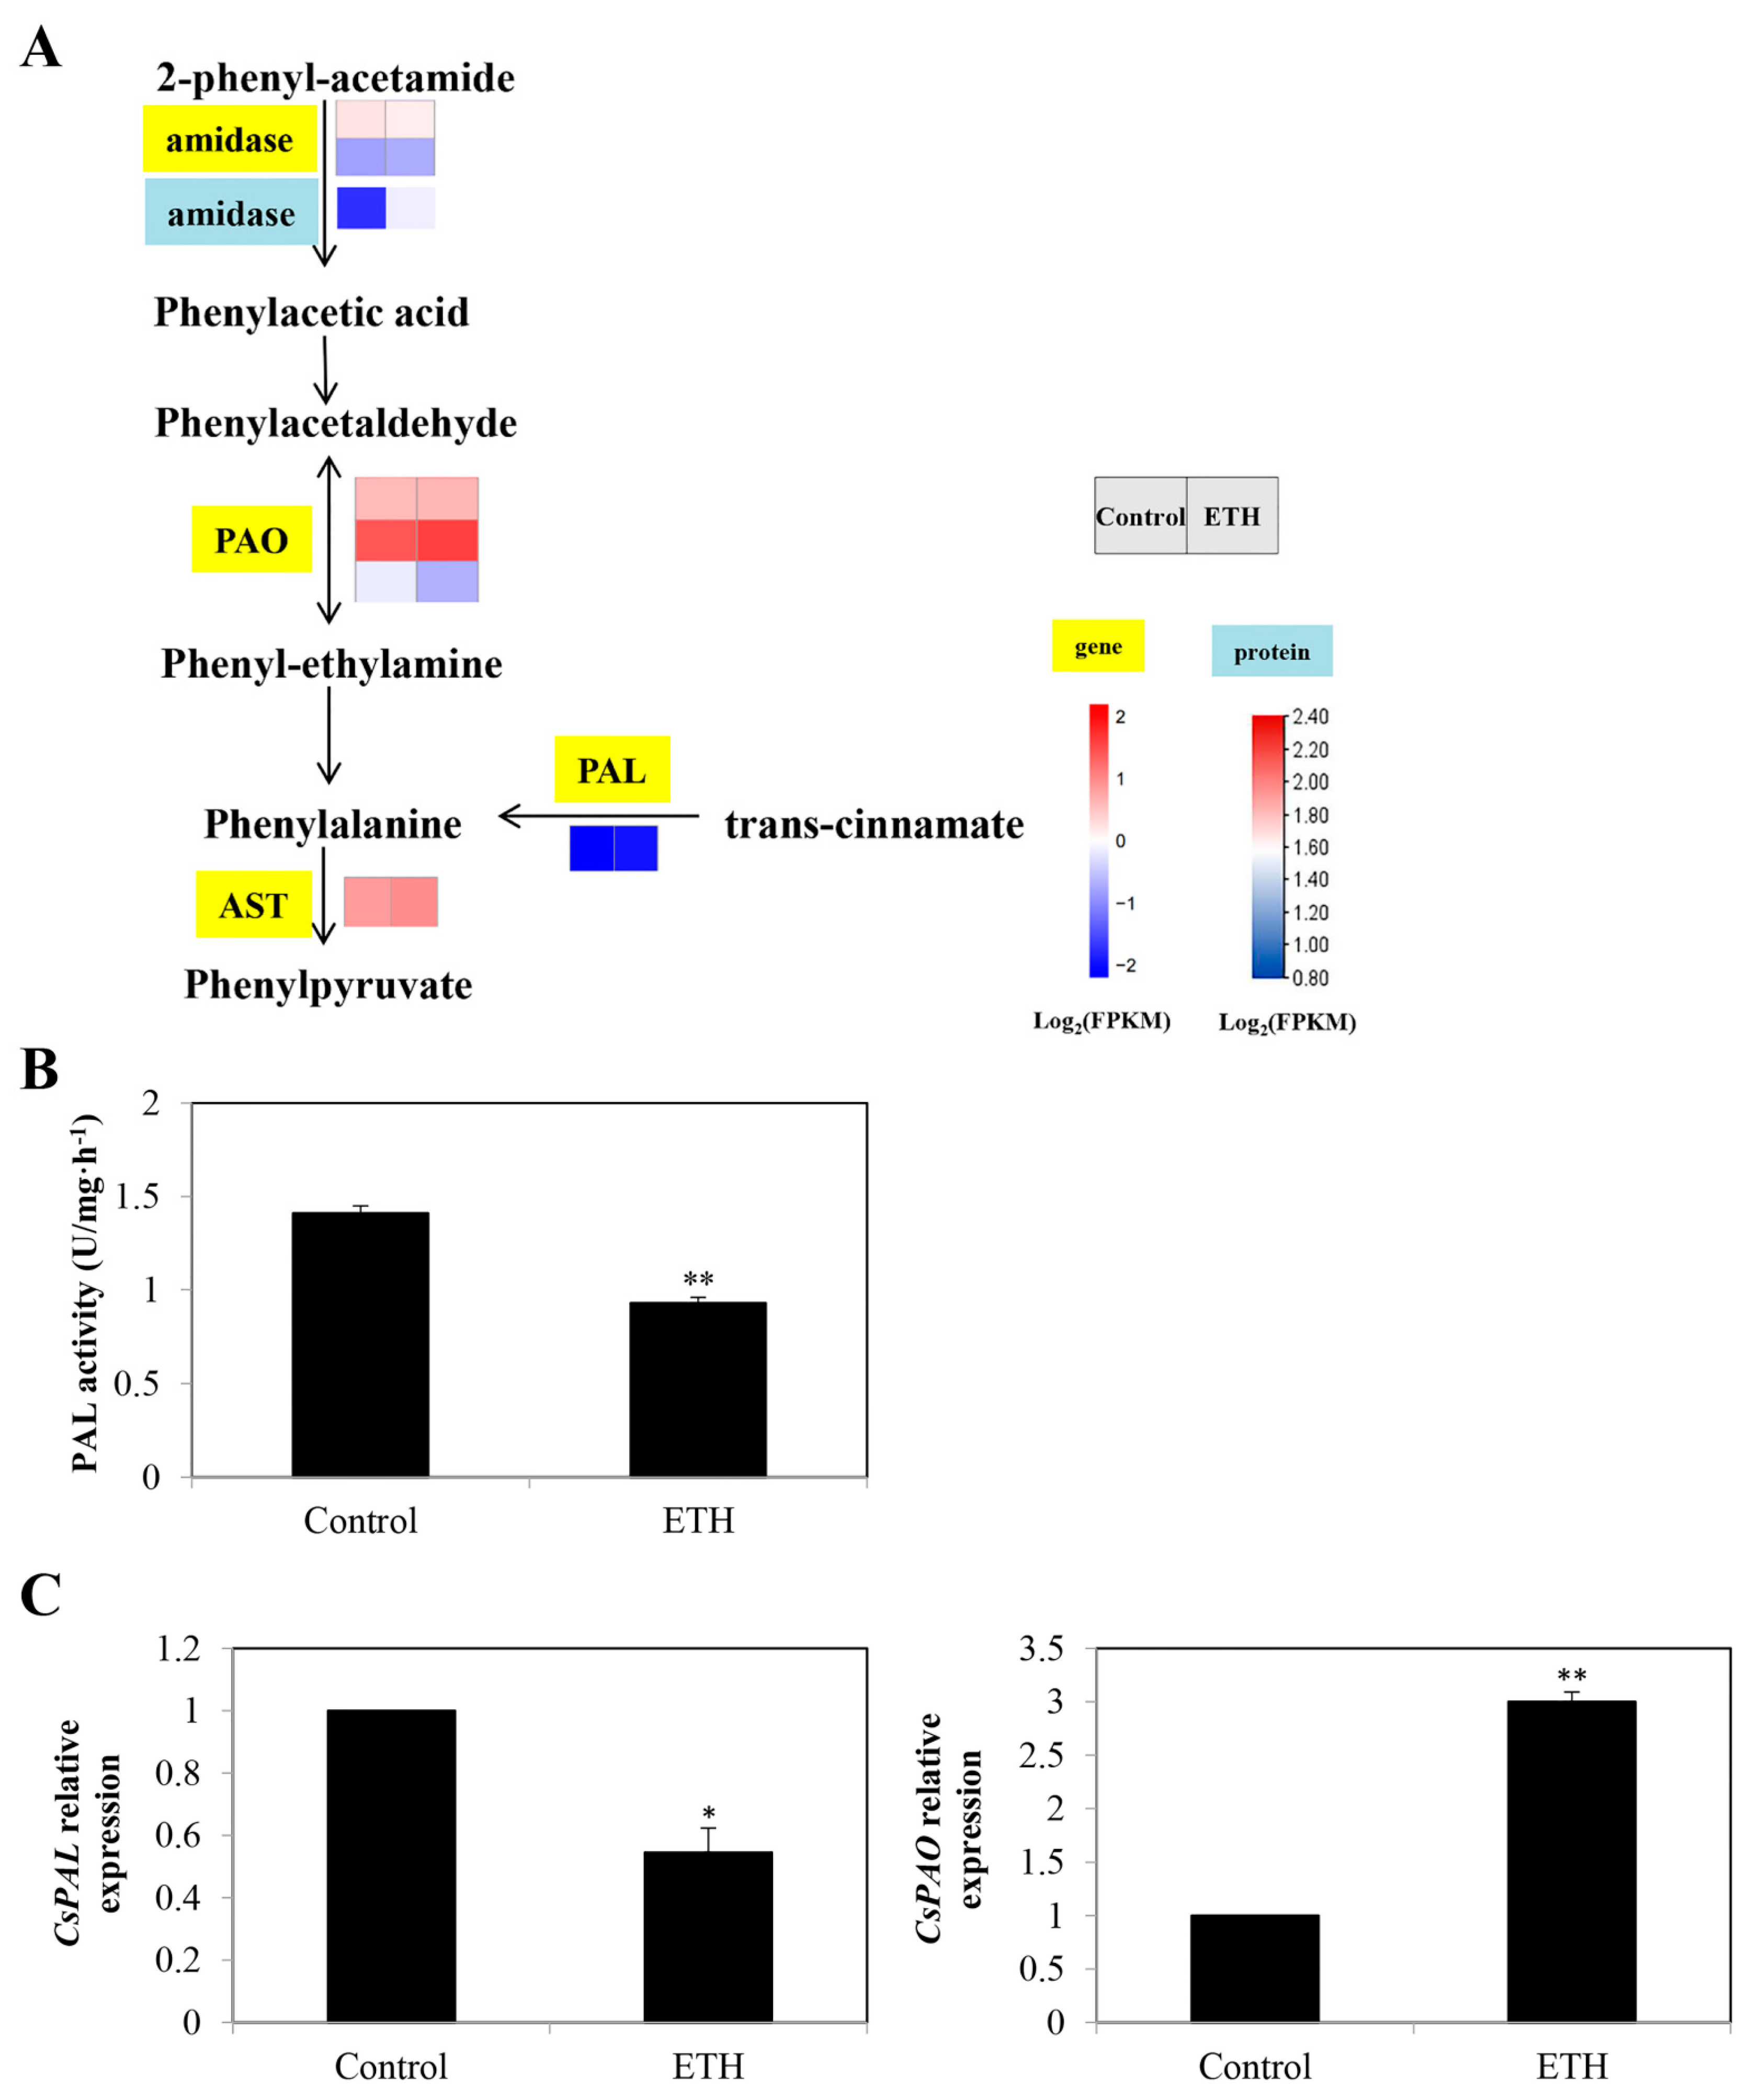
2.3.1. Phenylalanine Metabolism

Seven DEGs were detected in the phenylalanine metabolism (Figure 5A and Supplementary Table S8). Among them, the transcript levels of two amidase genes (LOC101214819 and LOC101204792) were up-regulated and down-regulated, respectively. ETH treatment up-regulated the relative expression of aspartate transaminase (AST; LOC101217299) and three primary-amine oxidase (PAO) genes (LOC101210998, LOC101213059, and LOC101212818). Moreover, the expression of phenylalanine ammonia-lyase (PAL; LOC101218856) for phenylalanine synthesis was down-regulated by ETH treatment (Figure 5A).
As shown in Figure 5B, the activity of PAL with ETH treatment was significantly lower than that of the control. The relative expression of CsPAL was decreased, whereas the expression of CsPAO was enhanced by ETH treatment (Figure 5C).

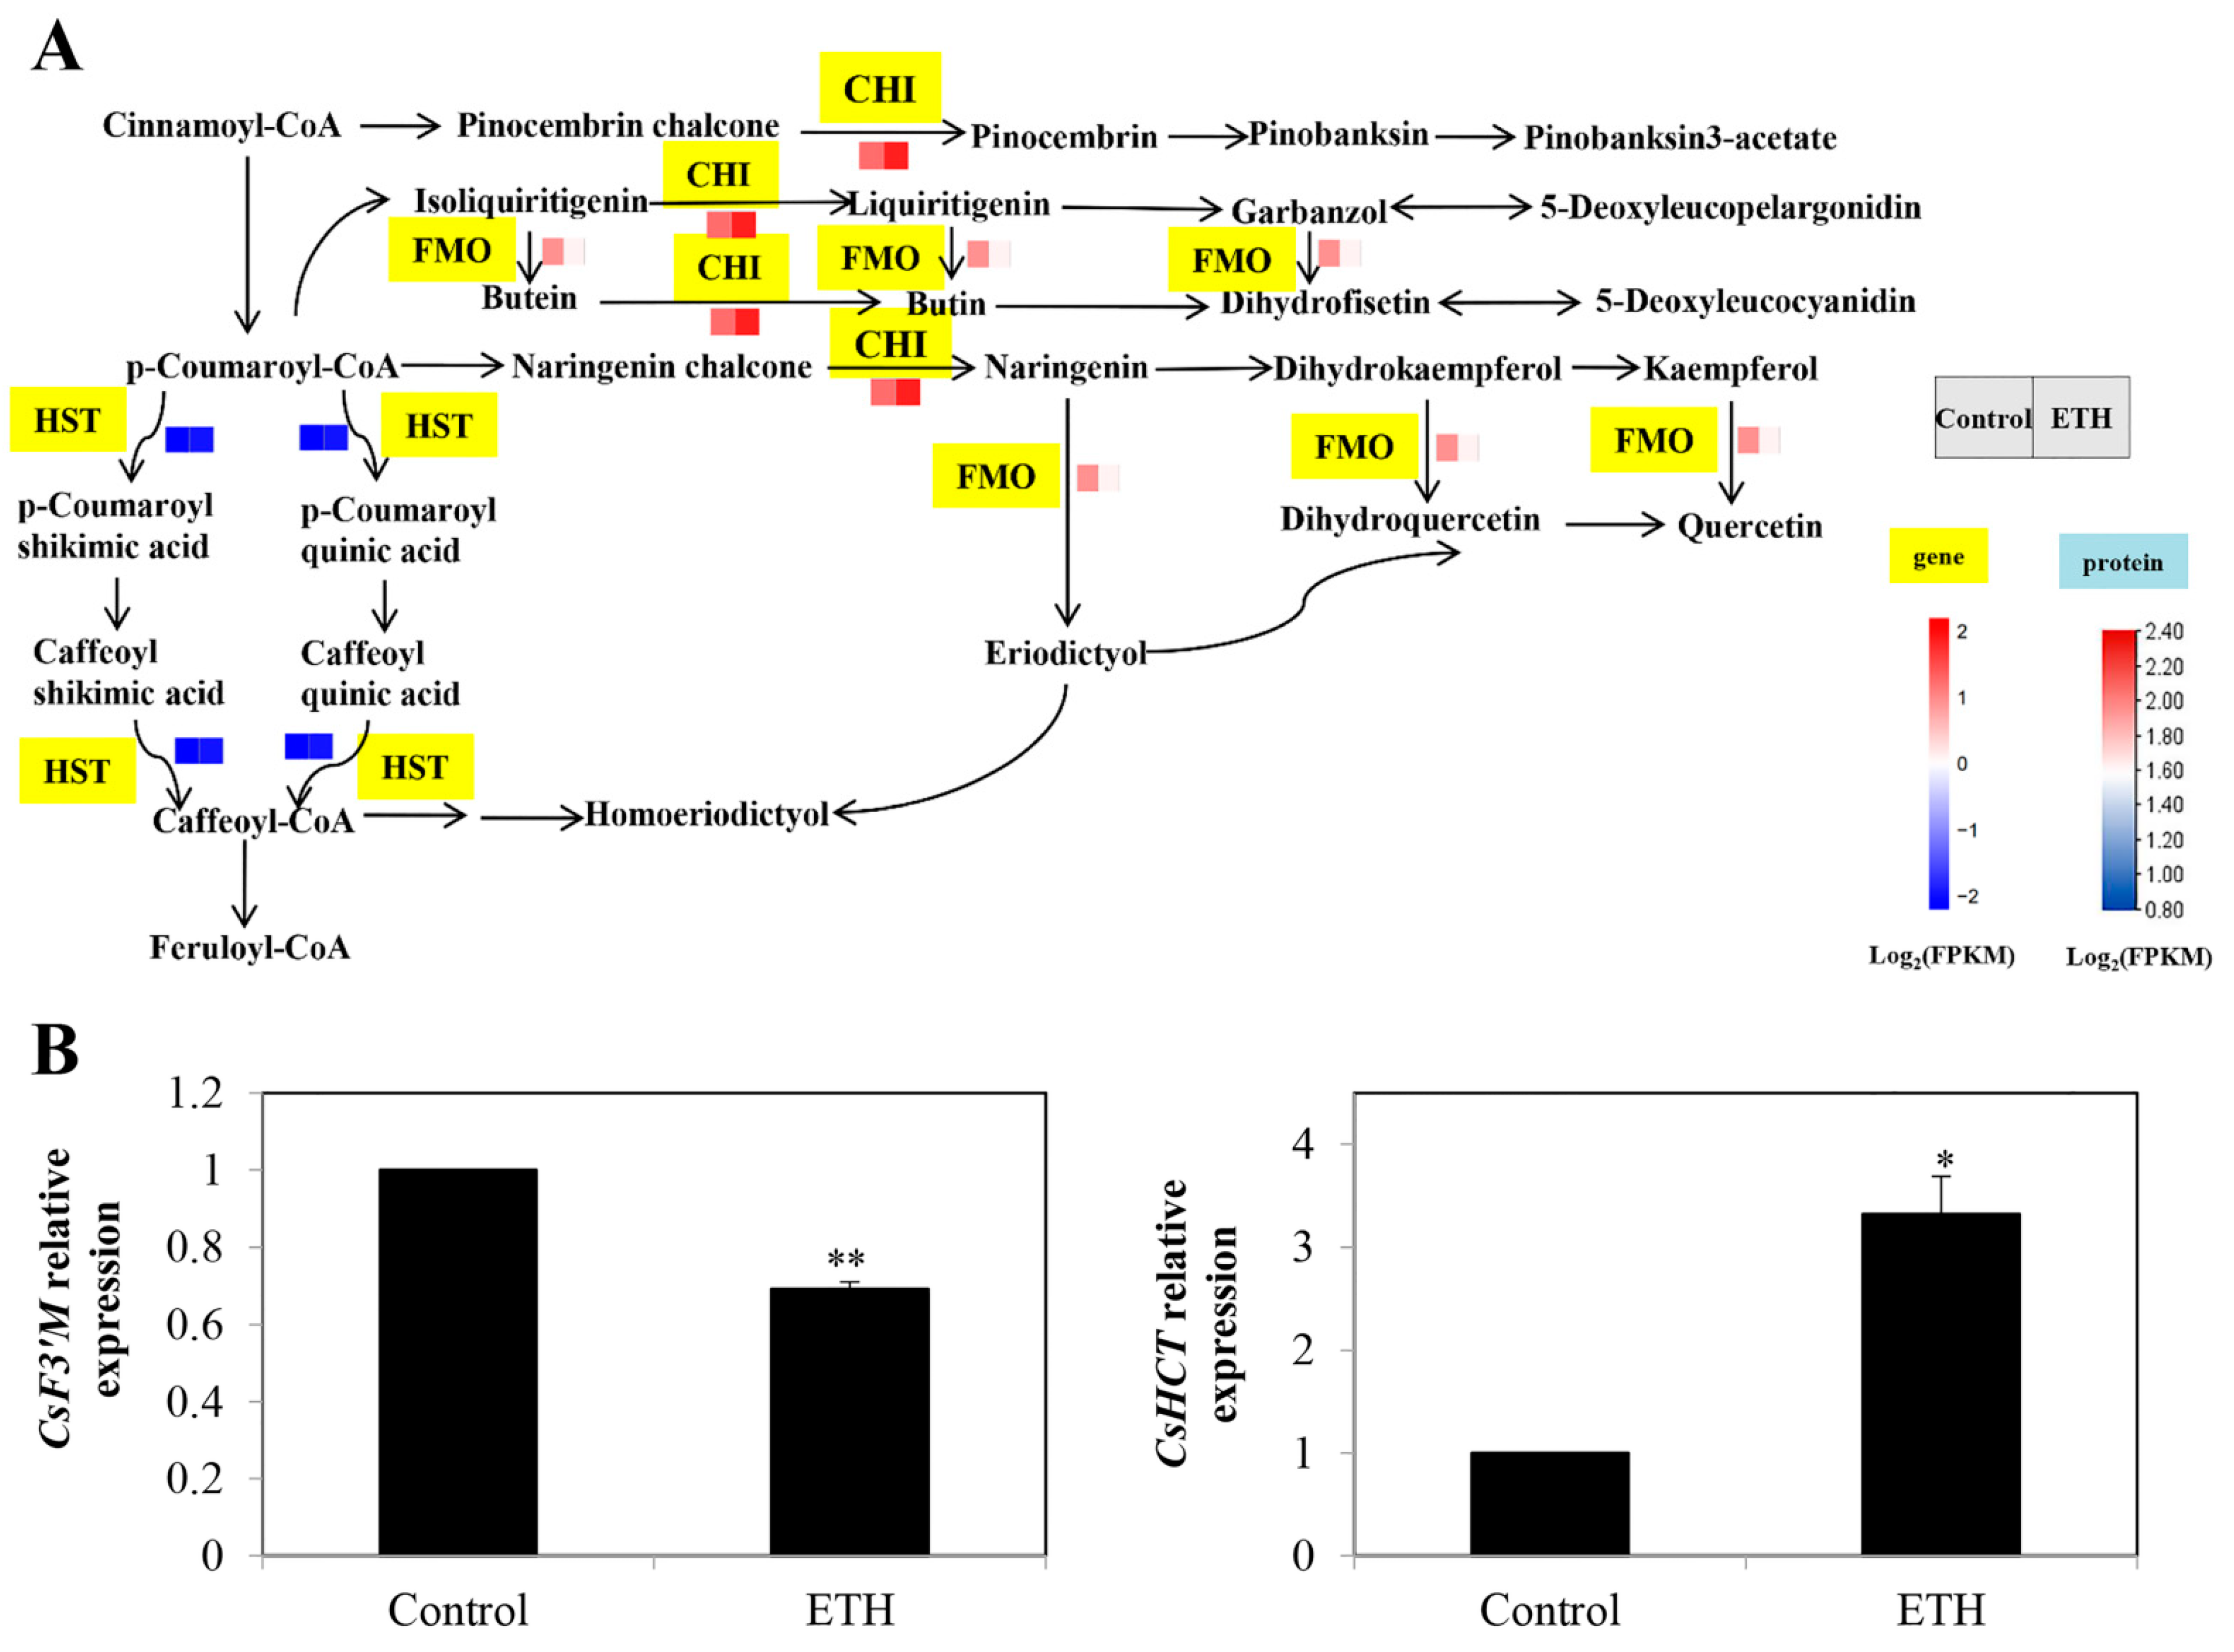
2.3.2. Flavonoid Biosynthesis

In flavonoid biosynthesis, except for shikimate O-hydroxycinnamoyltransferase (HCT; LOC101207100), the transcript levels of chalcone isomerase (CHI; LOC101218716) and flavonoid 3′-monooxygenase (F3′M; LOC101207160) were down-regulated by ETH treatment (Figure 6A and Supplementary Table S9). The relative expression of CsF3′M was decreased by ETH treatment, whereas the expression of CsHCT was significantly increased (Figure 6B).

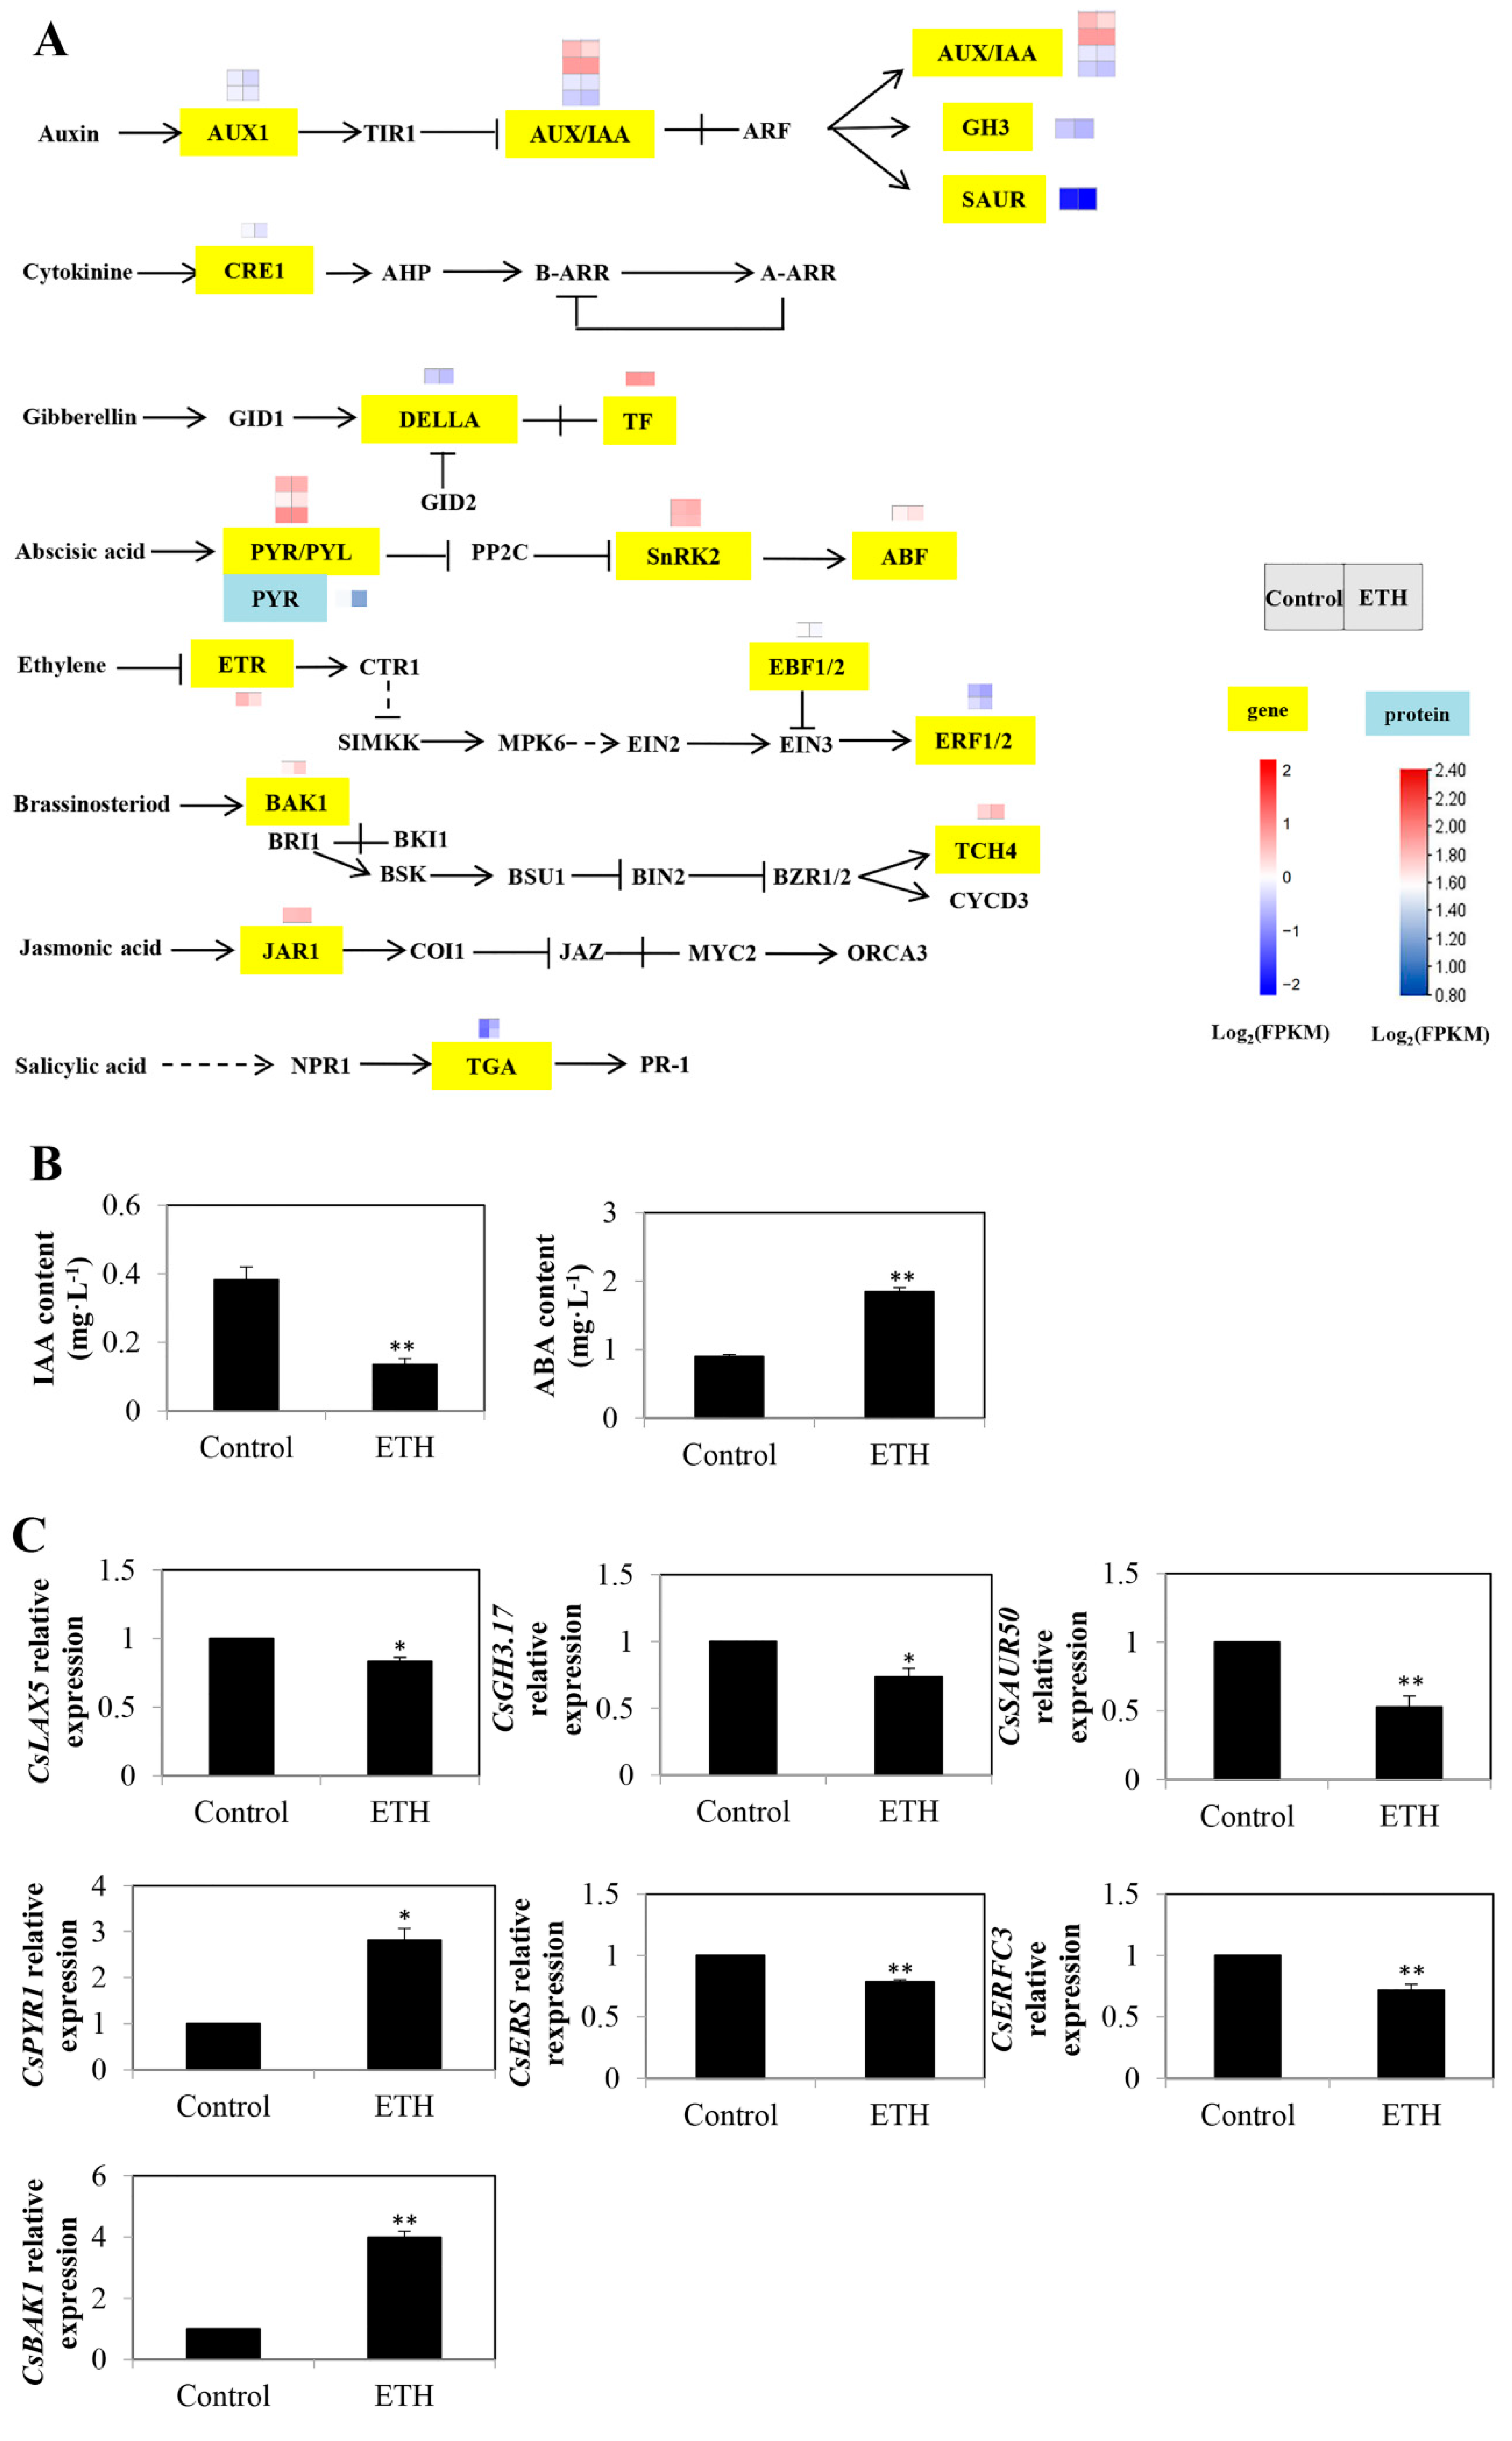
2.4. Plant Hormone Signal Transduction

Twenty-six DEGs and one DEP were identified in the plant hormone signal transduction pathway in total (Figure 7A and Supplementary Table S10). There were eight DEGs in the auxin signaling pathway in total. Among them, ETH treatment down-regulated the expression of two auxin transporter genes AUXIN 1 (AUX1; LOC101205750 and CS-AUX1) (Figure 7A). The expression of three auxin/indole-3-acetic acid (AUX/IAA) genes (LOC101218948, LOC101215306, and LOC101223028) was up-regulated and one AUX/IAA gene (LOC10120997) was down-regulated by ETH treatment. The transcript levels of IAA-amido synthetase GH3 (LOC101206247) and auxin-responsive gene small auxin up-regulated RNA (SAUR; LOC101217643) were decreased by ETH treatment. In the cytokinin (CTK) signaling pathway, CTK response 1 (CRE1; LOC101209777) was down-regulated by ETH. Moreover, two DEGs were involved in ETH-induced adventitious rooting in the gibberellin (GA) signaling pathway. The expression of the DELLA gene (LOC101213450) in the gibberellin (GA) signaling pathway was down-regulated by ETH, whereas the TF gene (LOC101205993) was up-regulated. In the pathway of abscisic acid (ABA) signaling, six DEGs were found. The expressions of three ABA receptors PYR/PYL (LOC101208823, LOC101204882, and LOC101210262), two SNF1-related protein kinase 2 (SnRK2; LOC101209540 and LOC101214088), and the ABA-responsive element (ABRE)-binding factor (ABF) gene (LOC101222720) were up-regulated. Furthermore, four DEGs were displayed in the ETH signaling transduction pathway. The transcript levels of ETH receptor ETR (CS-ERS), EIN3-binding F-box1 and 2 (EBF1/2; LOC101207154), and two ERF1/2 (LOC101206564 and LOC101220325) genes were decreased by ETH (Figure 7A). In the brassinosteroid (BR) signaling transduction pathway, two DEGs were involved in ETH-triggered AR development. The expressions of the BRI1-associated kinase 1 (BAK1; LOC101216386) and touch 4 (TCH4; XTH3) genes were up-regulated by ETH. The jasmonic acid (JA) signaling pathway-related gene jasmonate resistant 1 (JAR1; LOC101212037) was up-regulated by ETH treatment. Additionally, ETH up-regulated the expression of two TGACG-binding (TGA) transcription factors (LOC101210308 and LOC116401613) in the salicylic acid (SA) signaling pathway (Figure 7A).
As shown in Figure 7B, in comparison with the control, ETH treatment significantly decreased the IAA content, whereas it enhanced the ABA content. In the auxin signaling transduction pathway, the relative expressions of auxin transporter-like protein 5 (CsLAX5), CsGH3.17, and CsSUAR50 were significantly decreased by ETH treatment (Figure 7C). In ETH signal transduction, the expressions of CsERS and CsERFC3 with ETH treatment were lower than that in the control (Figure 7C). ETH treatment significantly enhanced the expressions of CsPYL1 and CsBAK1 (Figure 7C).

3. Discussion

As an important small gaseous molecule, ETH affects the growth and development of plants, and it is also a major regulator in response to diverse stresses. Many studies have shown that ETH can induce adventitious rooting in cucumber and marigold [1,15,16]. Using the iTRAQ technique and proteome analysis, Lyu et al. [16] revealed that ETH treatment increased photosynthesis and starch degradation to provide energy for adventitious rooting in cucumber. However, some key genes involved in ETH-promoted adventitious root development in cucumber have not been identified. Here, we revealed the mechanism of ETH-induced adventitious root development at the transcriptional level. First, GO enrichment and KEGG pathways in the transcriptome and proteome were analyzed and compared (Figure 1). In the top 20 KEGG pathway terms, “starch and sucrose metabolism”, “phenylalanine metabolism”, “plant hormone signal transduction”, “fatty acid metabolism”, “pentose and glucuronate interconversions”, “cutin, suberin, and wax biosynthesis”, “photosynthesis–antenna proteins”, “vitamin B6 metabolism”, “purine metabolism”, and “alanine, aspartate, and glutamate metabolism” were enriched in transcriptome and proteome (the order was ranked by transcriptome data), which suggests that exogenous ETH induced adventitious rooting via regulation of the decomposition and metabolism of nutrients, the accumulation and degradation of plant hormones, the synthesis of secondary metabolites, and photosynthesis. In order to identify key genes during ethylene-induced adventitious root development in cucumber, several pathways associated with adventitious rooting and enriched in the KEGG pathway of the transcriptome were selected and analyzed further.

3.1. Carbon Metabolism in ETH-Induced Adventitious Root Development

Carbon metabolism is an important metabolic pathway during adventitious root development and can provide metabolites for starch synthesis, a carbon skeleton for amino acid synthesis, and intermediates for secondary metabolism [20]. Further, it influences energy generation and respiration through the TCA and photorespiratory cycles [21].
In our study, 17 DEGs were involved in ETH-inducing adventitious rooting in starch and sucrose metabolism (Figure 2). Among them, HK is considered to be a key enzyme involved in glucose sensing, signal transduction, and photosynthesis [22,23]. Andriunas et al. [24] found that glucose was able to act positively through an HK-dependent signaling pathway, suggesting that glucose could regulate the HK signaling pathway. In our study, ETH treatment decreased the content of glucose, the activity of HK and the relative expression of CsHK2 during rooting (Figure 2). In Arabidopsis, the transcript level of ERF1 was inhibited by low glucose signaling, which indicated that the ETH might have had an antagonistic effect on low glucose signaling [25,26]. Hence, exogenous ETH might decrease HK activity and CsHK2 expression during rooting. During this process, energy was obtained by consuming sucrose and glucose. HK enzyme and its related gene in the sucrose metabolism pathway were inhibited by ETH, thus accelerating hypocotyl growth and finally inducing adventitious root development in cucumber. Additionally, starch metabolism may also be involved in adventitious rooting [27]. β-amylase 1 (BAM1) and β-amylase 3 (BAM3) are key genes involved in starch degradation. Starch degradation causes a large amount of starch to be enriched in leaves and delays the growth and development of storage roots [27,28]. Our transcriptome results show that the transcript levels of CsBAM1 and CsBAM3 were down-regulated by ETH treatment (Figure 2). Therefore, ETH-treated explants completed energy conversion by reducing the expression of CsBAM1 and CsBAM3 in the starch signaling pathway and the content of starch, which may be beneficial for adventitious rooting. According to Lyu et al. [16], 48 h after treatment is the root elongation phase. At this stage, starch might be converted to glucose to provide energy for root growth. Therefore, ETH could induce adventitious rooting by decreasing the transcript levels of the starch degradation-related genes CsBAM1 and CsBAM3 and preventing starch degradation.
Further, glycolysis, the TCA cycle, and oxidative phosphorylation are classified as respiratory metabolism and can produce energy in the ATP form [29,30]. In the present study, 12, 5, and 4 DEGs were involved in these pathways by ETH treatment, respectively (Figure 3). A previous study showed that the changes in glycolysis were closely related to the changes in root respiration in sugarbeet (Beta vulgaris L.) [29]. The change trend of PK activity was similar to that of the respiratory rate, first increasing, then decreasing, and finally becoming stable [29]. Lyu et al. [16] found that ETH enhanced ATP synthase subunit protein expression at 12 and 24 h, and then declined at 48 h, confirming that ETH-induced adventitious rooting might require energy. This agreed with the findings of our metabolomic analysis showing that the activity of PK and the expression of CsPK2 were decreased with ETH at 48 h after treatment (Figure 3), suggesting that at this stage, the respiration rate might decrease, resulting in the decline of ATP generation. Hence, ETH could induce adventitious root development by decreasing the PK activity and its transcript level. At 48 h after ETH treatment, ATP synthetase provided more energy for inducing adventitious rooting.
Fatty acids provide energy for some metabolic processes and act as signal transduction regulators [31]. Twelve DEGs were involved in fatty acid biosynthesis and the fatty acid degradation pathway in ETH-induced adventitious root development (Figure 4). Among them, CYP86A1 was a key gene for root aliphatic suberin biosynthesis in Arabidopsis [32,33]. Root suberin could control the absorption and transportation of water and mineral ions from roots to leaves [34]. Therefore, CYP86A1 also might play an important role in rooting. Our work showed that ETH treatment decreased the expression of CsCYP86A1 during rooting (Figure 4), suggesting that the energy might be transferred to the hypocotyl to induce adventitious root development.

3.2. Secondary Metabolite Biosynthesis Pathway in ETH-Induced Adventitious Root Development

Phenylalanine metabolism and flavonoid biosynthesis are secondary metabolite biosyntheses. They benefit plants throughout the whole developmental process. Wang et al. [35] demonstrated that phenylpropanoid and flavonoid biosynthesis pathways were associated with root development. However, there has been no research showing that phenylalanine metabolism could be involved in adventitious root development. In our study, ETH regulated seven DEGs in phenylalanine metabolism during rooting, including CsPAL, CsPAO, and CsAST (Figure 5). PAL was a critical enzyme that directly catalyzes phenylalanine synthesis and is a precursor for the phenylpropanoid biosynthetic pathway [36]. The activity of PAL varied with the development stage of plants and the differentiation degree of cells and tissues [37,38]. Under excess Fe nutrition, plant growth was suppressed, and the activity of PAL was enhanced [39], indicating that the increase in PAL activity might inhibit plant growth. In our study, the activity and relative expression of PAL decreased with ETH treatment (Figure 5), indicating that the ETH might have induced adventitious rooting by reducing PAL activity and its gene expression.
In addition, flavonoid biosynthesis was reported to have an important role in hairy roots, adventitious roots, and seedling roots [36]. However, there is little information regarding the roles of flavonoid in ETH-induced adventitious rooting. In our transcriptome results, three DEGs, including CsCHI, CsF3′M, and CsHCT were involved in this pathway (Figure 6). Among them, the expression of CsHCT was significantly increased by ETH treatment. There was a negative correlation between the expression of CsHCT and the content of total flavonoids [40]. When the flavonoid content decreased, the content of lignin increased, and the fibers between the vascular bundles became longer [41]. Hence, ETH treatment might promote adventitious root primordium growth and break through the epidermis by increasing the expression of CsHCT, and the newly formed adventitious roots could be connected to the vascular bundle, leading to fiber growth between vascular bundles.

3.3. Plant Hormone Signal Transduction in ETH-Induced Adventitious Root Development

Phytohormone is an essential factor affecting adventitious rooting. We identified 26 DEGs in the plant hormone signal transduction pathway in total (Figure 7). Various studies have shown that auxin could induce adventitious root development [42,43]. In the present study, ETH regulated eight DEGs, including CsAUX1, CsAUX/IAA, CsGH3, and CsSAUR in the auxin signaling transduction pathway (Figure 7). AUX1 and LAX5 are auxin influx carriers of the same family [42]. AUX1 could mediate the auxin influx specifically in the adventitious root-initiating cells, whereas LAX5 was involved later than AUX1 in adventitious rooting [42]. Recently, da Costa et al. [44] reported that LAX1 and LAX3 were used as down-regulation genes during adventitious rooting in Arabidopsis thaliana, which was consistent with our result. We found that ETH decreased the expression of CsAUX1 and CsLAX5 (Figure 7), which proves that the auxin influx genes were negatively regulated in ETH-promoted adventitious root development. Moreover, Harkey et al. [45] found that the ETH precursor ACC reduced the expression of GH3.17 in Arabidopsis roots. The decreased activity of GH3 could lead to a decrease in the IAA level [46]. Our study shows that ETH down-regulated the expression of IAA-amido synthetase CsGH3.17 (Figure 7). To expand on the results of the expression studies, the endogenous IAA content was further determined in control and ethephon-treated cucumber explants. In our results, ETH significantly decreased the endogenous IAA content (Figure 7). Therefore, ETH could induce adventitious rooting by negatively regulating the auxin signal pathway, in which ETH might decrease the IAA content and the expressions of CsGH3.17, CsAUX1, and CsLAX5.
ABA negatively controls root emergence [47]. However, the crosstalk between ABA and ETH in adventitious root development was unclear. We found that ETH up-regulated the expression of six DEGs in the ABA signal transduction pathway, which included CsPYR/PYL, CsSnRK2, and CsABF (Figure 7). PYR1, as a member of the family of PYR/PYL/RCAR ABA receptors, mediated plant immunity, seed germination, and seedling establishment [48,49]. PYL8 has been reported to induce lateral root growth [50]. Here, we found that ETH up-regulated the expression of the ABA receptors CsPYR1, CsPYL5, and CsPYL8 during adventitious rooting (Figure 7), indicating that CsPYR1, CsPYL5, and CsPYL8 might positively regulate ETH-induced adventitious root development. Moreover, ETH significantly enhanced ABA content (Figure 7). Thus, ETH could induce rooting by increasing ABA signal transduction-related gene expression and ABA content.
Furthermore, ETH decreased the expression of four DGEs, including CsETR, CsEBF1/2, and CsERF1/2 in ETH signal transduction (Figure 7). ERS is an ETH receptor gene, which can negatively regulate ETH response [51]. In the present study, ETH decreased the transcript level of CsERS (Figure 7). Hua et al. [52] also found that ETH treatment reduced the ERS transcript level, indicating that ERS could be negatively mediated by exogenous ETH during rooting.
In Arabidopsis, exogenous BR could promote adventitious root initiation and growth [53,54]. In our study, ETH up-regulated the expressions of CsBAK1 and CsXTH3 in the BR signaling transduction pathway (Figure 7). BAK1 is a BR receptor gene. Xie et al. [55] reported that graphene oxide could increase BAK1 expression to enhance root growth in Brassica napus L., confirming that BAK1 might positively respond to root growth. Similarly, our results show that ETH enhanced the transcriptional level of CsBAK1 (Figure 7), which suggests that ETH induced adventitious rooting via positively regulating CsBAK1 expression in BR signal transduction. Therefore, BR might have a positive role in ETH-induced adventitious root development. Xyloglucan endotransglucosylase/hydrolase (XTH), as a cell wall loosening and extension factor, can induce cell elongation and root growth [56]. However, there has been no direct evidence that XTH positively or negatively regulates adventitious root development. We found that ETH up-regulated the expression of CsXTH3 (Figure 7), which implies that ETH might promote rooting by increasing the transcript level of CsXTH3.

4. Materials and Methods

4.1. Plant Material and Growth Conditions

Cucumber (C. sativus L. “Xinchunsihao”) seeds of the same size and full grains were soaked in distilled water for 5–6 h and then placed on a tray with wet filter paper. After this step, the seeds in the tray were moved to the incubator with illumination with a 14 h photoperiod (the photosynthetically active radiation was 200 μmol m−2 s−1) at 25 ± 1 °C for 7 d, and the filter paper was kept wet in the tray during this period. The primary roots of explants were carefully cut off after 7 d. In accordance with Zhao et al. [57], the induction of adventitious roots was completed 48 h after treatment. Hence, the cucumber explants were placed in Petri dishes with different treatments and allowed to grow for 48 h. The temperature and photoperiod conditions were the same as the above conditions.

4.2. Chemicals and Treatments

Based on our previous results [1], 0.5 μM of 2-chloroethylphosphonic acid (ethrel, an ETH donor) was the optimal concentration to induce adventitious rooting in cucumber. After cutting the primary roots, every ten explants of the same size were selected and placed in Petri dishes containing 70 mL of with distilled water or 0.5 μM ethrel, and the solutions used in the study were changed every 24 h [1]. Each experiment was conducted three times with 3 replicates. At 48 h after treatment, samples (cucumber explants) were collected and stored at −80 °C until used.

4.3. Gene Expression Profiling Using RNA-Seq

4.3.1. RNA Extraction

The total RNA for RNA-Seq and RT-qPCR analyses was extracted from about 500 mg cucumber explants with Trizol reagent (Sangon, Shanghai, China) in accordance with the manufacturer’s instructions [58]. The total RNA was dissolved in 100 μL of RNase-free water and quantified using a NanoDrop spectrophotometer (Thermo Scientific, Waltham, MA, USA) [59]. The RNA quality was evaluated using the 6000 Pico LabChip of the Agilent 2100 Bioanalyzer (Agilent, Shanghai, China) [60]. RNA samples were sent to Novogene Co., Ltd. (Beijing, China) for cDNA library construction and sequencing. The reference genome for transcriptome analysis was acquired from https://www.ncbi.nlm.nih.gov/genome/1639?genome_assembly_id=749658 (accessed on 18 March 2020). Each treatment had 3 technical replications and 3 biological replications.

4.3.2. cDNA Synthesis and Illumina Sequencing

The mRNA was purified from the total RNA using poly-T oligo-attached magnetic beads [61]. In the NEBNext First Strand Synthesis Reaction Buffer (5×), divalent cations were used for fragmentation at a high temperature. First-strand cDNA was synthesized using random hexamer primer and M-MuLV Reverse Transcriptase (RNase H-). Second-strand cDNA synthesis was subsequently performed using DNA Polymerase I and RNase H. Remaining overhangs were converted into blunt ends via exonuclease/polymerase activities [62]. After adenylation of 3′ ends of the DNA fragments, a NEBNext Adaptor with a hairpin loop structure was ligated to prepare for hybridization. In order to screen 250–300 bp cDNA fragments preferentially, the library fragments were purified using an AMPure XP system (Bethe controlman Coulter, Beverly, CA, USA) [20]. Before PCR, 3 µL of USER Enzyme (NEB, Boston, MA, USA) was used at 37 °C for 15 min followed by 5 min at 95 °C with size-selected, adaptor-ligated cDNA [63]. Then, PCR was performed with Phusion High-Fidelity DNA polymerase, Universal PCR primers, and Index (X) Primer. At last, the PCR products were purified (AMPure XP system; Bethe controlman Coulter, Beverly, CA, USA) and the library quality was assessed on the Agilent Bioanalyzer 2100 system (Agilent, Shanghai, China) [20]. The library products were sequenced with the Illumina Novaseq platform. The RNA-seq data produced in this study were deposited in the NCBI Gene Expression Omnibus (GSE189315).

4.3.3. Bioinformatics Analysis

The raw reads were raw sequencing data, and they could be transferred from the original image data through a base call. The clean reads were a high-quality sequence after clearing data from the original reads. The error rate was the total sequencing error rate of the data. Q20 and Q30 refer to the percentage of bases with Phred values greater than 20 and 30 to the total bases, respectively. GCpct was the percentage of G and C among the four bases in the clean reads. The transcriptome sequencing was of high quality and can be used for further analysis (Supplementary Table S1). In addition, the Pearson correlation analysis showed high consistency of gene expression patterns of different biological replicates of each sample, suggesting the high reproducibility of transcriptome data (Supplementary Figure S1). According to the RPKM (reads per kilobase per million reads) criteria, levels of DEGs were calculated by quantifying reads. Transcriptome libraries should be based on the criteria: |log2(FoldChange)| > 1 and padj ≤ 0.05. Analyses of GO functional enrichment and KEGG pathway enrichment of the DEGs were carried out using ClusterProfiler software. In the functional enrichment analysis of GO, the DEGs were mainly enriched in the biological process (BP), molecular function (MF), and cellular component (CC). Using the KAAS server, the metabolic pathway was analyzed according to the KEGG pathway database (http://www.genome.jp/kegg/pathway.html) (accessed on 25 May 2020) [64].
Additionally, because the treatment time and ETH donor ethrel concentration were the same in our transcriptome analysis and in the proteomic analysis of Lyu et al. [16], we compared the DEGs in the transcriptome with differentially expressed proteins (DEPs) in the proteome.

4.4. Determination of Sucrose, Glucose, and Starch Content

The determination of sucrose content was performed according to Tauzi and Giardina [65]. On the basis of our experimental requirements, we modified the procedure appropriately. The cucumber explants (1.0 g) were added to 10 mL of 80% ethanol and diluted with distilled water in a 100 mL volumetric flask. The volumetric flask was placed in a water bath at a constant temperature of 80 °C for 45 min, then cooled to room temperature, and filtered with filter paper. This step was repeated twice, and the filtrate was collected as the reaction solution. The filtrate (0.4 mL) was mixed with 0.2 mL of 2 M sodium hydroxide (NaOH), and then bathed at 80 °C for 10 min. After cooling to room temperature, the sucrose content was determined. The absorbance was measured at 540 nm, and the soluble sugar content was calculated according to the standard curve.
The determination of the glucose content was performed according to Smith and Zeeman [66]. Fresh explant (0.5 g) was homogenized with 10 mL distilled water, diluted with distilled water, and mixed in a 50 mL volumetric flask. Then it was placed in a boiling water bath for 10 min. The reaction mixture contained 3,5-dinitrosalicylic acid (DNS) regent (6.3 g), 262 mL 2 M NaOH solution, 185 g potassium sodium tartrate with 500 mL of hot water, 5 g of redistilled phenol, and 5 g of sodium sulfite. After cooling the mixture to room temperature, the volume was accurately adjusted to 1000 mL with distilled water. Then the homogenate was centrifuged at 4000 rpm for 15 min at 4 ℃. The supernatant (2 mL) and deoxyribonucleic acid (1.5 mL) were mixed together, and the mixture was centrifuged at 4000 rpm for 15 min at 4 °C. Then it was placed in boiling water at 100 °C and bathed for 5 min. After cooling to room temperature, the solution was filtered into a 25 mL volumetric flask. The sample absorbance was measured at 540 nm against the controls.
For the starch content analysis, a 0.5 g sample was homogenized with 2 mL of distilled water and 3.2 mL of 60% HClO4. Distilled water was added to the mixture to 100 mL and then centrifuged at 5000 rpm for 5 min. Then, 0.5 mL of the supernatant was pipetted and diluted to 3 mL with distilled water. Then, 2 mL of iodine reagent was added, mixed well, and the mixture was left standing for 5 min. Finally, the solution was added to 10 mL of distilled water. The optical density (OD) was monitored at 660 nm [66].

4.5. Enzyme Assays

4.5.1. Determination of Sucrose Synthase (SS), Sucrose–Phosphate Synthase (SPS), and Hexokinase (HK) Activities

The enzyme activities of SS, SPS, and HK were determined by enzyme-linked immunosorbent assay (ELISA; Andy Gene Biotechnology Co., Ltd., Beijing, China). A 1.0 g sample was ground with liquid nitrogen and homogenized with 9 mL PBS (pH = 7.4). Then the homogenate was centrifuged at 3000 rpm for 15 min at 4 °C [67]. The subsequent measurement method was carried out on the basis of the manufacturer’s instructions.

4.5.2. Determination of Phenylalanine Ammonia-Lyase (PAL) Activity

The PAL activity was assessed according to González-Mendoza et al. [68]. A fresh sample (0.5 g) was mixed into 5 mL of Tris-HCl buffer (0.1 M, pH 7.5), 1 mM 1% polyvinylpolypyrrolidone and ethylenediaminetetraacetic acid (EDTA). Then the mixture was centrifuged at 12,000 rpm, at 4 °C for 10 min. The reaction mixture, including 100 µL of enzyme extract and 200 µL of Tris-HCl (50 mM, pH 8.8) containing 20 mM L-phenylalanine was incubated at 40 °C for 30 min. Then 100 µL of 1 M hydrochloric acid (HCl) was added to stop the reaction. The absorbance value was measured at 290 nm. The amount of enzyme that increased the OD290 by 0.01 per minute was defined as an enzyme activity unit IU.

4.6. Determination of IAA and ABA Contents

The concentrations of the IAA and ABA contents were determined by Quaternary gradient ultra-fast liquid chromatograph using a Waters Acquity ARC 600-2998 equipped with the Symmetry-C18 column (4.6 × 250 mm, 5 μm). The frozen sample (1.0 g) was taken and ground with liquid nitrogen quickly and then transferred to a 10 mL centrifuge tube. Then, 5 mL of 80% cold pure methanol was added and the sample was stored in the dark in the refrigerator at 4 °C for 12 h. After 12 h, the sample was centrifuged at a speed of 4000 rpm for 15 min at 4 °C. Then the supernatant was pipetted into another 10 mL centrifuge tube. The residues were suspended in 2.5 mL of extraction solution and stored at 4 °C for 1 h. Then the mixture was centrifuged at a speed of 4000 rpm for 15 min, and the filtrate was collected and combined in the tube. This step was repeated twice. The filtrate was diluted to 10 mL with 80% methanol. Two mL of the supernatant was evaporated in a rotary vacuum at 38 °C for 4 h and then dissolved with 2 mL of 80% cold pure methanol. The extract was filtered with a 0.22 μm filter for liquid chromatograph detection. The mobile phase was chromatographic methanol (A) + 0.1% phosphoric acid (B). The flow rate was 1.0 mL min−1. The wavelength was 254 nm, and the column temperature was 30 °C [69].

4.7. RT-qPCR Assays

In accordance with the manufacturer’s instructions, the RNA (400 ng) was reverse-transcribed with 5 × Evo M-MLVRT Master Mix (AG, Changsha, China). SYBR Green Pro Taq HS Premix (AG, Changsha, China) was used to amplify cDNA. The gene expression data were normalized using Csactin as an internal control [70]. The primers were designed by primerbank (https://pga.mgh.harvard.edu/primerbank/) (accessed on 1 May 2021). The RT-qPCR reactions containing 7.2 μL of ddH2O, 0.4 μL of forward primer, 0.4 μL of reverse primer, 2 μL of cDNA (800 ng), and 10 μL of Taq enzyme were performed on the ABI StepOne plus system (Foster, CA, USA) with the following program: 95 °C for 30 s, 40 cycles of 95 °C for 5 s and 60 °C for 30 s. In order to assess possible contaminations and primer dimer formations, no-template controls (NTCs) were used as a negative control [71]. The RT-qPCR efficiencies of amplicons were calculated by performing a standard curve. Moreover, melting curve analysis was conducted to ensure the amplification of specific amplicons. StepOneTM Software v2.3 (Life Technologies, Boston, MA, USA) was used to analyze the ct values, and 2−ΔΔct was used to calculate the normalized gene expression levels [72]. The experiment was conducted with three bio-replicates. The primers are listed in Supplementary Table S2.

4.8. Statistical Analysis

The statistical analysis was conducted using the Statistical Package for Social Sciences 22.0 (SPSS 22.0, Inc., Chicago, IL, USA) software. All results were expressed as the mean values ± standard error (SE) from at least three independent duplications. The data from substance contents, enzyme activities, plant hormone contents and RT-qPCR assays were analyzed by t-test at p < 0.01 and p < 0.05, respectively.

5. Conclusions

In conclusion, the candidate genes of sucrose and starch metabolism (CsHK2), glycolysis-related gene (CsPK2), phenylalanine metabolism (CsPAL), flavonoid biosynthesis (CsF3′M), auxin signaling transduction (CsLAX5, CsGH3.17, and CsSUAR50), and ETH signaling transduction (CsERS) were ETH-down-regulated genes, whereas the candidate genes of starch metabolism (CsBAM1 and CsBAM3), phenylalanine metabolism (CsPAO), flavonoid biosynthesis (CsHCT), ABA signaling transduction (CsPYL1, CsPYL5, and CsPYL8), and BR signaling transduction (CsBAK1 and CsXTH3) were up-regulated in ETH-induced adventitious rooting. These candidate genes were associated with ETH-induced adventitious root development. This study will be useful for understanding the molecular mechanisms of ETH-inducing adventitious rooting.

Supplementary Materials

The following supporting information can be downloaded at: https://www.mdpi.com/article/10.3390/ijms232112981/s1.

Author Contributions

W.L. designed the study. Y.D. wrote the manuscript. Y.D., C.W., M.Z. and L.W. performed the experiments and analyzed and interpreted the data. Y.D., C.W., M.Z. and W.L. participated in data interpretation and revised the manuscript. All authors have read and agreed to the published version of the manuscript.

Funding

This work was supported by the National Key Research and Development Program (2018YFD1000800); the National Natural Science Foundation of China (Nos. 32072559, 31860568, 31560563 and 31160398); the Key Research and Development Program of Gansu Province, China (No. 21YF5WA096); the Fostering Foundation for the Excellent PH.D. Dissertation of Gansu Agricultural University (No. YB2021002); the Research Fund of Higher Education of Gansu, China (No. 2018C-14 and 2019B-082); and the Natural Science Foundation of Gansu Province, China (Nos. 1606RJZA073, 1606RJZA077 and 1606RJYA252).

Institutional Review Board Statement

Not applicable.

Informed Consent Statement

Informed consent was obtained from all subjects involved in the study.

Data Availability Statement

Data are contained within the article or Supplementary Materials.

Conflicts of Interest

The authors declare no conflict of interest.

References

  1. Xu, X.-T.; Jin, X.; Liao, W.-B.; Dawuda, M.M.; Li, X.-P.; Wang, M.; Niu, L.-J.; Ren, P.-J.; Zhu, Y.-C. Nitric oxide is involved in ethylene-induced adventitious root development in cucumber (Cucumis sativus L.) explants. Sci. Hortic. 2017, 215, 65–71. [Google Scholar] [CrossRef]
  2. Zhu, Y.; Liao, W. The metabolic constituent and rooting-related enzymes responses of marigold explants to hydrogen gas during adventitious root development. Theor. Exp. Plant Physiol. 2017, 29, 77–85. [Google Scholar] [CrossRef]
  3. Li, X.-P.; Xu, Q.-Q.; Liao, W.-B.; Ma, Z.-J.; Xu, X.-T.; Wang, M.; Ren, P.-J.; Niu, L.-J.; Jin, X.; Zhu, Y.-C. Hydrogen peroxide is involved in abscisic acid-induced adventitious rooting in cucumber (Cucumis sativus L.) under drought stress. J. Plant Biol. 2016, 59, 536–548. [Google Scholar] [CrossRef]
  4. Geiss, G.; Gutierrez, L.; Bellini, C. Adventitious root formation: New insights and perspectives. Annu. Plant Rev. 2009, 37, 127–156. [Google Scholar]
  5. KeÇpczyński, J.; KeÇpczyńska, E. Ethylene in seed dormancy and germination. Physiol. Plant. 1997, 101, 720–726. [Google Scholar] [CrossRef]
  6. Hu, Y.; Vandenbussche, F.; Van Der Straeten, D. Regulation of seedling growth by ethylene and the ethylene–auxin crosstalk. Planta 2017, 245, 467–489. [Google Scholar] [CrossRef] [Green Version]
  7. Qin, H.; He, L.; Huang, R. The Coordination of Ethylene and Other Hormones in Primary Root Development. Front. Plant Sci. 2019, 10, 874. [Google Scholar] [CrossRef]
  8. Qi, X.; Li, Q.; Ma, X.; Qian, C.; Wang, H.; Ren, N.; Shen, C.; Huang, S.; Xu, X.; Xu, Q.; et al. Waterlogging-induced adventitious root formation in cucumber is regulated by ethylene and auxin through reactive oxygen species signalling. Plant Cell Environ. 2019, 42, 1458–1470. [Google Scholar] [CrossRef]
  9. Wang, Y.; Yan, C.; Zou, B.; Wang, C.; Xu, W.; Cui, C.; Qu, S. Morphological, Transcriptomic and Hormonal Characterization of Trimonoecious and Subandroecious Pumpkin (Cucurbita maxima) Suggests Important Roles of Ethylene in Sex Expression. Int. J. Mol. Sci. 2019, 20, 3185. [Google Scholar] [CrossRef] [Green Version]
  10. An, J.; Almasaud, R.A.; Bouzayen, M.; Zouine, M.; Chervin, C. Auxin and ethylene regulation of fruit set. Plant Sci. 2020, 292, 110381. [Google Scholar] [CrossRef]
  11. Hu, Y.; Han, Z.; Sun, Y.; Wang, S.; Wang, T.; Wang, Y.; Xu, K.; Zhang, X.; Xu, X.; Han, Z.; et al. ERF4 affects fruit firmness through TPL4 by reducing ethylene production. Plant J. 2020, 103, 937–950. [Google Scholar] [CrossRef] [PubMed]
  12. Wei, H.; Seidi, F.; Zhang, T.; Jin, Y.; Xiao, H. Ethylene scavengers for the preservation of fruits and vegetables: A review. Food Chem. 2021, 337, 127750. [Google Scholar] [CrossRef] [PubMed]
  13. Kazan, K. Diverse roles of jasmonates and ethylene in abiotic stress tolerance. Trends Plant Sci. 2015, 20, 219–229. [Google Scholar] [CrossRef] [PubMed]
  14. Keunen, E.; Schellingen, K.; Vangronsveld, J.; Cuypers, A. Ethylene and Metal Stress: Small Molecule, Big Impact. Front. Plant Sci. 2016, 7, 23. [Google Scholar] [CrossRef] [Green Version]
  15. Jin, X.; Liao, W.B.; Yu, J.H.; Ren, P.J.; Dawuda, M.; Wang, M.; Niu, L.J.; Li, X.P.; Xu, X.T. Nitric oxide is involved in ethylene-induced adventitious rooting in marigold (Tagetes erecta L.). Can. J. Plant Sci. 2017, 97, 620–631. [Google Scholar]
  16. Lyu, J.; Wu, Y.; Jin, X.; Tang, Z.; Liao, W.; Dawuda, M.M.; Hu, L.; Xie, J.; Yu, J.; Calderón-Urrea, A. Proteomic analysis reveals key proteins involved in ethylene-induced adventitious root development in cucumber (Cucumis sativus L.). PeerJ 2021, 9, e10887. [Google Scholar] [CrossRef]
  17. Bai, T.; Dong, Z.; Zheng, X.; Song, S.; Jiao, J.; Wang, M.; Song, C. Auxin and Its Interaction with Ethylene Control Adventitious Root Formation and Development in Apple Rootstock. Front. Plant Sci. 2020, 11, 574881. [Google Scholar] [CrossRef]
  18. Yu, J.; Niu, L.; Yu, J.; Liao, W.; Xie, J.; Lv, J.; Feng, Z.; Hu, L.; Dawuda, M.M. The Involvement of Ethylene in Calcium-Induced Adventitious Root Formation in Cucumber under Salt Stress. Int. J. Mol. Sci. 2019, 20, 1047. [Google Scholar] [CrossRef] [Green Version]
  19. Tian, X.; Xie, J.; Yu, J. Physiological and transcriptomic responses of Lanzhou Lily (Lilium davidii, var. unicolor) to cold stress. PLoS ONE 2020, 15, e0227921. [Google Scholar] [CrossRef]
  20. Lin, Z.; Wang, Z.; Zhang, X.; Liu, Z.; Li, G.; Wang, S.; Ding, Y. Complementary Proteome and Transcriptome Profiling in Developing Grains of a Notched-Belly Rice Mutant Reveals Key Pathways Involved in Chalkiness Formation. Plant Cell Physiol. 2017, 58, 560–573. [Google Scholar] [CrossRef]
  21. Domergue, J.; Abadie, C.; Limami, A.; Way, D.; Tcherkez, G. Seed quality and carbon primary metabolism. Plant Cell Environ. 2019, 42, 2776–2788. [Google Scholar] [CrossRef] [PubMed] [Green Version]
  22. Moore, B.; Zhou, L.; Rolland, F.; Hall, Q.; Cheng, W.H.; Liu, Y.X.; Hwang, I.; Jones, T.; Sheen, J. Role of the Arabidopsis glucose sensor HXK1 in nutrient, light, and hormonal signaling. Science 2003, 300, 332–336. [Google Scholar] [CrossRef] [PubMed]
  23. Gharbi, I.; Ricard, B.; Rolin, D.; Maucourt, M.; Andrieu, M.-H.; Bizid, E.; Smiti, S.; Brouquisse, R. Effect of hexokinase activity on tomato root metabolism during prolonged hypoxia. Plant Cell Environ. 2007, 30, 508–517. [Google Scholar] [CrossRef] [PubMed]
  24. Andriunas, F.A.; Zhang, H.-M.; Weber, H.; McCurdy, D.W.; Offler, C.E.; Patrick, J.W. Glucose and ethylene signalling pathways converge to regulate trans-differentiation of epidermal transfer cells in Vicia narbonensis cotyledons. Plant J. 2011, 68, 987–998. [Google Scholar] [CrossRef] [PubMed]
  25. Zhou, L.; Jang, J.-C.; Jones, T.L.; Sheen, J. Glucose and ethylene signal transduction crosstalk revealed by an Arabidopsis glucose-insensitive mutant. Proc. Natl. Acad. Sci. USA 1998, 95, 10294–10299. [Google Scholar] [CrossRef] [Green Version]
  26. Cho, Y.-H.; Sheen, J.; Yoo, S.-D. Low Glucose Uncouples Hexokinase1-Dependent Sugar Signaling from Stress and Defense Hormone Abscisic Acid and C2H4 Responses in Arabidopsis. Plant Physiol. 2010, 152, 1180–1182. [Google Scholar] [CrossRef] [Green Version]
  27. Singh, V.; Zemach, H.; Shabtai, S.; Aloni, R.; Yang, J.; Zhang, P.; Sergeeva, L.; Ligterink, W.; Firon, N. Proximal and Distal Parts of Sweetpotato Adventitious Roots Display Differences in Root Architecture, Lignin, and Starch Metabolism and Their Developmental Fates. Front. Plant Sci. 2021, 11, 609923. [Google Scholar] [CrossRef]
  28. Seung, D. Amylose in starch: Towards an understanding of biosynthesis, structure and function. New Phytol. 2020, 228, 1490–1504. [Google Scholar] [CrossRef]
  29. Megguer, C.A.; Fugate, K.K.; Lafta, A.M.; Ferrareze, J.P.; Deckard, E.L.; Campbell, L.G.; Lulai, E.C.; Finger, F.L. Glycolysis Is Dynamic and Relates Closely to Respiration Rate in Stored Sugarbeet Roots. Front. Plant Sci. 2017, 8, 861. [Google Scholar] [CrossRef] [Green Version]
  30. Fernie, A.R.; Carrari, F.; Sweetlove, L.J. Respiratory metabolism: Glycolysis, the TCA cycle and mitochondrial electron transport. Curr. Opin. Plant Biol. 2004, 7, 254–261. [Google Scholar] [CrossRef]
  31. Lim, G.-H.; Singhal, R.; Kachroo, A.; Kachroo, P. Fatty acid- and lipid-mediated signaling in plant defense. Annu. Rev. Phytopathol. 2017, 55, 505–536. [Google Scholar] [CrossRef] [PubMed]
  32. Höfer, R.; Briesen, I.; Beck, M.; Pinot, F.; Schreiber, L.; Franke, R. The Arabidopsis cytochrome P450 CYP86A1 encodes a fatty acid omega-hydroxylase involved in suberin monomer biosynthesis. J. Exp. Bot. 2008, 59, 2347–2360. [Google Scholar] [CrossRef] [PubMed]
  33. Wang, G.; Xu, J.; Li, L.; Guo, Z.; Si, Q.; Zhu, G.; Wang, X.; Guo, W. GbCYP86A1-1 from Gossypium barbadense positively regulates defence against Verticillium dahliae by cell wall modification and activation of immune pathways. Plant Biotechnol. J. 2020, 18, 222–238. [Google Scholar] [CrossRef] [PubMed] [Green Version]
  34. Baxter, I.; Hosmani, P.S.; Rus, A.; Lahner, B.; Borevitz, J.O.; Muthukumar, B.; Mickelbart, M.V.; Schreiber, L.; Franke, R.B.; Salt, D.E. Root Suberin Forms an Extracellular Barrier That Affects Water Relations and Mineral Nutrition in Arabidopsis. PLoS Genet. 2009, 5, e1000492. [Google Scholar] [CrossRef] [PubMed] [Green Version]
  35. Wang, Y.; Sun, H.; Wang, H.; Yang, X.; Xu, Y.; Yang, Z.; Xu, C.; Li, P. Integrating transcriptome, co-expression and QTL-seq analysis reveals that primary root growth in maize is regulated via flavonoid biosynthesis and auxin signal transduction. J. Exp. Bot. 2021, 72, 4773–4795. [Google Scholar] [CrossRef] [PubMed]
  36. Park, Y.J.; Thwe, A.A.; Li, X.; Kim, Y.J.; Kim, J.K.; Arasu, M.V.; Al-Dhabi, N.A.; Park, S.U. Triterpene and Flavonoid Biosynthesis and Metabolic Profiling of Hairy Roots, Adventitious Roots, and Seedling Roots of Astragalus membranaceus. J. Agric. Food Chem. 2015, 63, 8862–8869. [Google Scholar] [CrossRef]
  37. Cheniany, M.; Ganjeali, A. Developmental role of phenylalanine-ammonia-lyase (PAL) and cinnamate 4-hydroxylase (C4H) genes during adventitious rooting of Juglans regia L. microshoots. Acta Biol. Hung. 2016, 67, 379–392. [Google Scholar] [CrossRef] [PubMed] [Green Version]
  38. Yu, X.-Z.; Fan, W.-J.; Lin, Y.-J.; Zhang, F.-F.; Gupta, D.K. Differential expression of the PAL gene family in rice seedlings exposed to chromium by microarray analysis. Ecotoxicology 2018, 27, 325–335. [Google Scholar] [CrossRef]
  39. Mehrabanjoubani, P.; Abdolzadeh, A.; Sadeghipour, H.R.; Aghdasi, M.; Bagherieh-Najjar, M.B.; Barzegargolchini, B. Silicon increases cell wall thickening and lignification in rice (Oryza sativa) root tip under excess Fe nutrition. Plant Physiol. Biochem. 2019, 144, 264–273. [Google Scholar] [CrossRef]
  40. Ye, Z.; Yu, J.; Yan, W.; Zhang, J.; Yang, D.; Yao, G.; Liu, Z.; Wu, Y.; Hou, X. Integrative iTRAQ-based proteomic and transcriptomic analysis reveals the accumulation patterns of key metabolites associated with oil quality during seed ripening of Camellia oleifera. Hortic. Res. 2021, 8, 157. [Google Scholar] [CrossRef]
  41. Sharma, A.; Badola, P.K.; Bhatia, C.; Sharma, D.; Trivedi, P.K. Primary transcript of miR858 encodes regulatory peptide and controls flavonoid biosynthesis and development in Arabidopsis. Nat. Plants 2020, 6, 1262–1274. [Google Scholar] [CrossRef] [PubMed]
  42. Della Rovere, F.; Fattorini, L.; D’Angeli, S.; Veloccia, A.; Del Duca, S.; Cai, G.; Falasca, G.; Altamura, M.M. Arabidopsis SHR and SCR transcription factors and AUX1 auxin influx carrier control the switch between adventitious rooting and xylogenesis in planta and in in vitro cultured thin cell layers. Ann. Bot. 2015, 115, 617–628. [Google Scholar] [CrossRef]
  43. Wei, K.; Ruan, L.; Wang, L.; Cheng, H. Auxin-Induced Adventitious Root Formation in Nodal Cuttings of Camellia sinensis. Int. J. Mol. Sci. 2019, 20, 4817. [Google Scholar] [CrossRef] [PubMed] [Green Version]
  44. Da Costa, C.T.; Offringa, R.; Fett-Neto, A.G. The role of auxin transporters and receptors in adventitious rooting of Arabidopsis thaliana pre-etiolated flooded seedlings. Plant Sci. 2020, 290, 110294. [Google Scholar] [CrossRef]
  45. Harkey, A.F.; Watkins, J.M.; Olex, A.L.; DiNapoli, K.T.; Lewis, D.R.; Fetrow, J.S.; Binder, B.M.; Muday, G.K. Identification of Transcriptional and Receptor Networks That Control Root Responses to Ethylene. Plant Physiol. 2018, 176, 2095–2118. [Google Scholar] [CrossRef] [Green Version]
  46. Ahkami, A.H.; Melzer, M.; Ghaffari, M.R.; Pollmann, S.; Ghorbani Javid, M.; Shahinnia, F.; Hajirezaei, M.R.; Druege, U. Distribution of indole-3-acetic acid in Petunia hybrida shoot tip cuttings and relationship between auxin transport, carbohydrate metabolism and adventitious root formation. Planta 2013, 238, 499–517. [Google Scholar] [CrossRef] [PubMed] [Green Version]
  47. Steffens, B.; Wang, J.; Sauter, M. Interactions between ethylene, gibberellin and abscisic acid regulate emergence and growth rate of adventitious roots in deepwater rice. Planta 2005, 223, 604–612. [Google Scholar] [CrossRef] [PubMed]
  48. García-Andrade, J.; González, B.; Gonzalez-Guzman, M.; Rodriguez, P.L.; Vera, P. The Role of ABA in Plant Immunity is Mediated through the PYR1 Receptor. Int. J. Mol. Sci. 2020, 21, 5852. [Google Scholar] [CrossRef]
  49. Wang, Z.; Ren, Z.; Cheng, C.; Wang, T.; Ji, H.; Zhao, Y.; Deng, Z.; Zhi, L.; Lu, J.; Wu, X.; et al. Counteraction of ABA-Mediated Inhibition of Seed Germination and Seedling Establishment by ABA Signaling Terminator in Arabidopsis. Mol. Plant 2020, 13, 1284–1297. [Google Scholar] [CrossRef]
  50. Zhao, Y.; Xing, L.; Wang, X.; Hou, Y.-J.; Gao, J.; Wang, P.; Duan, C.-G.; Zhu, X.; Zhu, J.-K. The ABA Receptor PYL8 Promotes Lateral Root Growth by Enhancing MYB77-Dependent Transcription of Auxin-Responsive Genes. Sci. Signal. 2014, 7, ra53. [Google Scholar] [CrossRef] [Green Version]
  51. Yamasaki, S.; Fujii, N.; Takahashi, H. The Ethylene-Regulated Expression of CS-ETR2 and CS-ERS Genes in Cucumber Plants and Their Possible Involvement with Sex Expression in Flowers. Plant Cell Physiol. 2000, 41, 608–616. [Google Scholar] [CrossRef] [Green Version]
  52. Hua, J.; Sakai, H.; Nourizadeh, S.; Chen, Q.G.; Bleecker, A.B.; Ecker, J.R.; Meyerowitz, E.M. EIN4 and ERS2 are members of the putative ethylene receptor gene family in Arabidopsis. Plant Cell 1998, 10, 1321–1332. [Google Scholar] [CrossRef] [PubMed]
  53. Müssig, C.; Shin, G.-H.; Altmann, T. Brassinosteroids Promote Root Growth in Arabidopsis. Plant Physiol. 2003, 133, 1261–1271. [Google Scholar] [CrossRef] [Green Version]
  54. Maharjan, P.M.; Dilkes, B.P.; Fujioka, S.; Pěnčík, A.; Ljung, K.; Burow, M.; Halkier, B.A.; Choe, S. Arabidopsis gulliver1/superroot2-7 identifies a metabolic basis for auxin and brassinosteroid synergy. Plant J. 2014, 80, 797–808. [Google Scholar] [CrossRef] [PubMed]
  55. Xie, L.; Chen, F.; Du, H.; Zhang, X.; Wang, X.; Yao, G.; Xu, B. Graphene oxide and indole-3-acetic acid cotreatment regulates the root growth of Brassica napus L. via multiple phytohormone pathways. BMC Plant Biol. 2020, 20, 101. [Google Scholar] [CrossRef] [Green Version]
  56. Maris, A.; Suslov, D.; Fry, S.C.; Verbelen, J.-P.; Vissenberg, K. Enzymic characterization of two recombinant xyloglucan endotransglucosylase/hydrolase (XTH) proteins of Arabidopsis and their effect on root growth and cell wall extension. J. Exp. Bot. 2009, 60, 3959–3972. [Google Scholar] [CrossRef] [Green Version]
  57. Zhao, Z.; Li, C.; Liu, H.; Yang, J.; Huang, P.; Liao, W. The Involvement of Glucose in Hydrogen Gas-Medicated Adventitious Rooting in Cucumber. Plants 2021, 10, 1937. [Google Scholar] [CrossRef]
  58. Pattemore, J.A. RNA Extraction from Cereal Vegetative Tissue. In Cereal Genomics; Methods in Molecular Biology; Humana Press: Totowa, NJ, USA, 2013; Volume 1099, pp. 17–21. [Google Scholar] [CrossRef]
  59. Wei, Q.; Jiao, C.; Guo, L.; Ding, Y.; Cao, J.; Feng, J.; Dong, X.; Mao, L.; Sun, H.; Yu, F.; et al. Exploring key cellular processes and candidate genes regulating the primary thickening growth of Moso underground shoots. New Phytol. 2017, 214, 81–96. [Google Scholar] [CrossRef]
  60. Davies, J.; Denyer, T.; Hadfield, J. Bioanalyzer chips can be used interchangeably for many analyses of DNA or RNA. BioTechniques 2016, 60, 197–199. [Google Scholar] [CrossRef] [PubMed] [Green Version]
  61. Anderson, A.J.; Culver, H.R.; Prieto, T.R.; Martinez, P.J.; Sinha, J.; Bryant, S.J.; Bowman, C.N. Messenger RNA enrichment using synthetic oligo (T) click nucleic acids. Chem. Commun. 2020, 56, 13987–13990. [Google Scholar] [CrossRef]
  62. Degenkolbe, T.; Hannah, M.A.; Freund, S.; Hincha, D.K.; Heyer, A.G.; Köhl, K.I. A quality-controlled microarray method for gene expression profiling. Anal. Biochem. 2005, 346, 217–224. [Google Scholar] [CrossRef]
  63. Annaluru, N.; Muller, H.; Ramalingam, S.; Kandavelou, K.; London, V.; Richardson, S.M.; Dymond, J.S.; Cooper, E.M.; Bader, J.S.; Boeke, J.D.; et al. Assembling DNA Fragments by USER Fusion. In Gene Synthesis; Methods in Molecular Biology; Humana Press: Totowa, NJ, USA, 2012; Volume 852, pp. 77–95. [Google Scholar] [CrossRef]
  64. Kanehisa, M.; Araki, M.; Goto, S.; Hattori, M.; Hirakawa, M.; Itoh, M.; Katayama, T.; Kawashima, S.; Okuda, S.; Tokimatsu, T.; et al. KEGG for linking genomes to life and the environment. Nucleic Acids Res. 2008, 36, D480–D484. [Google Scholar] [CrossRef] [PubMed]
  65. Tauzin, A.S.; Giardina, T. Sucrose and invertases, a part of the plant defense response to the biotic stresses. Front. Plant Sci. 2014, 5, 293. [Google Scholar] [CrossRef]
  66. Smith, A.M.; Zeeman, S. Quantification of starch in plant tissues. Nat. Protoc. 2006, 1, 1342–1345. [Google Scholar] [CrossRef]
  67. Sun, L.; Li, C.; Zhu, J.; Jiang, C.; Li, Y.; Ge, Y. Influences of postharvest ATP treatment on storage quality and enzyme activity in sucrose metabolism of Malus domestica. Plant Physiol. Biochem. 2020, 156, 87–94. [Google Scholar] [CrossRef] [PubMed]
  68. González-Mendoza, D.; Troncoso-Rojas, R.; Gonzalez-Soto, T.; Grimaldo-Juarez, O.; Ceceña-Duran, C.; Duran-Hernandez, D.; Gutiérrez-Miceli, F. Changes in the phenylalanine ammonia lyase activity, total phenolic compounds, and flavonoids in Prosopis glandulosa treated with cadmium and copper. An. Acad. Bras. Cienc. 2018, 90, 1465–1472. [Google Scholar] [CrossRef] [Green Version]
  69. Qi, N.; Hou, X.; Wang, C.; Li, C.; Huang, D.; Li, Y.; Wang, N.; Liao, W. Methane-rich water induces bulblet formation of scale cuttings in Lilium davidii var. unicolor by regulating the signal transduction of phytohormones and their levels. Physiol. Plant. 2021, 172, 1919–1930. [Google Scholar] [PubMed]
  70. Tsubone, M.; Kubota, F.; Saitou, K.; Kadowaki, M. Enhancement of tuberous root production and adenosine 5’-diphosphate pyrophosphorylase (AGPase) activity in sweet potato (Ipomoea batatas Lam.) by exogenous injection of sucrose solution. J. Agron. Crop Sci. 2000, 184, 181–186. [Google Scholar] [CrossRef]
  71. Stals, A.; Werbrouck, H.; Baert, L.; Botteldoorn, N.; Herman, L.; Uyttendaele, M.; Van Coillie, E. Laboratory efforts to eliminate contamination problems in the real-time RT-PCR detection of noroviruses. J. Microbiol. Methods 2009, 77, 72–76. [Google Scholar] [CrossRef]
  72. Livak, K.J.; Schmittgen, T.D. Analysis of relative gene expression data using real-time quantitative PCR and the 2(-Delta Delta C(T)) Method. Methods 2001, 25, 402–408. [Google Scholar] [CrossRef]
Figure 1. Volcano map, GO classification and KEGG pathway of DEGs identified in cucumber by ETH treatment. (A) Volcano map of DEGs. The X-axis displays the log2FoldChange value, and the Y-axis displays the −log10p value. Red and blue dots represent the number of up- and down-regulated DEGs, respectively. (B) GO classification of the annotated DEGs. The red, green and blue bars represent biological process (BP), cell component (CC) and molecular function (MF), respectively. The Y-axis displays the −log10 (padj) value of each term, and the X-axis displays the GO terms and the enriched DEGs numbers.
Ijms 23 12981 g001
Figure 2. Identification and validation of key DEGs in starch and sucrose metabolism during adventitious root development in cucumber. (A) Expression patterns of genes and proteins for starch and sucrose metabolism in carbon metabolism during adventitious root development in cucumber. The dashed box represents starch and sucrose metabolism. Annotations of genes and proteins are available in Supplementary Table S5. Black characters with yellow background are genes, whereas black characters with blue background are proteins. The two squares under the names of genes or proteins indicate the abundance change between the control and ETH. A red square means up-regulation, whereas a blue square means down-regulation. (B) The contents of sucrose, glucose and starch during adventitious root development in cucumber. (C) The activities of SS, SPS and HK enzyme during adventitious root development in cucumber. (D) Quantitative real-time PCR analysis of the expression profiles of 6 genes related to starch and sucrose metabolism during adventitious root development in cucumber. Asterisk (*) and double asterisk (**) indicate the significance at p < 0.05 and p < 0.01, respectively. The bar represents the value of standard error. Values represent the mean ± SE of three replicates. Each experiment was repeated three times independently.
Ijms 23 12981 g002
Figure 3. Identification and validation of key DEGs in glycolysis/gluconeogenesis, citrate cycle (TCA cycle) and oxidative phosphorylation during adventitious root development in cucumber. (A) Expression patterns of genes for glycolysis/gluconeogenesis during adventitious root development in cucumber. (B) Expression patterns of genes for TCA cycle in carbon metabolism during adventitious root development in cucumber. (C) Expression patterns of genes for oxidative phosphorylation in carbon metabolism during adventitious root development in cucumber. Annotations of genes and proteins are available in Supplementary Table S6. Black characters with yellow background are genes. The two squares under the names of genes or proteins indicate the abundance change of the control and ETH. A red square means up-regulation, whereas a blue square means down-regulation. The red dotted box represents the different pathways involved in carbon metabolism. (D) The activity of PK enzyme during adventitious root development in cucumber. (E) Quantitative real-time PCR analysis of the expression profiles of 6 genes related to glycolysis/gluconeogenesis, TCA cycle and oxidative phosphorylation during adventitious root development in cucumber. Asterisk (*) and double asterisk (**) indicate the significance at p < 0.05 and p < 0.01, respectively. The bar represents the value of standard error. Values represent the mean ± SE of three replicates. Each experiment was repeated three times independently.
Ijms 23 12981 g003
Figure 4. Identification and validation of key DEGs in fatty acid biosynthesis and fatty acid degradation during adventitious root development in cucumber. (A) Expression patterns of genes and proteins for fatty acid biosynthesis and fatty acid degradation in carbon metabolism during adventitious root development in cucumber. The dashed box represents fatty acid biosynthesis and fatty acid degradation. Annotations of genes and proteins are available in Supplementary Table S7. Black characters with yellow background are genes, whereas black characters with blue background are proteins. The two squares under the names of genes or proteins indicate the change in abundance of the control and ETH. A red square means up-regulation, whereas a blue square means down-regulation. (B) The expression profiles of 2 genes related to fatty acid biosynthesis and fatty acid degradation during adventitious root development in cucumber. Double asterisk (**) indicates the significance at p < 0.01. The bar represents the value of standard error. Values represent the mean ± SE of three replicates. Each experiment was repeated three times independently.
Ijms 23 12981 g004
Figure 5. Identification and validation of key DEGs in phenylalanine metabolism during adventitious root development in cucumber. (A) Expression patterns of genes and proteins for phenylalanine metabolism in secondary metabolism during adventitious root development in cucumber. Annotations of genes and proteins are available in Supplementary Table S8. Black characters with yellow background are genes, whereas black characters with blue background are proteins. The two squares under the names of genes or proteins indicate the change in abundance of the control and ETH. A red square means up-regulation, whereas a blue square means down-regulation. (B) The activity of PAL and PAO enzyme during adventitious root development in cucumber. (C) Quantitative real-time PCR analysis of the expression profiles of 2 genes related to phenylalanine metabolism during adventitious root development in cucumber. Asterisk (*) and double asterisk (**) indicate the significance at p < 0.05 and p < 0.01, respectively. The bar represents the value of standard error. Values represent the mean ± SE of three replicates. Each experiment was repeated three times independently.
Ijms 23 12981 g005
Figure 6. Identification and validation of key DEGs in flavonoid biosynthesis during adventitious root development in cucumber. (A) Expression patterns of genes and proteins for flavonoid biosynthesis in secondary metabolism during adventitious root development in cucumber. Annotations of genes and proteins are available in Supplementary Table S9. Black characters with yellow background are genes. The two squares under the names of genes or proteins indicate the change in abundance of the control and ETH. A red square means up-regulation, whereas a blue square means down-regulation. (B) The expression profiles of 2 genes related to flavonoid biosynthesis during adventitious root development in cucumber. Asterisk (*) and double asterisk (**) indicate the significance at p < 0.05 and p < 0.01, respectively. The bar represents the value of standard error. Values represent the mean ± SE of three replicates. Each experiment was repeated three times independently.
Ijms 23 12981 g006
Figure 7. Identification and validation of key DEGs in plant hormone signal transduction during adventitious root development in cucumber. (A) Expression patterns of genes and proteins for plant hormone signal transduction during adventitious root development in cucumber. Annotations of genes and proteins are available in Supplementary Table S10. Black characters with yellow background are genes, whereas black characters with blue background are proteins. The two squares under the names of genes or proteins indicate the change in abundance of the control and ETH. A red square means up-regulation, whereas a blue square means down-regulation. (B) The contents of IAA and ABA during adventitious root development in cucumber. (C) Quantitative real-time PCR analysis of the expression profiles of 7 genes related to plant hormone signal transduction during adventitious root development in cucumber. Asterisk (*) and double asterisk (**) indicate the significance at p < 0.05 and p < 0.01, respectively. The bar represents the value of standard error. Values represent the mean ± SE of three replicates. Each experiment was repeated three times independently.
Ijms 23 12981 g007
Table 1. Enriched KEGG pathways of the DEGs in ETH treatment.
KEGGIDPathwayp ValueTotal DEGsUp-Regulated DEGsDown-Regulated DEGs
csv00591Linoleic acid metabolism0.006637889642
csv00500Starch and sucrose metabolism0.00711286417215
csv00909Sesquiterpenoid and triterpenoid biosynthesis0.007603753523
csv00071Fatty acid degradation0.017687328862
csv00950Isoquinoline alkaloid biosynthesis0.018821384440
csv00360Phenylalanine metabolism0.021066898752
csv04075Plant hormone signal transduction0.026635092261313
csv01212Fatty acid metabolism0.032091296972
csv00040Pentose and glucuronate interconversions0.0374988371028
csv00073Cutin, suberine and wax biosynthesis0.039280085505
Publisher’s Note: MDPI stays neutral with regard to jurisdictional claims in published maps and institutional affiliations.

