
Soemmerring’s Rings Developed around IOLs, in Human Donor Eyes, Can Present Internal Transparent Areas

Abstract
:1. Introduction
2. Results
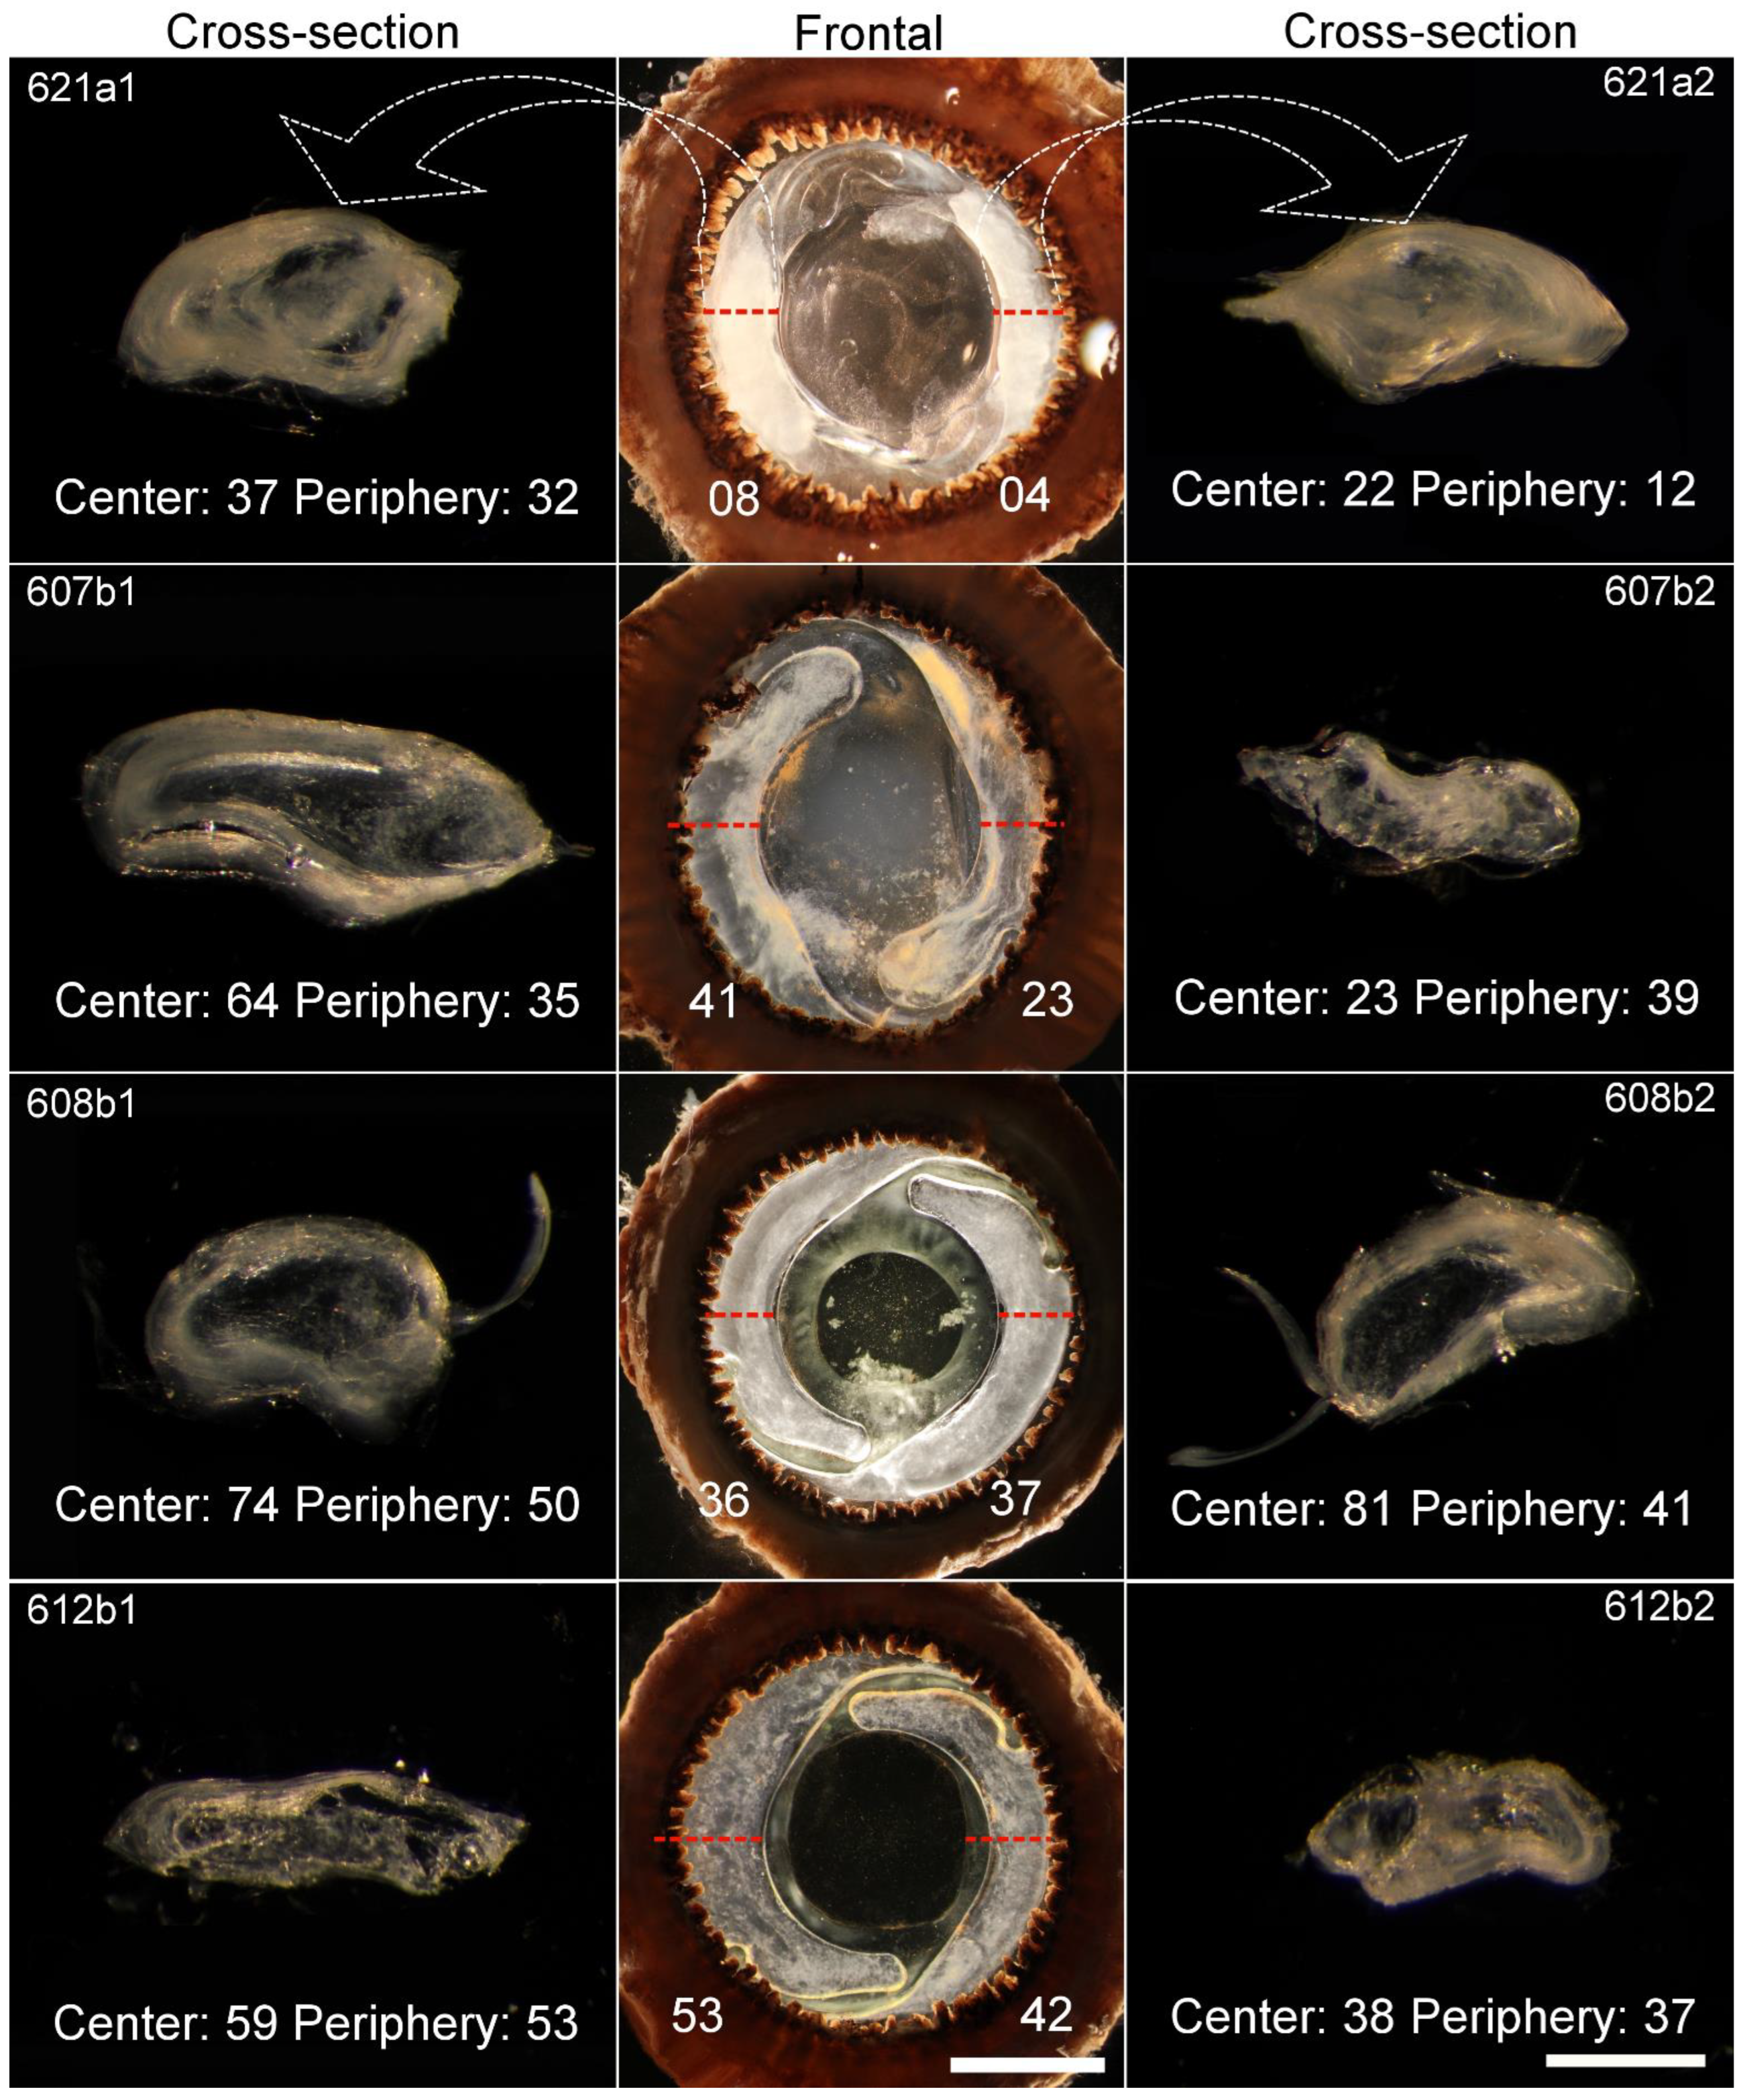
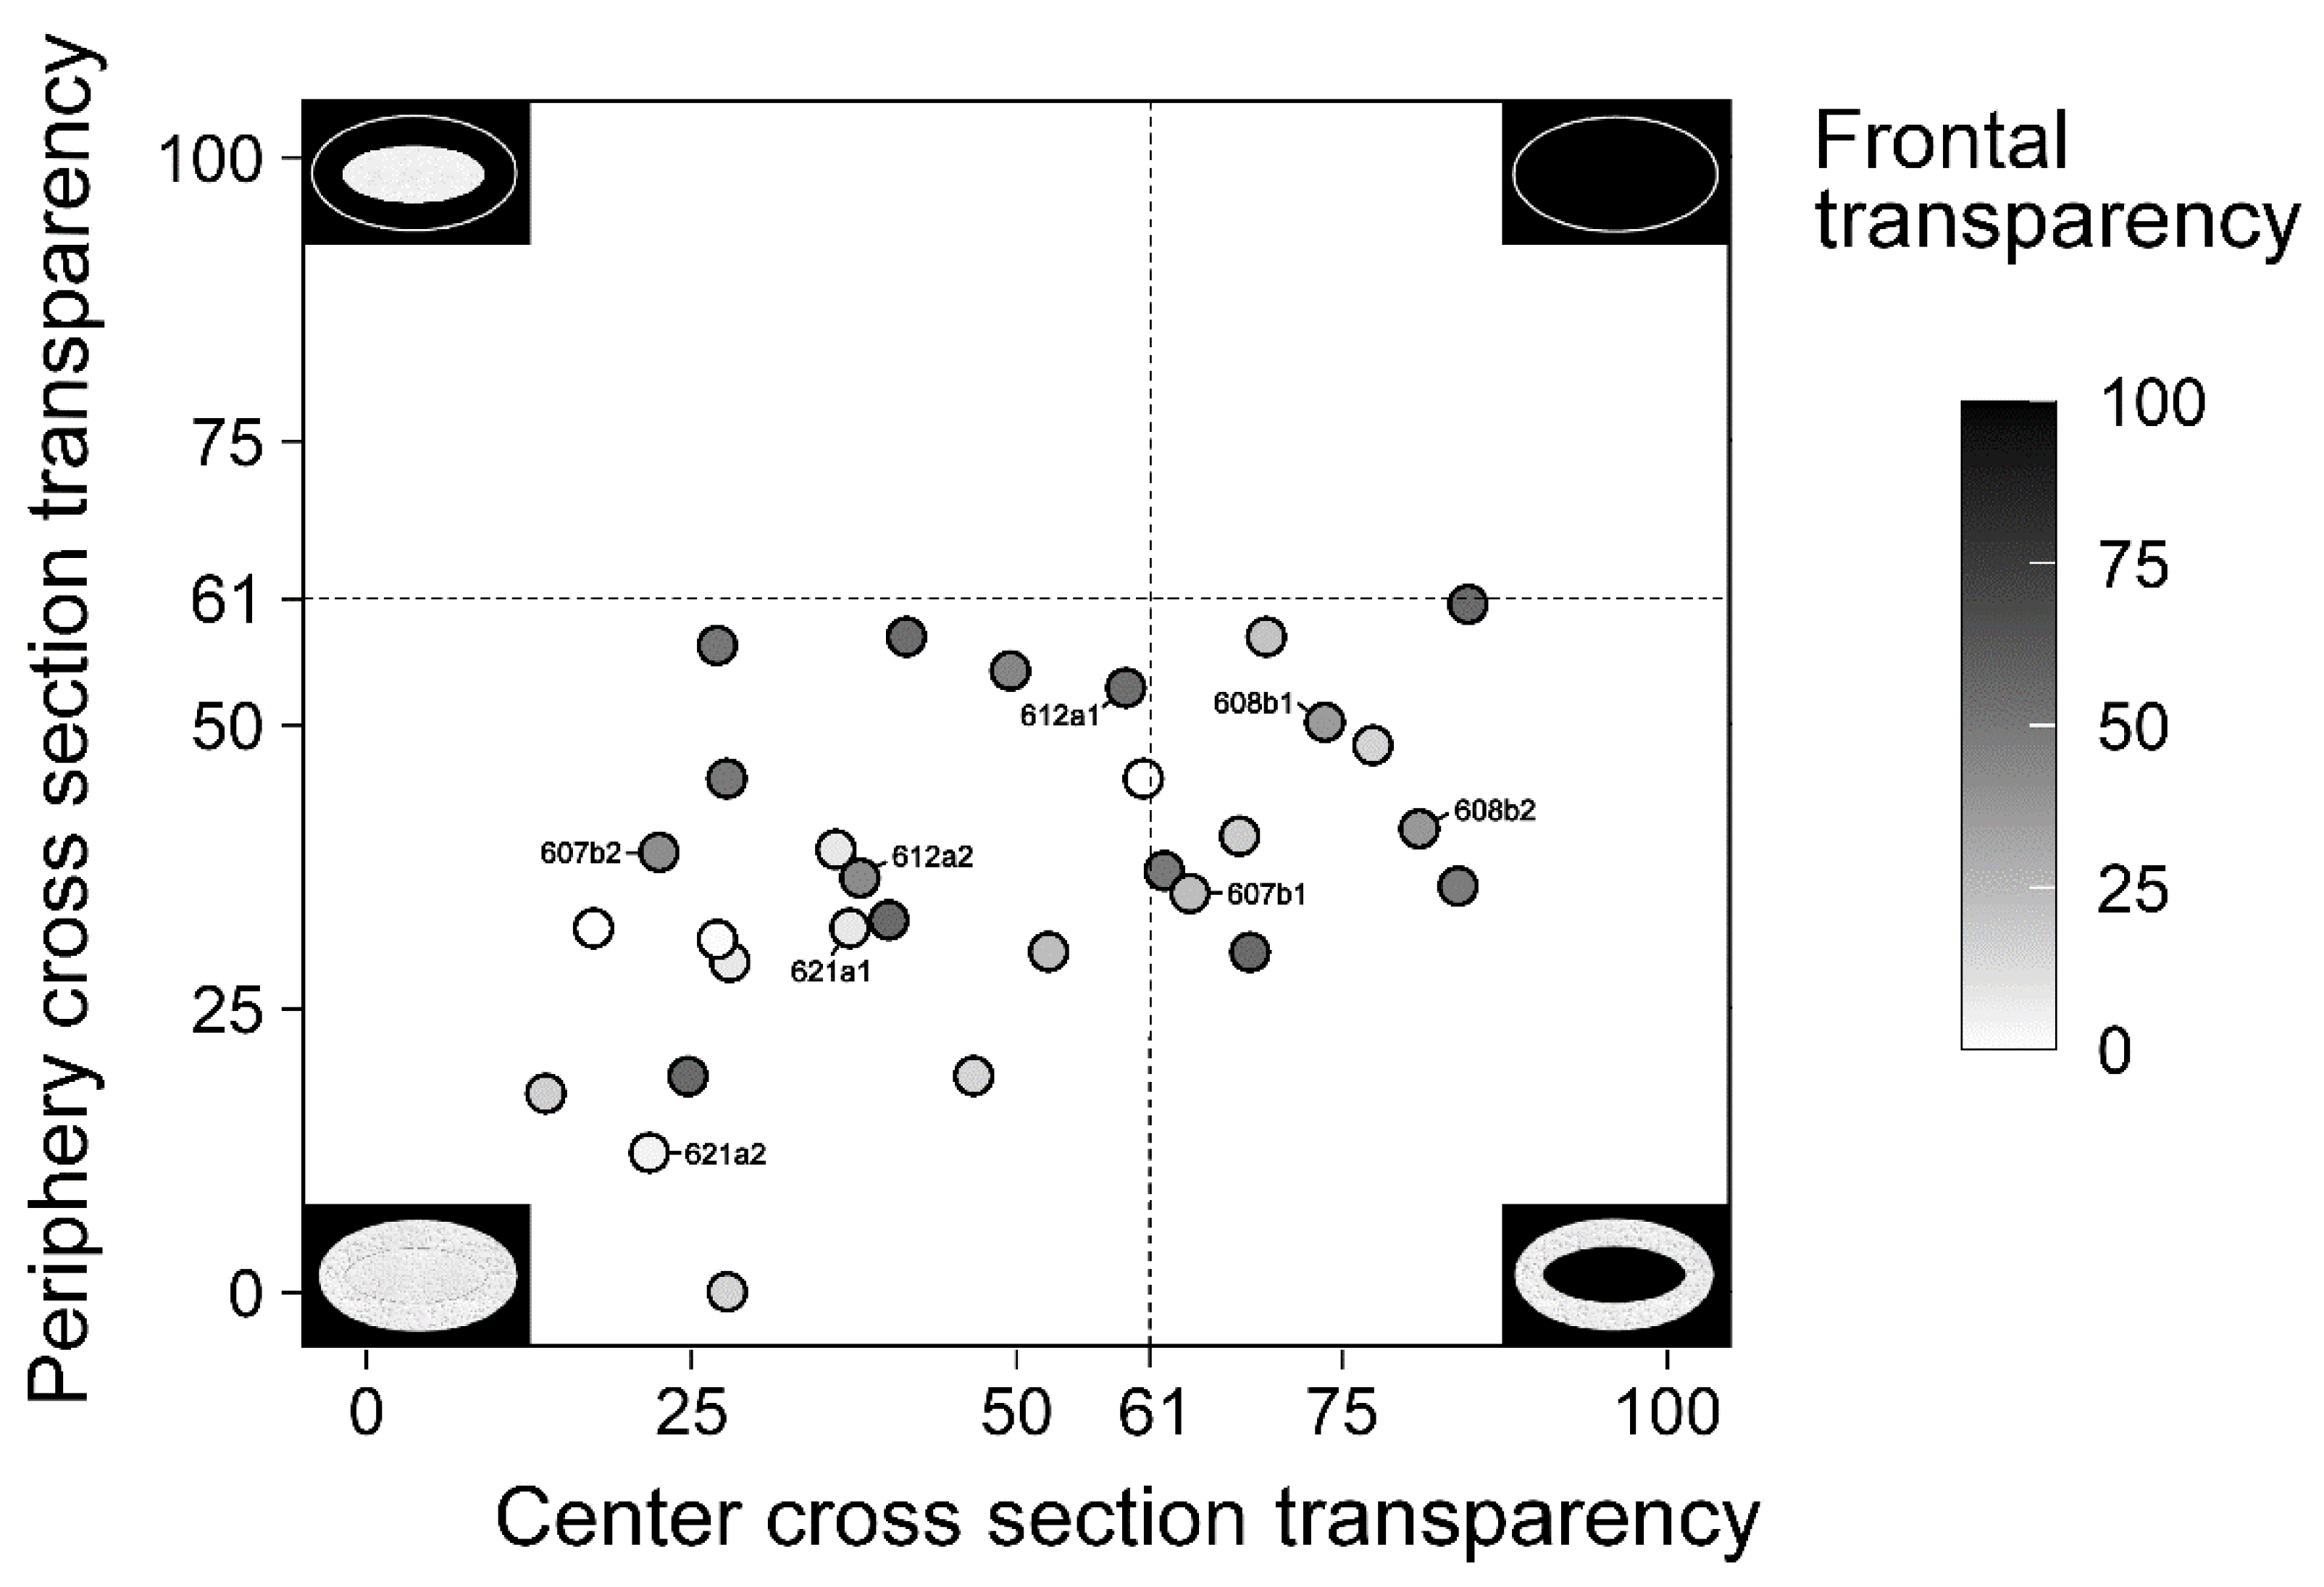
2.1. Transparency
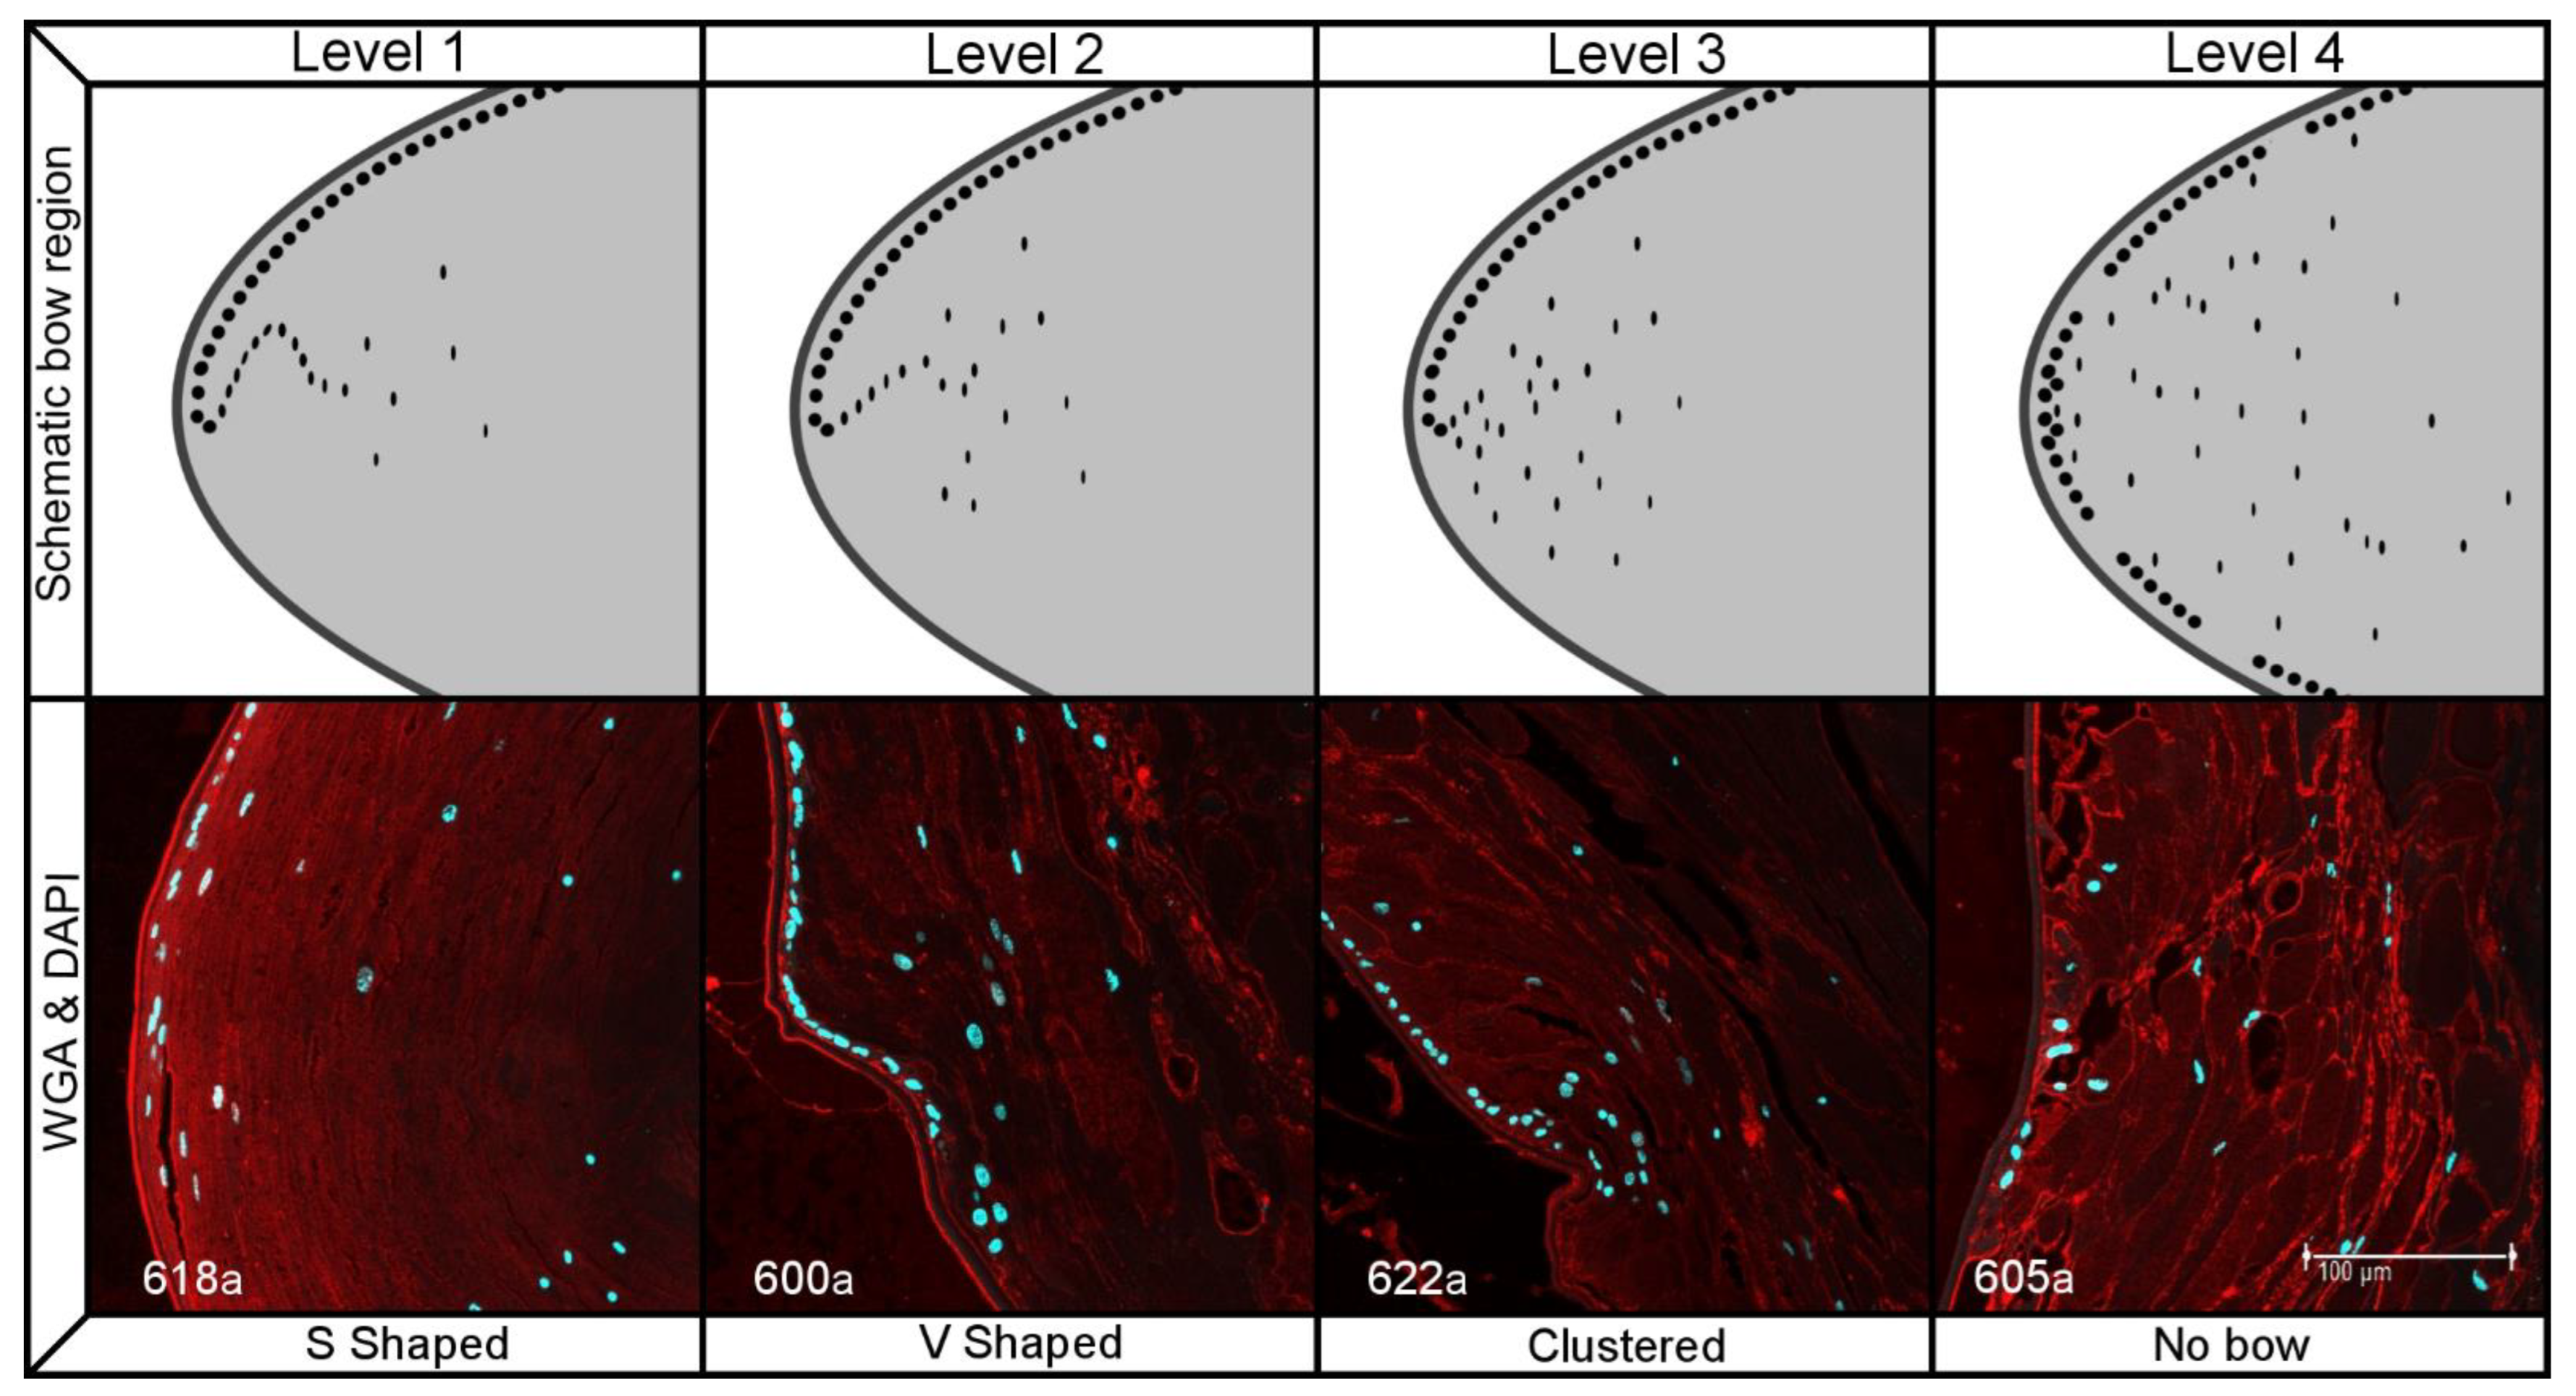
2.2. Histology
3. Discussion
3.1. Transparency
3.2. Mechanisms of Transparency
4. Materials and Methods
4.1. Tissue
4.2. Quantification of Transparency
4.3. Histology
5. Conclusions
Supplementary Materials
Author Contributions
Funding
Institutional Review Board Statement
Informed Consent Statement
Data Availability Statement
Acknowledgments
Conflicts of Interest
References
- Soemmering, W. Beobachtungen über die organischen Veränderungen des Auges nach Staroperationen; Wilhem Ludwig Wesché: Frankfurt, Germany, 1828. [Google Scholar]
- Findl, O.; Neumayer, T.; Hirnschall, N.; Buehl, W. Natural Course of Elschnig Pearl Formation and Disappearance. Investig. Opthalmology Vis. Sci. 2010, 51, 1547–1553. [Google Scholar] [CrossRef] [Green Version]
- Koch, C.R.; D’Antin, J.C.; Tresserra, F.; Barraquer, R.I.; Michael, R. Histological comparison of in vitro and in vivo de-velopment of peripheral posterior capsule opacification in human donor tissue. Exp. Eye Res. 2019, 188, 107807. [Google Scholar] [CrossRef]
- Donaldson, P.J.; Chee, K.-S.N.; Lim, J.; Webb, K.F. Regulation of lens volume: Implications for lens transparency. Exp. Eye Res. 2009, 88, 144–150. [Google Scholar] [CrossRef]
- Michael, R.; Barraquer, R.I.; Willekens, B.; van Marle, J.; Vrensen, G.F. Morphology of age-related cuneiform cortical cataracts: The case for mechanical stress. Vis. Res. 2008, 48, 626–634. [Google Scholar] [CrossRef] [Green Version]
- Kuszak, J. The Ultrastructure of Epithelial and Fiber Cells in the Crystalline Lens. Int. Rev. Cytol. 1995, 163, 305–350. [Google Scholar] [CrossRef]
- Aykan, U.; Bilge, A.H.; Karadayi, K.; Akin, T. The effect of capsulorhexis size on development of posterior capsule opaci-fication: Small (4.5 to 5.0 mm) versus large (6.0 to 7.0 mm). Eur. J. Ophthalmol. 2003, 13, 541–545. [Google Scholar] [CrossRef] [Green Version]
- Hollick, E.J.; Spalton, D.J.; Meacock, W.R. The effect of capsulorhexis size on posterior capsular opacification: One-year results of a randomized prospective trial. Am. J. Ophthalmol. 1999, 128, 271–279. [Google Scholar] [CrossRef]
- Liu, X.; Zhang, X.; Liu, Y.; Liu, X. To establish and observe the experimental lens regeneration model in rabbits. Yan Ke Xue Bao 2002, 18, 230–234, 248. [Google Scholar]
- Ravalico, G.; Tognetto, D.; Palomba, M.; Busatto, P.; Baccara, F. Capsulorhexis size and posterior capsule opacification. J. Cataract Refract. Surg. 1996, 22, 98–103. [Google Scholar] [CrossRef]
- Tan, X.; Liu, Z.; Zhu, Y.; Chen, C.; Huang, S.; Chen, B.; Lin, Z.; Chen, J.; Qu, B.; Liu, X.; et al. The Fate of In Situ Lens Regeneration is Determined by Capsulorhexis Size. Curr. Mol. Med. 2017, 17, 270–279. [Google Scholar] [CrossRef]
- Lin, H.; Ouyang, H.; Zhu, J.; Huang, S.; Liu, Z.; Chen, S.; Cao, G.; Li, G.; Signer, R.; Xu, Y.; et al. Lens regeneration using endogenous stem cells with gain of visual function. Nature 2016, 531, 323–328. [Google Scholar] [CrossRef]
- Artigas, C.; Fandiño, A.; Navea, A.; López-Murcia, M.M.; Bosch-Morell, F.; Araujo-Miranda, R.; Artigas, J.M. The influence of storage method on the transparency of pig crystalline lens. Arq. Bras. De Oftalmol. 2019, 82, 56–61. [Google Scholar] [CrossRef]
- Michael, R.; van Marle, J.; Vrensen, G.F.; Berg, T.J.V.D. Changes in the refractive index of lens fibre membranes during maturation–impact on lens transparency. Exp. Eye Res. 2003, 77, 93–99. [Google Scholar] [CrossRef]
- Michael, R.; Bron, A.J. The ageing lens and cataract: A model of normal and pathological ageing. Philos. Trans. R. Soc. B Biol. Sci. 2011, 366, 1278–1292. [Google Scholar] [CrossRef] [Green Version]
- O’Connor, M.D.; Wederell, E.D.; de Iongh, R.; Lovicu, F.J.; McAvoy, J.W. Generation of transparency and cellular organization in lens explants. Exp. Eye Res. 2008, 86, 734–745. [Google Scholar] [CrossRef]
- Kumari, S.S.; Eswaramoorthy, S.; Mathias, R.T.; Varadaraj, K. Unique and analogous functions of aquaporin 0 for fiber cell ar-chitecture and ocular lens transparency. Biochim. Biophys. Acta 2011, 1812, 1089–1097. [Google Scholar] [CrossRef]
- Varadaraj, K.; Kumari, S.S. Molecular mechanism of Aquaporin 0-induced fiber cell to fiber cell adhesion in the eye lens. Biochem. Biophys. Res. Commun. 2018, 506, 284–289. [Google Scholar] [CrossRef]
- Bassnett, S. Fiber cell denucleation in the primate lens. Investig. Ophthalmol. Vis. Sci. 1997, 38, 1678–1687. [Google Scholar]
- De, M.A.; Arruti, C. DNase I and fragmented chromatin during nuclear degradation in adult bovine lens fibers. Mol. Vis. 2004, 10, 74–82. [Google Scholar]
- Bassnett, S. On the mechanism of organelle degradation in the vertebrate lens. Exp. Eye Res. 2009, 88, 133–139. [Google Scholar] [CrossRef] [Green Version]
- Jongebloed, W.L.; Dijk, F.; Kruis, J.; Worst, J.G.F. Soemmering’s ring, an aspect of secondary cataract: A morphological description by SEM. Doc. Ophthalmol. 1988, 70, 165–174. [Google Scholar] [CrossRef]
- Gwon, A.E.; Gruber, L.J.; Mundwiler, K.E. A histologic study of lens regeneration in aphakic rabbits. Investig. Ophthalmol. Vis. Sci. 1990, 31, 540–547. [Google Scholar]
- Dawes, L.; Sugiyama, Y.; Lovicu, F.; Harris, C.; Shelley, E.; McAvoy, J. Interactions between lens epithelial and fiber cells reveal an intrinsic self-assembly mechanism. Dev. Biol. 2014, 385, 291–303. [Google Scholar] [CrossRef] [Green Version]
- Lovicu, F.; McAvoy, J. Growth factor regulation of lens development. Dev. Biol. 2005, 280, 1–14. [Google Scholar] [CrossRef]
- Costello, M.J.; Brennan, L.A.; Basu, S.; Chauss, D.; Mohamed, A.; Gilliland, K.O.; Johnsen, S.; Menko, A.S.; Kantorow, M. Autophagy and mitophagy participate in ocular lens organelle degradation. Exp. Eye Res. 2013, 116, 141–150. [Google Scholar] [CrossRef] [Green Version]
- Chaffee, B.R.; Shang, F.; Chang, M.L.; Clement, T.M.; Eddy, E.M.; Wagner, B.D.; Nakahara, M.; Nagata, S.; Robinson, M.L.; Taylor, A. Nuclear removal during terminal lens fiber cell differentiation requires CDK1 activity: Appropriating mitosis-related nuclear dis-assembly. Development 2014, 141, 3388–3398. [Google Scholar] [CrossRef] [Green Version]
- Sandilands, A.; Prescott, A.R.; Carter, J.M.; Hutcheson, A.M.; Quinlan, R.A.; Richards, J.; FitzGerald, P.G. Vimentin and CP49/filensin form distinct networks in the lens which are independently modulated during lens fibre cell differentiation. J. Cell Sci. 1995, 108 Pt 4, 1397–1406. [Google Scholar] [CrossRef]
- Sax, C.M.; Farrell, F.X.; Zehner, Z.E.; Piatigorsky, J. Regulation of vimentin gene expression in the ocular lens. Dev. Biol. 1990, 139, 56–64. [Google Scholar] [CrossRef]
- Quinlan, R.A.; Sandilands, A.; Procter, J.E.; Prescott, A.R.; Hutcheson, A.M.; Dahm, R.; Gribbon, C.; Wallace, P.; Carter, J.M. The eye lens cytoskeleton. Eye 1999, 13, 409–416. [Google Scholar] [CrossRef] [Green Version]
- Gurtner, G.C.; Werner, S.; Barrandon, Y.; Longaker, M.T. Wound repair and regeneration. Nature 2008, 453, 314–321. [Google Scholar] [CrossRef]
- Henry, J.J.; Hamilton, P.W. Diverse Evolutionary Origins and Mechanisms of Lens Regeneration. Mol. Biol. Evol. 2018, 35, 1563–1575. [Google Scholar] [CrossRef] [Green Version]
- Huang, Y.; Xie, L. Expression of transcription factors and crystallin proteins during rat lens regeneration. Mol. Vis. 2010, 16, 341–352. [Google Scholar]
- Matsushima, H.; Mukai, K.; Obara, Y.; Yoshida, S.; Clark, J.I. Analysis of cytoskeletal proteins in posterior capsule opaci-fication after implantation of acrylic and hydrogel intraocular lenses. J. Cataract. Refract. Surg. 2004, 30, 187–194. [Google Scholar] [CrossRef]
- Medvedovic, M.; Tomlinson, C.R.; Call, M.K.; Grogg, M.; Tsonis, P.A. Gene expression and discovery during lens regen-eration in mouse: Regulation of epithelial to mesenchymal transition and lens differentiation. Mol. Vis. 2006, 12, 422–440. [Google Scholar] [PubMed]
- Vergara, M.N.; Tsissios, G.; Del Rio-Tsonis, K. Lens regeneration: A historical perspective. Int. J. Dev. Biol. 2018, 62, 351–361. [Google Scholar] [CrossRef] [PubMed]
- Hiramatsu, N.; Nagai, N.; Kondo, M.; Imaizumi, K.; Sasaki, H.; Yamamoto, N. Morphological comparison between three-dimensional structure of immortalized human lens epithelial cells and Soemmering’s ring. Med. Mol. Morphol. 2021, 54, 216–226. [Google Scholar] [CrossRef] [PubMed]
- Abramowitz, M.; Spring, K.R.; Keller, H.E.; Davidson, M.W. Basic Principles of Microscope Objectives. BioTechniques 2002, 33, 772–781. [Google Scholar] [CrossRef] [PubMed]


| Sample | Degree of Transparency | C-S Area (mm2) | ||
|---|---|---|---|---|
| Frontal | C-S Center | C-S Periphery | ||
| 561a 1 | 49 | 28 | 45 | 0.89 |
| 561a 2 | 44 | 50 | 55 | 1.18 |
| 563a 1 | 50 | 27 | 57 | 1.13 |
| 563a 2 | 54 | 42 | 58 | 0.94 |
| 577b 1 | 55 | 85 | 60 | 1.02 |
| 577b 2 | 48 | 84 | 36 | 0.89 |
| 590a 1 | 49 | 61 | 37 | 1.24 |
| 590a 2 | 55 | 68 | 30 | 1.33 |
| 600a 1 | 55 | 40 | 33 | 0.71 |
| 600a 2 | 55 | 25 | 19 | 1.08 |
| 605a 1 | 8 | 37 | 39 | 1.88 |
| 605a 2 | 0 | 18 | 32 | 1.50 |
| 607b 1 | 23 | 64 | 35 | 1.27 |
| 607b 2 | 41 | 23 | 39 | 0.83 |
| 608b 1 | 36 | 74 | 50 | 1.06 |
| 608b 2 | 37 | 81 | 41 | 1.05 |
| 612b 1 | 53 | 58 | 53 | 0.93 |
| 612b 2 | 42 | 38 | 37 | 0.87 |
| 613b 1 | 15 | 28 | 0 | 1.24 |
| 613b 2 | 15 | 47 | 19 | 1.30 |
| 616a 1 | 15 | 77 | 48 | 1.01 |
| 616a 2 | 18 | - | - | - |
| 617a 1 | 11 | 60 | 45 | 1.72 |
| 617a 2 | 21 | 69 | 58 | 1.65 |
| 618a 1 | 18 | 67 | 40 | 1.49 |
| 618a 2 | 23 | 53 | 30 | 1.45 |
| 621a 1 | 8 | 37 | 32 | 1.06 |
| 621a 2 | 4 | 22 | 12 | 1.02 |
| 622a 1 | 17 | 14 | 18 | 1.19 |
| 622a 2 | 14 | - | - | - |
| 625a 1 | 8 | 28 | 29 | 1.21 |
| 625a 2 | 1 | 27 | 31 | 1.21 |
| Morphological Factor | Levels of Organization | |||
|---|---|---|---|---|
| Level 1 | Level 2 | Level 3 | Level 4 | |
| Fiber organization | Organized thin fibers | Organized thick fibers | Layered globular fibers | Random globular fibers |
| Epithelial cell organization | Continuous monolayer | Monolayer with additional cells | More than one layer | Disperse epithelial cells |
| Nuclei organization at bow | S shaped bow | V shaped bow | clustered bow | No bow |
| Nuclei presence at center | No nuclei in center | Few small nuclei | dispersed nuclei | Many large nuclei |
| Cross-Section Center Transparent | Cross-Section Center Opaque | p Value | |
|---|---|---|---|
| Central cross-section transparency (0…100) | 73 | 35 | |
| Peripheral cross-section transparency (0…100) | 44 | 34 | 0.093 |
| Frontal transparency (0…100) | 36 | 28 | 0.241 |
| Cross-section area size (mm2) | 1.20 | 1.17 | 0.762 |
| Cross-Section Center Transparent | Cross-Section Center Opaque | p Value | |
|---|---|---|---|
| Fiber organization (Level 1…4) | 1 | 3 | 0.049 |
| Lens epithelial cell organization (Level 1…4) | 1 | 2 | 0.487 |
| Nuclei organization at bow (Level 1…4) | 1 | 2 | 0.236 |
| Nuclei presence at center (Level 1…4) | 3 | 3 | 0.688 |
| Sample | Age | Sex | Post Mortem Time (h) |
|---|---|---|---|
| 561A | 83 | F | 120 |
| 563A | 91 | F | 120 |
| 577B | 92 | F | 144 |
| 590A | 102 | F | 24 |
| 600A | 80 | M | 144 |
| 605A | 96 | F | 144 |
| 607B | 79 | M | 96 |
| 608B | 80 | F | 96 |
| 612B | 92 | F | 48 |
| 613B | 92 | F | 48 |
| 616A | 91 | F | 96 |
| 617A | 89 | M | 24 |
| 618A | 94 | F | 72 |
| 621A | 92 | F | 120 |
| 622A | 54 | M | 120 |
| 625A | 74 | M | 96 |
Publisher’s Note: MDPI stays neutral with regard to jurisdictional claims in published maps and institutional affiliations. |
© 2022 by the authors. Licensee MDPI, Basel, Switzerland. This article is an open access article distributed under the terms and conditions of the Creative Commons Attribution (CC BY) license (https://creativecommons.org/licenses/by/4.0/).
Share and Cite
D’Antin, J.C.; Tresserra, F.; Barraquer, R.I.; Michael, R. Soemmerring’s Rings Developed around IOLs, in Human Donor Eyes, Can Present Internal Transparent Areas. Int. J. Mol. Sci. 2022, 23, 13294. https://doi.org/10.3390/ijms232113294
D’Antin JC, Tresserra F, Barraquer RI, Michael R. Soemmerring’s Rings Developed around IOLs, in Human Donor Eyes, Can Present Internal Transparent Areas. International Journal of Molecular Sciences. 2022; 23(21):13294. https://doi.org/10.3390/ijms232113294
Chicago/Turabian StyleD’Antin, Justin Christopher, Francesc Tresserra, Rafael I. Barraquer, and Ralph Michael. 2022. "Soemmerring’s Rings Developed around IOLs, in Human Donor Eyes, Can Present Internal Transparent Areas" International Journal of Molecular Sciences 23, no. 21: 13294. https://doi.org/10.3390/ijms232113294
APA StyleD’Antin, J. C., Tresserra, F., Barraquer, R. I., & Michael, R. (2022). Soemmerring’s Rings Developed around IOLs, in Human Donor Eyes, Can Present Internal Transparent Areas. International Journal of Molecular Sciences, 23(21), 13294. https://doi.org/10.3390/ijms232113294