
Generation of the First Human In Vitro Model for McArdle Disease Based on iPSC Technology
 , , , , , , and
Abstract
1. Introduction
2. Results
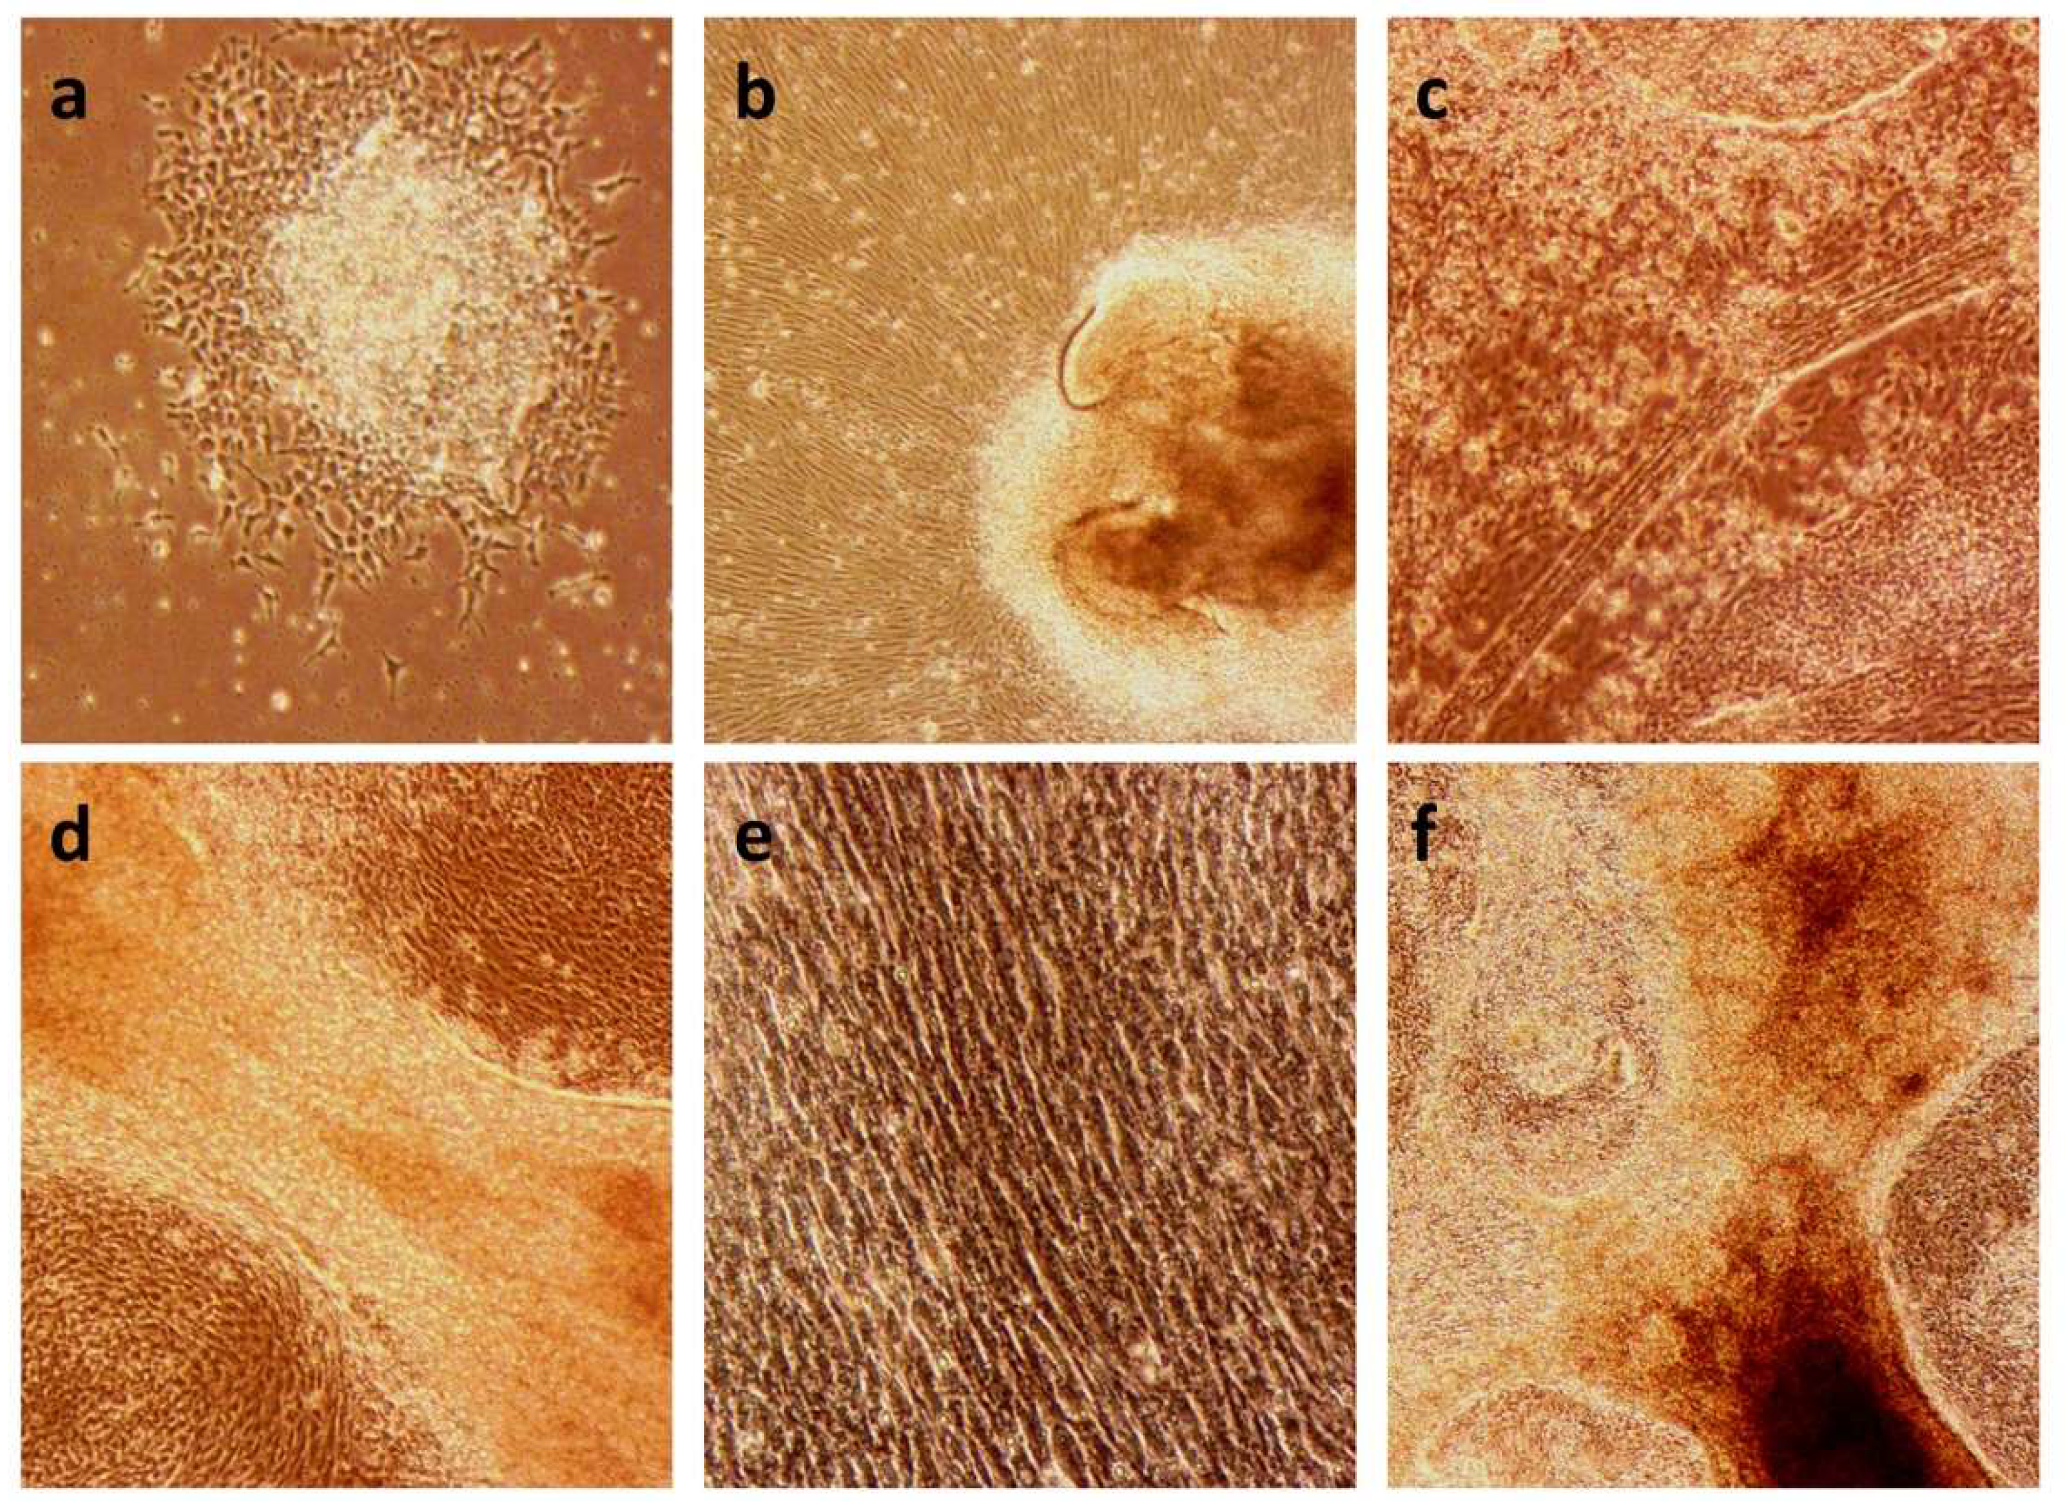
2.1. Establishment of the iPSC Lines C10 and MA4
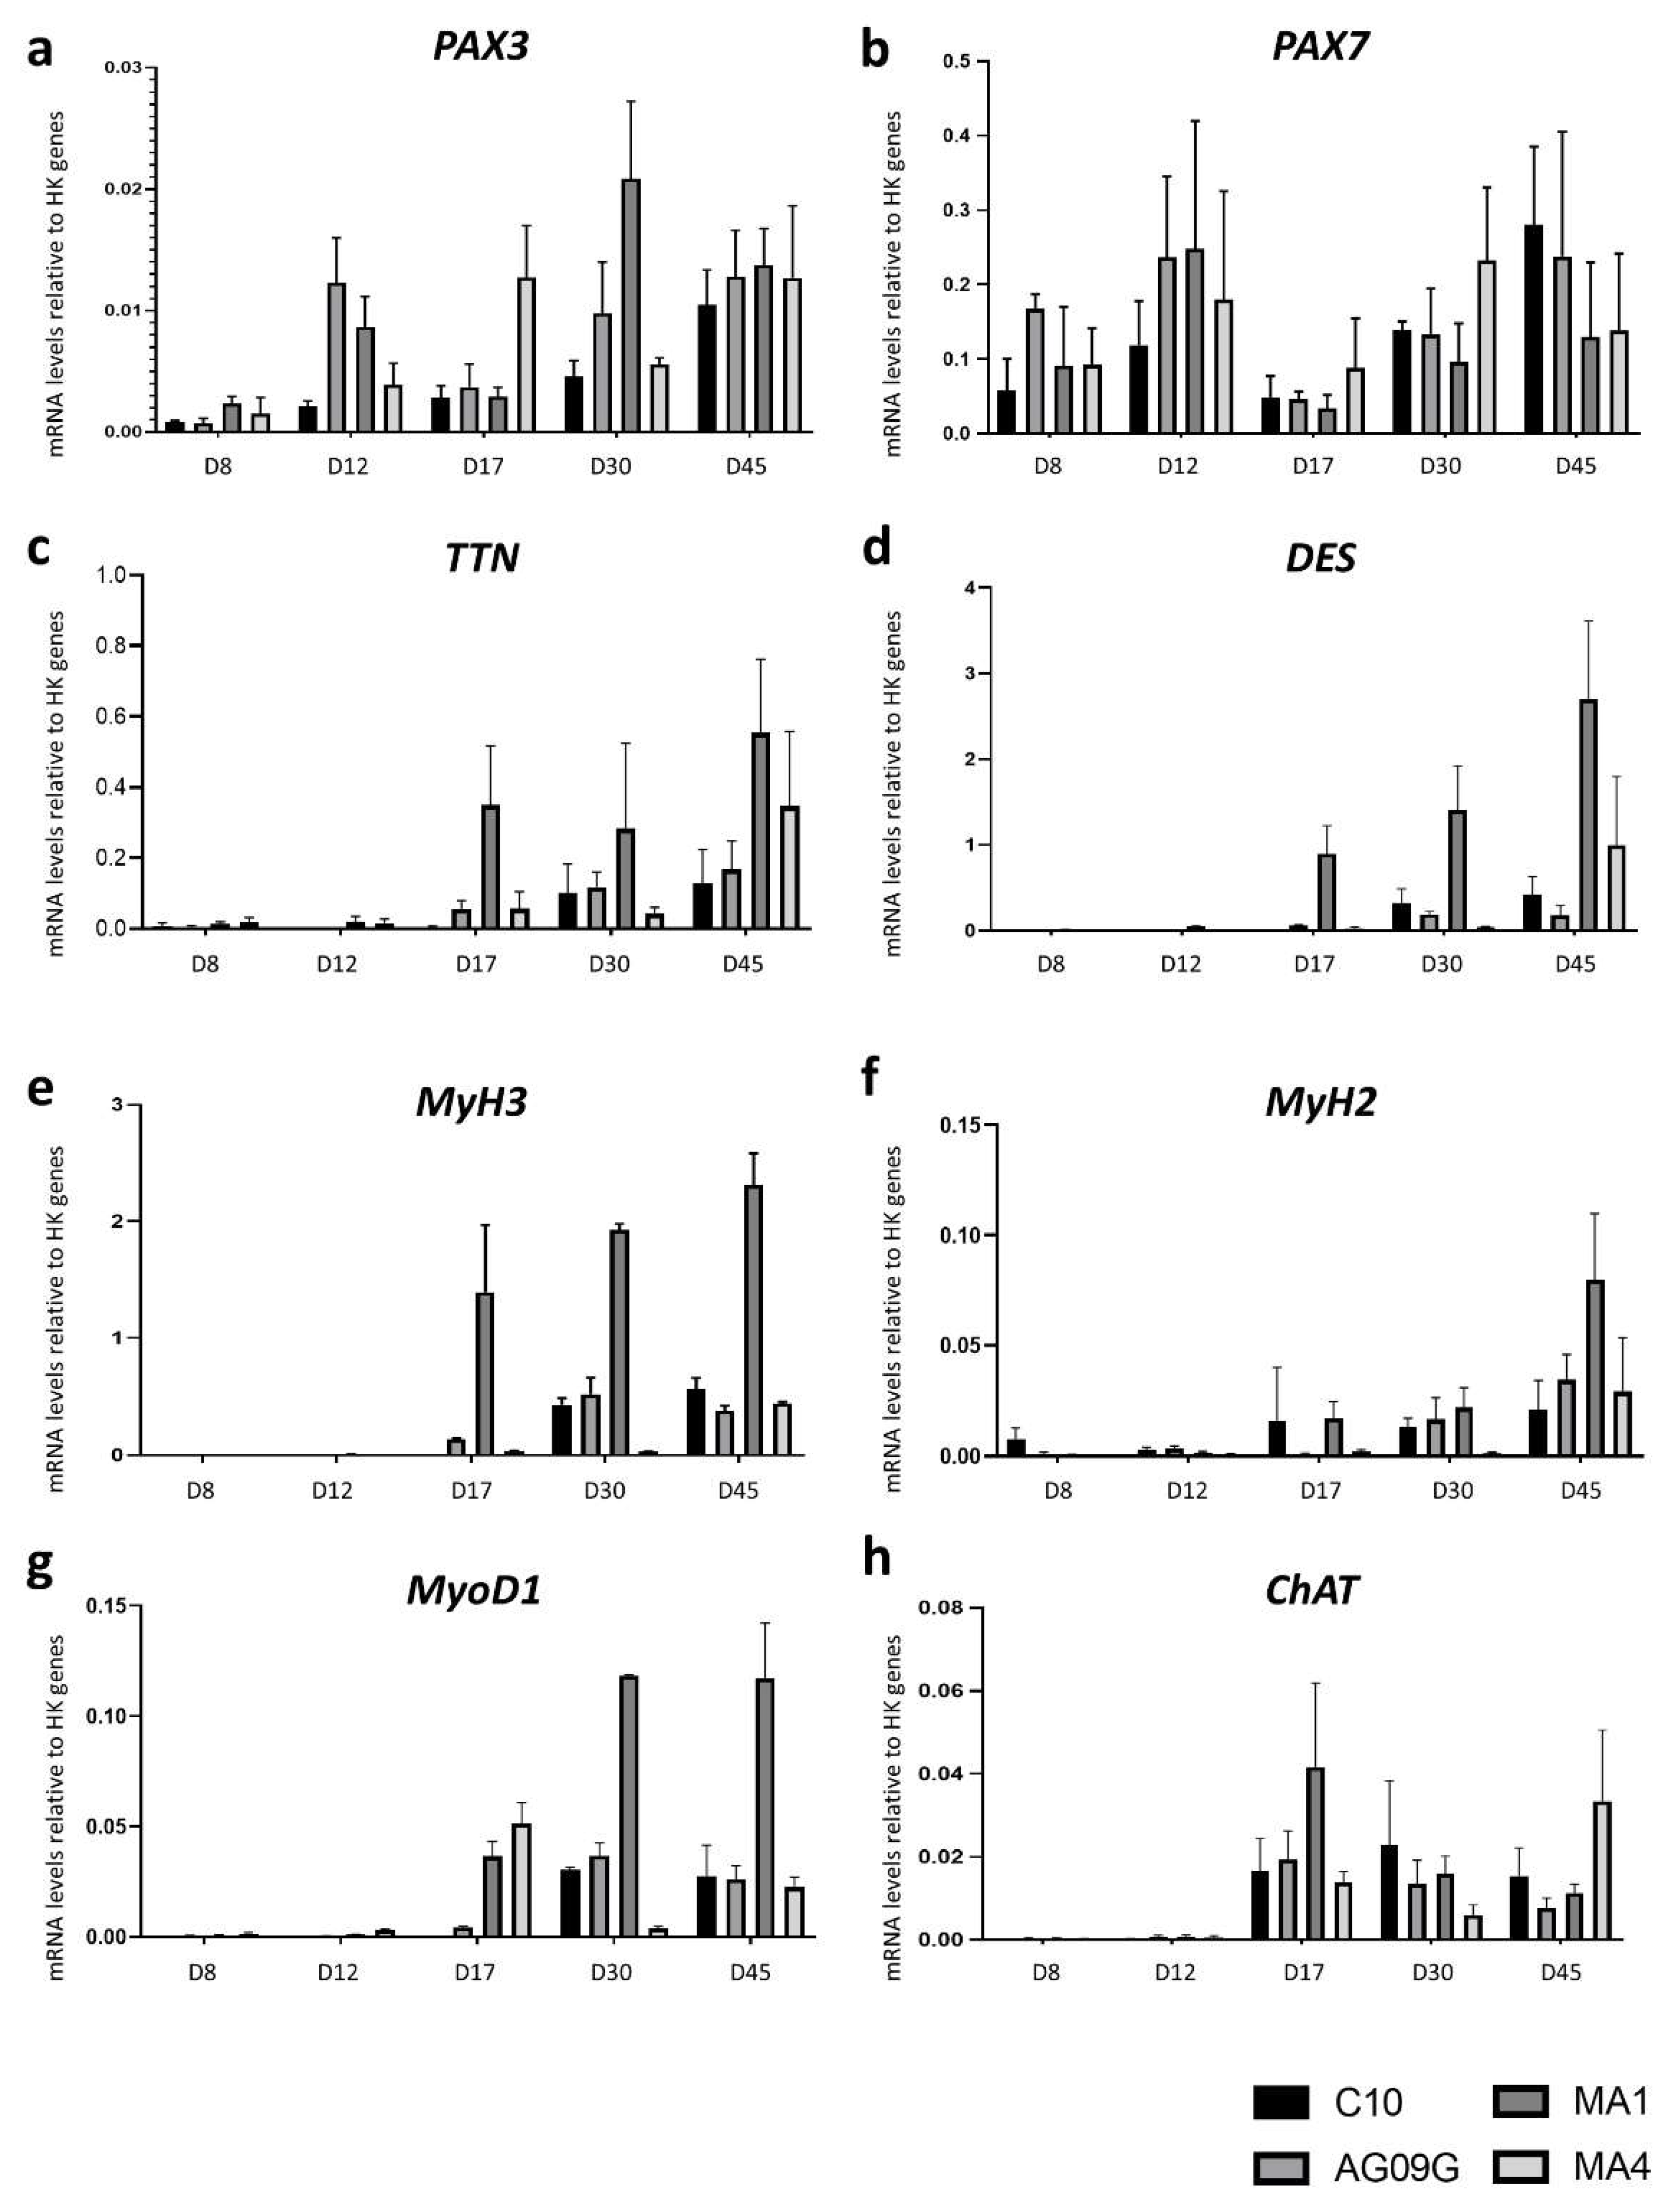
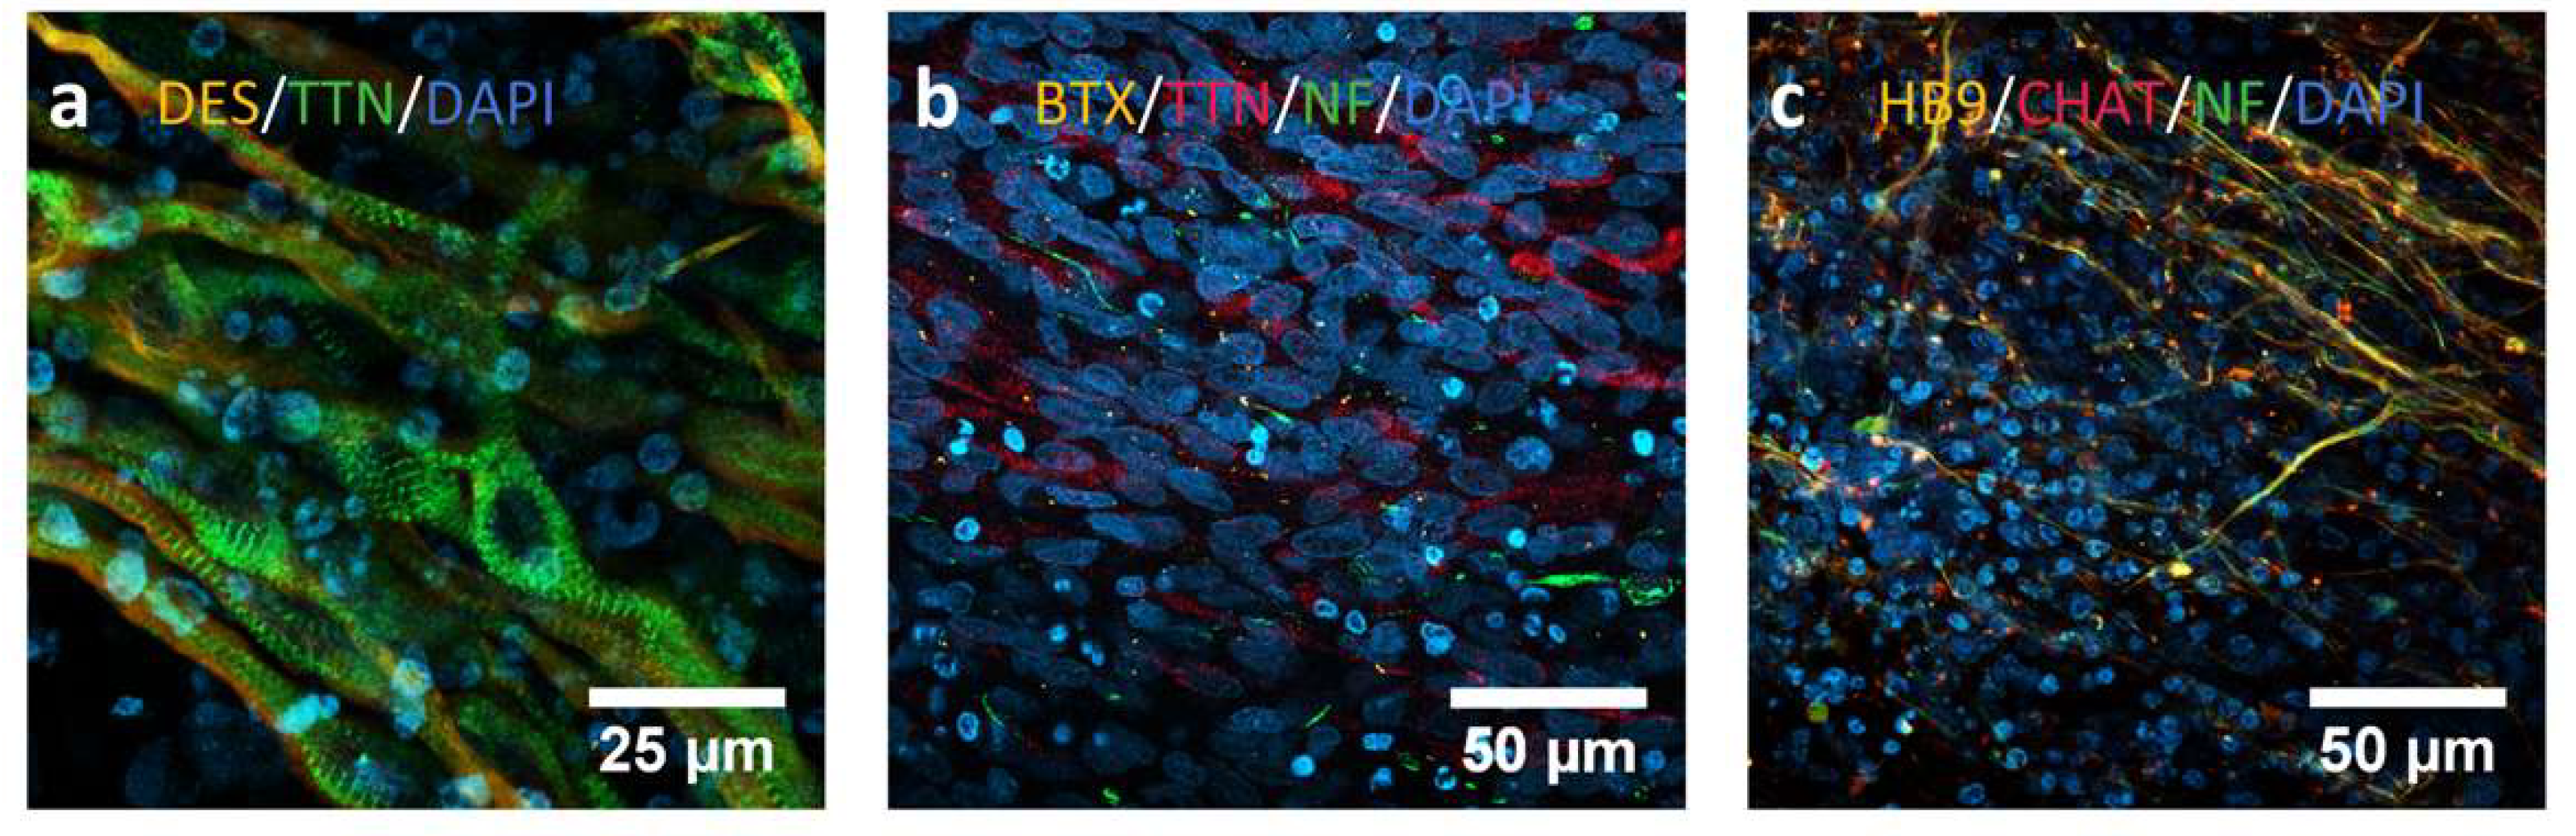
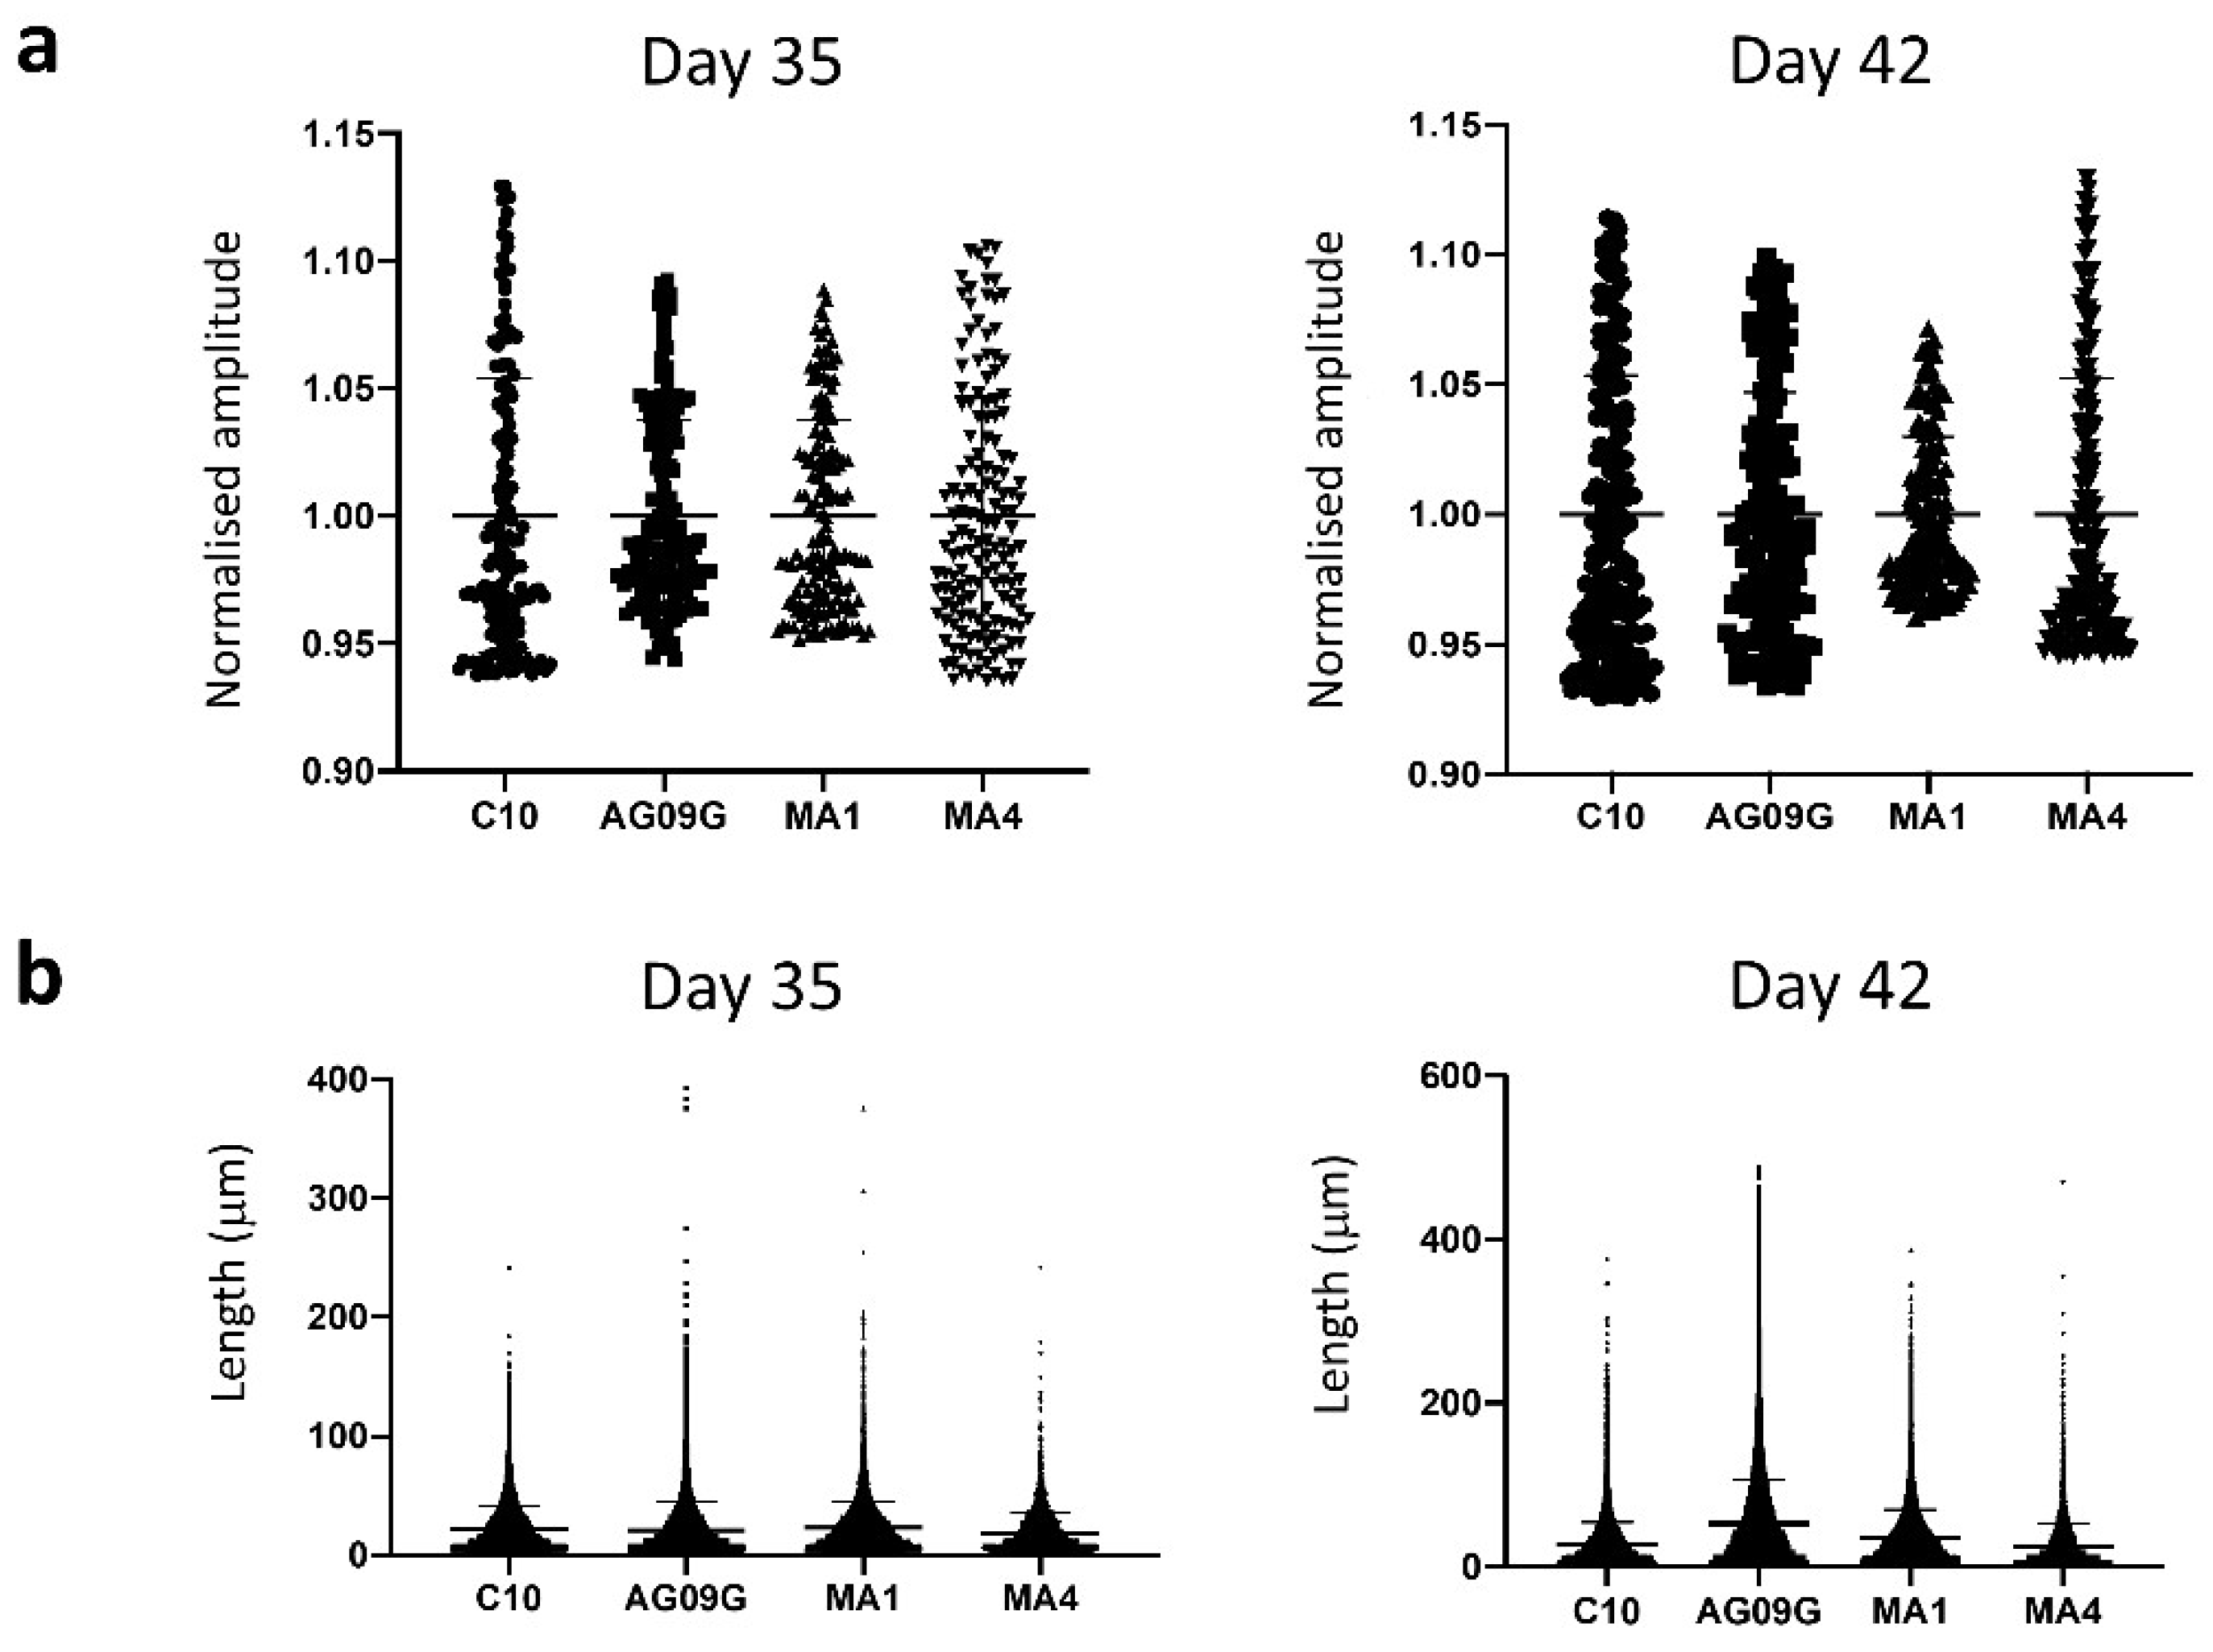
2.2. Differentiation to Innervated Skeletal Muscle Cells
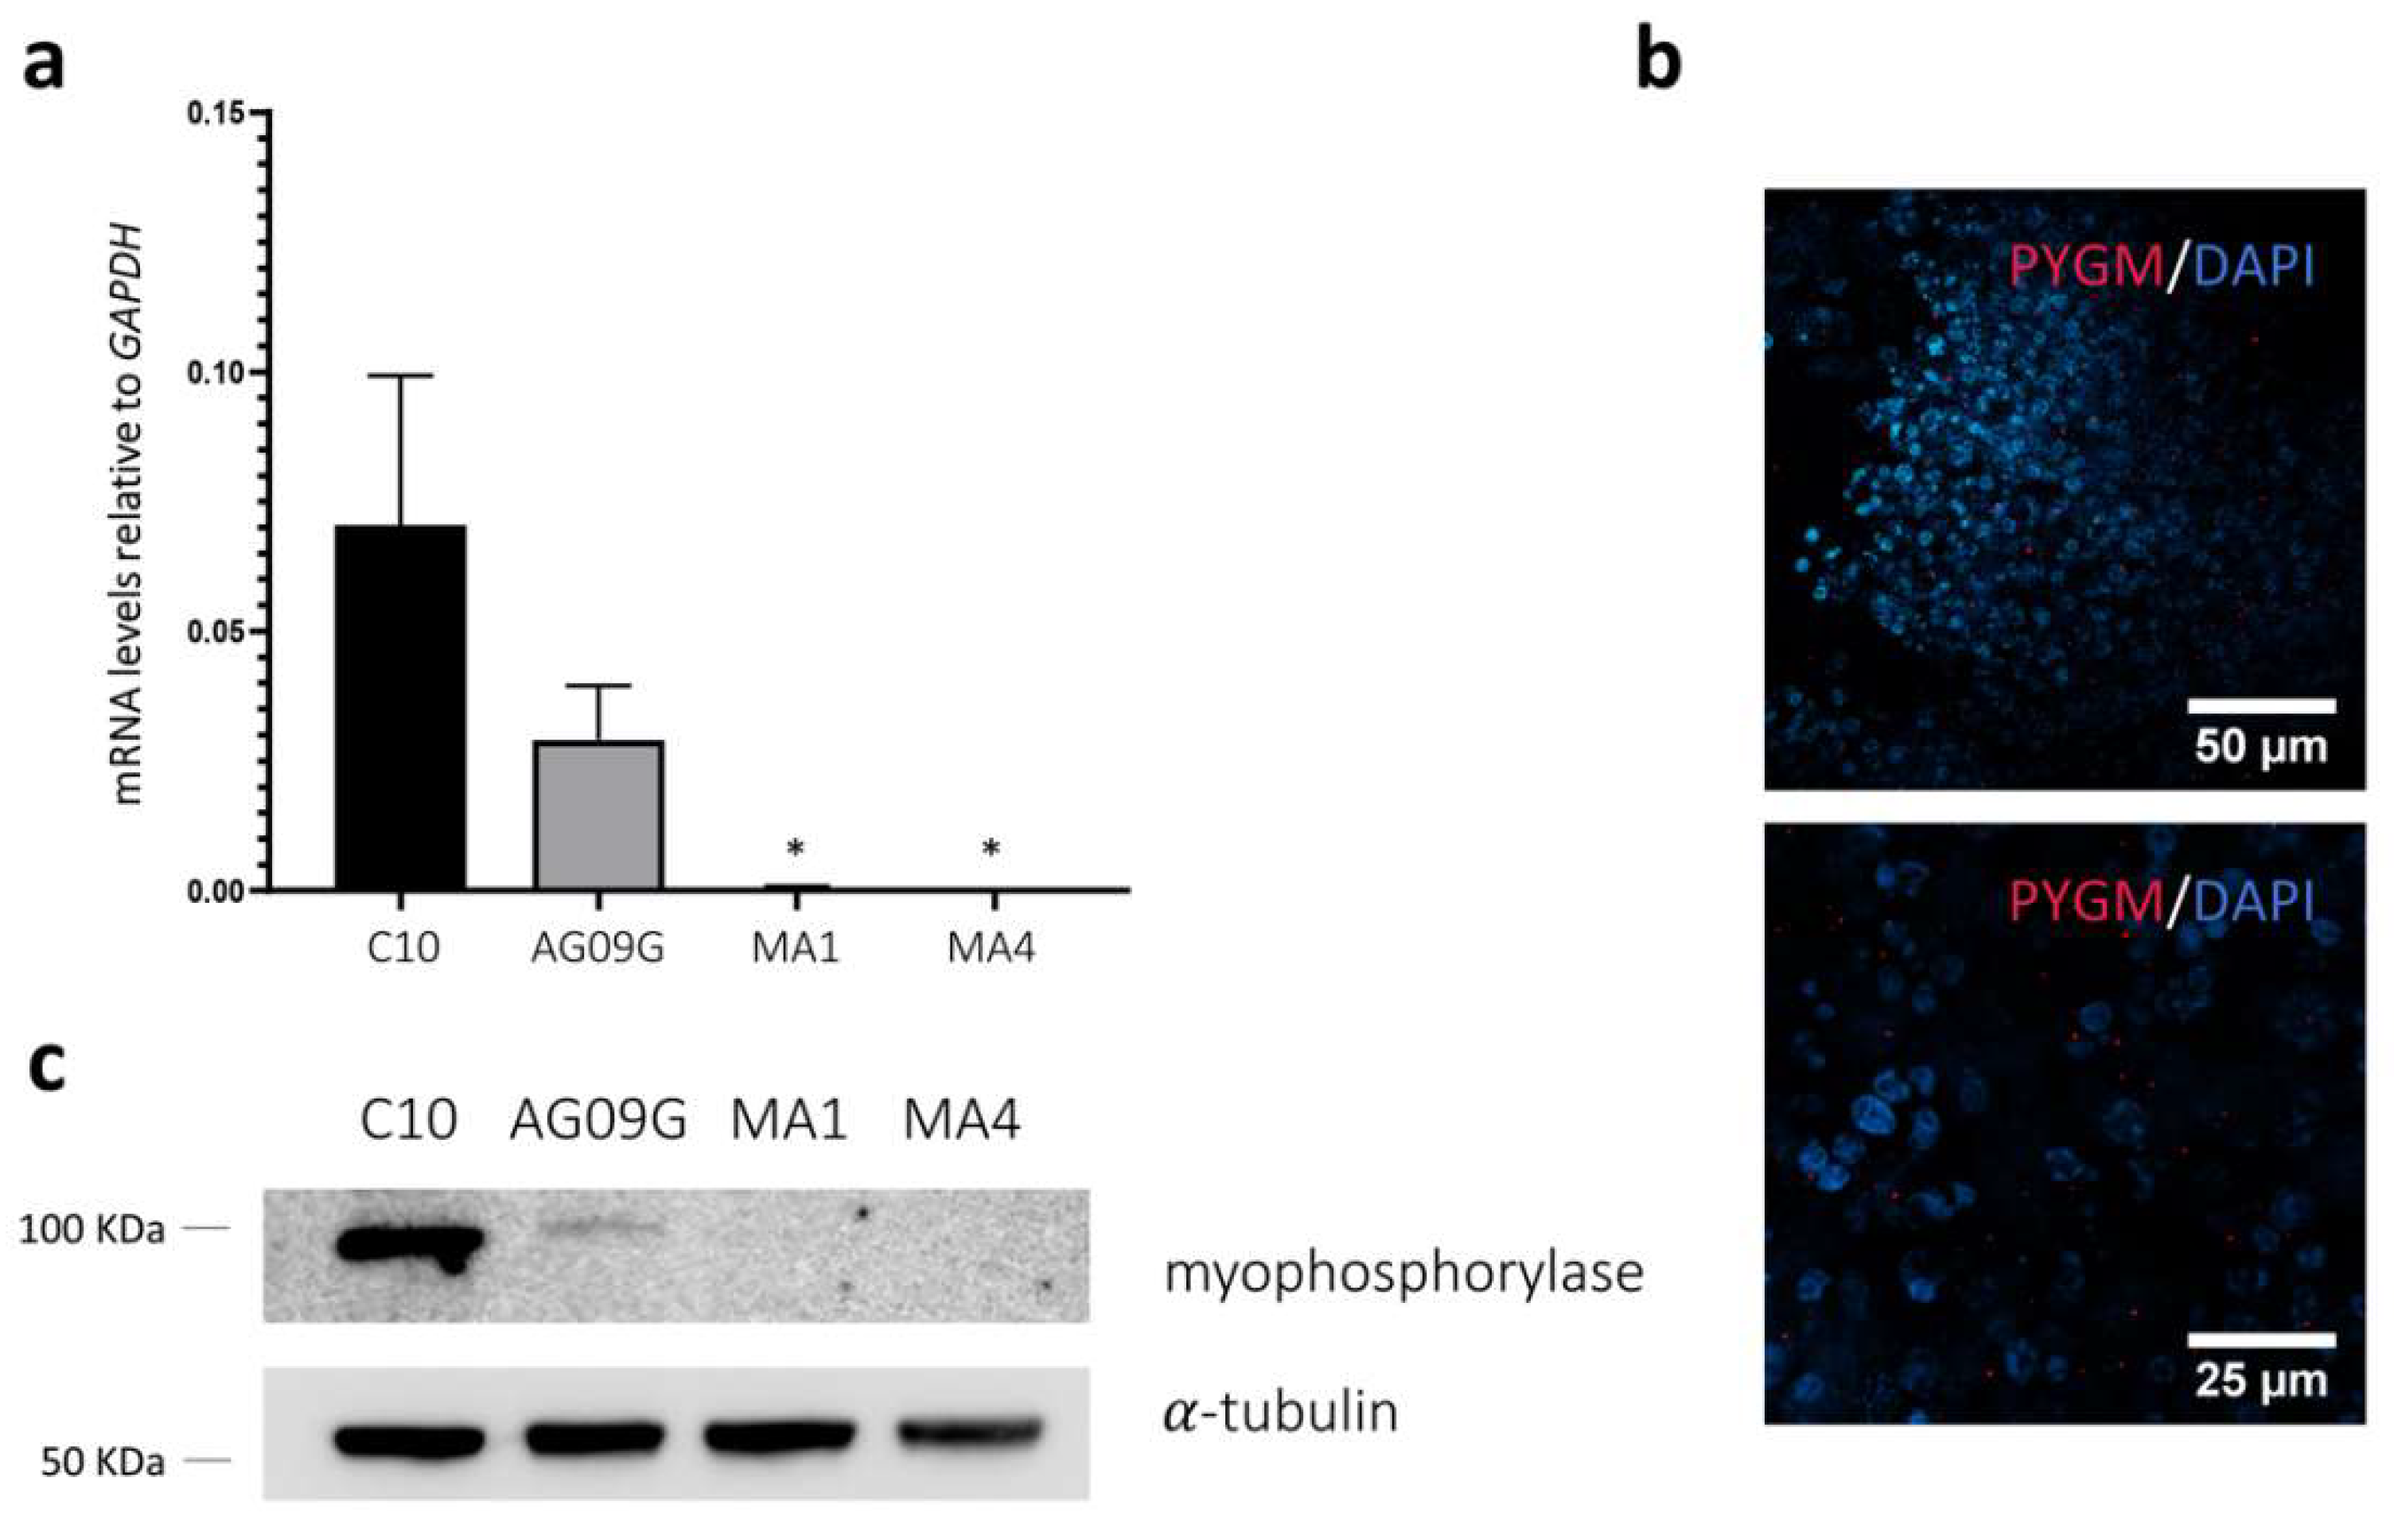
2.3. Validation of the McArdle Disease Model
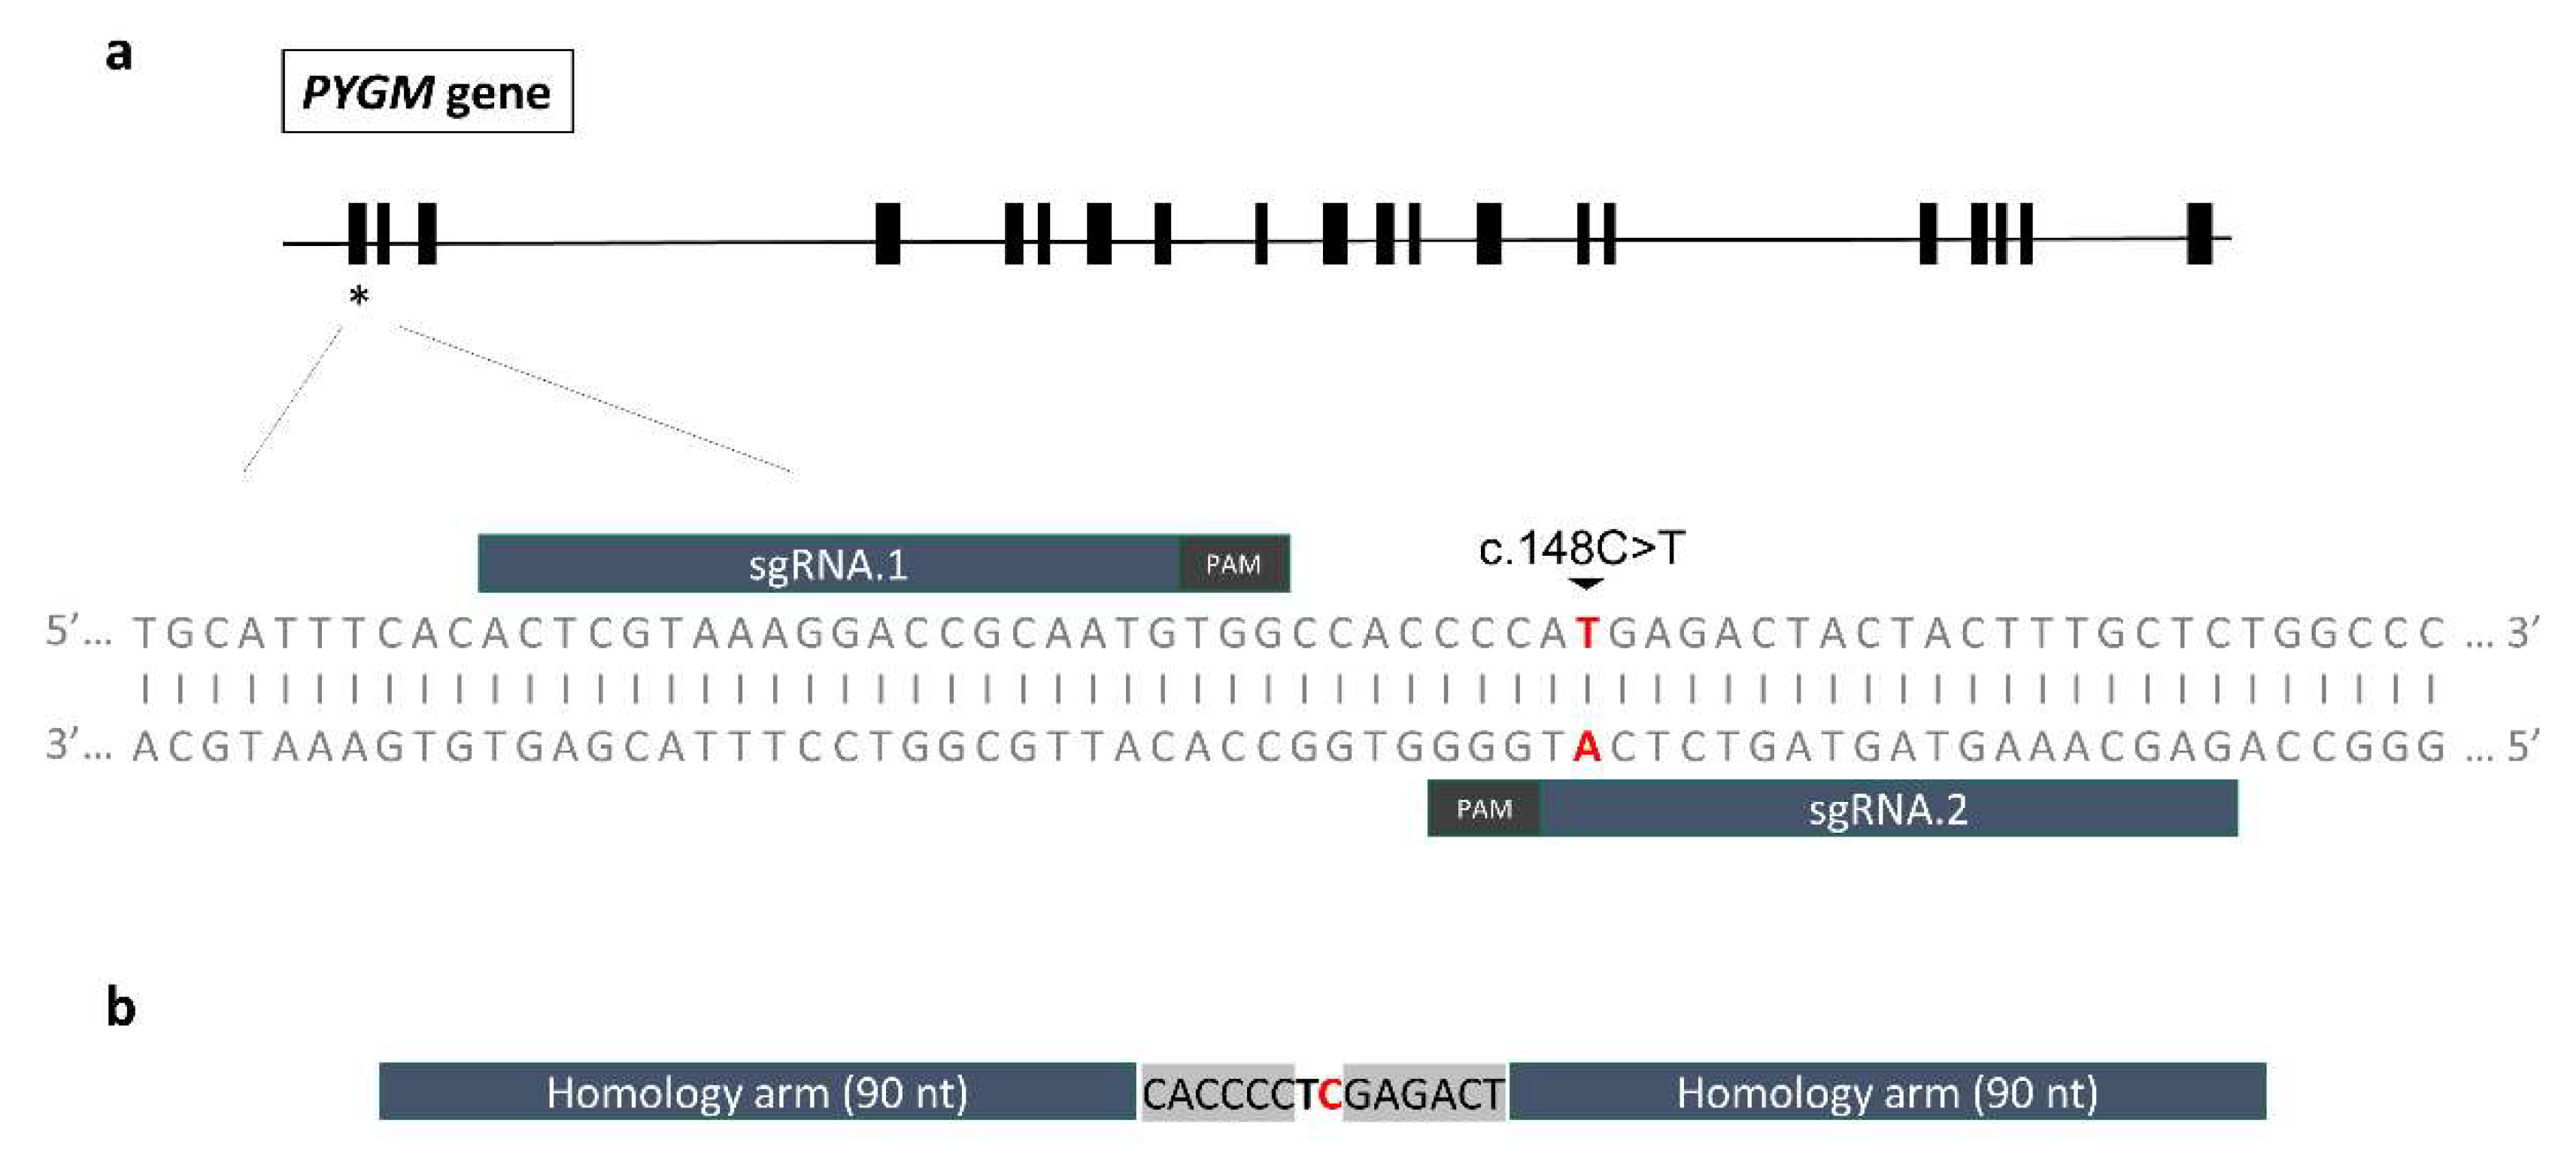
2.4. Gene Editing
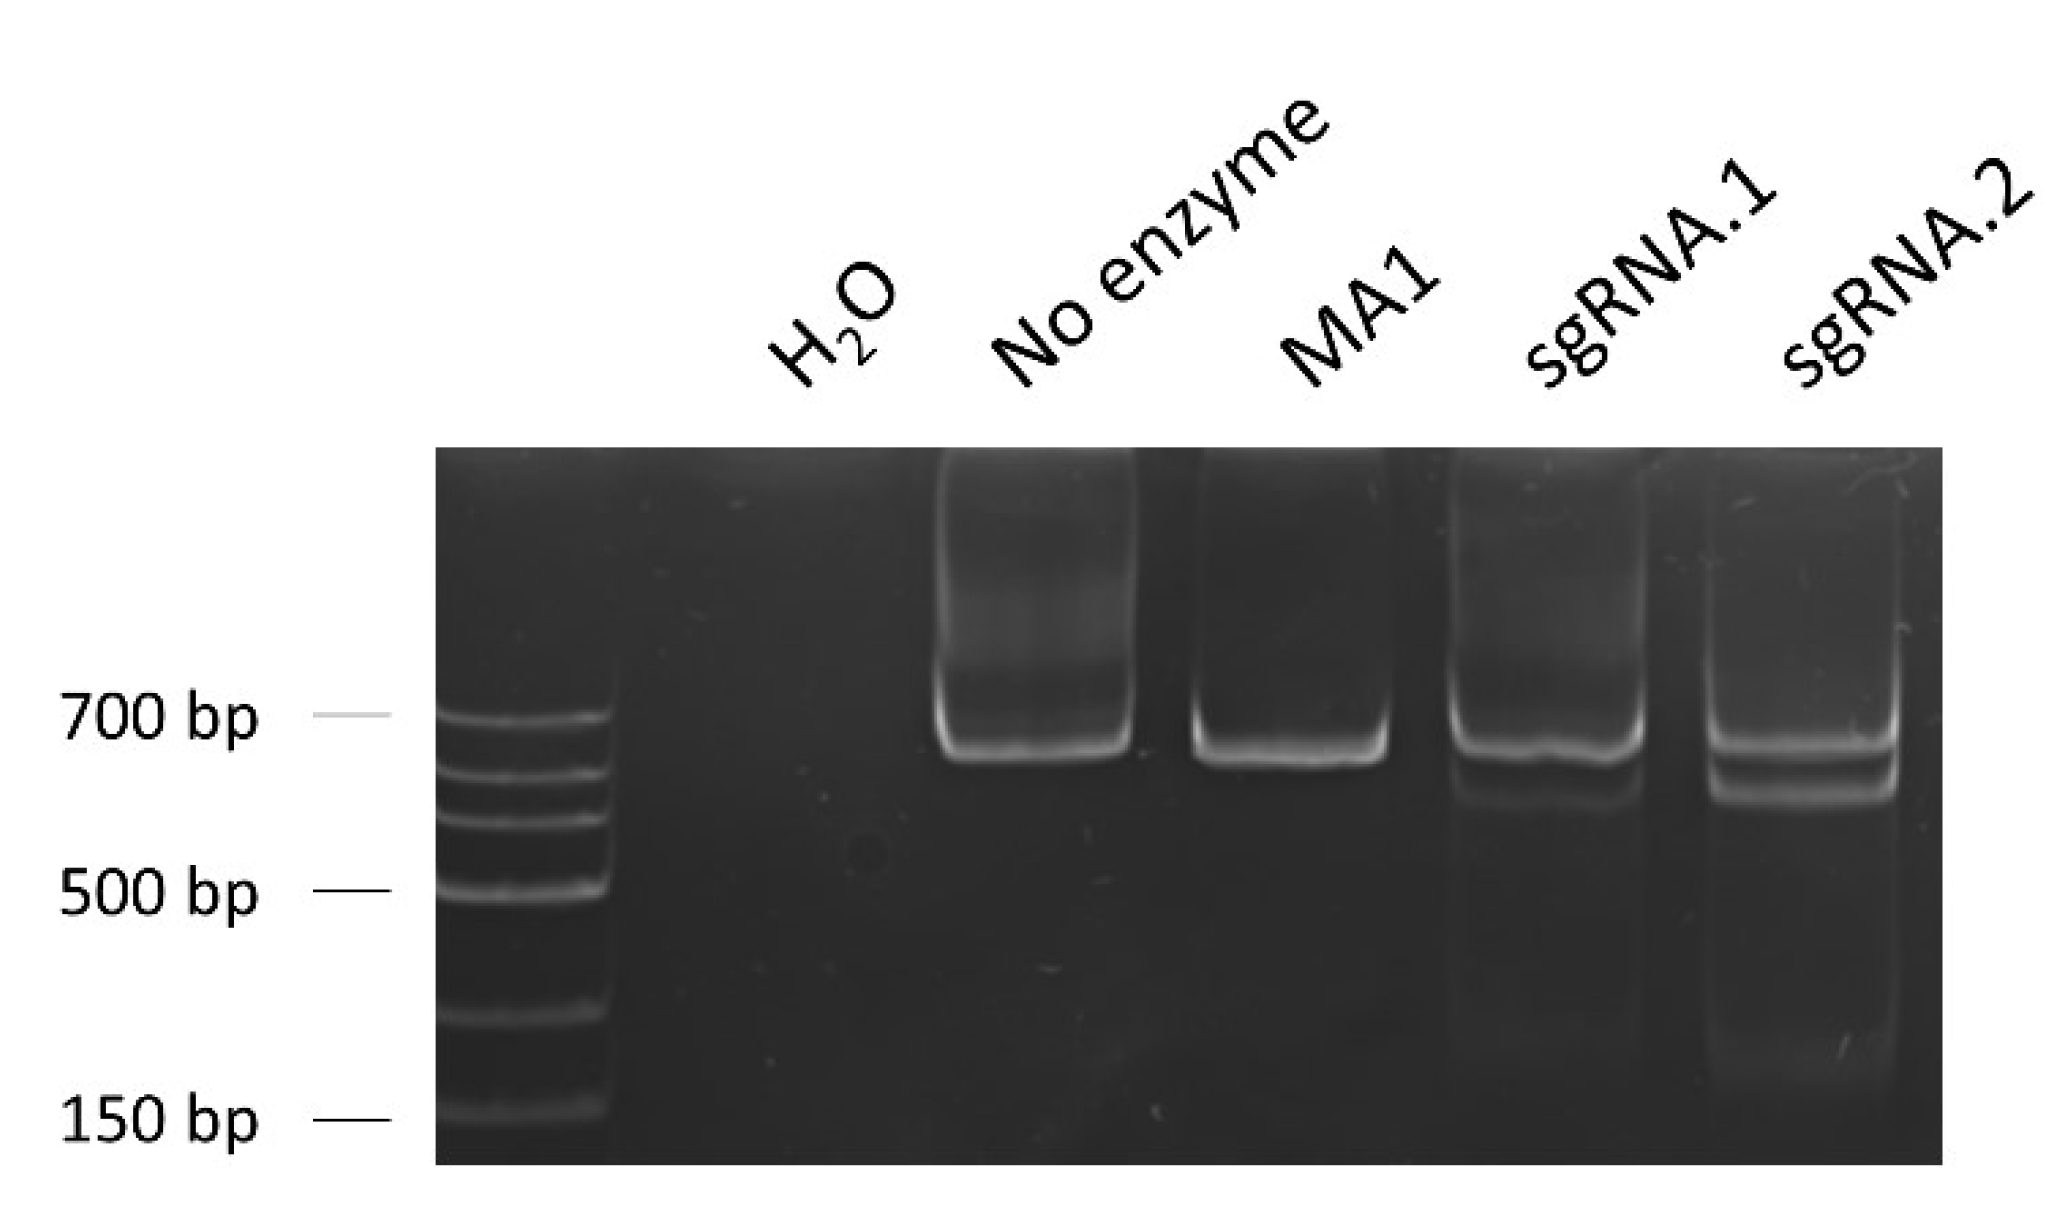
2.4.1. Design of the sgRNAs and Evaluation of their On-Target Efficiency
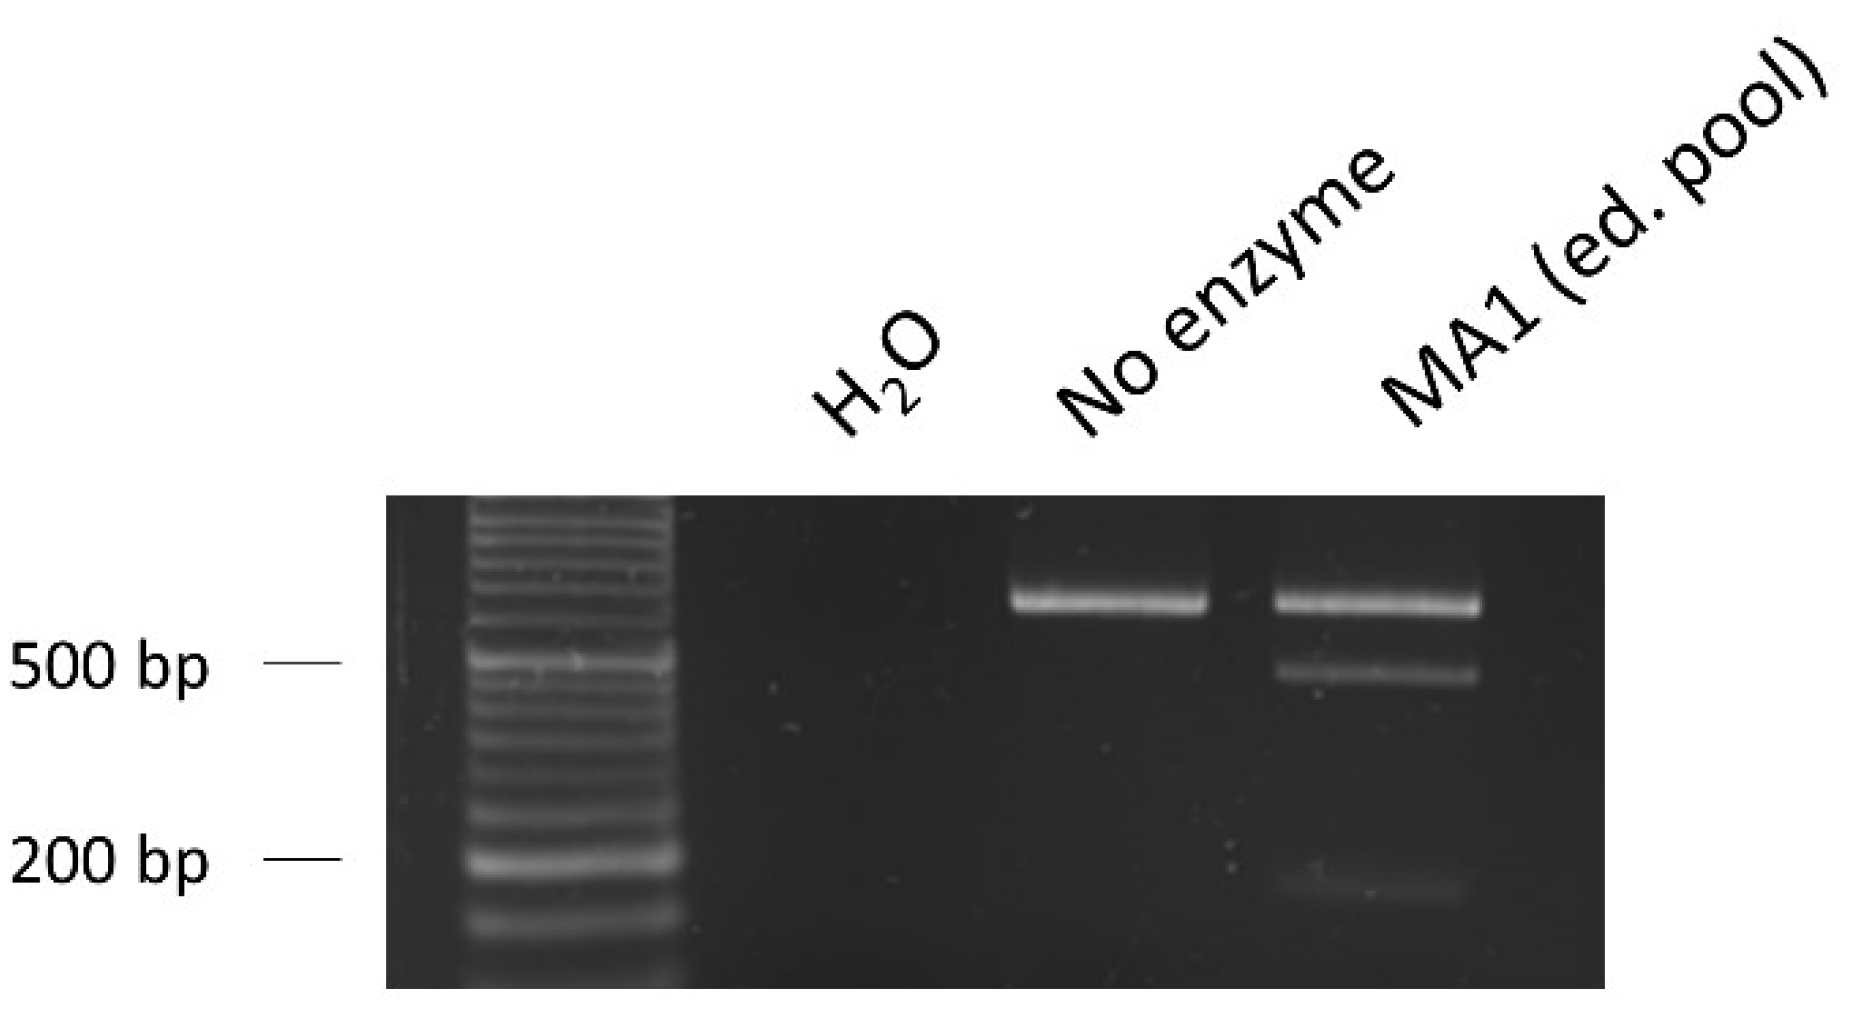
2.4.2. Design of the ssODN Repair Template and Evaluation of the Edition Efficiency
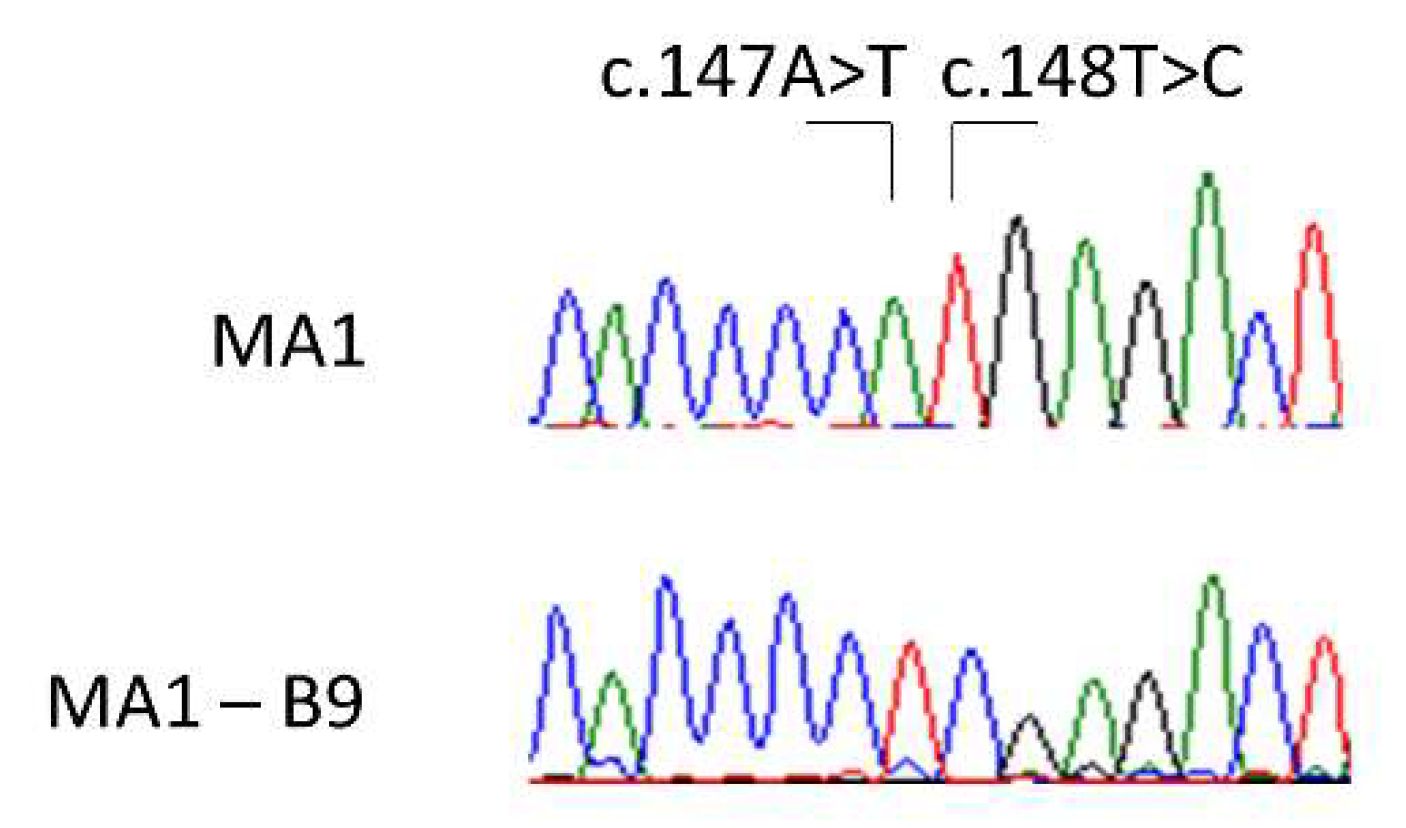
2.4.3. Subcloning and Verification of the Gene Edition
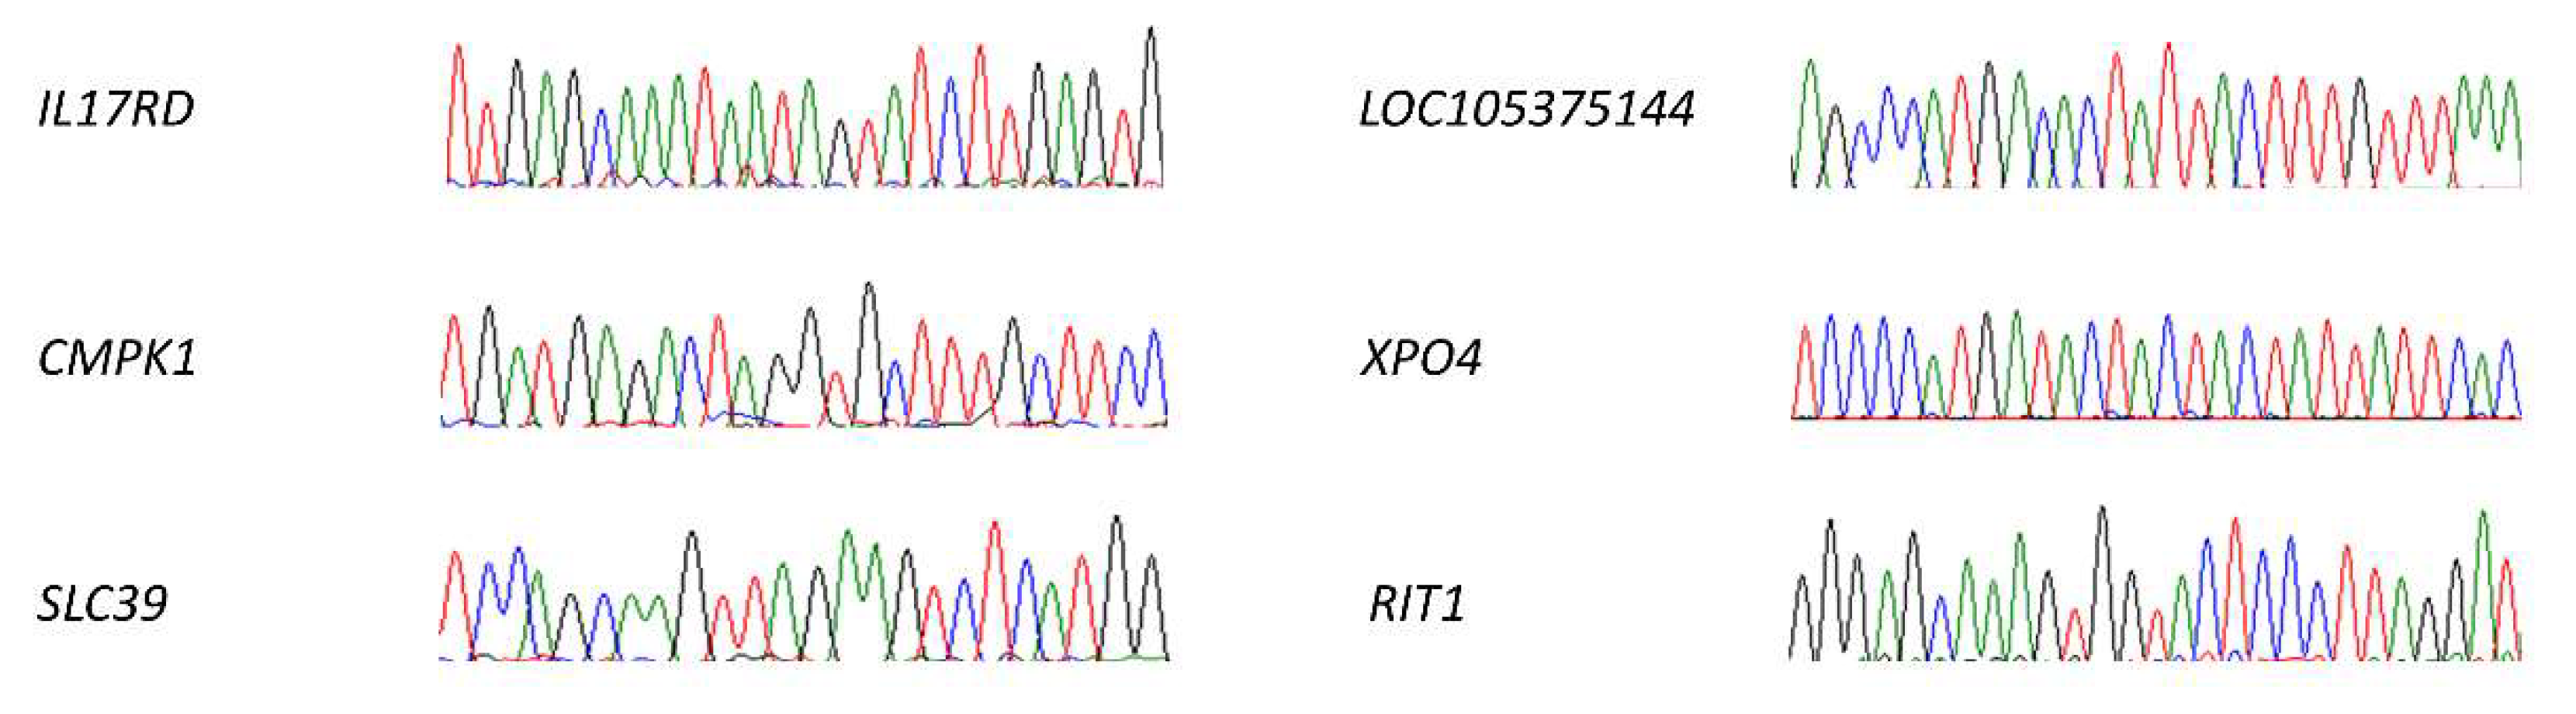
2.4.4. Off-Targets Analysis
2.4.5. Pluripotency and Integrity Assessment
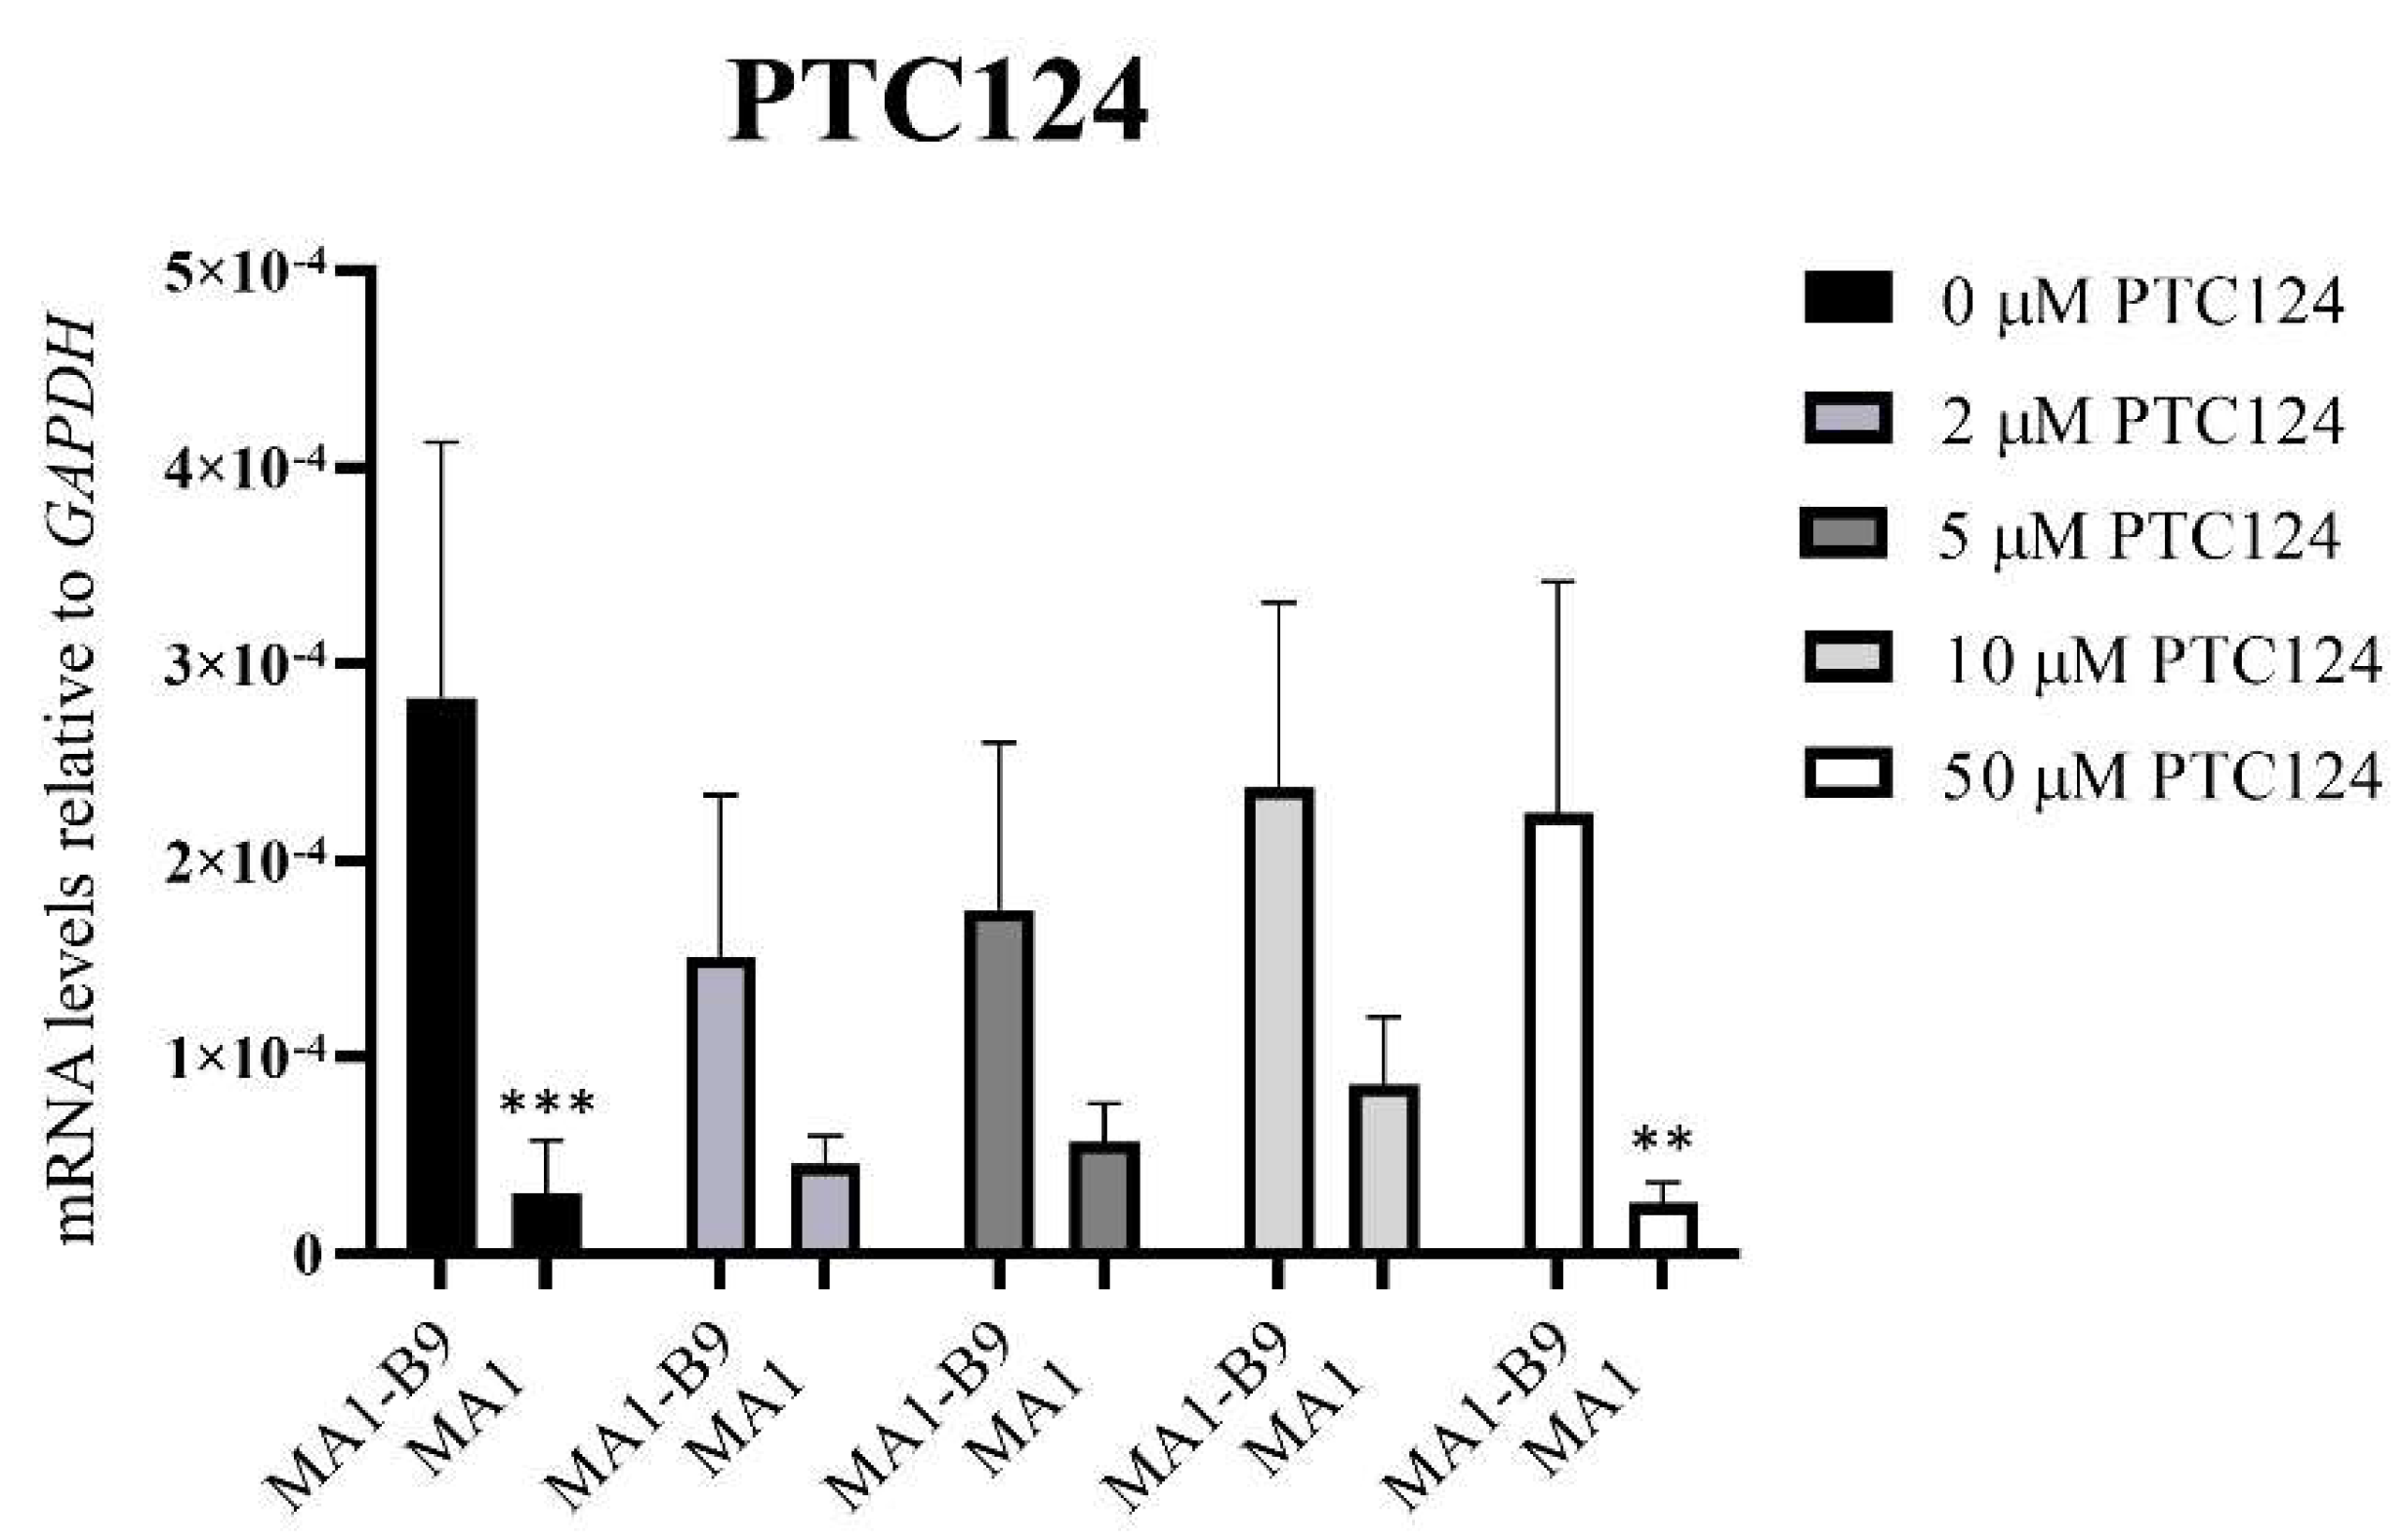
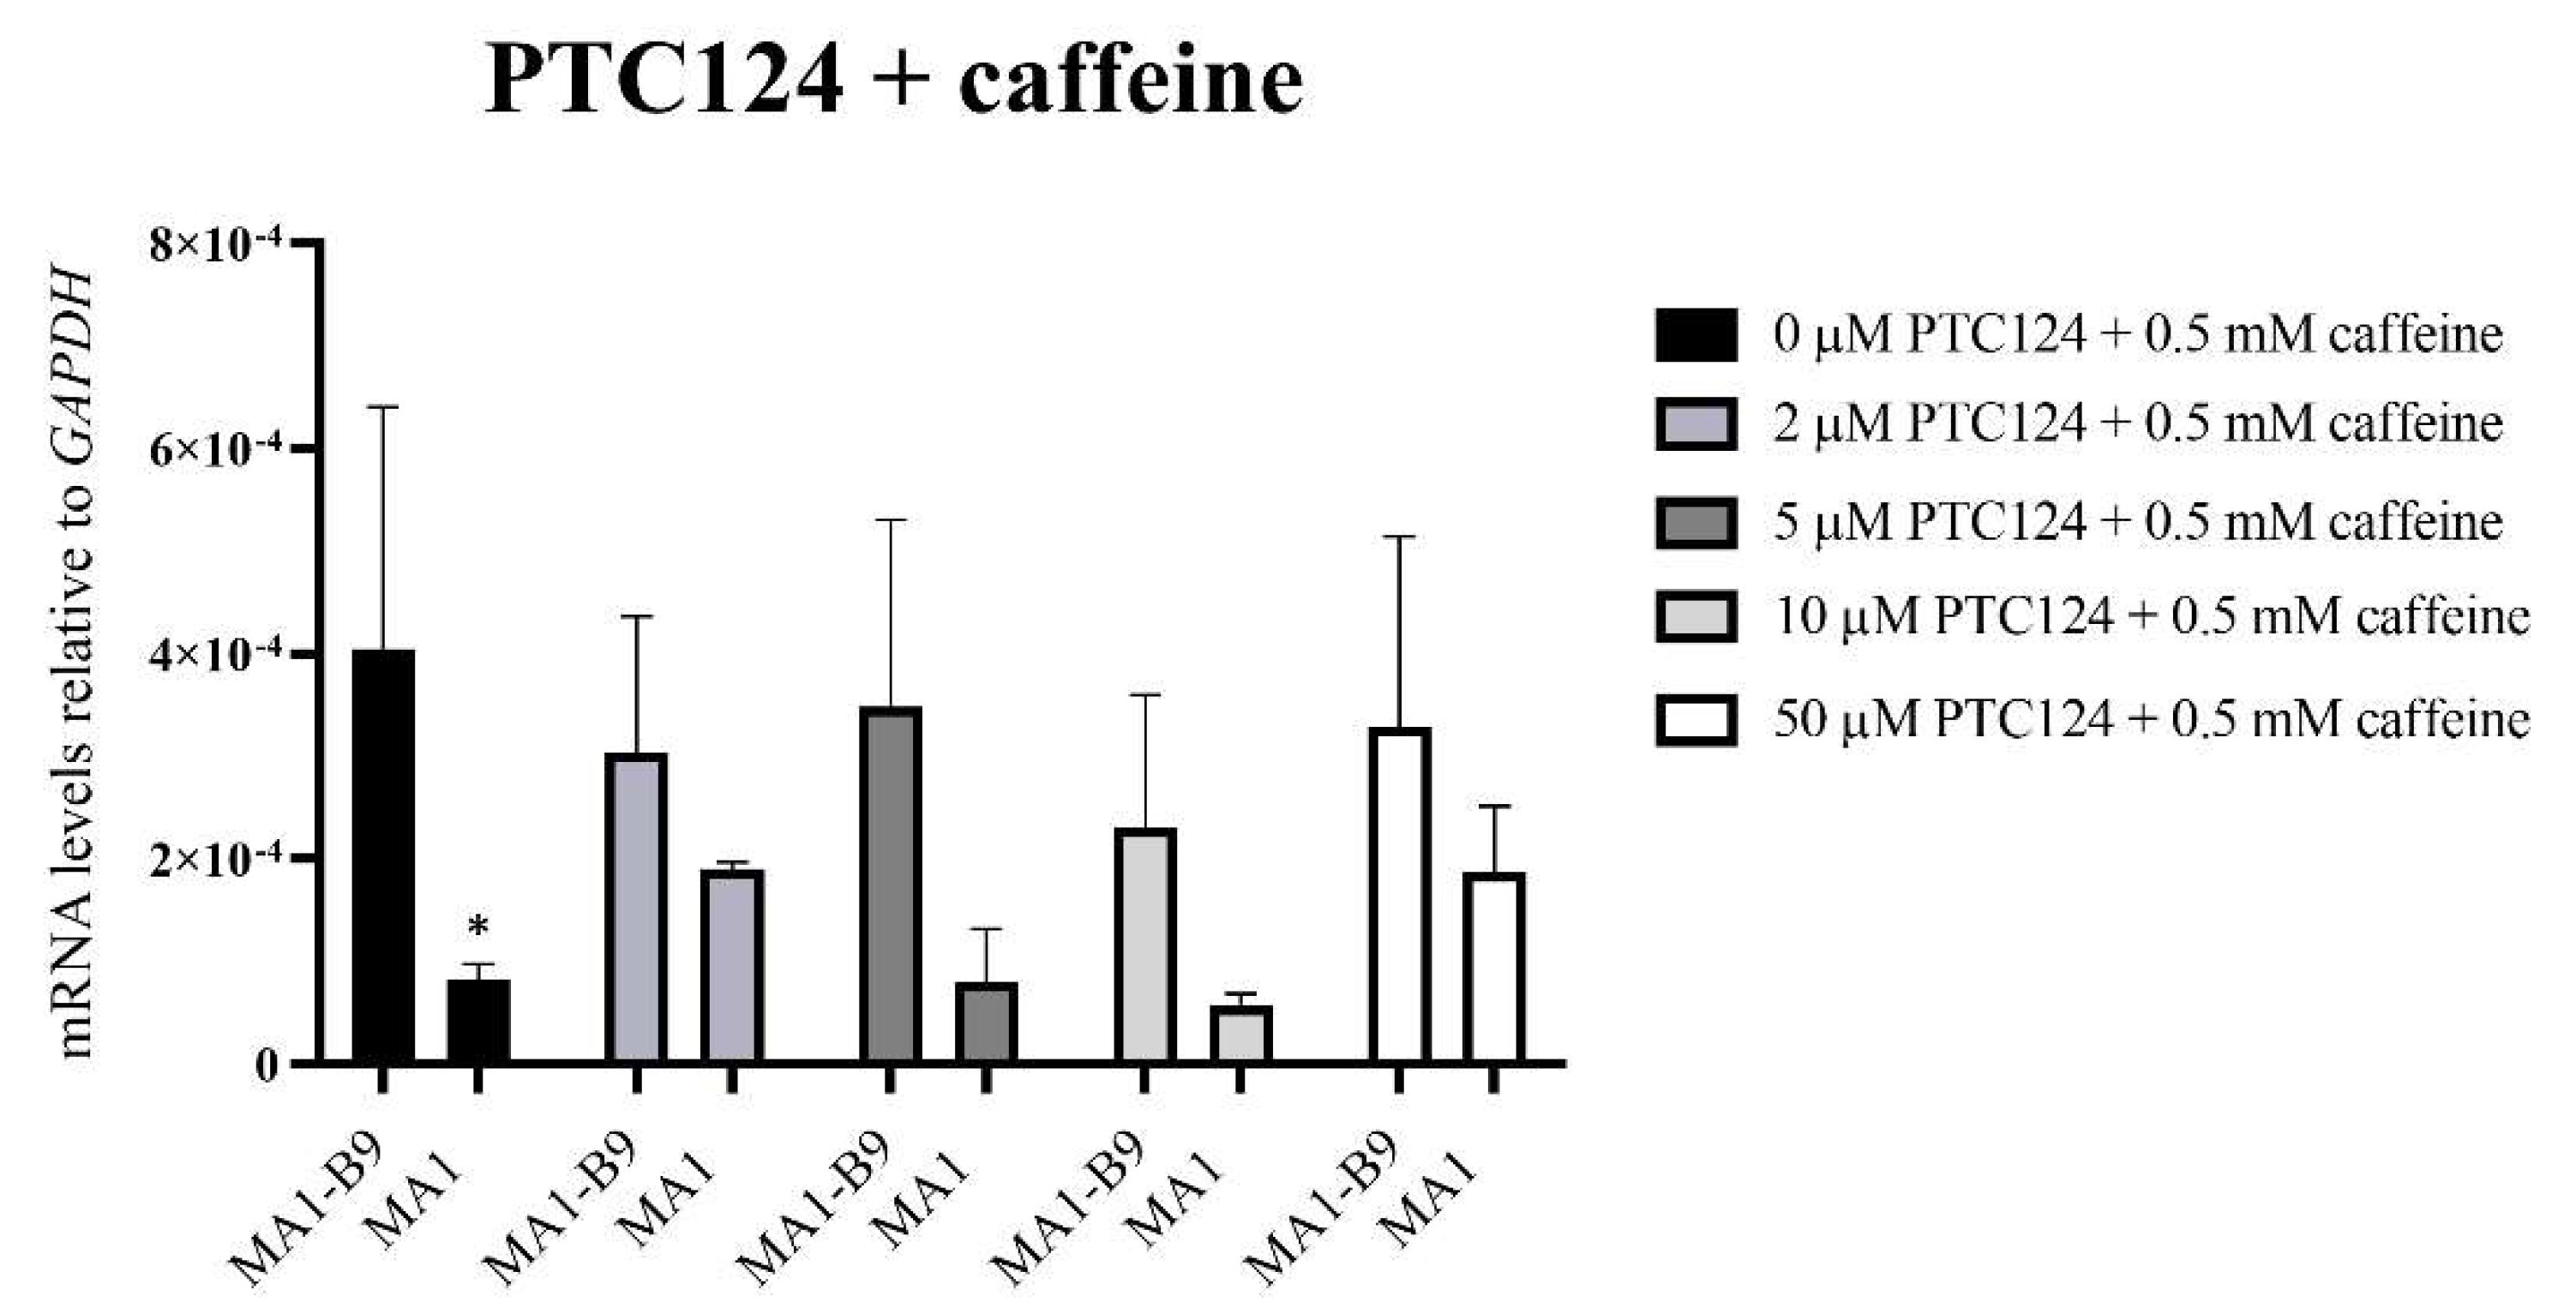
2.5. Pilot Study to Evaluate Two Read-Through Compounds in the iPSC-Based McArdle Disease Model
3. Discussion
4. Materials and Methods
4.1. Establishment of the iPSC Lines C10 and MA4: Cell Reprogramming
4.2. Pluripotency and Integrity Assessment of the iPSC Lines
4.2.1. Alkaline Phosphatase Staining
4.2.2. Immunocytochemistry for Pluripotency Assessment
4.2.3. RT-qPCR for Pluripotency Assessment
4.2.4. In Vitro Differentiation
4.2.5. Elimination of the Sendai Virus
4.2.6. Karyotype Analysis
4.2.7. Mycoplasma Detection
4.2.8. STR Analysis
4.3. iPSC Culture
4.4. Differentiation to Innervated Skeletal Muscle Cells
4.4.1. Immunocytochemistry for Differentiation Assessment
4.4.2. RT-qPCR for Differentiation Assessment
4.4.3. Calcium Transients and Contraction Capacity Analyses
4.5. Validation of the Skeletal Muscle iPSC-Based Model for the Study of McArdle Disease
4.5.1. RT-qPCR
4.5.2. Western Blot
4.5.3. Immunocytochemistry
4.6. Gene Editing with CRISPR/Cas9
4.6.1. Design of the sgRNAs
4.6.2. Design of the ssODN
4.6.3. Gene Editing
4.6.4. Evaluation of the On-Target Efficiency: T7E1 Assay
4.6.5. Evaluation of the Edition Efficiency: RFLP
4.6.6. Subcloning
4.6.7. Freezing and Analysis of the Clones
4.6.8. Off-Targets Analysis
4.6.9. Pluripotency and Integrity Assessment
4.7. Pilot Study to Evaluate Two Read-Through Compounds in the Isogenic McArdle Disease Model
- PTC124 (Merck, Darmstadt, Germany; #5309180001). Treatment at 2, 5, 10 and 50 μM.
- RTC13 (Merck, Darmstadt, Germany; #SML1725). Treatment at 2, 5, 10 and 50 μM.
5. Conclusions
Supplementary Materials
Author Contributions
Funding
Institutional Review Board Statement
Informed Consent Statement
Data Availability Statement
Acknowledgments
Conflicts of Interest
References
- Santalla, A.; Nogales-Gadea, G.; Ørtenblad, N.; Brull, A.; de Luna, N.; Pinós, T.; Lucía, A. McArdle disease: A unique study model in sports medicine. Sports Med. 2014, 44, 1531–1544. [Google Scholar] [CrossRef] [PubMed]
- Migocka-Patrzałek, M.; Elias, M. Muscle glycogen phosphorylase and its functional partners in health and disease. Cells 2021, 10, 883. [Google Scholar] [CrossRef] [PubMed]
- Taylor, R.L.; Davis, M.; Turner, E.; Brull, A.; Pinos, T.; Cabrera, M.; Nowak, K.J. Clinical utility gene card for McArdle disease. Eur. J. Hum. Genet. 2018, 26, 758–764. [Google Scholar] [CrossRef]
- Nogales-Gadea, G.; Godfrey, R.; Santalla, A.; Coll-Cantí, J.; Pintos-Morell, G.; Pinós, T.; Arenas, J.; Martín, M.A.; Lucia, A. Genes and exercise intolerance: Insights from McArdle disease. Physiol. Genom. 2016, 48, 93–100. [Google Scholar] [CrossRef]
- Quinlivan, R.; Buckley, J.; James, M.; Twist, A.; Ball, S.; Duno, M.; Vissing, J.; Bruno, C.; Cassandrini, D.; Roberts, M.; et al. McArdle disease: A clinical review. J. Neurol. Neurosurg. Psychiatry 2010, 81, 1182–1188. [Google Scholar] [CrossRef] [PubMed]
- Lucía, A.; Nogales-Gadea, G.; Pérez, M.; Martín, M.A.; Andreu, A.L.; Arenas, J. McArdle disease: What do neurologists need to know? Nat. Clin. Pract. Neurol. 2008, 4, 568–577. [Google Scholar] [CrossRef] [PubMed]
- Quinlivan, R.; Martinuzzi, A.; Schoser, B. Pharmacological and nutritional treatment for McArdle disease (Glycogen Storage Disease type V). Cochrane Database Syst. Rev. 2014, 2014, CD003458. [Google Scholar] [CrossRef]
- de Luna, N.; Brull, A.; Guiu, J.M.; Lucia, A.; Martin, M.A.; Arenas, J.; Martí, R.; Andreu, A.L.; Pinós, T. Sodium valproate increases glycogen phosphorylase brain isoform: Looking for a compensation mechanism in McArdle disease. Dis. Model. Mech. 2015, 8, 467–472. [Google Scholar] [CrossRef]
- Lucía, A.; Quinlivan, R.; Wakelin, A.; Martín, M.A.; Andreu, A.L. The ‘McArdle paradox’: Exercise is a good advice for the exercise intolerant. Br. J. Sports Med. 2013, 47, 728–729. [Google Scholar] [CrossRef]
- Angelos, S.; Valberg, S.J.; Smith, B.P.; McQuarrie, P.S.; Shanske, S.; Tsujino, S.; DiMauro, S.; Cardinet, G.H. Myophosphorylase deficiency associated with rhabdomyolysis and exercise intolerance in 6 related charolais cattle. Muscle Nerve 1995, 18, 736–740. [Google Scholar] [CrossRef]
- Tan, P.; Allen, J.G.; Wilton, S.D.; Akkari, P.A.; Huxtable, C.R.; Laing, N.G. A splice-site mutation causing ovine McArdle’s disease. Neuromuscul. Disord. 1997, 7, 336–342. [Google Scholar] [CrossRef]
- Nogales-Gadea, G.; Pinós, T.; Lucia, A.; Arenas, J.; Camara, Y.; Brull, A.; de Luna, N.; Martín, M.A.; Garcia-Arumí, E.; Martí, R.; et al. Knock-in mice for the R50X mutation in the PYGM gene present with McArdle disease. Brain 2012, 135, 2048–2057. [Google Scholar] [CrossRef] [PubMed]
- Migocka-Patrzałek, M.; Lewicka, A.; Elias, M.; Daczewska, M. The effect of muscle glycogen phosphorylase (Pygm) knockdown on zebrafish morphology. Int. J. Biochem. Cell Biol. 2020, 118, 105658. [Google Scholar] [CrossRef] [PubMed]
- Van Norman, G.A. Limitations of animal studies for predicting toxicity in clinical trials: Is it time to rethink our current approach? JACC Basic Transl. Sci. 2019, 4, 845–854. [Google Scholar] [CrossRef]
- Takahashi, K.; Yamanaka, S. Induction of pluripotent stem cells from mouse embryonic and adult fibroblast cultures by defined factors. Cell 2006, 126, 663–676. [Google Scholar] [CrossRef] [PubMed]
- Takahashi, K.; Tanabe, K.; Ohnuki, M.; Narita, M.; Ichisaka, T.; Tomoda, K.; Yamanaka, S. Induction of pluripotent stem cells from adult human fibroblasts by defined factors. Cell 2007, 131, 861–872. [Google Scholar] [CrossRef]
- Ortuño-Costela, M.D.C.; Cerrada, V.; García-López, M.; Gallardo, M.E. The challenge of bringing iPSCs to the patient. Int. J. Mol. Sci. 2019, 20, 6305. [Google Scholar] [CrossRef]
- Liu, G.; David, B.T.; Trawczynski, M.; Fessler, R.G. Advances in Pluripotent Stem Cells: History, Mechanisms, Technologies, and Applications. Stem Cell Rev. Rep. 2020, 16, 3–32. [Google Scholar] [CrossRef]
- Bonaventura, G.; Munafò, A.; Bellanca, C.M.; La Cognata, V.; Iemmolo, R.; Attaguile, G.A.; Di Mauro, R.; Di Benedetto, G.; Cantarella, G.; Barcellona, M.L.; et al. Stem Cells: Innovative Therapeutic Options for Neurodegenerative Diseases? Cells 2021, 10, 1992. [Google Scholar] [CrossRef]
- Wang, Z.; Zheng, J.; Pan, R.; Chen, Y. Current status and future prospects of patient-derived induced pluripotent stem cells. Hum. Cell 2021, 34, 1601–1616. [Google Scholar] [CrossRef]
- Kim, J.Y.; Nam, Y.; Rim, Y.A.; Ju, J.H. Review of the Current Trends in Clinical Trials Involving Induced Pluripotent Stem Cells. Stem Cell Rev. Rep. 2022, 18, 142–154. [Google Scholar] [CrossRef] [PubMed]
- Maffioletti, S.M.; Gerli, M.F.M.; Ragazzi, M.; Dastidar, S.; Benedetti, S.; Loperfido, M.; VandenDriessche, T.; Chuah, M.K.; Tedesco, F.S. Efficient derivation and inducible differentiation of expandable skeletal myogenic cells from human ES and patient-specific iPS cells. Nat. Protoc. 2015, 10, 941–958. [Google Scholar] [CrossRef] [PubMed]
- Shoji, E.; Woltjen, K.; Sakurai, H. Directed Myogenic Differentiation of Human Induced Pluripotent Stem Cells. Methods Mol. Biol. 2015, 1353, 89–99. [Google Scholar]
- Chal, J.; Oginuma, M.; Al Tanoury, Z.; Gobert, B.; Sumara, O.; Hick, A.; Bousson, F.; Zidouni, Y.; Mursch, C.; Moncuquet, P.; et al. Differentiation of pluripotent stem cells to muscle fiber to model Duchenne muscular dystrophy. Nat. Biotechnol. 2015, 33, 962–969. [Google Scholar] [CrossRef]
- Kodaka, Y.; Rabu, G.; Asakura, A. Skeletal muscle cell induction from pluripotent stem cells. Stem Cells Int. 2017, 2017, 1376151. [Google Scholar] [CrossRef]
- Broeders, M.; Herrero-Hernandez, P.; Ernst, M.P.T.; van der Ploeg, A.T.; Pijnappel, W.W.M.P. Sharpening the molecular scissors: Advances in gene-editing technology. iScience 2020, 23, 100789. [Google Scholar] [CrossRef]
- Ortuño-Costela, M.d.C.; Moreno-Izquierdo, A.; Garesse, R.; Gallardo, M.E. Generation of a human iPSC line, IISHDOi002-A, with a 46, XY/47, XYY mosaicism and belonging to an African mitochondrial haplogroup. Stem Cell Res. 2018, 28, 131–135. [Google Scholar] [CrossRef]
- Ortuño-Costela, M.d.C.; Rodríguez-Mancera, N.; García-López, M.; Zurita-Díaz, F.; Moreno-Izquierdo, A.; Lucía, A.; Martín, M.Á.; Garesse, R.; Gallardo, M.E. Establishment of a human iPSC line (IISHDOi001-A) from a patient with McArdle disease. Stem Cell Res. 2017, 23, 188–192. [Google Scholar] [CrossRef]
- Mazaleyrat, K.; Badja, C.; Broucqsault, N.; Chevalier, R.; Laberthonnière, C.; Dion, C.; Baldasseroni, L.; El-Yazidi, C.; Thomas, M.; Bachelier, R.; et al. Multilineage differentiation for formation of innervated skeletal muscle fibers from healthy and diseased human pluripotent stem cells. Cells 2020, 9, 1531. [Google Scholar] [CrossRef]
- Buckingham, M.; Bajard, L.; Chang, T.; Daubas, P.; Hadchouel, J.; Meilhac, S.; Montarras, D.; Rocancourt, D.; Relaix, F. The formation of skeletal muscle: From somite to limb. J. Anat. 2003, 202, 59–68. [Google Scholar] [CrossRef]
- Frontera, W.R.; Ochala, J. Skeletal muscle: A brief review of structure and function. Behav. Genet. 2015, 45, 183–195. [Google Scholar] [CrossRef] [PubMed]
- Ulman, A.; Kot, M.; Skrzypek, K.; Szewczyk, B.; Majka, M. Myogenic Differentiation of iPS Cells Shows Different Efficiency in Simultaneous Comparison of Protocols. Cells 2021, 10, 1671. [Google Scholar] [CrossRef] [PubMed]
- Chal, J.; Pourquié, O. Making muscle: Skeletal myogenesis in vivo and in vitro. Development 2017, 144, 2104–2122. [Google Scholar] [CrossRef] [PubMed]
- Selvaraj, S.; Perlingeiro, R.C.R. Induced pluripotent stem cells for neuromuscular diseases: Potential for disease modeling, drug screening, and regenerative medicine. In Encyclopedia of Tissue Engineering and Regenerative Medicine; Elsevier: Amsterdam, The Netherlands, 2019; Volume 1–3, pp. 471–481. ISBN 9780128136997. [Google Scholar]
- Karagiannis, P.; Takahashi, K.; Saito, M.; Yoshida, Y.; Okita, K.; Watanabe, A.; Inoue, H.; Yamashita, J.K.; Todani, M.; Nakagawa, M.; et al. Induced pluripotent stem cells and their use in human models of disease and development. Physiol. Rev. 2019, 99, 79–114. [Google Scholar] [CrossRef] [PubMed]
- Morgan, J.; Partridge, T. Skeletal muscle in health and disease. Dis. Model. Mech. 2020, 13, dmm042192. [Google Scholar] [CrossRef] [PubMed]
- Bentzinger, C.F.; Wang, Y.X.; Rudnicki, M. Building muscle: Molecular regulation of myogenesis. Cold Spring Harb. Perspect. Biol. 2012, 4, a008342. [Google Scholar] [CrossRef]
- Nogami, K.; Blanc, M.; Takemura, F.; Takeda, S.; Miyagoe-Suzuki, Y. Making skeletal muscle from human pluripotent stem cells. In Muscle Cell and Tissue—Current Status of Research Field; InTech: Rijeka, Croatia, 2018. [Google Scholar]
- Howell, J.M.M.C.; Walker, K.R.R.; Creed, K.E.E.; Dunton, E.; Davies, L.; Quinlivan, R.; Karpati, G. Phosphorylase re-expression, increase in the force of contraction and decreased fatigue following notexin-induced muscle damage and regeneration in the ovine model of McArdle disease. Neuromuscul. Disord. 2014, 24, 167–177. [Google Scholar] [CrossRef]
- Krag, T.O.; Pinós, T.; Nielsen, T.L.; Brull, A.; Andreu, A.L.; Vissing, J. Differential muscle involvement in mice and humans affected by McArdle disease. J. Neuropathol. Exp. Neurol. 2016, 75, 441–454. [Google Scholar] [CrossRef]
- Nogales-Gadea, G.; Consuegra-García, I.; Rubio, J.C.; Arenas, J.; Cuadros, M.; Camara, Y.; Torres-Torronteras, J.; Fiuza-Luces, C.; Lucia, A.; Martín, M.A.; et al. A transcriptomic approach to search for novel phenotypic regulators in McArdle disease. PLoS ONE 2012, 7, e31718. [Google Scholar] [CrossRef]
- García-Consuegra, I.; Asensio-Peña, S.; Ballester-Lopez, A.; Francisco-Velilla, R.; Pinos, T.; Pintos-Morell, G.; Coll-Cantí, J.; González-Quintana, A.; Andreu, A.L.; Arenas, J.; et al. Missense mutations have unexpected consequences: The McArdle disease paradigm. Hum. Mutat. 2018, 39, 1338–1343. [Google Scholar] [CrossRef]
- Nogales-Gadea, G.; Rubio, J.C.; Fernandez-Cadenas, I.; Garcia-Consuegra, I.; Lucia, A.; Cabello, A.; Garcia-Arumi, E.; Arenas, J.; Andreu, A.L.; Martín, M.A. Expression of the muscle glycogen phosphorylase gene in patients with McArdle disease: The role of nonsense-mediated mRNA decay. Hum. Mutat. 2008, 29, 277–283. [Google Scholar] [CrossRef] [PubMed]
- Wang, F.; Qi, L.S. Applications of CRISPR genome engineering in cell biology. Trends Cell Biol. 2016, 26, 875–888. [Google Scholar] [CrossRef] [PubMed]
- Lentini, L.; Melfi, R.; Cancemi, P.; Pibiri, I.; Di Leonardo, A. Caffeine boosts Ataluren’s readthrough activity. Heliyon 2019, 5, e01963. [Google Scholar] [CrossRef]
- Tarrasó, G.; Real-Martinez, A.; Parés, M.; Romero-Cortadellas, L.; Puigros, L.; Moya, L.; de Luna, N.; Brull, A.; Martín, M.A.; Arenas, J.; et al. Absence of p.R50X Pygm read-through in McArdle disease cellular models. Dis. Model. Mech. 2019, 12, dmm.043281. [Google Scholar] [CrossRef]
- Galera, T.; Zurita, F.; González-Páramos, C.; Moreno-Izquierdo, A.; Fraga, M.F.; Fernández, A.F.; Garesse, R.; Gallardo, M.E. Generation of a human iPSC line from a patient with Leigh syndrome. Stem Cell Res. 2016, 16, 63–66. [Google Scholar] [CrossRef] [PubMed]
- Galera-Monge, T.; Zurita-Díaz, F.; Garesse, R.; Gallardo, M.E. The mutation m.13513G>A impairs cardiac function, favoring a neuroectoderm commitment, in a mutant-load dependent way. J. Cell. Physiol. 2019, 234, 19511–19522. [Google Scholar] [CrossRef]
- Delourme, M.; Broucqsault, N.; Mazaleyrat, K.; Magdinier, F. Production of Innervated Skeletal Muscle Fibers Using Human Induced Pluripotent Stem Cells. Methods Mol. Biol. 2022, 2454, 231–239. [Google Scholar] [CrossRef]
- Concordet, J.-P.; Haeussler, M. CRISPOR: Intuitive guide selection for CRISPR/Cas9 genome editing experiments and screens. Nucleic Acids Res. 2018, 46, W242–W245. [Google Scholar] [CrossRef]
- Brunak, S.; Engelbrecht, J.; Knudsen, S. Prediction of human mRNA donor and acceptor sites from the DNA sequence. J. Mol. Biol. 1991, 220, 49–65. [Google Scholar] [CrossRef]
- Bruntraeger, M.; Byrne, M.; Long, K.; Bassett, A.R. Editing the genome of human induced pluripotent stem cells using CRISPR/Cas9 ribonucleoprotein complexes. Methods Mol. Biol. 2019, 1961, 153–183. [Google Scholar]
- Fuster-García, C.; García-García, G.; González-Romero, E.; Jaijo, T.; Sequedo, M.D.; Ayuso, C.; Vázquez-Manrique, R.P.; Millán, J.M.; Aller, E. USH2A gene editing using the CRISPR system. Mol. Ther. Nucleic Acids 2017, 8, 529–541. [Google Scholar] [CrossRef] [PubMed]


| Primary Antibodies | ||
|---|---|---|
| Name | Dilution | Reference |
| Goat anti-NANOG | 1:25 | R&D Systems, Minneapolis, MN, USA; #sc-5279 |
| Mouse anti-OCT4 | 1:100 | Santa Cruz Biotechnology, Dallas, TX, USA; #sc-5279 |
| Rabbit anti-SOX2 | 1:100 | Thermo Fisher Scientific, Waltham, MA, USA; #PA1-16968 |
| Mouse anti-SSEA4 | 1:10 | Millipore, Burlington, MA, USA; #MAB4304 |
| Rat anti-SSEA3 | 1:20 | Abcam, Cambridge, UK; #ab16286 |
| Mouse anti-TRA-1-81 | 1:150 | Millipore, Burlington, MA, USA; #MAB4381 |
| Mouse anti-TRA-1-60 | 1:150 | Millipore, Burlington, MA, USA; #MAB4360 |
| Secondary antibodies | ||
| Name | Dilution | Reference |
| Cy™2-conjugated AffiniPure Donkey Anti-Goat IgG (H + L) | 1:50 | Jackson ImmunoResearch Labs, Ely, UK; #705-225-147 |
| Cy™2-conjugated AffiniPure Goat Anti-Mouse IgG, Fcγ subclass 2b specific | 1:50 | Jackson ImmunoResearch Labs, Ely, UK; #115-225-207 |
| Cy™3-conjugated AffiniPure Donkey Anti-Mouse IgM, μ chain specific | 1:250 | Jackson ImmunoResearch Labs, Ely, UK; #715-165-020 |
| Cy™2-conjugated AffiniPure Goat Anti-Rabbit IgG (H + L) | 1:50 | Jackson ImmunoResearch Labs, Ely, UK; #111-225-144 |
| Cy™3-conjugated AffiniPure Goat Anti-Rat IgM, μ chain specific | 1:250 | Jackson ImmunoResearch Labs, Ely, UK; #112-165-075 |
| Cy™3-conjugated AffiniPure Goat Anti-Mouse IgG, Fcγ subclass 3 specific | 1:250 | Jackson ImmunoResearch Labs, Ely, UK; #115-165-209 |
| Primary Antibodies | ||
|---|---|---|
| Name | Dilution | Reference |
| Mouse anti-β tubulin isotype III (ectoderm) | 1:300 | Merck, Darmstadt, Germany; #T8660 |
| Mouse anti-AFP (endoderm) | 1:300 | Merck, Darmstadt, Germany; #WH0000174M1 |
| Mouse anti-SMA (mesoderm) | 1:400 | Merck, Darmstadt, Germany; #A2547 |
| Secondary antibodies | ||
| Name | Dilution | Reference |
| Goat anti-mouse IgG (H + L), Alexa Fluor 488 | 1:500 | Thermo Fisher Scientific, Waltham, MA, USA #A-11029 |
| Differentiation Days (D) | Supplements to Be Added |
|---|---|
| From D0 to D5 | Insulin-transferrin-selenium (ITS) 1x (Gibco, Waltham, MA, USA; 41400045); LDN193189 0.5 μM (StemCell Technologies, Vancouver, Canada; 72147); CHIR99021 3 μM (StemCell Technologies, Vancouver, Canada; 72054) *D1: additional supplementation with 2 μM Thiazovivin |
| From D6 to D7 | IGF-I 4 ng/mL (StemCell Technologies, Vancouver, Canada; 78022.1); HGF 10 ng/mL (StemCell Technologies, Vancouver, Canada; 78019.1); LDN193189 0,5 μM (StemCell Technologies, Vancouver, Canada; 72147); β-mercaptoethanol 100 μM (Gibco, Waltham, MA, USA; 21985023) |
| From D8 to D11 | IGF-I 4 ng/mL (StemCell Technologies, Vancouver, Canada; 78022.1); β-mercaptoethanol 100 μM (Gibco, Waltham, MA, USA; 21985023) |
| From D1 to D16 | IGF-I 4 ng/mL (StemCell Technologies, Vancouver, Canada; 78022.1); β-mercaptoethanol 100 μM (Gibco, Waltham, MA, USA; 21985023); DAPT 10 μM (Merck, Darmstadt, Germany; D5942) |
| From D17-onwards | IGF-I 4 ng/mL (StemCell Technologies, Vancouver, Canada; 78022.1); β-mercaptoethanol 100 μM (Gibco, Waltham, MA, USA; 21985023) |
| Primary Antibodies | ||
|---|---|---|
| Name | Dilution | Reference |
| Mouse anti-titin | 96:1000 | DSHB, Iowa, IA, USA; #9D10 |
| Rabbit anti-desmin | 1:100 | Abcam, Cambridge, UK; #AB15200 |
| Chicken anti-neurofilament | 1:2000 | Biolegend, San Diego, CA; USA; #PCK-593P |
| Rabbit anti-MNX1 (HB9) | 1:100 | Millipore, Burlington, MA, USA; #ABN174 |
| Goat anti-ChAT | 1:100 | Millipore, Burlington, MA, USA; #AB144P |
| Secondary antibodies | ||
| Name | Dilution | Reference |
| Goat anti-mouse IgG (H + L) Alexa Fluor® 647 | 1:1000 | Thermo Fisher Scientific, Waltham, MA, USA; #A-21236 |
| Goat anti-chicken IgG (H + L) DyLight™ 488 | 1:1000 | Rockland, Pottstown, PA, USA; #603-141-126 |
| Goat anti-rabbit IgG (H + L) Alexa Fluor® 594 | 1:1000 | Thermo Fisher Scientific, Waltham, MA, USA; #A-11012 |
| Goat anti-mouse IgG (H + L) Alexa Fluor® 488 | 1:1000 | Thermo Fisher Scientific, Waltham, MA, USA; #A28175 |
| Goat anti-rabbit IgG (H + L) Alexa Fluor® 555 | 1:1000 | Cell Signalling, Danvers, MA, USA; #4413 |
| Donkey anti-goat IgG (H + L) Alexa Fluor® 633 | 1:1000 | Thermo Fisher Scientific, Waltham, MA, USA; #A-21082 |
| Target | Forward Primer (5′→3′) | Reverse Primer (5′→3′) |
|---|---|---|
| MyH2 | GGAGCTGGTGGAGGGGCCAA | TGCTCCATGGCACCAGGAGTTT |
| MyH3 | GCTTGTGGGCGGAGGTCTGG | AGGGCTGGTTCTGAGCCTCGAT |
| MyoD | TGCGCAACGCCATCCGCTA | GGGCCGCTGTAGTCCATCATGC |
| TTN | CCGAAATGCATCAGTCAGCG | CCTTGCAAGCTTGTGTCACC |
| DES | CCGCCATCTGCGCGAGTACC | TGCTCAGGGCTGGTTTCTCGGA |
| PAX3 | CACCAGGCATGGATTTTCC | TTGTCAGGAGTCCCATTACCT |
| PAX7 | CCACAGCTTCTGCAGCTACTCTG | GGGTTGCCCAAGATGCTG |
| ChAT | AGAAGCAGAAATGCAGCCCT | GCTCTCACAAAAGCCAGTGC |
| HPRT | CATTATGCTGAGGATTTGGAAAGG | CTTGAGCACACAGAGGGCTACA |
| PPIA | GGCAAATGCTGGACCCAACACA | TGCTGGTCTTGCCATTCCTGGA |
| crRNA Domain Sequence (5′ → 3′) | PAM | |
|---|---|---|
| sgRNA.1 | ACTCGTAAAGGACCGCAATG | TGG |
| sgRNA.2 | GAGCAAAGTAGTAGTCTCAT | GGG |
| Target | Forward Primer (5′ → 3′) | Reverse Primer (5′ → 3′) |
|---|---|---|
| IL17RD | CCACCTCAACAGAGACCACC | GGGGGCCAGAGAGTTTTCTT |
| CMPK1 | GCATTCCTACTCACATAAGTG | GTCATATTATCTCAATCAACTC |
| SLC39 | TTCTCTAGATATACTCAGCC | TATAAGGCAGCCATCCATG |
| LOC105375144 | GCTGGTAGCACAAGCAGAG | AGTCCAGTGTGATAGGAGCC |
| XPO4 | CAGCATTGGGCAGATTACTTCTT | GGGGACAGAATAGTTTCATAGGCA |
| RIT1 | AGGGACCACTACTCAGAGCT | AGACATCAGGGGTGTGGGTA |
Publisher’s Note: MDPI stays neutral with regard to jurisdictional claims in published maps and institutional affiliations. |
© 2022 by the authors. Licensee MDPI, Basel, Switzerland. This article is an open access article distributed under the terms and conditions of the Creative Commons Attribution (CC BY) license (https://creativecommons.org/licenses/by/4.0/).
Share and Cite
Ortuño-Costela, M.d.C.; Cerrada, V.; Moreno-Izquierdo, A.; García-Consuegra, I.; Laberthonnière, C.; Delourme, M.; Garesse, R.; Arenas, J.; Fuster García, C.; García García, G.; et al. Generation of the First Human In Vitro Model for McArdle Disease Based on iPSC Technology. Int. J. Mol. Sci. 2022, 23, 13964. https://doi.org/10.3390/ijms232213964
Ortuño-Costela MdC, Cerrada V, Moreno-Izquierdo A, García-Consuegra I, Laberthonnière C, Delourme M, Garesse R, Arenas J, Fuster García C, García García G, et al. Generation of the First Human In Vitro Model for McArdle Disease Based on iPSC Technology. International Journal of Molecular Sciences. 2022; 23(22):13964. https://doi.org/10.3390/ijms232213964
Chicago/Turabian StyleOrtuño-Costela, María del Carmen, Victoria Cerrada, Ana Moreno-Izquierdo, Inés García-Consuegra, Camille Laberthonnière, Mégane Delourme, Rafael Garesse, Joaquín Arenas, Carla Fuster García, Gema García García, and et al. 2022. "Generation of the First Human In Vitro Model for McArdle Disease Based on iPSC Technology" International Journal of Molecular Sciences 23, no. 22: 13964. https://doi.org/10.3390/ijms232213964
APA StyleOrtuño-Costela, M. d. C., Cerrada, V., Moreno-Izquierdo, A., García-Consuegra, I., Laberthonnière, C., Delourme, M., Garesse, R., Arenas, J., Fuster García, C., García García, G., Millán, J. M., Magdinier, F., & Gallardo, M. E. (2022). Generation of the First Human In Vitro Model for McArdle Disease Based on iPSC Technology. International Journal of Molecular Sciences, 23(22), 13964. https://doi.org/10.3390/ijms232213964