Abstract
Staphylococcus aureus possesses a large arsenal of immune-modulating factors, enabling it to bypass the immune system’s response. Here, we demonstrate that the acid phosphatase SapS is secreted during macrophage infection and promotes its intracellular survival in this type of immune cell. In animal models, the SA564 sapS mutant demonstrated a significantly lower bacterial burden in liver and renal tissues of mice at four days post infection in comparison to the wild type, along with lower pathogenicity in a zebrafish infection model. The SA564 sapS mutant elicits a lower inflammatory response in mice than the wild-type strain, while S. aureus cells harbouring a functional sapS induce a chemokine response that favours the recruitment of neutrophils to the infection site. Our in vitro and quantitative transcript analysis show that SapS has an effect on S. aureus capacity to adapt to oxidative stress during growth. SapS is also involved in S. aureus biofilm formation. Thus, this study shows for the first time that SapS plays a significant role during infection, most likely through inhibiting a variety of the host’s defence mechanisms.
1. Introduction
Staphylococcus aureus is an important human pathogen that has been linked to high rates of mortality and morbidity across a diverse range of illnesses that may be acquired in hospitals or in the community [1,2]. S. aureus infection can manifest itself clinically in a variety of ways, ranging from mild skin infections to a potentially fatal form of bacteremia that can lead to complications including endocarditis and pneumonia. Because it has such many different virulence factors, S. aureus is capable of adhering to and invading a wide variety of tissue which contributes to its sophisticated human adaption [3,4,5]. S. aureus is also capable of producing a large range of secreted proteins that participate in the pathogen host-interaction mechanisms and especially with the immune system, corresponding to the first line of defence against invading bacteria [6]. It is interesting to note that the presence of this diversity of virulence factors allows S. aureus to colonize a variety of environments and establish infections by distinct pathways. Throughout these infections, S. aureus and the host cells engage in a competition for nutrients and reorganize their metabolism in an effort to survive. This metabolic interaction and crosstalk are what ultimately decides the fate of the infection by modifying metabolic processes in host immune cells. The activation of antimicrobial responses may lead ultimately to the elimination of bacteria and can include cell death processes. This highlights the relevance of metabolic alterations in both host and bacterial cells in determining the course of staphylococcal infections as recently reviewed in [7,8,9]. Although a lot of knowledge has been gathered from research aiming at identifying the pathophysiological processes that occur during an infection caused by S. aureus in macrophages, the bacterial virulence factors and signalling mechanisms that lead to these changes are still only partially known [10].
In recent years, we and others have shown that some host-pathogen interactions involve phosphatase enzymes that are released by pathogens [11,12,13,14,15,16]. We recently showed that PtpA, a S. aureus-produced low-molecular-weight protein tyrosine phosphatase [17], was secreted during growth and was involved in the pathogen’s virulence [16]. Interestingly, the new class C non-specific acid phosphatase SapS (also known as SAcP), corresponding to another family of protein phosphatase than PtpA, was identified as secreted by S. aureus strain 154 isolated from vegetables [18]. Acid phosphatases are found almost everywhere in nature and are responsible for the hydrolysis of the phosphoryl groups of phosphomonoesters at an acidic pH [19]. Both prokaryotes and eukaryotes need these enzymes for the generation, assimilation, and the mobilisation of inorganic phosphate, in addition to being important for the phosphorelay systems that play a role in the signal transduction pathways. Acid phosphatases from other pathogens were reported to be involved in reduction of the respiratory burst, which suggests that these acid phosphatases have a role in the virulence of these pathogens [13,20,21,22,23,24,25,26]. However, while SapS was characterised biochemically [18], its impact on immune escape, infectiousness and virulence has not yet been evaluated.
Here, we report that the deletion of sapS in the S. aureus strain SA564 significantly reduced the mutant’s ability to escape intracellular killing by RAW 264.7 macrophages. Additionally, we show that SapS can be found outside of bacterial cells ingested by macrophages. In animal models, the SA564 sapS mutant produced a significantly lower bacterial burden in liver and renal tissues of mice at four days post infection in comparison to the wild type, as well as a lower virulence in the zebrafish model of infection. SA564 sapS cells also displayed an enhanced susceptibility to hydrogen peroxide challenge, although only little impact of the sapS mutation regarding the transcription of genes that are implicated in oxidative stress adaption process was observed. An aspartic acid to alanine exchange in the active site of SapS revealed furthermore that SapS phosphatase function is neither necessary for S. aureus to survive in macrophages nor for infectivity in the zebrafish infection model.
2. Results
2.1. SapS Is Involved in Intramacrophage Survival of S. aureus
Considering how crucial the previously identified phosphatases PtpA and PtpB are to the capacity of S. aureus to survive inside macrophages [16,27], we hypothesised that SapS, which is highly conserved in S. aureus (Figure S1), might have a similar impact. An in silico investigation yielded that until 5 November 2022, the sapS encoding gene of S. aureus isolate SA564 exhibited 100% coverage and 100% identity with all S. aureus genomes sequences by blast against NCBI GenBank database, represented by the 100 hit-blast strains deposited previously on NCBI GenBank database. Phylogenetic analysis of the identified sapS complete sequence with the most hit-blasts including the S. aureus USA300 strain and other Staphylococcus species obtained by blast after exclusion of the S. aureus TaxID, confirmed that the sapS gene remains well conserved in all S. aureus isolates at 100% sequence similarity (Figure S1).
To investigate this hypothesis, a sapS deletion mutant (SA564 ΔsapS) and its cis-complementation derivative SA564 ΔsapS::sapS were constructed in SA564, a clinical isolate of clonal complex 5 (CC5). We first conducted in vitro growth curves using the wild type, mutant, and complemented strains to see if the loss of sapS in S. aureus would have an impact on bacterial growth in suspension. There was no noticeable impact on the growth in tryptic soy broth (TSB) caused by the deletion of sapS in S. aureus strain SA564, as shown in Figure 1A. To get an idea about the expression of SapS in S. aureus SA564, we next evaluated the transcription of sapS while the bacteria were grown in TSB (Figure 1B). The relative abundance of sapS transcripts clearly decreased over time, suggesting that SapS is predominantly expressed in SA564 during the early growth stages.
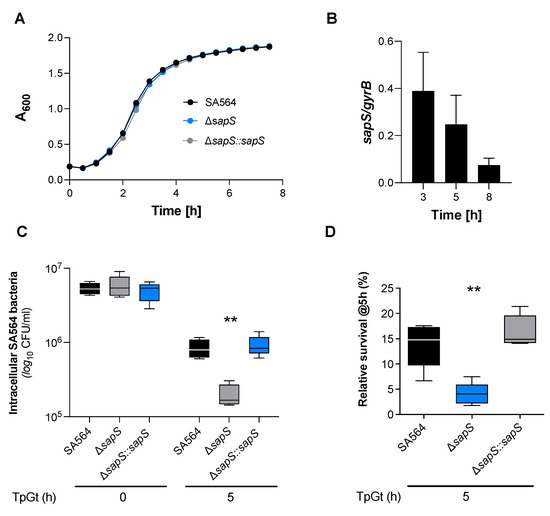
Figure 1.
SapS has no impact on S. aureus SA564 growth in vitro but contributes to intramacrophage survival. (A) Growth kinetics of S. aureus strains SA564 (black symbols), SA564 ΔsapS (blue symbols), and SA564 ΔsapS::sapS (grey symbols) in TSB. Cells were cultured at 37 °C and 150 rpm in 96-well plates using a Spark 20M (Tecan, Trading AG, Männedorf, Switzerland) microplate reader. Data represent the mean A600 readings ± SD at the time points indicated (n = 3; error bars are too small to be visible). (B) Transcription of sapS during growth in TSB. Cells of SA564 were cultured at 37 °C and 225 rpm in a culture to flask volume of 1:10, and after 3 h, 5 h, and 8 h of growth, cells were harvested, total RNAs isolated, and qRT-PCRs performed for sapS. Transcripts were quantified in reference to gyrase B mRNA. Data are presented as mean + SD of five biological replicates. (C,D) Survival of S. aureus strain derivatives in infected RAW 264.7 macrophages. CFU rates recovered from infected cells lysates at the time points indicated. Data are presented as mean + SD (n = 5 biological replicates) (C) and survival rates expressed in relationship to the intracellular bacterial cell counts that were detected immediately after the gentamicin/lysostaphin treatment (T0), which was set to 100%. The data are displayed as box and whisker plots, displaying the median (horizontal line), interquartile range (25–75% box), and standard deviation (bars) of five different experiments (D). **, p < 0.01 (Kruskal–Wallis test followed by Dunn’s post-hoc test). TpGt, time post gentamicin treatment.
Given that SapS (SACOL0303) includes a 31-aa long signal sequence at the N-terminus of its protein sequence [28] and that the protein was found repeatedly in S. aureus cell culture supernatants [18,29,30], one can assume safely that SapS is secreted by S. aureus into the extracellular milieu under in vitro conditions. However, as it is not known yet whether S. aureus also secretes SapS when exposed to an infection-mimicking environment, we created a SA564 ΔsapS derivative harbouring plasmid pLI50_SapS-Spot and cultured it in TSB or used it to infect RAW 264.7 macrophages. Next, the presence of SapS-Spot was determined in the supernatants (by immunoprecipitation with anti-Spot magnetic beads; IP) and cytosol-, membrane-, and cell wall-fractions of S. aureus cell suspensions grown for 4 h in TSB (Figure 2A), or in lysed macrophage supernatants and intracellular persistent bacteria at 3 and 5 h after infection, respectively (Figure 2B). In in vitro cultured S. aureus cells, we observed a strong SapS-Spot signal in membrane fractions, and weaker but still clearly visible signals in cell wall fractions and the supernatant, while SapS-Spot was hardly detectable in the cytosol fractions. To rule out that the SapS-Spot signal seen in the supernatants of S. aureus TSB cultures was due to a partial lysis of the bacterial cell population, we transformed SA564 ΔsapS with plasmid pRMC2_SecA-Spot, which expresses a SecA-Spot derivative known to associate with the membrane fraction of S. aureus [27]. In line with its predicted localization, we observed SecA-Spot signals almost exclusively in the membrane fraction, and to a small extent in the cytosol fractions, but neither in the cell wall fractions nor in the supernatants (Figure 2A). These findings suggest that SapS associates predominantly with the bacterial cell membrane and is in part secreted into the extracellular milieu after cleavage of its peptide signal as indicated by a lower SapS migrating band (Figure 2A). Notably, when SapS-Spot expressing SA564 ΔsapS cells were used to infect RAW 264.7 macrophages, the majority of SapS-Spot was detectable in macrophage lysates at 3 and 5 h post infection (Figure 2B), suggesting that SapS is primarily secreted into the phagolysosome and/or cytosol of the S. aureus loaded immune cells. However, we cannot exclude here that the majority of SapS is released due to bacterial cell lysis under these infection-mimicking culture conditions.
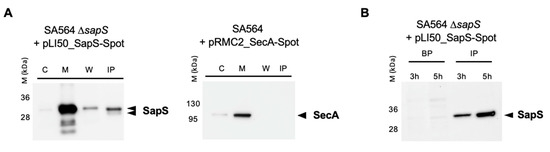
Figure 2.
SapS is produced by S. aureus both in vitro and in infected macrophages. (A) Cultures were grown up to exponential phase and supernatants from SA564 ∆sapS + pLI50_SapS-Spot and SA564 + pLI50_SecA-Spot (negative secretion control) were filtered and immunoprecipitated using anti-Spot magnetic beads, while bacterial pellets were resuspended and lysed in PBS with lysostaphin, a protease inhibitor cocktail, DNAase I and fractionated. Cytoplasm (C), membrane (M), cell wall (W), and immunoprecipitated proteins (IP) from supernatants were migrated on SDS-PAGEs, transferred to PVDF membranes for Western-blot analyses using monoclonal mouse anti-Spot antibody as primary antibody (Chromotek, Germany) and an HRP-coupled donkey-anti-mouse antibody as secondary antibody (Jackson Immuno Research). Data are representative of three different experiments. (B) RAW 264.7 macrophages (2.5 × 10⁵ cells/well) were infected with S. aureus at a MOI of 20, and non-phagocytosed bacteria were subsequently removed by gentamicin/lysostaphin treatment. Infected macrophages were lysed in 0.1% Triton X-100 and centrifuged at 14,000× g. The macrophage lysates were immunoprecipitated with anti-Spot magnetic beads (Chromotek), while the pellets of the intracellular bacteria were resuspended in an equal volume of lysis buffer. Immunoprecipitated proteins (IP) and bacterial pellets (BP) were separated on SDS-PAGE and observed with an anti-Spot antibody as described in (A). Data are representative of three different experiments (M kDa: molecular markers).
Next, we determined how cells of the S. aureus strains SA564, SA564 ΔsapS, and SA564 ΔsapS::sapS survived inside RAW 264.7 macrophages. Intracellular CFU counts at T0 were similar for all the three bacterial strains in RAW 264.7 cells, indicating that the sapS mutation does not affect adhesion and internalisation of S. aureus into this immune cell type, while at 5 h post-Gentamycin treatment (pGt), intracellular bacterial loads decreased significantly for the SA564 ΔsapS mutant (Figure 1C). Comparison of the relative survival rates at 5 h pGt identified a significantly lower survival of the S. aureus sapS mutant inside of the RAW 264.7 cells, while cis-complementation of the sapS mutant with a functional sapS locus restored intracellular survival rates to values equivalent to those seen with the WT strain (Figure 1D). These findings imply that SapS is important for the intracellular survival capability of S. aureus inside macrophages.
2.2. SapS Participates to the Virulence of S. aureus in the Zebrafish and Murine Abscess Models
Considering that SapS contributes to the survival capability of S. aureus inside macrophages (Figure 1C,D), we were curious about the impact of SapS on the bacterium’s ability to cause infection in vivo. In order to determine the impact of SapS in S. aureus virulence, we used the zebrafish model that has been previously demonstrated to be relevant to monitor S. aureus virulence by following the survival rate of infected larvae [31,32]. S. aureus SA564 and its isogenic ΔsapS derivatives were injected into the duct of Cuvier, respectively, which causes a rapid systemic infection at 50 h post-fertilization, when the zebrafish embryo innate immune system is functional [33]. Infected embryo survival curves revealed that injection of wild-type cells into the larvae killed about 50% of the zebrafish embryos at 80 h post infection (hpi), and a similar killing rate was also observed for larvae infected with the cis-complemented ΔsapS::sapS derivative (Figure 3). However, when the zebrafish embryos were infected with the SA564 ΔsapS mutant, a survival rate of ~80% was observed, suggesting that SapS is an important virulence factor in this model.
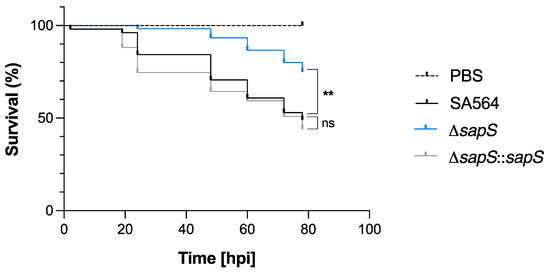
Figure 3.
Infected zebrafish embryos display an increased level of survival when infected with the SA564 ΔsapS mutant. Kaplan–Meier graphic represents the survival of infected zebrafish embryos after injection in the duct of Cuvier with SA564 (black symbols), SA564 ΔsapS (blue symbols), and SA564 ΔsapS::sapS (grey symbols) strains at 3 × 10² CFU/nL grown in exponential phase, or PBS (negative control) The proportion of surviving embryos (n = 50 for each, indicative of three different experiments) is represented. **, p < 0.01, ns, not significant (Log-rank Mantel–Cox statistical test). hpi, hours post-infection.
To test the impact of SapS in a mammalian model, we next utilised the S. aureus-based liver and kidney abscess model [34]. Once bacteria were injected into the circulating blood of the mice, and bacterial loads in the liver and kidneys were calculated at four days post infection, a significant decrease in viable bacteria was noticed in the kidneys of mice infected with the ΔsapS mutant (Figure 4A). Kidney homogenates of SA564 ΔsapS challenged mice contained in the median more than 2 log10 fewer colony forming units (CFU) than kidney homogenates of SA564 infected mice. CFU rates in kidney homogenates of SA564 ΔsapS::sapS challenged mice were about 1.5 log10 higher as those seen with SA564 ΔsapS challenged mice, and did not differ statistically from the CFU rates seen in the kidney homogenates of wild-type infected mice. Mice infected with the ΔsapS mutant also displayed in the median about 2 log10 fewer CFU numbers in the liver than wild-type or ΔsapS::sapS challenged mice (Figure 4B), despite the fact that this difference was not significantly different according to the statistics (p = 0.1873, Kruskal–Wallis test and Dunn’s post-hoc test). Both infection models suggest that SapS is a factor that favorably affects the infectious potential of S. aureus under in vivo conditions, and that SapS is of particular importance for the bacterium to form abscesses in kidneys.
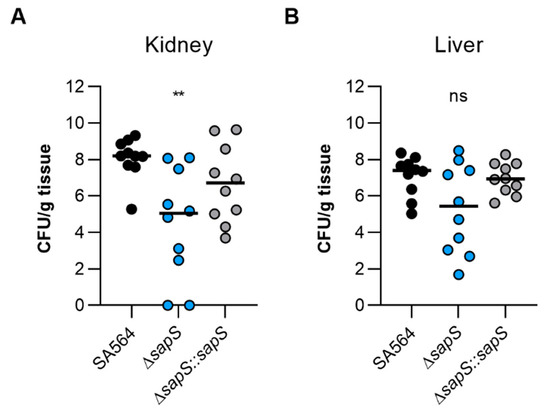
Figure 4.
The virulence of S. aureus SA564 in a murine abscess model is enhanced by the presence of SapS. C57BL/6N mice were infected via retroorbital injection with 1 x 10⁷ cells of S. aureus strain SA564 (black symbols), SA564 ΔsapS (blue symbols), and the cis-complemented derivative SA564 ΔsapS::sapS (grey symbols), respectively (n = 10 per group). Mice were euthanised and to evaluate the bacterial burdens in the kidney (A) and liver (B) organs, livers and kidneys were excised and homogenised in PBS 4 days after infection. Serial dilutions of the homogenates were then plated on sheep blood agar plates. One mouse is represented by each symbol. The median of all observations is indicated by the horizontal bars. ns, not significant; ** p < 0.01 (Kruskal–Wallis test followed by Dunn’s post hoc test). Only differences that are statistically significant between WT and mutants are displayed.
2.3. SapS Modifies the Immune Cell Population in S. aureus-Infected Mice Blood
To get an idea about the impact of the S. aureus infection on the murine immune system, we next studied the composition of immune cells in blood of S. aureus-infected mice after four days of infection (Figure 5). In comparison to uninfected mice, markedly higher numbers of leukocytes were found in blood of mice infected with the SA564 derivatives (Figure 5A), indicating that all three derivatives allowed for an establishment of an infection. However, when the numbers of leukocytes found in the blood of S. aureus-infected mice at four days post infection were compared, a significantly lower level of leukocytes was observed in SA564 ΔsapS challenged mice when compared to wild-type infected mice. This change in white blood cell numbers was mainly due to an increase in neutrophils in the blood of wild-type infected mice, which were significantly increased in wild-type infected mice at four days post infection in comparison to SA564 ΔsapS challenged mice (Figure 5B), while counts of monocytes, B-cells, T-cells, and NK-cells were not markedly altered between wild-type infected and ΔsapS challenged mice (Figure 5C–F). These findings suggest that SA564 elicits a stronger immune response in mice than its isogenic ΔsapS derivative.
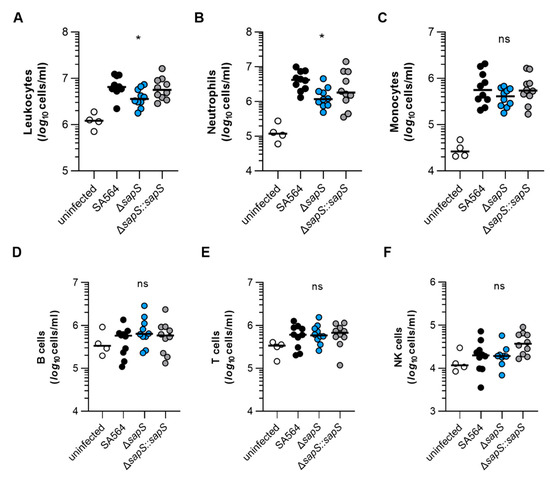
Figure 5.
The impact of SapS on the immune cell composition observed in the blood of mice infected with S. aureus. C57BL/6N mice were infected with S. aureus strain SA564 (black symbols), SA564 ΔsapS (blue symbols), and the cis-complemented derivative SA564 ΔsapS::sapS (grey symbols), respectively (n = 10 per group). After 4 days of infection, blood was withdrawn from narcotized mice, red blood cells lysed, the residual blood cells stained with fluorochrome-conjugated antibodies and the cell contents of leukocytes (A), neutrophils (B), monocytes (C), B cells (D), T cells (E), and NK cells (F) determined by flow cytometry. Blood from age-matched uninfected mice served as control (white symbols). Each symbol represents the cell content obtained from the blood of an individual mouse. The median of all the observations is shown by the horizontal bar. ns, not significant; * p < 0.05 (Kruskal–Wallis test followed by Dunn’s post hoc test. Only significant differences between WT-infected and mutant-infected mice are shown).
2.4. SapS Affects the KC and MPO Contents in Kidneys of S. aureus-Infected Mice
To test whether the increased numbers of neutrophils seen in the blood of SA564 infected mice were also accompanied by increased numbers of this immune cell type at the infection side, we next tested the myeloperoxidase (MPO) contents in kidney tissue homogenates obtained from the infected mice at four days post infection. In accordance with the increased numbers of neutrophils in blood of WT and ΔsapS::sapS infected mice, we observed in the median twice as high MPO levels as in kidney tissue homogenates obtained from ΔsapS infected mice (Figure 6A). Similarly, significantly lower levels of the neutrophil chemoattractant chemokine KC were observed in kidney tissue homogenates of the ΔsapS-infected mice in contrast to mice that had been infected with wild-type S. aureus (Figure 6B), while concentrations of the pro-inflammatory cytokine TNF-α were on a comparable level in all three groups (Figure 6C). Notably, when compared to the MPO, KC, and TNF-α contents observed in kidney tissue homogenates of age-matched uninfected mice, MPO and KC levels in kidney homogenates of mice infected with a SA564 derivative harbouring a functional sapS were both significantly increased. MPO and KC levels in kidney tissue homogenates of ΔsapS-infected mice, on the other hand, did not differ statistically from the MPO and KC contents observed in kidney tissue homogenates of age-matched uninfected mice (p ≥ 0.1630, Kruskal–Wallis test and Dunn’s post hoc test). These data seem to indicate that S. aureus cells harbouring a functional sapS, which form abscesses in kidneys, induce a chemokine response that favours the recruitment of neutrophils to the infection site.
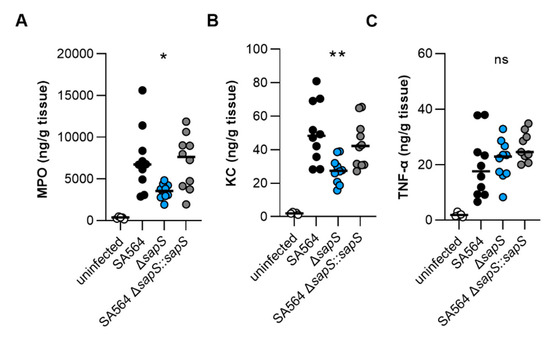
Figure 6.
MPO, KC, and TNF-α contents in kidney tissues obtained from mice at day 4 post infection. C57BL/6N mice were infected with S. aureus strain SA564 (black symbols), SA564 ΔsapS (blue symbols), and the cis-complemented derivative SA564 ΔsapS::sapS (grey symbols), respectively (n = 10 per group). Four days after infection, mice were euthanised, kidneys were extracted and blended with PBS solution, the tissue homogenates centrifuged, and the MPO (A), KC (B), and TNF-α (C) contents in the supernatants determined by enzyme-linked immunosorbent assays. Kidney homogenates from age-matched uninfected mice served as control (white symbols). Each symbol represents the amount of enzyme/cytokine found in the kidney homogenate of an individual mouse. The median of all the observations is shown by the horizontal bar. ns, not significant; * p < 0.05; **, p < 0.01 (Kruskal–Wallis test followed by Dunn’s post hoc test. Only significant differences between WT-infected and mutant-infected mice are shown).
2.5. SapS Does Not Alter the Uptake Rates of S. aureus by Polymorphonuclear Neutrophils in Whole Blood
As we recently observed a reduced intramacrophage survival capacity of a S. aureus SA564 derivative lacking the protein arginine phosphatase B encoding gene ptpB, which was accompanied by an increased uptake rate of SA564 ΔptpB mutant cells by polymorphonuclear neutrophils (PMNs) in whole blood [27], we determined whether SapS might exert a similar effect on uptake of S. aureus by PMNs in blood (Figure 7). However, unlike the SA564 ΔptpB mutant, SA564 cells lacking sapS were bound/ingested to a similar extent by PMNs than SA564 isolates possessing a functional sapS (wild-type and cis-complemented derivative), indicating that SapS does not have a significant protective role against phagocytosis performed by PMNs in blood.
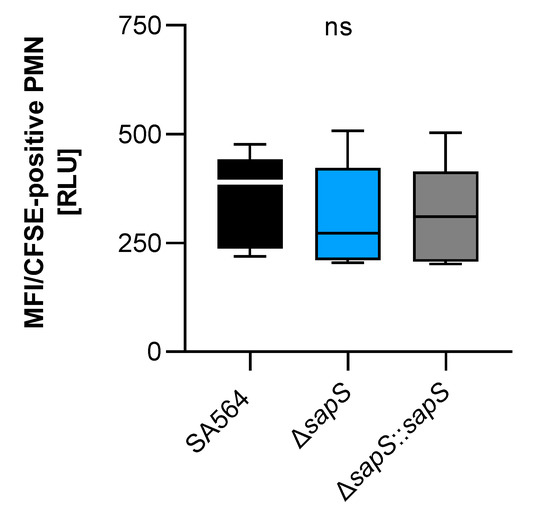
Figure 7.
Impact of SapS on the phagocytosis of S.aureus strain SA564 by polymorphonuclear leukocytes (PMNs). The cells of S. aureus were labeled with carboxyfluorescein diacetate succinimidyl ester (CFSE) and mixed to lithium heparin-anticoagulated fresh human blood at a multiplicity of infection of 50 per PMN, and maintained at 37 °C and 1000 rpm. Using flow cytometry, as described in the Material and Methods section, the adhesion and ingestion of bacteria by PMNs was examined. The data show three biological replicates that were performed in triplicate. Data are presented as box and whisker plots showing the interquartile range (25–75%; box), median (horizontal line), and whiskers (bars; min/max). ns, not significant (Kruskal–Wallis test followed by Dunn’s post hoc test).
2.6. The Ability of S. aureus to Survive in the Presence of Oxidative Stress Is Influenced by SapS
S. aureus cells that have been phagocytosed by macrophages typically end up in phagolysosomes, where they are subjected to various stresses, including a low pH and reactive oxygen species (ROS) [35]. On the basis of our findings that S. aureus cells without a functional sapS gene had a reduced capability to survive inside RAW264.7 macrophages (Figure 1C,D), we considered the possibility that SapS might influence the capacity of S. aureus to respond to oxidative stress. In order to test this hypothesis, SA564 derivatives were cultivated in TSB for 2 h and then subjected to 50 mM hydrogen peroxide for an additional hour. Our results show that the ∆sapS derivative produced clearly lower CFU rates one hour after the H2O2 challenge than WT cells, while the cis-complemented strain displayed CFU rates comparable to the WT (Figure 8). These findings demonstrate that SapS has an effect on S. aureus capacity to cope with oxidative stress during growth, at least in vitro, similarly to the S. aureus PtpB phosphatase in this organism [27].
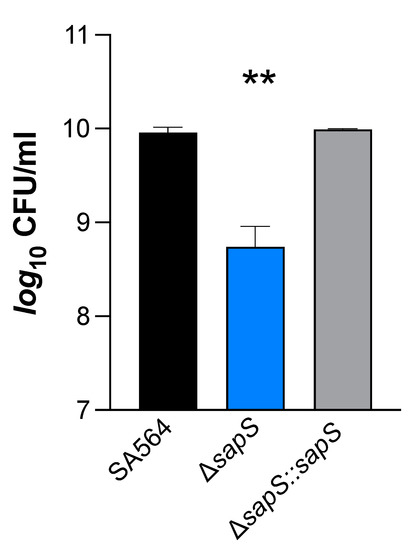
Figure 8.
Impact of H2O2 on S. aureus SA564 ΔsapS survival. Cells of S. aureus SA564 (black), SA564 ΔsapS (blue), and SA564 ΔsapS::sapS (grey) were grown in TSB at 37 °C and 225 rpm for 2 h, then were challenged with 50 mM H2O2, and the CFU counts of the cultures were evaluated at 1 h after the H2O2 challenge. The data displayed are the mean + SD of four biological experiments. **, p < 0.01 (Ordinary One-Way ANOVA test).
To test whether ROS detoxifying enzymes/factors such as alkyl hydroperoxide reductase, catalase, staphyloxanthin, and superoxide dismutase might contribute to this phenotype, we determined the transcription of genes encoding for these enzymes (Figure 9). During transcription monitoring of these genes in WT and ∆sapS cells grown in TSB, we indeed noticed some transcriptional changes for ahpC and katA between the WT and the ∆sapS mutant, which, however, were all on a more minor scale (i.e., ≤3-fold) and only seen for certain growth stages.
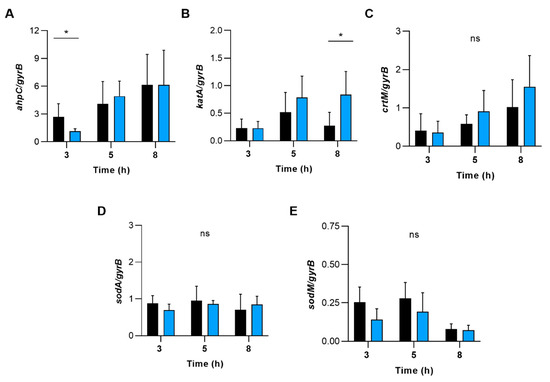
Figure 9.
The effect of deleting the sapS gene in S. aureus on the transcription of genes that code for enzymes involved in the detoxification of reactive oxygen species (ROS). qRT-PCR was used to conduct quantitative transcript analyses of ahpC (A), katA (B), crtM (C), sodA (D) and sodM (E) in SA564 (black bars) and SA564 ΔsapS (blue bars) cells cultured in TSB at 37 °C and 225 rpm at the time points indicated. Quantification of the transcripts was performed in relation to the transcription of gyrase B (in copies per copy of gyrB). The data are shown as mean + SD of five biological replicates. ns, not significant; * p < 0.05 (Mann-Whitney U test between WT and mutant at a given time point).
2.7. SapS Is Involved in S. aureus SA564 Biofilm Formation
S. aureus can form biofilms, which have been considered to be an important factor in its pathogenicity [36]. Therefore, we investigated whether SapS might have an impact on biofilm formation. We first tested the capacity of the strain triplet to form biofilms using a static microplate-based biofilm model as previously reported [37]. While the WT and the cis-complemented strain developed robust biofilms on the microtiter plate’s bottom wells after 48 h of growth in BHI, we observed a significantly lower biomass in wells inoculated with the sapS mutant (Figure 10A), indicating that SapS provides a favourable contribution to the capacity of S. aureus to produce biofilms. To confirm this effect of SapS on biofilm formation of SA564 in a more clinically relevant model, we examine the potential of the WT and its sapS variants to form biofilms on pieces of peripheral venous catheter (PVC) under conditions where there was an abundance of nutrients (Figure 10B–D). In this assay, all three strains generated macroscopically visible vegetation on the PVC surfaces (Figure 10B), although the vegetation formed by the WT and the cis-complemented derivative on the PVC surface appeared stronger than those seen with the ΔsapS mutant. These macroscopic observations were essentially confirmed by OD600 and CFU determinations (Figure 10C,D). TSB solutions harbouring the detached biofilms of the ΔsapS mutant produced significantly lower OD600 readings than biofilms of the WT (Figure 10C), and this trend was also seen for the numbers viable bacteria that were detached from the PVC tubing (Figure 10D), which were about 1/3 lower for the ΔsapS mutant if compared to the WT, despite the fact that this effect was not significant according to the statistics (p = 0.2567, Kruskal–Wallis test and Dunn’s posthoc test).
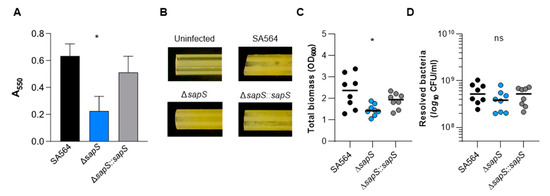
Figure 10.
Impact of a sapS deletion on S. aureus SA564 ability to produce biofilms. (A) Cells of S. aureus SA564 (black), SA564 ΔsapS (blue), and SA564 ΔsapS::sapS (grey) were cultivated in BHI for 48 h at 37 °C in a humid atmosphere using 96-well microtiter plates. The crystal violet assay was used to evaluate the entire biofilm formation. The optical density (550 nm) and the production of biofilm are directly correlated. The presentation includes the means as well as the standard errors for a total of six different replicates. (B–D) Influence of SapS on the ability of S. aureus SA564 to build biofilms on medical devices. (B) Photographs of fragments of S. aureus-loaded peripheral venous catheters (PVC) taken on day 5 after the initial inoculation (6.3-fold magnification). These findings are indicative of three separate tests. An uninfected PVC fragment incubated for 5 days in sterile medium served as control. (C,D) Total biomass and CFU rates of detached biofilms were calculated by measuring the OD600 of the TSB solutions (B) and plate counting (D). The values of each individual experiment are represented by symbols, along with the median value (horizontal line) (n = 8). *, p < 0.05; ns, not significant (Kruskal–Wallis test and Dunn’s post hoc test, only the changes between SA564 and mutants are displayed).
2.8. S. aureus SapS Phosphatase Activity Relies on a Very Specific Aspartate Residue in Its Catalytic Loop but Its Activity Is Dispensable for In Vivo Survival
SapS from S. aureus was previously identified as an acid phosphatase [18], and its phosphatase function was revealed by the presence of structural motifs typical for acid phosphatases (Figure S2) that are responsible for the transfer of phosphoryl groups from phosphomonoesters to water when the pH is acidic [19]. SapS belongs to the Non-Specific Acid Phosphatases (NSAPs) family, which corresponds to one subgroup of these ubiquitous phosphatases, that are secreted across the cytoplasmic membrane and exhibit optimal catalytic activity at acidic pH [38,39]. NSAPs are a separate class of phosphatases that are divided into three categories [38]. The signature of class C enzymes is composed of four aspartate residues named DDDD motif that are highly conserved (bold). These aspartate residues are located within a bipartite motif that consists of (I/V)-(V/A/L)-D-(I/L)-D-ET-(V/M)-L-X-(N/T)-X-X-Y located near the N terminus and (I/V)-(L/ M)-X-X-G-D-(N/T)-L-X-D-F close to the C terminus, both connected by a polypeptide linker region with variable length [38]. As shown in Figure S2, SapS possesses this signature motif and is therefore a Class C phosphatase. As demonstrated with orthologues [40,41,42], we assumed that the Asp residue at position 103 in SapS is mainly responsible for its phosphatase activity. To investigate the impact of Asp103 (the catalytically active Asp residue of the conserved DDDD pattern) on SapS phosphatase activity, we created the vector pLI50_sapS_D103A, harbouring a sapS open reading frame (orf) in which Asp103 was changed to alanine. Cells of S. aureus SA564, SA564 ΔsapS, SA564 ΔsapS + pLI50_sapS and SA564 ΔsapS + pLI50_sapS_D103A were grown in TSB at 37 °C until exponential phase, centrifuged, lysed and total crude extracts were used for phosphatase activity assays with the universal phosphate donor PNPP (Para-NitroPhenylPhosphate) (Figure 11A). In contrast to the ΔsapS mutant strain trans-complemented with the sapS wild-type gene, which produced high levels of PNPP hydrolyase activity, this was not the case with the ΔsapS mutant strain trans-complemented with the sapS gene harbouring the D103A orf, which produced a PNPP hydrolyase activity comparable to the SA564 ΔsapS mutant. These findings confirm earlier findings demonstrating that the S. aureus SapS homolog is a phosphatase [18], and strongly support our hypothesis that residue D103 is critical for the phosphatase activity of SapS.
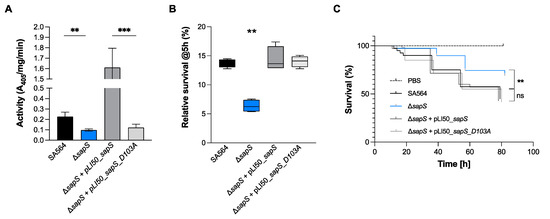
Figure 11.
SapS phosphatase activity depends on the D103 residue and is neither implicated in the intramacrophage survival potential nor infectivity of S. aureus in zebrafish. (A) Cells of S. aureus SA564 (black), SA564 ΔsapS (blue), SA564 ΔsapS + pLI50_SapS-Spot (dark grey) and SA564 ΔsapS + pLI50_SapS_D103A-Spot (light grey) were grown in TSB at 37 °C until exponential phase, centrifuged, lysed and total crude extracts were used for phosphatase activity assays on PNPP. Data are presented as mean + SD of three biological replicates. **, p < 0.01; *** (Mann–Whitney U test). (B) Survival of S. aureus in infected macrophages. Survival rates are expressed as a percentage of the intracellular bacterial cell counts that were obtained immediately after the gentamicin/lysostaphin treatment, which was fixed to 100%. The data are presented as box and whisker plot showing the interquartile range (25–75%, box), the median (horizontal line) and the standard deviation (bars) of 4 different experiments. **, p < 0.01 (Ordinary two-way ANOVA test). (C) Kaplan–Meier representation of the survival of zebrafish embryos infected by injection into the duct of Cuvier with at 3 × 10² CFU/nL cultured in exponential phase, or PBS (negative control) The proportion of surviving embryos (n = 50 for each, indicative of three separate experiments) is employed to express the results. **, p < 0.01, ns, not significant (Log-rank Mantel–Cox statistical test). hpi, hours post-infection.
To test whether SapS phosphatase activity is needed for in vivo survival of S. aureus within macrophages, we measured the S. aureus survival rates of WT and sapS mutant derivatives within RAW 264.7 cells at 5 h pGt (Figure 11B). Similar to our findings presented in Figure 1C,D, we again observed a significant decrease in intracellular survival of ΔsapS mutant cells in RAW 264.7 cells at 5 h pGt in this series of experiments, while trans-complementation of the sapS mutant with plasmid pLI50_sapS restored intracellular survival rates comparable to those of the WT strain (Figure 11B). Notably, a survival rate comparable to WT cells was also seen, when the sapS mutant was trans-complemented with the plasmid expressing the D103A derivative (pLI50_sapS_D103A), suggesting that SapS phosphatase activity is not important for this intracellular survival phenotype in macrophage cells. Given these findings, we wondered whether the phosphatase activity of SapS might play a role for infectivity of S. aureus in zebrafish. Similar to our observations made with the macrophage survival assays, we observed similar killing rates when larvae were infected with the WT and the trans-complemented ΔsapS derivative harboring plasmid pLI50_SapS_D103A (Figure 11C), indicating that SapS phosphatase activity is also not important for infectivity of S. aureus in this in vivo model of infection.
3. Materials and Methods
3.1. Bacterial Strains, Media, and Growth Conditions
Table 1 contains the bacterial strains, plasmids, and primers that were utilised for this research. The mutant strains and plasmids that were created for the purpose of this study were all sequenced to verify their authenticity. The Escherichia coli strains were cultured in Luria-Bertani (LB) broth at 37 °C. Isolates of S. aureus were either plated on Tryptic Soy Agar (TSA) or cultured in Tryptic Soy Broth (TSB) at 37 °C, 225 rpm, at a culture to flask volume of 1:10. Ampicillin was utilised at a concentration of 100 µg/mL, while chloramphenicol was employed at a concentration of 10 µg/mL for the purpose of strain construction and phenotypic selection.

Table 1.
Strains, plasmids, and primers used in this study.
3.2. Construction of the S. aureus sapS Deletion and Complementation Strains
Using primer pairs #34/#55 and #36/#37 (Table 2), respectively, one-kilobase segments comprising the flanking regions of the sapS (NWMN_0249) gene were produced by PCR from the chromosomal DNA of the S. aureus strain Newman. The purified PCR fragments were Gibson cloned into the EcoRI/XhoI digested pIMAY* vector, to generate pIMAY*_∆sapS. This fusion construct contained the first and last 15 bases of sapS and thus created a non-functional truncated ORF with flanking regions. The plasmid was propagated in E. coli IM08B [44] and electroporated into S. aureus strain SA564 [43]. The allelic exchange procedure was performed as described in [45] to generate the SA564 ∆sapS mutant strain.
Table 2.
Primers used in this study.
In order to construct the complementation plasmid pLI50_SapS-Spot, the sapS gene, comprising its promoter region, was amplified by PCR with the primers #85/#77 by using chromosomal DNA of the S. aureus strain Newman as a template. The Spot fragment was amplified by PCR with the primers #78/86 using the pSpot2 vector as a template (Chromotek). The purified PCR fragments were Gibson cloned into the KpnI/BamHI digested pLI50 vector [47]. The pLI50_SapS_D103A-Spot plasmid derivative harbouring aspartate to alanine substitution was generated by Gibson assembly of the amplified PCR products using pLI50_SapS-Spot plasmid DNA as a template with primer pairs #85/#116 and #117/#86, respectively. The pLI50_SapS-Spot derivative plasmids were transformed in E. coli IM08B and electroporated into S. aureus strain SA564 ∆sapS.
For the construction of the integrative complementation plasmid pJB38NWMN2930_SapS-Spot, the sapS gene, including its promoter region, and the fused Spot-tag at the C-terminus, was amplified using primers #85/#86 and pLI50_SapS-Spot plasmid DNA as a template. The purified PCR fragment was phosphorylated and cloned into the EcoRV digested pJB38NWMN2930 vector [46]. The allelic exchange protocol was realised as previously detailed to generate the SA564 ∆sapS::sapS complemented strain [46].
3.3. Macrophage Culture and Infection
The mouse macrophage cell line RAW 264.7 (mouse leukemic monocyte macro-phage, ATCC TIB-71) was grown in Dulbecco’s modified Eagle’s medium (DMEM) (Thermo Fisher Scientific, Dreieich, Germany), which was complemented with 10% foetal calf serum (Thermo Fisher Scientific), at 37 °C in a humid atmosphere with 5% carbon dioxide. For infected macrophages, S. aureus strain SA564 and its derivatives were grown in TSB medium until they reached the mid-exponential growth stage (OD600 = 0.7–0.9). After being collected and centrifuged for 5 min at 4000 rpm, the bacteria were then washed in sterile PBS, centrifuged for 4 min at 10,000 rpm, and lastly reconstituted in sterile PBS. RAW 264.7 cells were infected with S. aureus SA564 or its derivatives at a multiplicity of infection (MOI) of 20:1 (bacteria/cells) and then incubated for one hour at 37 °C and 5% carbon dioxide. There were 2.5 × 10⁵ cells in each well of the 24-well plates. Afterwards, cells were rinsed one more time with PBS, and then the extracellular bacteria were eradicated by incubating the cells for 30 min with gentamicin at a concentration of 100 µg/mL. After being treated with gentamicin, macrophages were washed two times in PBS (T0), followed by an incubation period of 5h in fresh medium containing 5 µg/mL of lysostaphin. After this incubation period, macrophages were lysed with 0.1% Triton X-100 in PBS. Intracellular bacteria was determined by plating out serially diluted macrophage lysates on TSB agar plates, which were incubated for 24 h at 37 °C. For macrophage lysates immunoprecipitation, at 3 h or 5 h pGt. Infected macrophages were lysed in 0.1 %Triton X-100, and centrifuged at 14,000× g. At 3 h and 5 h pGt, infected macrophages were lysed in 0.1% Triton X-100 and centrifuged at 14,000× g for macrophage lysates immunoprecipitation. Anti-Spot magnetic beads (Chromotek) were used to immunoprecipitate the resulting supernatants, and the bacterial pellets corresponding to intracellular bacteria were resuspended in an equivalent volume of lysis buffer.
3.4. Infection of Zebrafish Embryos
The S. aureus SA564 and derivative strains were cultivated overnight at 37 °C in TSB medium. Cultures were diluted 1:20 and grown in TSB medium until they reached the mid-exponential growth phase (OD600 = 0.7–0.9). Once the bacteria had been centrifuged for 10 min at 4000 rpm, they were resuspended in PBS at the desired concentration (around 2 × 10⁸ bacteria/mL). The injected suspension was prepared by addition of phenol Red (Sigma, P0290-100 mL, 0.5% phenol red solution diluted 0,1 % in the injected solution) and fluorescent dye (Dextran, tetramethylrhodamine, 10,000 MW, anionic, D-1868 Invitrogen, 30 µM in the injected solution) to help following the injection procedure. The GAB zebrafish line was used in the experiments, which were performed in fish water at 28 °C. Embryos were infected by injecting 1 nL of bacterial suspensions into the duct of Cuvier of 50 hpf embryos, which had been previously dechorionated and sedated with tricaine (0.3 mg/mL). Each injected embryo was then placed in a separate well of 96 wells microtiter plate. In order to verify the quantity of bacteria present in each injection, the same amount was injected into 200 µL of PBS, and the number of CFU was quantified using TSB agar plates. The number of dead embryos was visually counted in order to evaluate survival kinetics following infection depending on the disappearance of heartbeat.
3.5. Murine Abscess Model
Experiments on animals were conducted with the authorization of the local State Review Board in the state of Saarland, Germany, and were conducted in accordance with the national and European standards for the ethical and decent animal experimentation. Both the production of the bacterial inoculum and the infection of the mice were performed as previously described [27]. Briefly, 100 µL of bacterial culture that contained ~107 colony forming units (CFU) of exponential growth phase cells were injected retro-orbitally into female C57BL/6N mice (Charles River, Sulzfeld, Germany) between the ages of 8 and 10 weeks old while they were anesthetised with 3.5% isoflurane (Baxter, Unterschleißheim, Germany). The infected mice were treated with a dose of carprofen (5 mg/kg; Zoetis, Berlin, Germany) shortly after infection. At day four after infection, mice were killed, and their livers and kidneys were collected. The organs were weight normalised and homogenised in PBS (Thermo Fisher, Dreieich, Germany). Afterwards, successive dilutions of the homogenates were plated on blood agar plates in order to enumerate the CFU rates in the organs. Tissue homogenates were subsequently centrifuged for 5 min at 5000× g and 4 °C, and supernatants used for MPO, KC, and TNF-α determination utilising commercial ELISA kits from R&D System (Wiesbaden, Germany), according to the manufacturer’s instructions, and as described in [48]. Tissue homogenates obtained from 10- to 12-week-old C57BL/6N mice served as uninfected controls.
3.6. Determination of Immune Cell Contents in Blood of Mice
Blood was collected when mice were sacrificed at day 4 post infection. Four 10- to 12-week-old C57BL/6N mice served as uninfected control. Red blood cells (RBCs) were lysed with ACK RBCs lysis buffer (Thermo Fisher Scientific, Karlsruhe, Germany). The remaining blood cells were fixed with 1% paraformaldehyde in PBS solution and resuspended in FACS buffer composed of 0.1 mM EDTA and 1% fetal bovine serum (FBS) dissolved in PBS. Blood cells were then incubated in Fc-blocking solution (CD16/CD32 Antibody, Thermo Fisher Scientific) for 40 min at 4 °C, and subsequently stained for 45 min at 4 °C with the following fluorochrome-conjugated antibodies: F4/80-PECy7 (clone BM8), CD45-PerCP-Cy5.5 (clone 30-F11), CD11b-FITC (clone M1/70), CD86-PE (clone GL1), CD11c-Super Bright 436 (clone N418) LY6G-APC (1A8-Ly6g), CD3- eFluor™ 450 (clone 17A2), CD4-FITC (clone RM4-5), CD8-PECy7 (clone 53-6.7), CD45R-PE-eFluor™ 610 (clone RA3-6B2), and NK1.1- APC (clone PK136). All fluorochrome-conjugated antibodies were brought from eBioscience (Thermo Fisher Scientific). Flow cytometric analysis was performed using the BD FACSverse machine, and the data collected were analysed with the software Flowjo v10.6.2 (Becton Dickinson, Franklin Lakes, NJ, USA).
3.7. Analysis of Phagocytosis in Human Whole Blood
The ingestion of S. aureus cells by PMNs in whole blood was performed in accordance with the procedures outlined in [49]. Overnight cultures of S. aureus strains were inoculated into fresh TSB and grown at 37 °C and 225 rpm to mid-exponential growth-phase. Bacterial cells were harvested by centrifugation at 10,000× g for 5 min and washed three times with PBS. Bacterial cells were next stained with a 50 µM carboxy fluorescein diacetate succinimidyl ester (CFSE; Invitrogen, Darmstadt, Germany); PBS solution for 15 min at 37 °C and 1000 rpm. After that, the CFSE-stained bacterial cells were washed once more with PBS three times to remove any remaining unbound dye, and the OD600 was adjusted to a value of 1. The PMN content of the blood sample was assessed by using the RAL DIFF-QUICK kit (RAL Diagnostics, Martillac, France) in accordance with the recommendations provided by the manufacturer after fresh human whole blood was drawn from healthy donors and anticoagulated with lithium heparin (S-Monovette; Sarstedt, Nümbrecht, Germany). Blood samples were inoculated with fluorescently labelled bacteria at a MOI of 50 per PMN, and cultivated in the dark at 37 °C and 1000 rpm for 30 min. The cell suspensions were transferred into 5 mL round bottom polystyrene tubes (BD), the erythrocytes were lysed by the addition of FACS lysis solution (BD), and the lysed cell debris were eliminated by centrifugation at 450× g for 5 min. Flow cytometry was performed on the cell pellets after they were resuspended in PBS that included 2% foetal calf serum (PAA, Pasching, Germany) and 0.05% sodium azide. The analysis was performed on a FACSCalibur (BD) device. The CellQuest Pro Software version 4.02 (BD) was used to gate PMNs, and the mean fluorescence intensity (MFI) of each PMN was recorded. This value represents the amount of bacteria that were either adhered to or ingested by the leukocyte.
3.8. Measurement of Gene Expression by qRT-PCR
Following the procedures described previously [50], RNA isolation, cDNA synthesis, and qRT-PCR were performed using the primer pairs provided in Table 2. Quantification of the transcripts was performed in relation to the transcription of gyrase B (in copies per copy of gyrB).
3.9. Cell Fractionation and Immunoblotting
Bacteria were cultivated up to the exponential phase in TSB at 37 °C with shaking (160 rpm) and cultures were centrifuged after 2 h of growth at 4000 rpm for 10 min. The culture supernatant was transferred to another tube and Spot-fusion proteins were immunoprecipitated with anti-Spot beads (Chromotek) at 4 °C on a rotating wheel for 3 h (IP). The bacterial pellet was washed twice with phosphate buffered saline (PBS) and resuspended in digestion buffer (50 mM Tris-HCl, 20 mM MgCl2, 30% [wt/vol] raffinose; pH 7.5) containing complete mini-EDTA-free protease inhibitors (Roche). Cell wall proteins were digested with lysostaphin (200 µg/mL) for 30 min at 37 °C to solubilise them. Centrifugation at 5000× g for 15 min was used to collect the protoplasts, and the supernatant was preserved as the cell wall fraction (W). Protoplast pellets were rinsed in digestion buffer once, sedimented (5000× g, 15 min), and then resuspended in ice-cold lysis buffer (50 mM Tris-HCl [pH 7.5]) with protease inhibitors and DNase (80 µg/mL). Freeze-thaw cycles were used to lyse the protoplasts. Membranes were separated from cell lysates by ultracentrifugation at 150,000× g for 40 min. While the pellet (membrane fraction, M) was suspended in Tris-buffer, the supernatant (cytosolic fraction, C) was transferred to a new tube. Protein samples were migrated on an SDS-PAGE gel and then transferred to polyvinylidene fluoride (PVDF) membranes for immunoblotting. In TBST (25 mM Tris/HCl pH 7.6, 150 mM NaCl, 0.05% TWEEN), the membrane was blocked with 50% human serum (Sigma, ref. H3667) and 3% BSA for an overnight incubation at 4 °C. The membrane was then incubated for 1 h with monoclonal mouse anti-Spot antibody (1:5000, Chromotek) diluted in 3% BSA in TBST. Afterwards, the membrane was washed 3 times in TBST and the secondary HRP coupled donkey anti-mouse antibody (1:5000, Jackson Immuno Research ref. 715-035-151) was incubated for 1 h in 3% BSA in TBST. After washing the membrane three times in TBST, the HRP signal was detected by Pierce ECL Western Blotting substrate.
3.10. SapS Phosphatase Activity Assay
On crude extracts of S. aureus SA564 and its derivatives, the phosphatase activity was measured using a technique based on the detection of p-nitrophenol (PNP), which is produced by the cleavage of p-nitrophenyl phosphate (PNPP). Tests were conducted in a buffer at pH 5.0 containing 4 mM PNPP, and 100 mM sodium citrate. 35 µg of crude extract was added to start the reaction, which was then allowed to sit in 96-well microplates for 25 min. Using a Tecan fluorimeter (Tecan, Model Spark, Grodig, Austria GmbH ) microplate reader, the phosphatase reaction was observed at 405 nm (absorption maximum of the produced PNP). All experiments were done at least in triplicate.
3.11. H2O2 Susceptibility Assays
After culturing bacterial cells in TSB for 2 h at 37 °C and 225 rpm, the bacteria were exposed to H2O2 to a final concentration of 50 mM for 1 h. Plate counting was used to estimate the CFU rates of the cultures after the allotted period of incubation had passed.
3.12. Biofilm Assays
Crystal Violet Biofilm Assay: Biofilm formation was assessed using the method outlined in [37]. After an overnight incubation at 37 °C and a dilution to obtain a final optical density of 0.1 at OD600, biofilm development was assessed by incubating 200 µL of bacterial cultures in 96-well microtiter plates in BHI. The plates were placed in a humid container and incubated at 37 °C for a period of 48 h. Following incubation, adherent cells were washed with PBS, allowed to air dry, and then resuspended with a crystal violet (0.1%) solution and left at room temperature for 20 min. In order to dissolve the biofilm, 100 µL of acetic acid at a concentration of 33% was applied to each well, and the measurement of absorbance was performed using a Tecan equipment (Tecan, Model Spark, Grodig, Austria GmbH) at OD550 nm.
Following the methodology given in [51], the formation of biofilms on medical devices was conducted under dynamic conditions. PVC (Venflon Pro Safety 18 G; Becton Dickinson, USA) fragments measuring 1 cm in length were positioned into reaction tubes containing 1 mL of TSB. These tubes were then inoculated with 5 × 10⁵ CFU of TSB-washed bacterial cells obtained from the exponential growth phase (2.5 h of growth at 37 °C and 225 rpm). An uninfected PVC fragment served as control. PVC pieces were kept in an incubator for 5 days at 37 °C and 150 rpm, and the medium was changed out every 24 h. On day five, PVC fragments were inserted into fresh reaction tubes that were filled with 1 mL of TSB. Biofilms were removed from the surface of the catheter and resolved by sonication (50 watts for 5 min) followed by vortexing for 1 min. Plate counting was used to assess CFU rates and OD600 readings were used to determine the biomass of dissolved biofilms.
3.13. Statistical Analyses
Prism 6.01 software (GraphPad, USA) was utilised to determine the statistical significance of differences among groups, as shown in the figure legends.
4. Conclusions
S. aureus is able to produce a broad variety of disease patterns because it has a vast arsenal of virulence factors [52,53], which provide the pathogen with the ability to penetrate or escape the immune system, attach to surfaces, and create detrimental toxic effects on the host. Interestingly, our recent research showed that PtpA, a low-molecular-weight protein tyrosine phosphatase, that is produced by S. aureus was secreted during growth and is related to the pathogenicity of this pathogen [16]. Our findings, which are presented here, show that the knockout of sapS in the S. aureus clinical isolate SA564 affects the survival in vitro and virulence in infection animal models. This leads us to conclude that the secreted SapS phosphatase is significant for the process of infection as well as the intracellular survival of S. aureus. Furthermore, mutational studies show that the phosphatase activity of SapS is not needed for the infectivity promoting activity of this protein, leaving the question open as to how Saps contributes on the molecular level favourably to S. aureus pathogenicity. However, given its clear impact on biofilm formation and infectivity of S. aureus, SapS represents a novel and promising new target for therapeutic development to fight against this well-known human pathogen.
Supplementary Materials
The following supporting information can be downloaded at https://www.mdpi.com/article/10.3390/ijms232214031/s1.
Author Contributions
Conceptualization, V.M. and M.B.; methodology, N.A.-M., M.I.E., S.H.-B., M.B., L.G.-Z. and V.M.; formal analysis, M.B. and V.M.; investigation, M.M. (Marianne Martin), N.A.-M., S.H.-B., N.Y., N.A.-W., L.P., M.I.E., A.A., M.M. (Madjid Morsli) and D.Y.; resources, S.L.B., D.Y., G.K.-C., J.-P.L., M.B. and V.M.; writing—original draft preparation, V.M.; writing—review and editing, N.A.-M., M.B. and V.M. All authors have read and agreed to the published version of the manuscript.
Funding
N.A.M. Ph.D. is supported by the Fondation de Coopération Scientifique, Méditerranée-Infection (Marseille IHU grant). M.I.E. acknowledges support by the German Egyptian Research Long-Term Scholarship Program (GERLS). N.A.W. and A.A. acknowledge support by the UdS-HIPS TANDEM Initiative provided by the Helmholtz Institute for Pharmaceutical Research Saarland (HIPS) and Saarland University (UdS). M.B. and G.K.C. acknowledge support by the German Research Foundation (DFG SFB TRR 152 project project P22 and KR4338/1-2 to GKC) and by the UdS-HIPS-Tandem (to MB and GKC).
Institutional Review Board Statement
Testing the bacterial uptake rates by polymorphonuclear leukocytes in human whole blood samples was conducted according to the guidelines of the Declaration of Helsinki and approved by the Ethics Committee of the Medical Association of Saarland (code number 39/20, approved 25 February 2020). Animal experiments were performed with approval of the local State Review Board of Saarland, Germany (project identification code 60/2015 (approved 21 December 2015)) and conducted following the national and European guidelines for the ethical and human treatment of animals.
Informed Consent Statement
Informed consent was obtained from all subjects involved in the study.
Data Availability Statement
The datasets generated during and/or analysed during the current study are available from the corresponding author on reasonable request.
Conflicts of Interest
The authors declare no conflict of interest.
References
- Lowy, F.D. Staphylococcus aureus Infections. N. Engl. J. Med. 1998, 339, 520–532. [Google Scholar] [CrossRef] [PubMed]
- Tong, S.Y.C.; Davis, J.S.; Eichenberger, E.; Holland, T.L.; Fowler, V.G. Staphylococcus aureus Infections: Epidemiology, Pathophysiology, Clinical Manifestations, and Management. Clin. Microbiol. Rev. 2015, 28, 603–661. [Google Scholar] [CrossRef] [PubMed]
- Patti, J.M.; Allen, B.L.; McGavin, M.J.; Höök, M. MSCRAMM-Mediated Adherence of Microorganisms to Host Tissues. Annu. Rev. Microbiol. 1994, 48, 585–617. [Google Scholar] [CrossRef] [PubMed]
- Chavakis, T.; Preissner, K.T.; Herrmann, M. The Anti-Inflammatory Activities of Staphylococcus aureus. Trends Immunol. 2007, 28, 408–418. [Google Scholar] [CrossRef]
- Ahmad-Mansour, N.; Loubet, P.; Pouget, C.; Dunyach-Remy, C.; Sotto, A.; Lavigne, J.-P.; Molle, V. Staphylococcus aureus Toxins: An Update on Their Pathogenic Properties and Potential Treatments. Toxins 2021, 13, 677. [Google Scholar] [CrossRef] [PubMed]
- Serruto, D.; Rappuoli, R.; Scarselli, M.; Gros, P.; van Strijp, J.A.G. Molecular Mechanisms of Complement Evasion: Learning from Staphylococci and Meningococci. Nat. Rev. Microbiol. 2010, 8, 393–399. [Google Scholar] [CrossRef]
- Prince, A.; Wong Fok Lung, T. Consequences of Metabolic Interactions during Staphylococcus aureus Infection. Toxins 2020, 12, 581. [Google Scholar] [CrossRef] [PubMed]
- Prince, A.; Wang, H.; Kitur, K.; Parker, D. Humanized Mice Exhibit Increased Susceptibility to Staphylococcus aureus Pneumonia. J. Infect. Dis. 2017, 215, 1386–1395. [Google Scholar] [CrossRef]
- Tomlinson, K.L.; Prince, A.S.; Wong Fok Lung, T. Immunometabolites Drive Bacterial Adaptation to the Airway. Front. Immunol. 2021, 12, 790574. [Google Scholar] [CrossRef] [PubMed]
- Flannagan, R.S.; Heit, B.; Heinrichs, D.E. Antimicrobial Mechanisms of Macrophages and the Immune Evasion Strategies of Staphylococcus aureus. Pathogens 2015, 4, 826–868. [Google Scholar] [CrossRef]
- Bach, H.; Papavinasasundaram, K.G.; Wong, D.; Hmama, Z.; Av-Gay, Y. Mycobacterium tuberculosis Virulence Is Mediated by PtpA Dephosphorylation of Human Vacuolar Protein Sorting 33B. Cell Host Microbe 2008, 3, 316–322. [Google Scholar] [CrossRef] [PubMed]
- Heneberg, P. Finding the Smoking Gun: Protein Tyrosine Phosphatases as Tools and Targets of Unicellular Microorganisms and Viruses. Curr. Med. Chem. 2012, 19, 1530–1566. [Google Scholar] [CrossRef] [PubMed]
- Dai, S.; Mohapatra, N.P.; Schlesinger, L.S.; Gunn, J.S. The Acid Phosphatase AcpA Is Secreted In Vitro and in Macrophages by Francisella spp. Infect. Immun. 2012, 80, 1088–1097. [Google Scholar] [CrossRef] [PubMed]
- Whitmore, S.E.; Lamont, R.J. Tyrosine Phosphorylation and Bacterial Virulence. Int. J. Oral Sci. 2012, 4, 1–6. [Google Scholar] [CrossRef][Green Version]
- Wong, D.; Chao, J.D.; Av-Gay, Y. Mycobacterium tuberculosis-Secreted Phosphatases: From Pathogenesis to Targets for TB Drug Development. Trends Microbiol. 2013, 21, 100–109. [Google Scholar] [CrossRef]
- Gannoun-Zaki, L.; Pätzold, L.; Huc-Brandt, S.; Baronian, G.; Elhawy, M.I.; Gaupp, R.; Martin, M.; Blanc-Potard, A.-B.; Letourneur, F.; Bischoff, M.; et al. PtpA, a Secreted Tyrosine Phosphatase from Staphylococcus aureus, Contributes to Virulence and Interacts with Coronin-1A during Infection. J. Biol. Chem. 2018, 293, 15569–15580. [Google Scholar] [CrossRef]
- Brelle, S.; Baronian, G.; Huc-Brandt, S.; Zaki, L.G.; Cohen-Gonsaud, M.; Bischoff, M.; Molle, V. Phosphorylation-Mediated Regulation of the Staphylococcus aureus Secreted Tyrosine Phosphatase PtpA. Biochem. Biophys. Res. Commun. 2016, 469, 619–625. [Google Scholar] [CrossRef]
- du Plessis, E.M.; Theron, J.; Joubert, L.; Lotter, T.; Watson, T.G. Characterization of a Phosphatase Secreted by Staphylococcus aureus Strain 154, a New Member of the Bacterial Class C Family of Nonspecific Acid Phosphatases. Syst. Appl. Microbiol. 2002, 25, 21–30. [Google Scholar] [CrossRef]
- Vincent, J.B.; Crowder, M.W.; Averill, B.A. Hydrolysis of Phosphate Monoesters: A Biological Problem with Multiple Chemical Solutions. Trends Biochem. Sci. 1992, 17, 105–110. [Google Scholar] [CrossRef]
- Saha, A.K.; Dowling, J.N.; LaMarco, K.L.; Das, S.; Remaley, A.T.; Olomu, N.; Pope, M.T.; Glew, R.H. Properties of an Acid Phosphatase from Legionella Micdadei Which Blocks Superoxide Anion Production by Human Neutrophils. Arch. Biochem. Biophys. 1985, 243, 150–160. [Google Scholar] [CrossRef]
- Remaley, A.T.; Glew, R.H.; Kuhns, D.B.; Basford, R.E.; Waggoner, A.S.; Ernst, L.A.; Pope, M. Leishmania Donovani: Surface Membrane Acid Phosphatase Blocks Neutrophil Oxidative Metabolite Production. Exp. Parasitol. 1985, 60, 331–341. [Google Scholar] [CrossRef]
- Baca, O.G.; Roman, M.J.; Glew, R.H.; Christner, R.F.; Buhler, J.E.; Aragon, A.S. Acid Phosphatase Activity in Coxiella burnetii: A Possible Virulence Factor. Infect. Immun. 1993, 61, 4232–4239. [Google Scholar] [CrossRef] [PubMed]
- Jungnitz, H.; West, N.P.; Walker, M.J.; Chhatwal, G.S.; Guzmán, C.A. A Second Two-Component Regulatory System of Bordetella bronchiseptica Required for Bacterial Resistance to Oxidative Stress, Production of Acid Phosphatase, and in Vivo Persistence. Infect. Immun. 1998, 66, 4640–4650. [Google Scholar] [CrossRef] [PubMed]
- Saleh, M.T.; Belisle, J.T. Secretion of an Acid Phosphatase (SapM) by Mycobacterium Tuberculosis That Is Similar to Eukaryotic Acid Phosphatases. J. Bacteriol. 2000, 182, 6850–6853. [Google Scholar] [CrossRef] [PubMed]
- Aragon, V.; Kurtz, S.; Cianciotto, N.P. Legionella pneumophila Major Acid Phosphatase and Its Role in Intracellular Infection. Infect. Immun. 2001, 69, 177–185. [Google Scholar] [CrossRef]
- Burtnick, M.; Bolton, A.; Brett, P.; Watanabe, D.; Woods, D. Identification of the Acid Phosphatase (AcpA) Gene Homologues in Pathogenic and Non-Pathogenic Burkholderia spp. Facilitates TnphoA Mutagenesis. Microbiology 2001, 147, 111–120. [Google Scholar] [CrossRef][Green Version]
- Elhawy, M.I.; Huc-Brandt, S.; Pätzold, L.; Gannoun-Zaki, L.; Abdrabou, A.M.M.; Bischoff, M.; Molle, V. The Phosphoarginine Phosphatase PtpB from Staphylococcus aureus Is Involved in Bacterial Stress Adaptation during Infection. Cells 2021, 10, 645. [Google Scholar] [CrossRef]
- Ravipaty, S.; Reilly, J.P. Comprehensive Characterization of Methicillin-Resistant Staphylococcus aureus Subsp. aureus COL Secretome by Two-Dimensional Liquid Chromatography and Mass Spectrometry. Mol. Cell Proteom. 2010, 9, 1898–1919. [Google Scholar] [CrossRef]
- Cassat, J.E.; Hammer, N.D.; Campbell, J.P.; Benson, M.A.; Perrien, D.S.; Mrak, L.N.; Smeltzer, M.S.; Torres, V.J.; Skaar, E.P. A Secreted Bacterial Protease Tailors the Staphylococcus aureus Virulence Repertoire to Modulate Bone Remodeling during Osteomyelitis. Cell Host Microbe 2013, 13, 759–772. [Google Scholar] [CrossRef]
- Paharik, A.E.; Salgado-Pabon, W.; Meyerholz, D.K.; White, M.J.; Schlievert, P.M.; Horswill, A.R. The Spl Serine Proteases Modulate Staphylococcus aureus Protein Production and Virulence in a Rabbit Model of Pneumonia. mSphere 2016, 1, e00208-16. [Google Scholar] [CrossRef]
- Prajsnar, T.K.; Cunliffe, V.T.; Foster, S.J.; Renshaw, S.A. A Novel Vertebrate Model of Staphylococcus aureus Infection Reveals Phagocyte-Dependent Resistance of Zebrafish to Non-Host Specialized Pathogens. Cell. Microbiol. 2008, 10, 2312–2325. [Google Scholar] [CrossRef] [PubMed]
- Rasheed, S.; Fries, F.; Müller, R.; Herrmann, J. Zebrafish: An Attractive Model to Study Staphylococcus aureus Infection and Its Use as a Drug Discovery Tool. Pharmaceuticals 2021, 14, 594. [Google Scholar] [CrossRef] [PubMed]
- Lieschke, G.J.; Oates, A.C.; Crowhurst, M.O.; Ward, A.C.; Layton, J.E. Morphologic and Functional Characterization of Granulocytes and Macrophages in Embryonic and Adult Zebrafish. Blood 2001, 98, 3087–3096. [Google Scholar] [CrossRef]
- Li, C.; Sun, F.; Cho, H.; Yelavarthi, V.; Sohn, C.; He, C.; Schneewind, O.; Bae, T. CcpA Mediates Proline Auxotrophy and Is Required for Staphylococcus aureus Pathogenesis. J. Bacteriol. 2010, 192, 3883–3892. [Google Scholar] [CrossRef] [PubMed]
- Pidwill, G.R.; Gibson, J.F.; Cole, J.; Renshaw, S.A.; Foster, S.J. The Role of Macrophages in Staphylococcus aureus Infection. Front. Immunol. 2021, 11, 3506. [Google Scholar] [CrossRef] [PubMed]
- Idrees, M.; Sawant, S.; Karodia, N.; Rahman, A. Staphylococcus aureus Biofilm: Morphology, Genetics, Pathogenesis and Treatment Strategies. Int. J. Environ. Res. Public Health 2021, 18, 7602. [Google Scholar] [CrossRef]
- Ahmad-Mansour, N.; Plumet, L.; Huc-Brandt, S.; Magnan, C.; Yahiaoui-Martinez, A.; Kissa, K.; Pantel, A.; Lavigne, J.-P.; Molle, V. Investigating Pathogenicity and Virulence of Staphylococcus pettenkoferi: An Emerging Pathogen. Int. J. Mol. Sci. 2021, 22, 13614. [Google Scholar] [CrossRef]
- Thaller, M.C.; Schippa, S.; Rossolini, G.M. Conserved Sequence Motifs among Bacterial, Eukaryotic, and Archaeal Phosphatases That Define a New Phosphohydrolase Superfamily. Protein. Sci. 1998, 7, 1647–1652. [Google Scholar] [CrossRef]
- Rossolini, G.M.; Schippa, S.; Riccio, M.L.; Berlutti, F.; Macaskie, L.E.; Thaller, M.C. Bacterial Nonspecific Acid Phosphohydrolases: Physiology, Evolution and Use as Tools in Microbial Biotechnology. CMLS Cell. Mol. Life Sci. 1998, 54, 833–850. [Google Scholar] [CrossRef]
- Reilly, T.J.; Green, B.A.; Zlotnick, G.W.; Smith, A.L. Contribution of the DDDD Motif of H. Influenzae e (P4) to Phosphomonoesterase Activity and Heme Transport. FEBS Lett. 2001, 494, 19–23. [Google Scholar] [CrossRef]
- Reilly, T.J.; Calcutt, M.J. The Class C Acid Phosphatase of Helicobacter pylori Is a 5′ Nucleotidase. Protein Expr. Purif. 2004, 33, 48–56. [Google Scholar] [CrossRef] [PubMed]
- Reilly, T.J.; Chance, D.L.; Calcutt, M.J.; Tanner, J.J.; Felts, R.L.; Waller, S.C.; Henzl, M.T.; Mawhinney, T.P.; Ganjam, I.K.; Fales, W.H. Characterization of a Unique Class C Acid Phosphatase from Clostridium perfringens. Appl. Environ. Microbiol. 2009, 75, 3745–3754. [Google Scholar] [CrossRef] [PubMed]
- Somerville, G.A.; Beres, S.B.; Fitzgerald, J.R.; DeLeo, F.R.; Cole, R.L.; Hoff, J.S.; Musser, J.M. In Vitro Serial Passage of Staphylococcus aureus: Changes in Physiology, Virulence Factor Production, and Agr Nucleotide Sequence. J. Bacteriol. 2002, 184, 1430–1437. [Google Scholar] [CrossRef]
- Monk, I.R.; Tree, J.J.; Howden, B.P.; Stinear, T.P.; Foster, T.J. Complete Bypass of Restriction Systems for Major Staphylococcus aureus Lineages. mBio 2015, 6, e00308-15. [Google Scholar] [CrossRef]
- Schuster, C.F.; Howard, S.A.; Gründling, A. Use of the Counter Selectable Marker PheS* for Genome Engineering in Staphylococcus aureus. Microbiology 2019, 165, 572–584. [Google Scholar] [CrossRef] [PubMed]
- de Jong, N.W.M.; van der Horst, T.; van Strijp, J.A.G.; Nijland, R. Fluorescent Reporters for Markerless Genomic Integration in Staphylococcus aureus. Sci. Rep. 2017, 7, 43889. [Google Scholar] [CrossRef]
- Lee, C.Y.; Buranen, S.L.; Ye, Z.H. Construction of Single-Copy Integration Vectors for Staphylococcus aureus. Gene 1991, 103, 101–105. [Google Scholar] [CrossRef]
- Dreymueller, D.; Martin, C.; Kogel, T.; Pruessmeyer, J.; Hess, F.M.; Horiuchi, K.; Uhlig, S.; Ludwig, A. Lung Endothelial ADAM17 Regulates the Acute Inflammatory Response to Lipopolysaccharide. EMBO Mol. Med. 2012, 4, 412–423. [Google Scholar] [CrossRef]
- Elhawy, M.I.; Molle, V.; Becker, S.L.; Bischoff, M. The Low-Molecular Weight Protein Arginine Phosphatase PtpB Affects Nuclease Production, Cell Wall Integrity, and Uptake Rates of Staphylococcus aureus by Polymorphonuclear Leukocytes. Int. J. Mol. Sci. 2021, 22, 5342. [Google Scholar] [CrossRef]
- Chatterjee, I.; Becker, P.; Grundmeier, M.; Bischoff, M.; Somerville, G.A.; Peters, G.; Sinha, B.; Harraghy, N.; Proctor, R.A.; Herrmann, M. Staphylococcus aureus ClpC Is Required for Stress Resistance, Aconitase Activity, Growth Recovery, and Death. J. Bacteriol. 2005, 187, 4488–4496. [Google Scholar] [CrossRef]
- Pätzold, L.; Brausch, A.-C.; Bielefeld, E.-L.; Zimmer, L.; Somerville, G.A.; Bischoff, M.; Gaupp, R. Impact of the Histidine-Containing Phosphocarrier Protein HPr on Carbon Metabolism and Virulence in Staphylococcus aureus. Microorganisms 2021, 9, 466. [Google Scholar] [CrossRef] [PubMed]
- Schlievert, P.M. Staphylococcal Virulence Factors. In Staphylococcus: Genetics and Physiology; Caister Academic Press: Wymondham, UK, 2016; pp. 81–106. ISBN 978-1-910190-49-4. [Google Scholar]
- Bischoff, M.; Romby, P. Genetic Regulation. In Staphylococcus: Genetics and Physiology; Caister Academic Press: Wymondham, UK, 2016; pp. 301–334. ISBN 978-1-910190-49-4. [Google Scholar]


Publisher’s Note: MDPI stays neutral with regard to jurisdictional claims in published maps and institutional affiliations. |
© 2022 by the authors. Licensee MDPI, Basel, Switzerland. This article is an open access article distributed under the terms and conditions of the Creative Commons Attribution (CC BY) license (https://creativecommons.org/licenses/by/4.0/).