
A Bionic Testbed for Cardiac Ablation Tools
 , , and
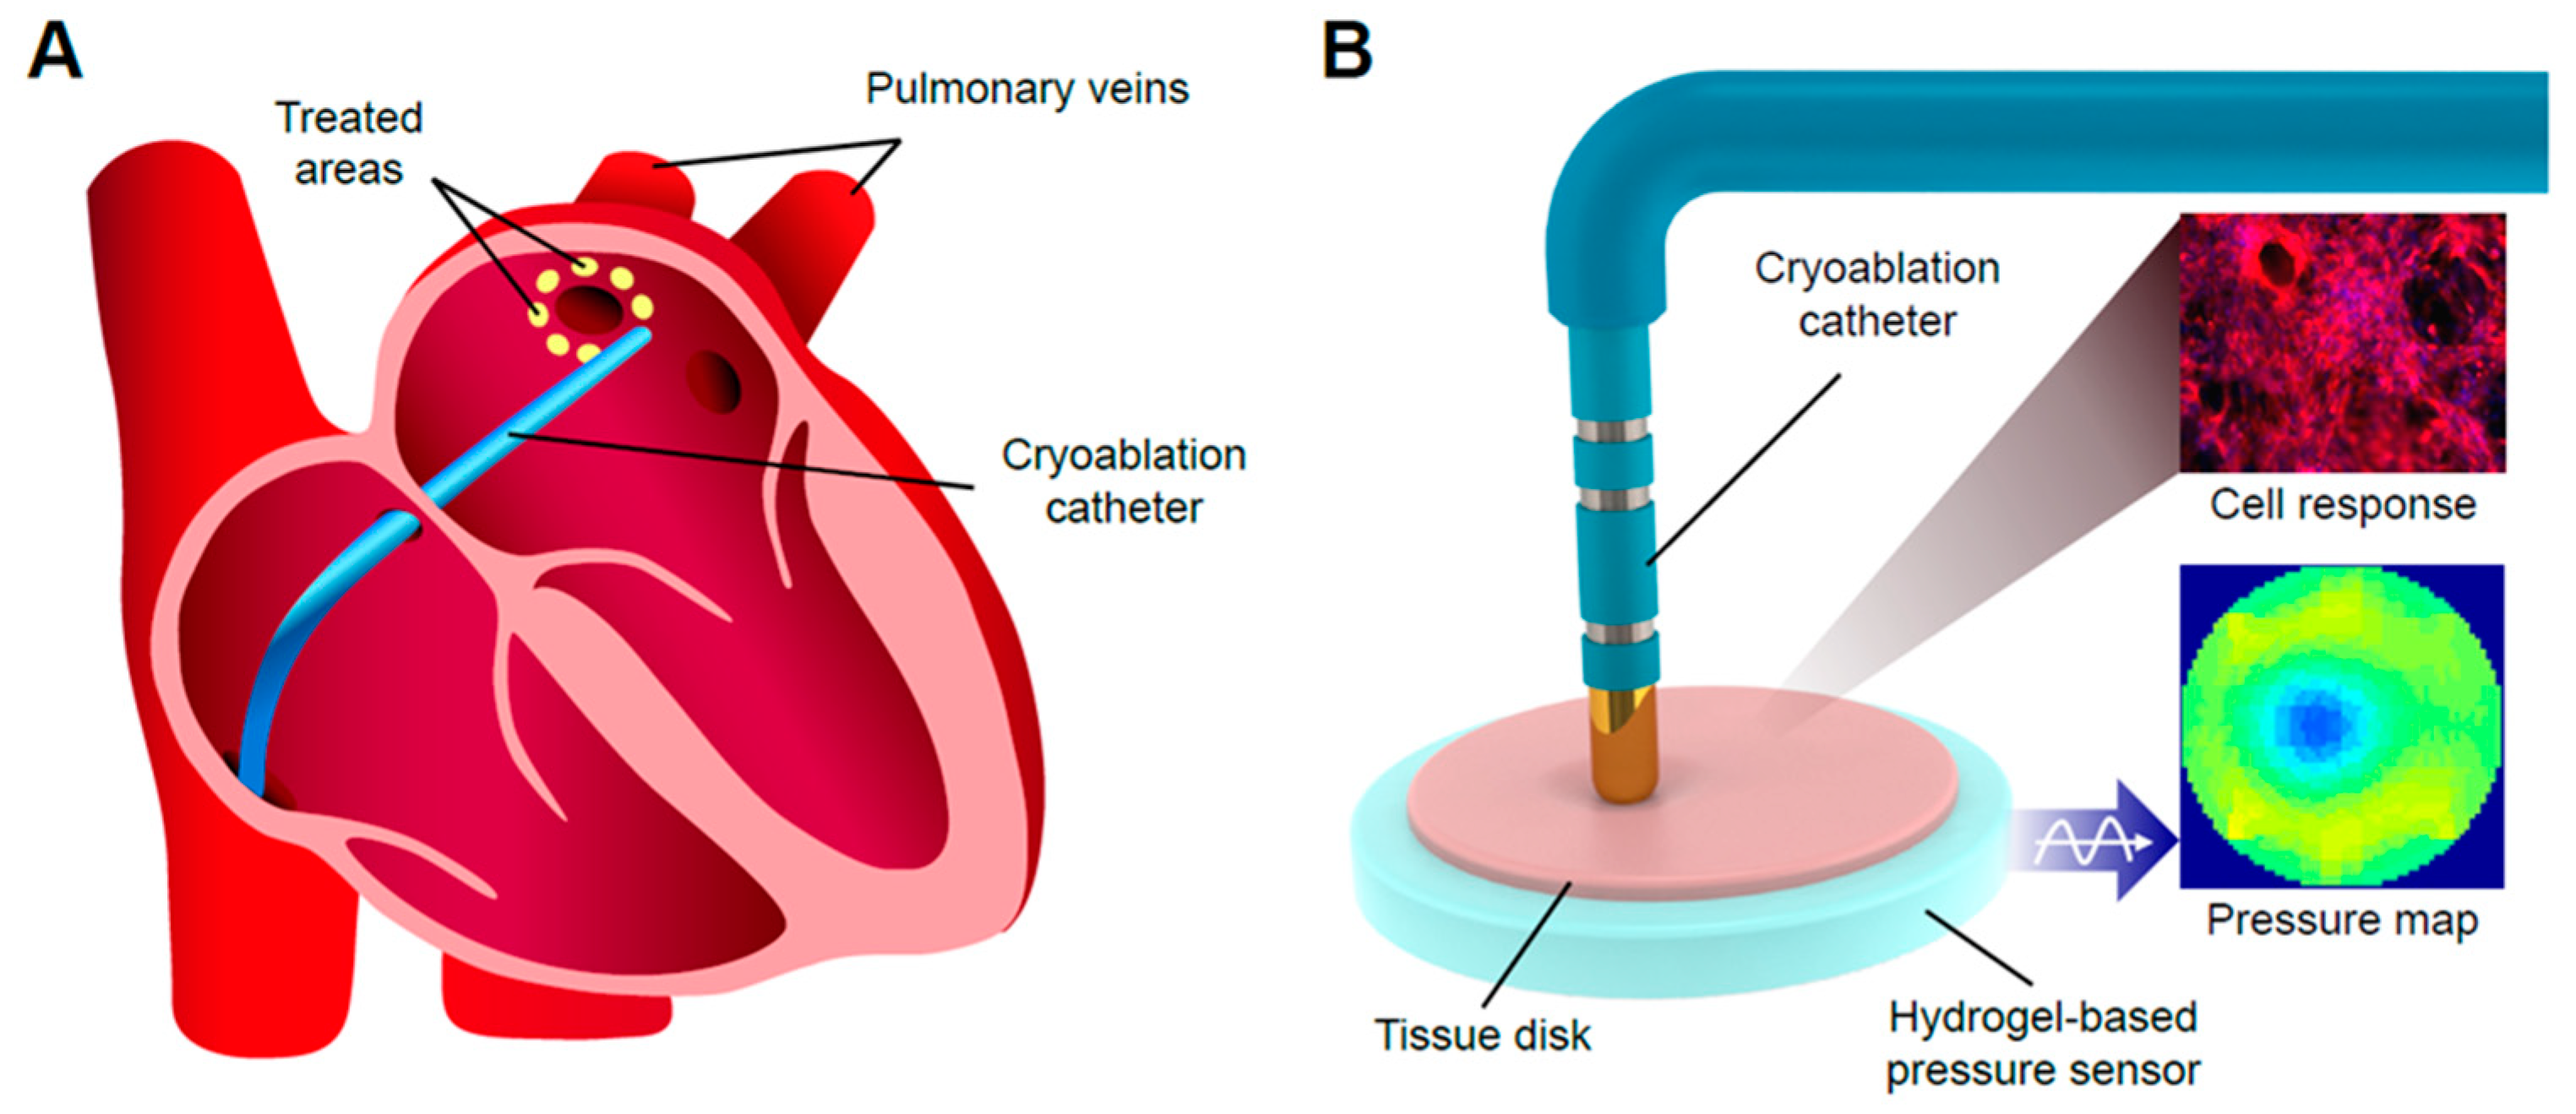
Abstract
1. Introduction
2. Results
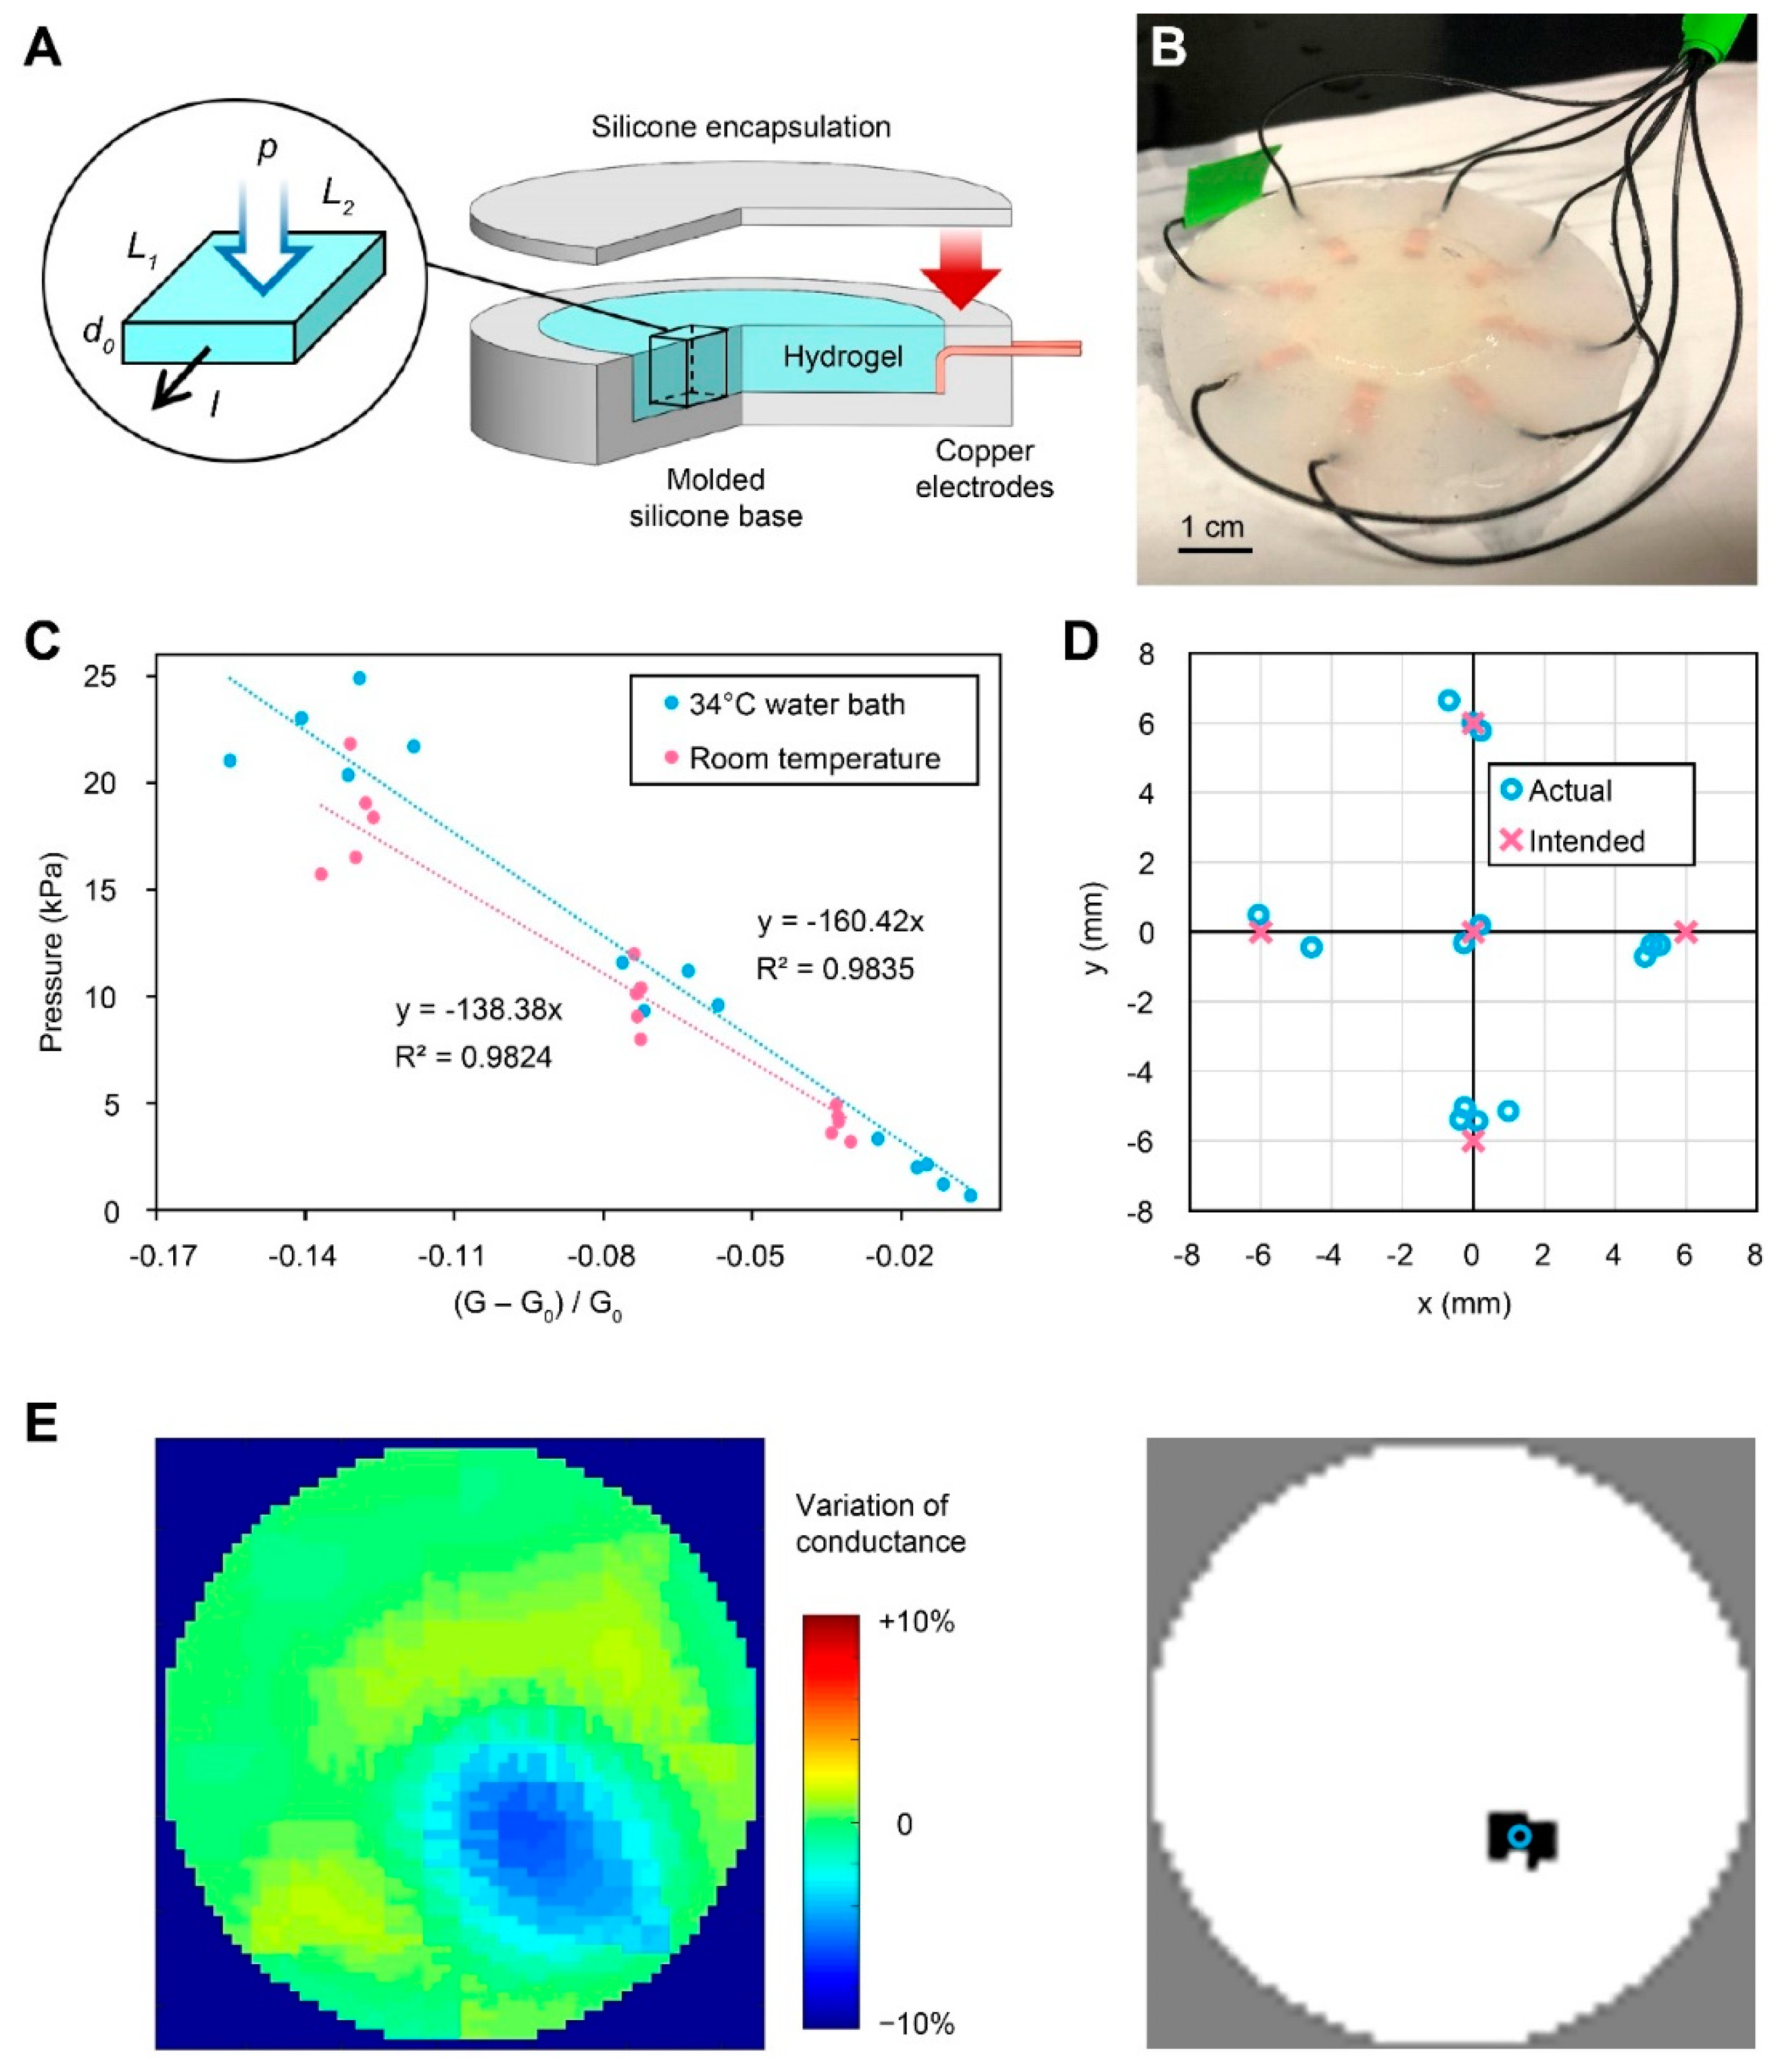
2.1. Hydrogel-Based EIT Pressure Sensor
2.1.1. Sensor Fabrication
2.1.2. Electromechanical Characterization
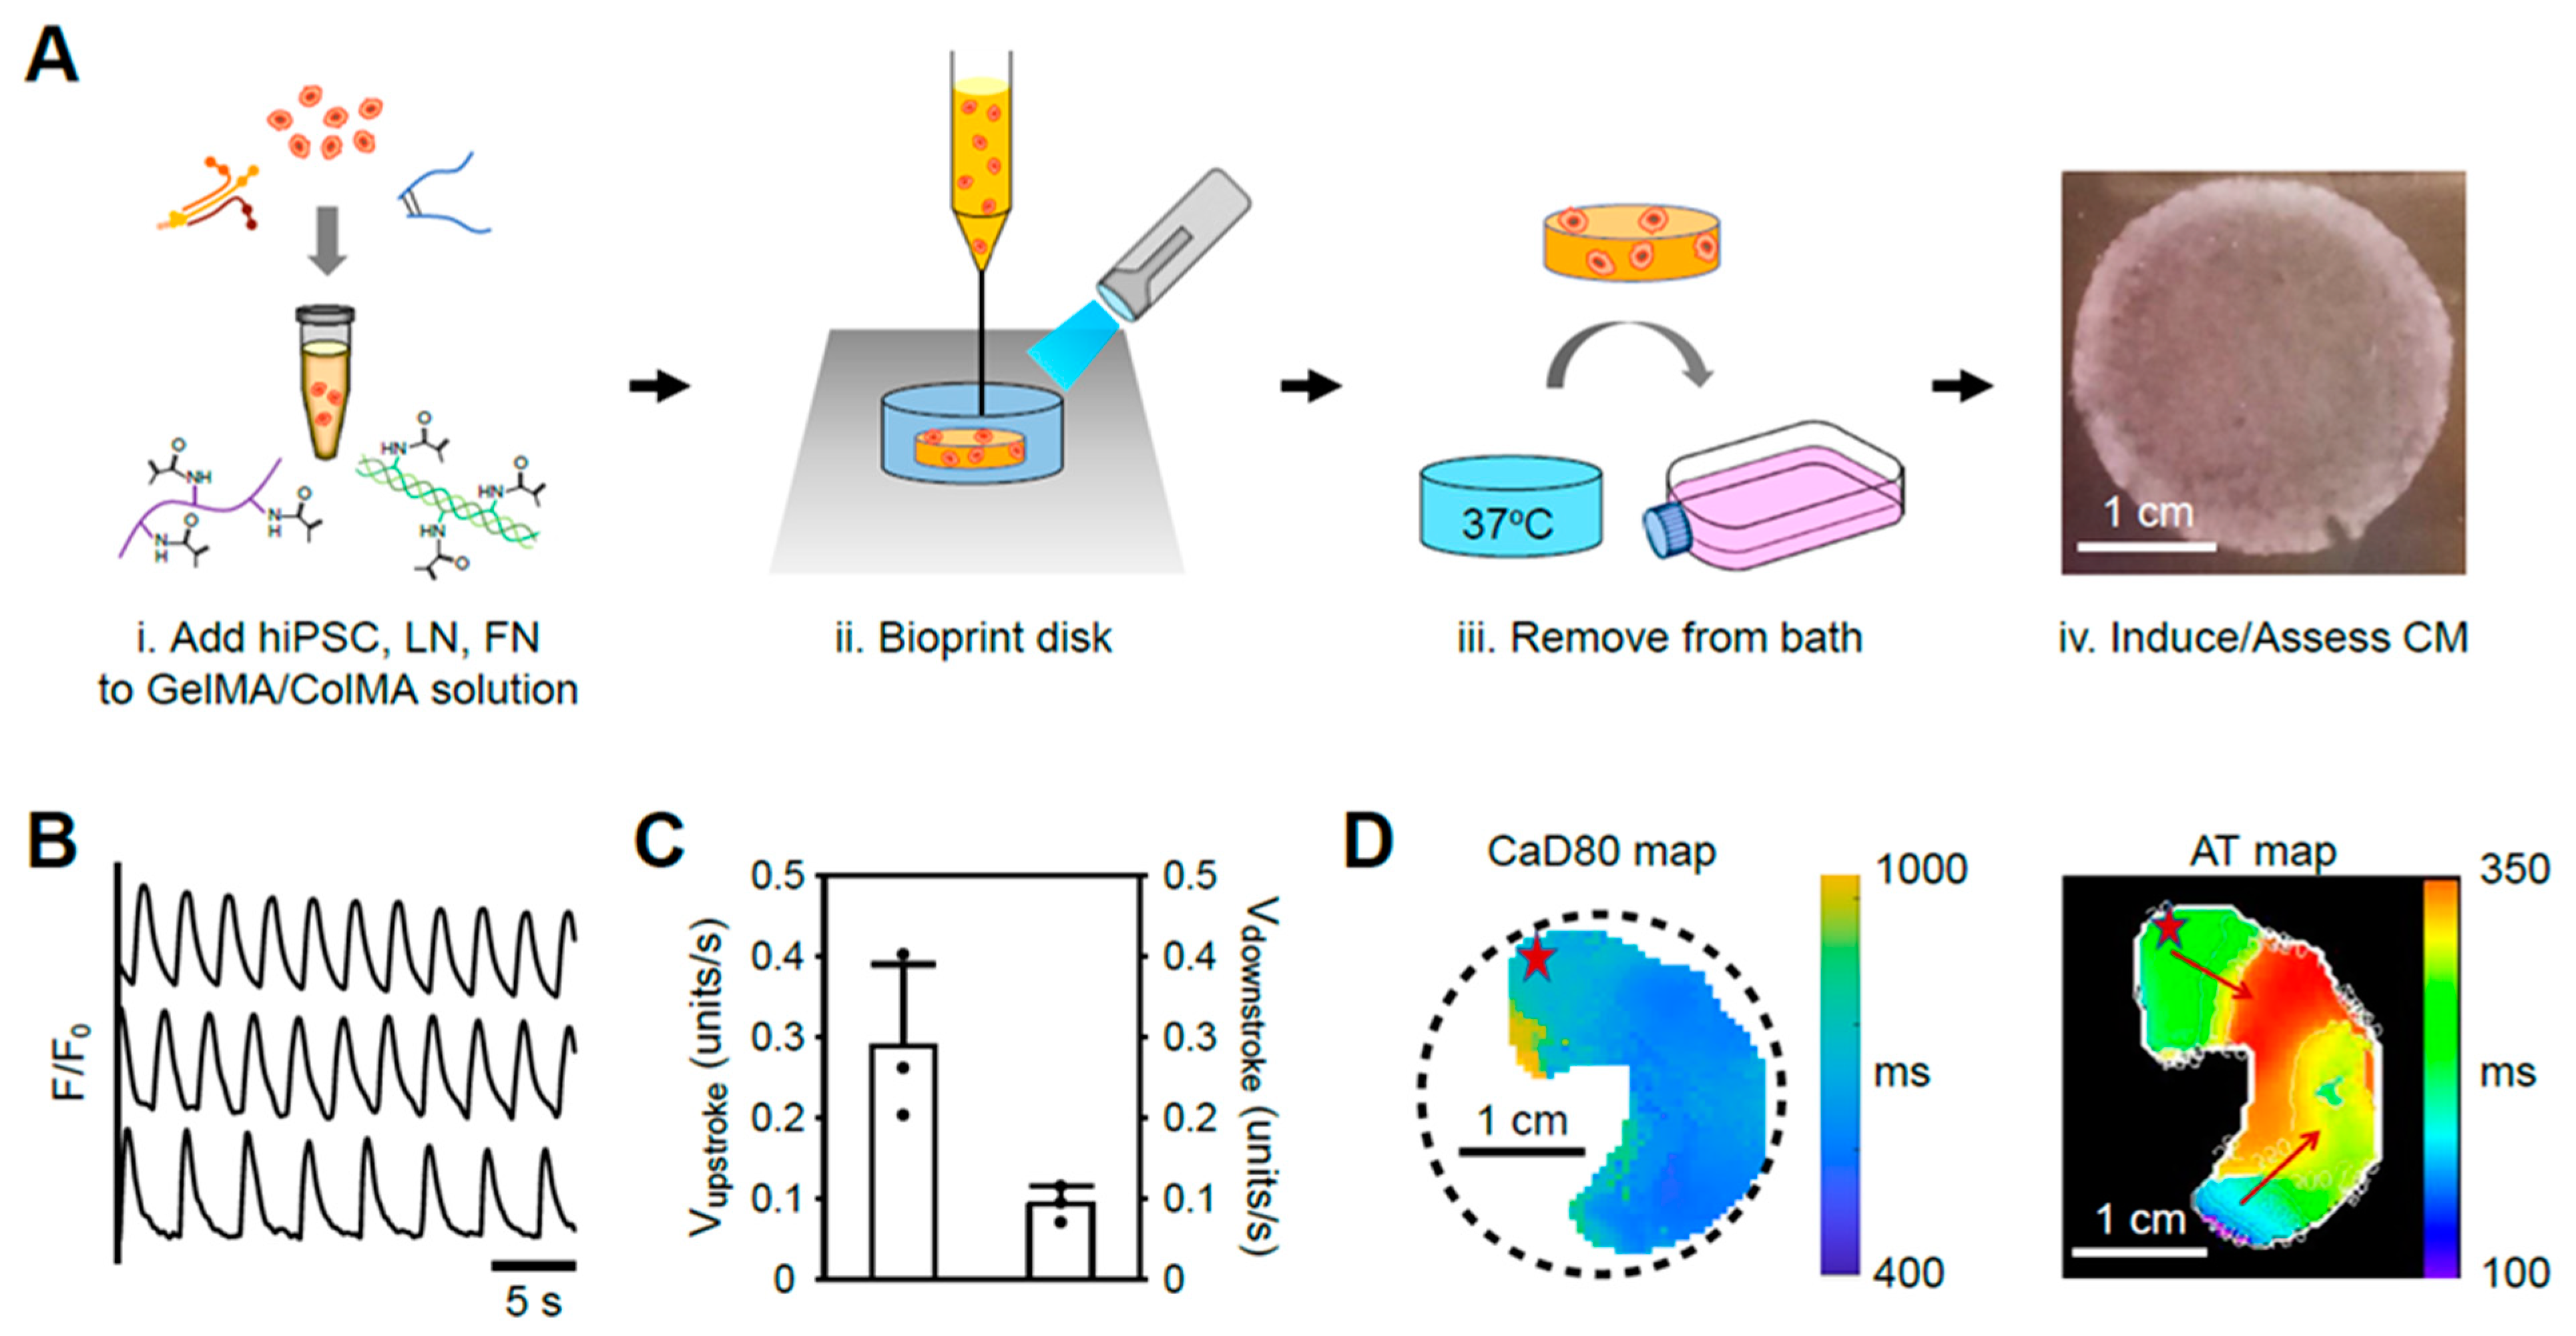
2.2. Bioprinted Centimeter-Scale Human Cardiac Disk
2.2.1. Cardiac Disk Preparation
2.2.2. Bioprinted Cardiac Disks Exhibit Contiguous Calcium Activity
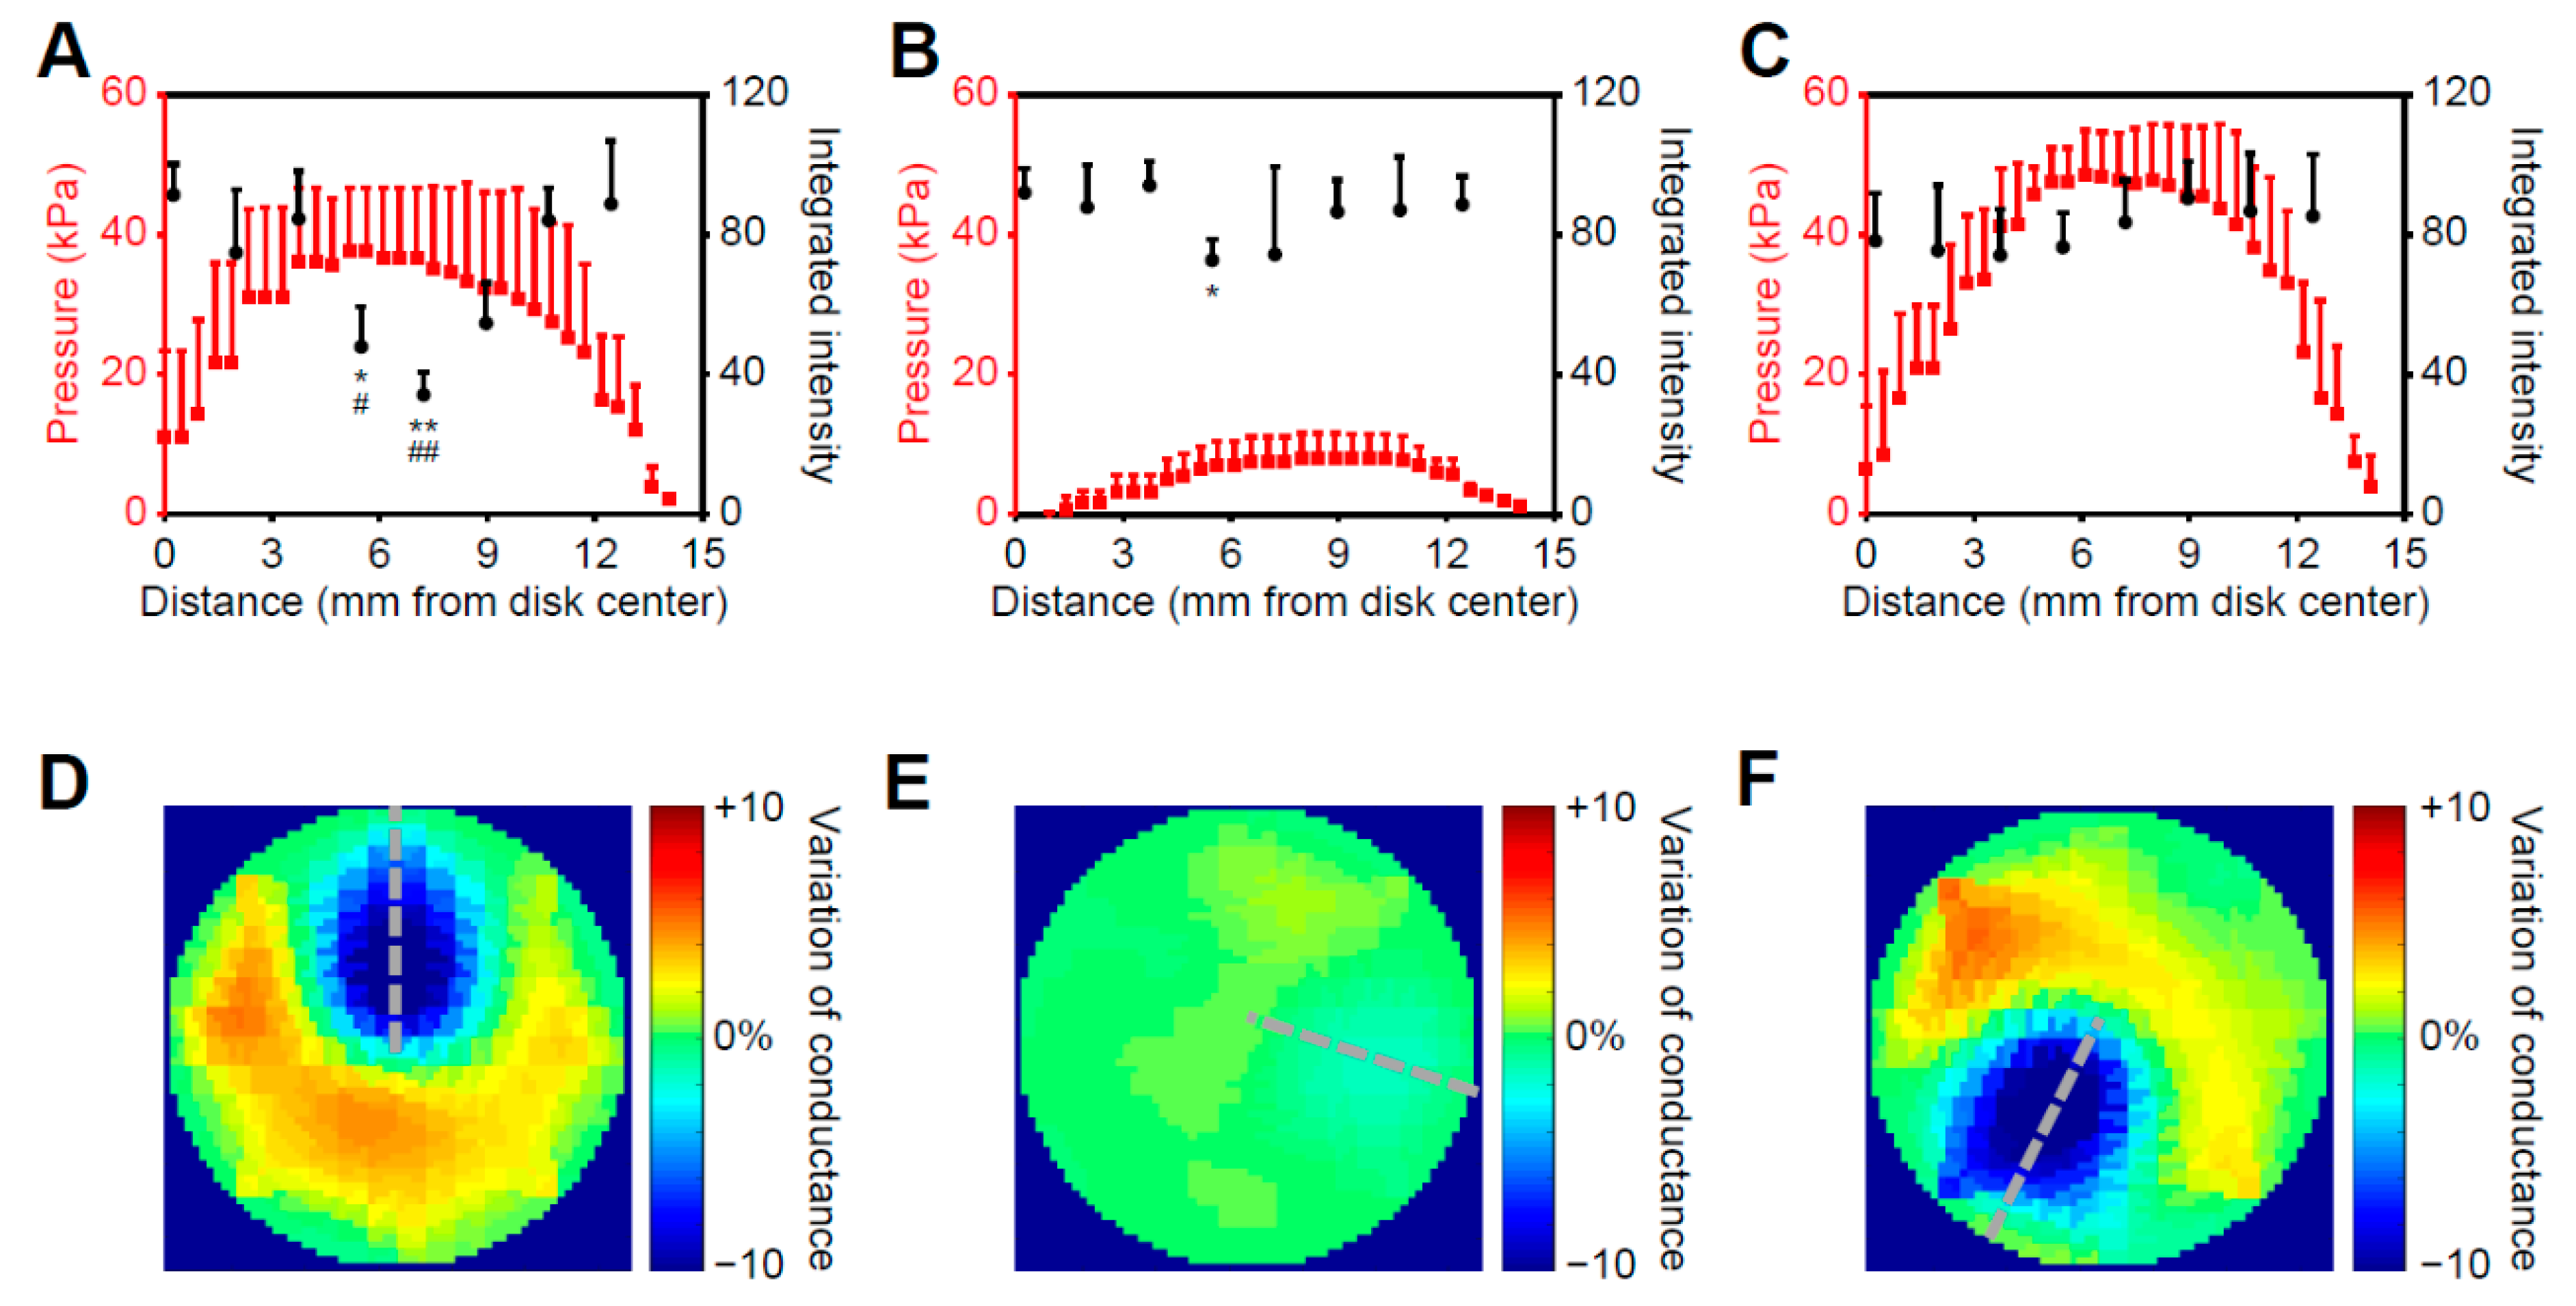
2.3. Cryoablation on the Bionic Testbed
2.3.1. Correlated Pressure Profile and Cell Response to Cryoablation
2.3.2. Post-Ablation Cardiac Disks Show Tissue- and Cell-Scale Damage
3. Discussion
4. Materials and Methods
4.1. Material System for the Pressure Sensor
4.2. Compression Test
4.3. Periphery Circuitry Design for the Pressure Sensor
4.4. Software Interface for the Pressure Sensor
4.5. Sensor Calibration
4.6. Cell Culture and Bioink Preparation
4.7. Bioprinting and Differentiation of Human Cardiac Disks
4.8. Calcium Transient Measurement
4.9. Optical Mapping Assessment
4.10. Cryoablation of Bionic Myocardial Testbed
4.11. Immunohistological Assessment
4.12. Statistical Analysis
Supplementary Materials
Author Contributions
Funding
Institutional Review Board Statement
Informed Consent Statement
Data Availability Statement
Acknowledgments
Conflicts of Interest
References
- LaBarge, W.; Mattappally, S.; Kannappan, R.; Fast, V.G.; Pretorius, D.; Berry, J.L.; Zhang, J. Maturation of three-dimensional, hiPSC-derived cardiomyocyte spheroids utilizing cyclic, uniaxial stretch and electrical stimulation. PLoS ONE 2019, 14, e0219442. [Google Scholar] [CrossRef]
- Nunes, S.S.; Miklas, J.W.; Liu, J.; Aschar-Sobbi, R.; Xiao, Y.; Zhang, B.; Jiang, J.; Massé, S.; Gagliardi, M.; Hsieh, A.; et al. Biowire: A platform for maturation of human pluripotent stem cell-derived cardiomyocytes. Nat. Methods 2013, 10, 781–787. [Google Scholar] [CrossRef] [PubMed]
- MacQueen, L.A.; Sheehy, S.P.; Chantre, C.O.; Zimmerman, J.F.; Pasqualini, F.S.; Liu, X.; Goss, J.A.; Campbell, P.H.; Gonzalez, G.M.; Park, S.J.; et al. A tissue-engineered scale model of the heart ventricle. Nat. Biomed. Eng. 2018, 2, 930–941. [Google Scholar] [CrossRef]
- Mathur, A.; Loskill, P.; Shao, K.; Huebsch, N.; Hong, S.; Marcus, S.G.; Marks, N.; Mandegar, M.; Conklin, B.R.; Lee, L.P.; et al. Human iPSC-based cardiac microphysiological system for drug screening applications. Sci. Rep. 2015, 5, 8883. [Google Scholar] [CrossRef]
- Goldfracht, I.; Protze, S.; Shiti, A.; Setter, N.; Gruber, A.; Shaheen, N.; Nartiss, Y.; Keller, G.; Gepstein, L. Generating ring-shaped engineered heart tissues from ventricular and atrial human pluripotent stem cell-derived cardiomyocytes. Nat. Commun. 2020, 11, 75. [Google Scholar] [CrossRef] [PubMed]
- Blinova, K.; Dang, Q.; Millard, D.; Smith, G.; Pierson, J.; Guo, L.; Brock, M.; Lu, H.R.; Kraushaar, U.; Zeng, H.; et al. International Multisite Study of Human-Induced Pluripotent Stem Cell-Derived Cardiomyocytes for Drug Proarrhythmic Potential Assessment. Cell Rep. 2018, 24, 3582–3592. [Google Scholar] [CrossRef] [PubMed]
- Meissner, A.; Plehn, G.; Van Bracht, M.; Schrage, M.O.; Christ, M.; Maagh, P.; Butz, T.; Borchard, R.; Trappe, H.J. First experiences for pulmonary vein isolation with the high-density mesh ablator (HDMA): A novel mesh electrode catheter for both mapping and radiofrequency delivery in a single unit. J. Cardiovasc. Electrophysiol. 2009, 20, 359–366. [Google Scholar] [CrossRef]
- Oral, H.; Pappone, C.; Chugh, A.; Good, E.; Bogun, F.; Pelosi, F., Jr.; Bates, E.R.; Lehmann, M.H.; Vicedomini, G.; Augello, G.; et al. Circumferential pulmonary-vein ablation for chronic atrial fibrillation. N. Engl. J. Med. 2006, 354, 934–941. [Google Scholar] [CrossRef]
- Stagegaard, N.; Petersen, H.H.; Chen, X.; Svendsen, J.H. Indication of the radiofrequency induced lesion size by pre-ablation measurements. Europace 2005, 7, 525–534. [Google Scholar] [CrossRef]
- Weiss, C.; Antz, M.; Eick, O.; Eshagzaiy, K.; Meinertz, T.; Willems, S. Radiofrequency catheter ablation using cooled electrodes: Impact of irrigation flow rate and catheter contact pressure on lesion dimensions. Pacing Clin. Electrophysiol. 2002, 25, 463–469. [Google Scholar] [CrossRef]
- Di Biase, L.; Natale, A.; Barrett, C.; Tan, C.; Elayi, C.S.; Ching, C.K.; Wang, P.; Al-Ahmad, A.; Arruda, M.; Burkhardt, J.D.; et al. Relationship between catheter forces, lesion characteristics, “popping,” and char formation: Experience with robotic navigation system. J. Cardiovasc. Electrophysiol. 2009, 20, 436–440. [Google Scholar] [CrossRef] [PubMed]
- Seiler, J.; Roberts-Thomson, K.C.; Raymond, J.M.; Vest, J.; Delacretaz, E.; Stevenson, W.G. Steam pops during irrigated radiofrequency ablation: Feasibility of impedance monitoring for prevention. Heart Rhythm 2008, 5, 1411–1416. [Google Scholar] [CrossRef] [PubMed]
- Thiagalingam, A.; D’Avila, A.; Foley, L.; Guerrero, J.L.; Lambert, H.; Leo, G.; Ruskin, J.N.; Reddy, V.Y. Importance of catheter contact force during irrigated radiofrequency ablation: Evaluation in a porcine ex vivo model using a force-sensing catheter. J. Cardiovasc. Electrophysiol. 2010, 21, 806–811. [Google Scholar] [CrossRef] [PubMed]
- Kurzidim, K.; Schneider, H.J.; Kuniss, M.; Sperzel, J.; Greiss, H.; Berkowitsch, A.; Pitschner, H.F. Cryocatheter ablation of right ventricular outflow tract tachycardia. J. Cardiovasc. Electrophysiol. 2005, 16, 366–369. [Google Scholar] [CrossRef] [PubMed]
- Piccini, J.P.; Fauchier, L. Rhythm control in atrial fibrillation. Lancet 2016, 388, 829–840. [Google Scholar] [CrossRef]
- McCready, J.W.; Smedley, T.; Lambiase, P.D.; Ahsan, S.Y.; Segal, O.R.; Rowland, E.; Lowe, M.D.; Chow, A.W. Predictors of recurrence following radiofrequency ablation for persistent atrial fibrillation. Europace 2011, 13, 355–361. [Google Scholar] [CrossRef]
- Canpolat, U.; Kocyigit, D.; Aytemir, K. Complications of Atrial Fibrillation Cryoablation. J. Atr. Fibrillation 2017, 10, 1620. [Google Scholar] [CrossRef]
- Deisenhofer, I.; Zrenner, B.; Yin, Y.H.; Pitschner, H.F.; Kuniss, M.; Grossmann, G.; Stiller, S.; Luik, A.; Veltmann, C.; Frank, J.; et al. Cryoablation versus radiofrequency energy for the ablation of atrioventricular nodal reentrant tachycardia (the CYRANO Study): Results from a large multicenter prospective randomized trial. Circulation 2010, 122, 2239–2245. [Google Scholar] [CrossRef]
- Tosi, D.; Macchi, E.G.; Cigada, A. Fiber-Optic Temperature and Pressure Sensors Applied to Radiofrequency Thermal Ablation in Liver Phantom: Methodology and Experimental Measurements. J. Sens. 2015, 2015, 909012. [Google Scholar] [CrossRef]
- Vrooijink, G.J.; Irzan, H.; Misra, S. A Beating Heart Testbed for the Evaluation of Robotic Cardiovascular Interventions. In Proceedings of the 2018 7th IEEE International Conference on Biomedical Robotics and Biomechatronics (Biorob), Enschede, The Netherlands, 26–29 August 2018; pp. 1076–1082. [Google Scholar]
- Kar, R.; Post, A.; John, M.; Rook, A.; Razavi, M. An initial ex vivo evaluation of temperature profile and thermal injury formation on the epiesophageal surface during radiofrequency ablation. J. Cardiovasc. Electrophysiol. 2021, 32, 704–712. [Google Scholar] [CrossRef]
- van Gorp, P.R.R.; Trines, S.A.; Pijnappels, D.A.; de Vries, A.A.F. Multicellular In vitro Models of Cardiac Arrhythmias: Focus on Atrial Fibrillation. Front. Cardiovasc. Med. 2020, 7, 43. [Google Scholar] [CrossRef] [PubMed]
- Roney, C.H.; Beach, M.L.; Mehta, A.M.; Sim, I.; Corrado, C.; Bendikas, R.; Solis-Lemus, J.A.; Razeghi, O.; Whitaker, J.; O’Neill, L.; et al. In silico Comparison of Left Atrial Ablation Techniques That Target the Anatomical, Structural, and Electrical Substrates of Atrial Fibrillation. Front. Physiol. 2020, 11, 1145. [Google Scholar] [CrossRef] [PubMed]
- Prakosa, A.; Arevalo, H.J.; Deng, D.; Boyle, P.M.; Nikolov, P.P.; Ashikaga, H.; Blauer, J.J.E.; Ghafoori, E.; Park, C.J.; Blake, R.C., III; et al. Personalized virtual-heart technology for guiding the ablation of infarct-related ventricular tachycardia. Nat. Biomed. Eng. 2018, 2, 732–740. [Google Scholar] [CrossRef]
- Hammond, F.L.; Kramer, R.K.; Wan, Q.; Howe, R.D.; Wood, R.J. Soft Tactile Sensor Arrays for Force Feedback in Micromanipulation. IEEE Sens. J. 2014, 14, 1443–1452. [Google Scholar] [CrossRef]
- Kim, D.H.; Lu, N.; Ghaffari, R.; Kim, Y.S.; Lee, S.P.; Xu, L.; Wu, J.; Kim, R.H.; Song, J.; Liu, Z.; et al. Materials for multifunctional balloon catheters with capabilities in cardiac electrophysiological mapping and ablation therapy. Nat. Mater. 2011, 10, 316–323. [Google Scholar] [CrossRef] [PubMed]
- Adler, A.; Lionheart, W.R.B. Uses and abuses of EIDORS: An extensible software base for EIT. Physiol. Meas. 2006, 27, S25–S42. [Google Scholar] [CrossRef]
- Duan, X.; Taurand, S.; Soleimani, M. Artificial skin through super-sensing method and electrical impedance data from conductive fabric with aid of deep learning. Sci. Rep. 2019, 9, 8831. [Google Scholar] [CrossRef]
- Silvera-Tawil, D.; Rye, D.; Soleimani, M.; Velonaki, M. Electrical Impedance Tomography for Artificial Sensitive Robotic Skin: A Review. IEEE Sens. J. 2015, 15, 2001–2016. [Google Scholar] [CrossRef]
- Yoon, S.H.; Huo, K.; Zhang, Y.; Chen, G.; Paredes, L.; Chidambaram, S.; Ramani, K. iSoft: A Customizable Soft Sensor with Real-time Continuous Contact and Stretching Sensing. In Proceedings of the 30th Annual ACM Symposium on User Interface Software and Technology, Québec City, QC, Canada, 22–25 October 2017; pp. 665–678. [Google Scholar]
- Yoon, S.H.; Paredes, L.; Huo, K.; Ramani, K. MultiSoft: Soft Sensor Enabling Real-Time Multimodal Sensing with Contact Localization and Deformation Classification. Proc. ACM Interact. Mob. Wearable Ubiquitous Technol. 2018, 2, 1–21. [Google Scholar] [CrossRef]
- Yao, A.; Soleimani, M. A pressure mapping imaging device based on electrical impedance tomography of conductive fabrics. Sens. Rev. 2012, 32, 310–317. [Google Scholar] [CrossRef]
- Matta, M.; Anselmino, M.; Ferraris, F.; Scaglione, M.; Gaita, F. Cryoballoon vs. radiofrequency contact force ablation for paroxysmal atrial fibrillation: A propensity score analysis. J. Cardiovasc. Med. 2018, 19, 141–147. [Google Scholar] [CrossRef] [PubMed]
- Keplinger, C.; Sun, J.Y.; Foo, C.C.; Rothemund, P.; Whitesides, G.M.; Suo, Z. Stretchable, transparent, ionic conductors. Science 2013, 341, 984–987. [Google Scholar] [CrossRef] [PubMed]
- Zhu, Z.; Park, H.S.; McAlpine, M.C. 3D Printed Deformable Sensors. Sci. Adv. 2020, 6, eaba5575. [Google Scholar] [CrossRef] [PubMed]
- Kerscher, P.; Turnbull, I.C.; Hodge, A.J.; Kim, J.; Seliktar, D.; Easley, C.J.; Costa, K.D.; Lipke, E.A. Direct hydrogel encapsulation of pluripotent stem cells enables ontomimetic differentiation and growth of engineered human heart tissues. Biomaterials 2016, 83, 383–395. [Google Scholar] [CrossRef]
- Kupfer, M.E.; Lin, W.H.; Ravikumar, V.; Qiu, K.; Wang, L.; Gao, L.; Bhuiyan, D.; Lenz, M.; Ai, J.; Mahutga, R.R.; et al. In Situ Expansion, Differentiation and Electromechanical Coupling of Human Cardiac Muscle in a 3D Bioprinted, Chambered Organoid. Circ. Res. 2020, 127, 207–224. [Google Scholar] [CrossRef]
- Masumoto, H.; Nakane, T.; Tinney, J.P.; Yuan, F.; Ye, F.; Kowalski, W.J.; Minakata, K.; Sakata, R.; Yamashita, J.K.; Keller, B.B. The myocardial regenerative potential of three-dimensional engineered cardiac tissues composed of multiple human iPS cell-derived cardiovascular cell lineages. Sci. Rep. 2016, 6, 29933. [Google Scholar] [CrossRef]
- Haghiashtiani, G.; Habtour, E.; Park, S.-H.; Gardea, F.; McAlpine, M.C. 3D printed electrically-driven soft actuators. Extrem. Mech. Lett. 2018, 21, 1–8. [Google Scholar] [CrossRef]
- Wang, Z.; Lee, S.J.; Cheng, H.-J.; Yoo, J.J.; Atala, A. 3D bioprinted functional and contractile cardiac tissue constructs. Acta Biomater. 2018, 70, 48–56. [Google Scholar] [CrossRef]
- Gao, L.; Gregorich, Z.R.; Zhu, W.; Mattapally, S.; Oduk, Y.; Lou, X.; Kannappan, R.; Borovjagin, A.V.; Walcott, G.P.; Pollard, A.E.; et al. Large Cardiac Muscle Patches Engineered From Human Induced-Pluripotent Stem Cell–Derived Cardiac Cells Improve Recovery From Myocardial Infarction in Swine. Circulation 2018, 137, 1712–1730. [Google Scholar] [CrossRef]
- Hinton, T.J.; Jallerat, Q.; Palchesko, R.N.; Park, J.H.; Grodzicki, M.S.; Shue, H.-J.; Ramadan, M.H.; Hudson, A.R.; Feinberg, A.W. Three-dimensional printing of complex biological structures by freeform reversible embedding of suspended hydrogels. Sci. Adv. 2015, 1, e1500758. [Google Scholar] [CrossRef]
- Duan, Y.; Liu, Z.; O’Neill, J.; Wan, L.Q.; Freytes, D.O.; Vunjak-Novakovic, G. Hybrid Gel Composed of Native Heart Matrix and Collagen Induces Cardiac Differentiation of Human Embryonic Stem Cells without Supplemental Growth Factors. J. Cardiovasc. Transl. Res. 2011, 4, 605. [Google Scholar] [CrossRef] [PubMed]
- Jung, J.P.; Hu, D.; Domian, I.J.; Ogle, B.M. An integrated statistical model for enhanced murine cardiomyocyte differentiation via optimized engagement of 3D extracellular matrices. Sci. Rep. 2015, 5, 18705. [Google Scholar] [CrossRef]
- Robert, S.; Flowers, M.; Ogle, B.M. Kinases of the Focal Adhesion Complex Contribute to Cardiomyocyte Specification. Int. J. Mol. Sci. 2021, 22, 10430. [Google Scholar] [CrossRef] [PubMed]
- Wagner, M.B.; Wang, Y.; Kumar, R.; Tipparaju, S.M.; Joyner, R.W. Calcium Transients in Infant Human Atrial Myocytes. Pediatr. Res. 2005, 57, 28–34. [Google Scholar] [CrossRef] [PubMed]
- Olson, M.; Nantsupawat, T.; Sathnur, N.; Roukoz, H. Chapter 4—Cardiac Ablation Technologies. In Engineering in Medicine; Iaizzo, P.A., Ed.; Academic Press: Cambridge, MA, USA, 2019; pp. 83–118. [Google Scholar]
- Khairy, P.; Chauvet, P.; Lehmann, J.; Lambert, J.; Macle, L.; Tanguay, J.F.; Sirois, M.G.; Santoianni, D.; Dubuc, M. Lower incidence of thrombus formation with cryoenergy versus radiofrequency catheter ablation. Circulation 2003, 107, 2045–2050. [Google Scholar] [CrossRef]
- Lemola, K.; Dubuc, M.; Khairy, P. Transcatheter cryoablation part II: Clinical utility. Pacing Clin. Electrophysiol. 2008, 31, 235–244. [Google Scholar] [CrossRef]
- Wood, M.A.; Parvez, B.; Ellenbogen, A.L.; Shaffer, K.M.; Goldberg, S.M.; Gaspar, M.P.; Arief, I.; Schubert, C.M. Determinants of lesion sizes and tissue temperatures during catheter cryoablation. Pacing Clin. Electrophysiol. 2007, 30, 644–654. [Google Scholar] [CrossRef]
- Whittaker, D.K. Mechanisms of tissue destruction following cryosurgery. Ann. R. Coll. Surg. Engl. 1984, 66, 313–318. [Google Scholar]
- Eder, A.; Vollert, I.; Hansen, A.; Eschenhagen, T. Human engineered heart tissue as a model system for drug testing. Adv. Drug Deliv. Rev. 2016, 96, 214–224. [Google Scholar] [CrossRef]
- Masumoto, H.; Ikuno, T.; Takeda, M.; Fukushima, H.; Marui, A.; Katayama, S.; Shimizu, T.; Ikeda, T.; Okano, T.; Sakata, R.; et al. Human iPS cell-engineered cardiac tissue sheets with cardiomyocytes and vascular cells for cardiac regeneration. Sci. Rep. 2014, 4, 6716. [Google Scholar] [CrossRef]
- Littrup, P.J.; Jallad, B.; Vorugu, V.; Littrup, G.; Currier, B.; George, M.; Herring, D. Lethal isotherms of cryoablation in a phantom study: Effects of heat load, probe size, and number. J. Vasc. Interv. Radiol. 2009, 20, 1343–1351. [Google Scholar] [CrossRef] [PubMed]
- Qian, P.C.; Barry, M.A.; Tran, V.T.; Lu, J.; McEwan, A.; Thiagalingam, A.; Thomas, S.P. Irrigated Microwave Catheter Ablation Can Create Deep Ventricular Lesions Through Epicardial Fat With Relative Sparing of Adjacent Coronary Arteries. Circ. Arrhythmia Electrophysiol. 2020, 13, e008251. [Google Scholar] [CrossRef] [PubMed]
- Baust, J.M.; Robilotto, A.; Guerra, P.; Snyder, K.K.; Van Buskirk, R.G.; Dubuc, M.; Baust, J.G. Assessment of a novel cryoablation device for the endovascular treatment of cardiac tachyarrhythmias. SAGE Open Med. 2018, 6, 2050312118769797. [Google Scholar] [CrossRef] [PubMed]
- Pilcher, T.A.; Saul, J.P.; Hlavacek, A.M.; Haemmerich, D. Contrasting effects of convective flow on catheter ablation lesion size: Cryo versus radiofrequency energy. Pacing Clin. Electrophysiol. 2008, 31, 300–307. [Google Scholar] [CrossRef]
- Zimmermann, W.H.; Melnychenko, I.; Wasmeier, G.; Didié, M.; Naito, H.; Nixdorff, U.; Hess, A.; Budinsky, L.; Brune, K.; Michaelis, B.; et al. Engineered heart tissue grafts improve systolic and diastolic function in infarcted rat hearts. Nat. Med. 2006, 12, 452–458. [Google Scholar] [CrossRef]
- Visweswaran, R.; McIntyre, S.D.; Ramkrishnan, K.; Zhao, X.; Tolkacheva, E.G. Spatiotemporal evolution and prediction of [Ca(2+) ]i and APD alternans in isolated rabbit hearts. J. Cardiovasc. Electrophysiol. 2013, 24, 1287–1295. [Google Scholar] [CrossRef]
- Barry, D.J.; Williams, G.A.; Chan, C. Automated analysis of filamentous microbial morphology with AnaMorf. Biotechnol. Prog. 2015, 31, 849–852. [Google Scholar] [CrossRef]


Publisher’s Note: MDPI stays neutral with regard to jurisdictional claims in published maps and institutional affiliations. |
© 2022 by the authors. Licensee MDPI, Basel, Switzerland. This article is an open access article distributed under the terms and conditions of the Creative Commons Attribution (CC BY) license (https://creativecommons.org/licenses/by/4.0/).
Share and Cite
Lin, W.-H.; Zhu, Z.; Ravikumar, V.; Sharma, V.; Tolkacheva, E.G.; McAlpine, M.C.; Ogle, B.M. A Bionic Testbed for Cardiac Ablation Tools. Int. J. Mol. Sci. 2022, 23, 14444. https://doi.org/10.3390/ijms232214444
Lin W-H, Zhu Z, Ravikumar V, Sharma V, Tolkacheva EG, McAlpine MC, Ogle BM. A Bionic Testbed for Cardiac Ablation Tools. International Journal of Molecular Sciences. 2022; 23(22):14444. https://doi.org/10.3390/ijms232214444
Chicago/Turabian StyleLin, Wei-Han, Zhijie Zhu, Vasanth Ravikumar, Vinod Sharma, Elena G. Tolkacheva, Michael C. McAlpine, and Brenda M. Ogle. 2022. "A Bionic Testbed for Cardiac Ablation Tools" International Journal of Molecular Sciences 23, no. 22: 14444. https://doi.org/10.3390/ijms232214444
APA StyleLin, W.-H., Zhu, Z., Ravikumar, V., Sharma, V., Tolkacheva, E. G., McAlpine, M. C., & Ogle, B. M. (2022). A Bionic Testbed for Cardiac Ablation Tools. International Journal of Molecular Sciences, 23(22), 14444. https://doi.org/10.3390/ijms232214444