Article

Allopatric Lineage Divergence of the East Asian Endemic Herb Conandron ramondioides Inferred from Low-Copy Nuclear and Plastid Markers

1
Department of Life Science, College of Life Science, National Taiwan University, Taipei 10617, Taiwan
2
Biodiversity Research Center, Academia Sinica, Taipei 11529, Taiwan
3
Department of Botany, National Museum of Nature and Science, Tsukuba 305-0005, Japan
4
Royal Botanic Garden Edinburgh, Edinburgh EH3 5LR, UK
5
Institute of Plant Biology, College of Life Science, National Taiwan University, Taipei 10617, Taiwan
6
Genome and Systems Biology Degree Program, College of Life Science, National Taiwan University, Taipei 10617, Taiwan
*
Authors to whom correspondence should be addressed.
Int. J. Mol. Sci. 2022, 23(23), 14932; https://doi.org/10.3390/ijms232314932
Submission received: 21 October 2022 / Revised: 18 November 2022 / Accepted: 23 November 2022 / Published: 29 November 2022
(This article belongs to the Special Issue From Functional Genomics to Biotechnology in Ornamental Plant)

Abstract

:
The evolutionary histories of ornamental plants have been receiving only limited attention. We examined the origin and divergence processes of an East Asian endemic ornamental plant, Conandron ramondioides. C. ramondioides is an understory herb occurring in primary forests, which has been grouped into two varieties. We reconstructed the evolutionary and population demography history of C. ramondioides to infer its divergence process. Nuclear and chloroplast DNA sequences were obtained from 21 Conandron populations on both sides of the East China Sea (ECS) to explore its genetic diversity, structure, and population differentiation. Interestingly, the reconstructed phylogeny indicated that the populations should be classified into three clades corresponding to geographical regions: the Japan (Honshu+Shikoku) clade, the Taiwan–Iriomote clade, and the Southeast China clade. Lineage divergence between the Japan clade and the Taiwan–Iriomote and Southeast China clades occured 1.14 MYA (95% HPD: 0.82–3.86), followed by divergence between the Taiwan–Iriomote and Southeast China clades approximately 0.75 MYA (95% HPD: 0.45–1.3). Furthermore, corolla traits (floral lobe length to tube length ratios) correlated with geographical distributions. Moreover, restricted gene flow was detected among clades. Lastly, the lack of potential dispersal routes across an exposed ECS seafloor during the last glacial maximum suggests that migration among the Conandron clades was unlikely. In summary, the extant Conandron exhibits a disjunct distribution pattern as a result of vicariance rather than long-distance dispersal. We propose that allopatric divergence has occurred in C. ramondioides since the Pleistocene. Our findings highlight the critical influence of species’ biological characteristics on shaping lineage diversification of East Asian relic herb species during climate oscillations since the Quaternary.

1. Introduction

Ornamental plants are known for their aesthetic appeal, and their horticultural history can be traced back to ancient Egypt [1]. At least 4500 ornamental plants originate from thirteen geographic regions worldwide, one of which is East Asia [2]. East Asia is known for its high plant diversity and endemism [3]. Landscape configuration changes caused by climatic oscillation and abundant landscape diversity are two key components in shaping plant diversity and endemism in the region [4,5].
It has been proposed that population differentiation is the driving force for plant speciation, which should involve the process of how barriers affect gene flow between previously interbreeding species [6,7]. East Asia comprises the Asia continent and adjacent islands, including the Japan archipelagos, the Ryukyu archipelagos, and the island of Taiwan. Since the Quaternary, these (currently separated) landmasses were repeatedly connected during glacial–interglacial periods [8,9], suggesting the appearance and disappearance of geographical barriers in this region through time. Two models are used to explain how species exhibit the disjunct distribution patterns often found under such circumstances. The first involves long-distance dispersal among suitable habitats. The second invokes vicariance owing to a range contraction of previously widely distributed populations. Relatively little is known regarding gene flow changes among separated populations after long-distance dispersal or vicariance has influenced population differentiation.
In East Asia, many plant species exhibit continent–island distribution patterns [10,11,12,13,14,15]. Studies of the genetic compositions of Cercidiphyllum japonicum [11], Kalopanax septemlobus [13], Quercus variabilis [10], and Viola orientalis [14] showed a genetic mixture between the East Asia continent and adjacent island populations. In contrast, studies of Platycrater arguta [12] and Dendrobium moniliforme [15] found that haplotypes were not shared and gene flow was restricted between continent and island populations. Moreover, the lack of predicted suitable habitats on the exposed East China Sea (ECS) seafloor suggests that migration of P. arguta populations over land was unlikely [12]. In studying the lineage divergence process of P. arguta, estimated restricted gene flow between populations distributed on the continent (China) and on islands (Japan) suggests a lack of migration between these populations since their first divergence. Exploring genetic compositions and modeling suitable habitat ranges from past geographical periods can allow researchers to explore the divergence process of target species. However, the role of post-divergence gene flow between continent- and island-distributed populations in shaping lineage divergence has not been sufficiently examined among the species mentioned above.
Conandron ramondioides is not only an East Asian endemic temperate understory herb but also an ornamental plant in the plant market. C. ramondioides is distributed across East China, Taiwan, southern Okinawa, and Japan but is absent in between these locations, thus exhibiting a disjunct distribution pattern. This has been interpreted as the species having migrated from the Asian continent to adjacent islands or fragmented from an ancient mega population in East Asia. Based on morphological traits (lobe length to tube length ratio) of samples obtained from Japan and Taiwan, C. ramondioides has previously been assigned to two varieties: C. ramondioides var. ramondioides and C. ramondioides var. taiwanensis [16]. However, the lineage divergence mechanism of C. ramondioides is not yet known. Two scenarios have been proposed so far: one is a recent long-distance dispersal scenario, and the other is a vicariance scenario. In the former, island-distributed C. ramondioides populations may have originated from the Asian continent, followed by dispersal to adjacent islands. The vicariance scenario proposes that populations currently distributed on the Asian continent and islands are fragments of an ancient mega population. We were especially interested in whether gene flow between C. ramondioides var. ramondioides and C. ramondioides var. taiwanensis took place during their evolutionary history. We used molecular markers and phylogeographical analysis to verify which scenario is the most likely to have occurred.
In phylogeographical studies, chloroplast DNA sequences (cpDNA) have been used successfully to infer relationships among closely related species or populations of plants [17,18,19,20]. However, cpDNA, like any other single gene (e.g., LEAFY), is subject to stochastic processes. The results of single-gene trees may be over-interpreted if researchers do not consider coalescent stochasticity [21]. To prevent over-interpretation of genealogy from a single gene, one can combine multiple genes (e.g., nuclear DNA loci) to provide more reliable inferences of population colonization history and population dynamics through time. Applying multiple nuclear DNA loci to infer population colonization history and population dynamics through time is advantageous because nuclear DNA is inherited from two parents, and the substitution rates are often faster in nuclear loci than those of molecular markers in the cpDNA [22]. Using both cpDNA and nrDNA markers has the combined advantage of enabling the identification of evolutionary history differences between organelles and populations.
In this study, we performed a phylogeographic survey of C. ramondioides by examining genetic variations obtained from both nrDNA (including ATG2 intron 1, GroES intron 1, LEAFY intron 1, ITS, and CrCYC1) and cpDNA (including trnL-trnF and trnH-psbA) markers of 21 C. ramondioides populations in East Asia. We aimed (i) to reveal genetic relationships, approximate divergence time, and gene flow between continent- and island-distributed Conandron populations; (ii) to verify whether their taxonomic classification corresponds to their genetic relationships; and (iii) to reveal the potential suitable habitat range via simulation of Conandron during the last glacial maximum (LGM).

2. Results

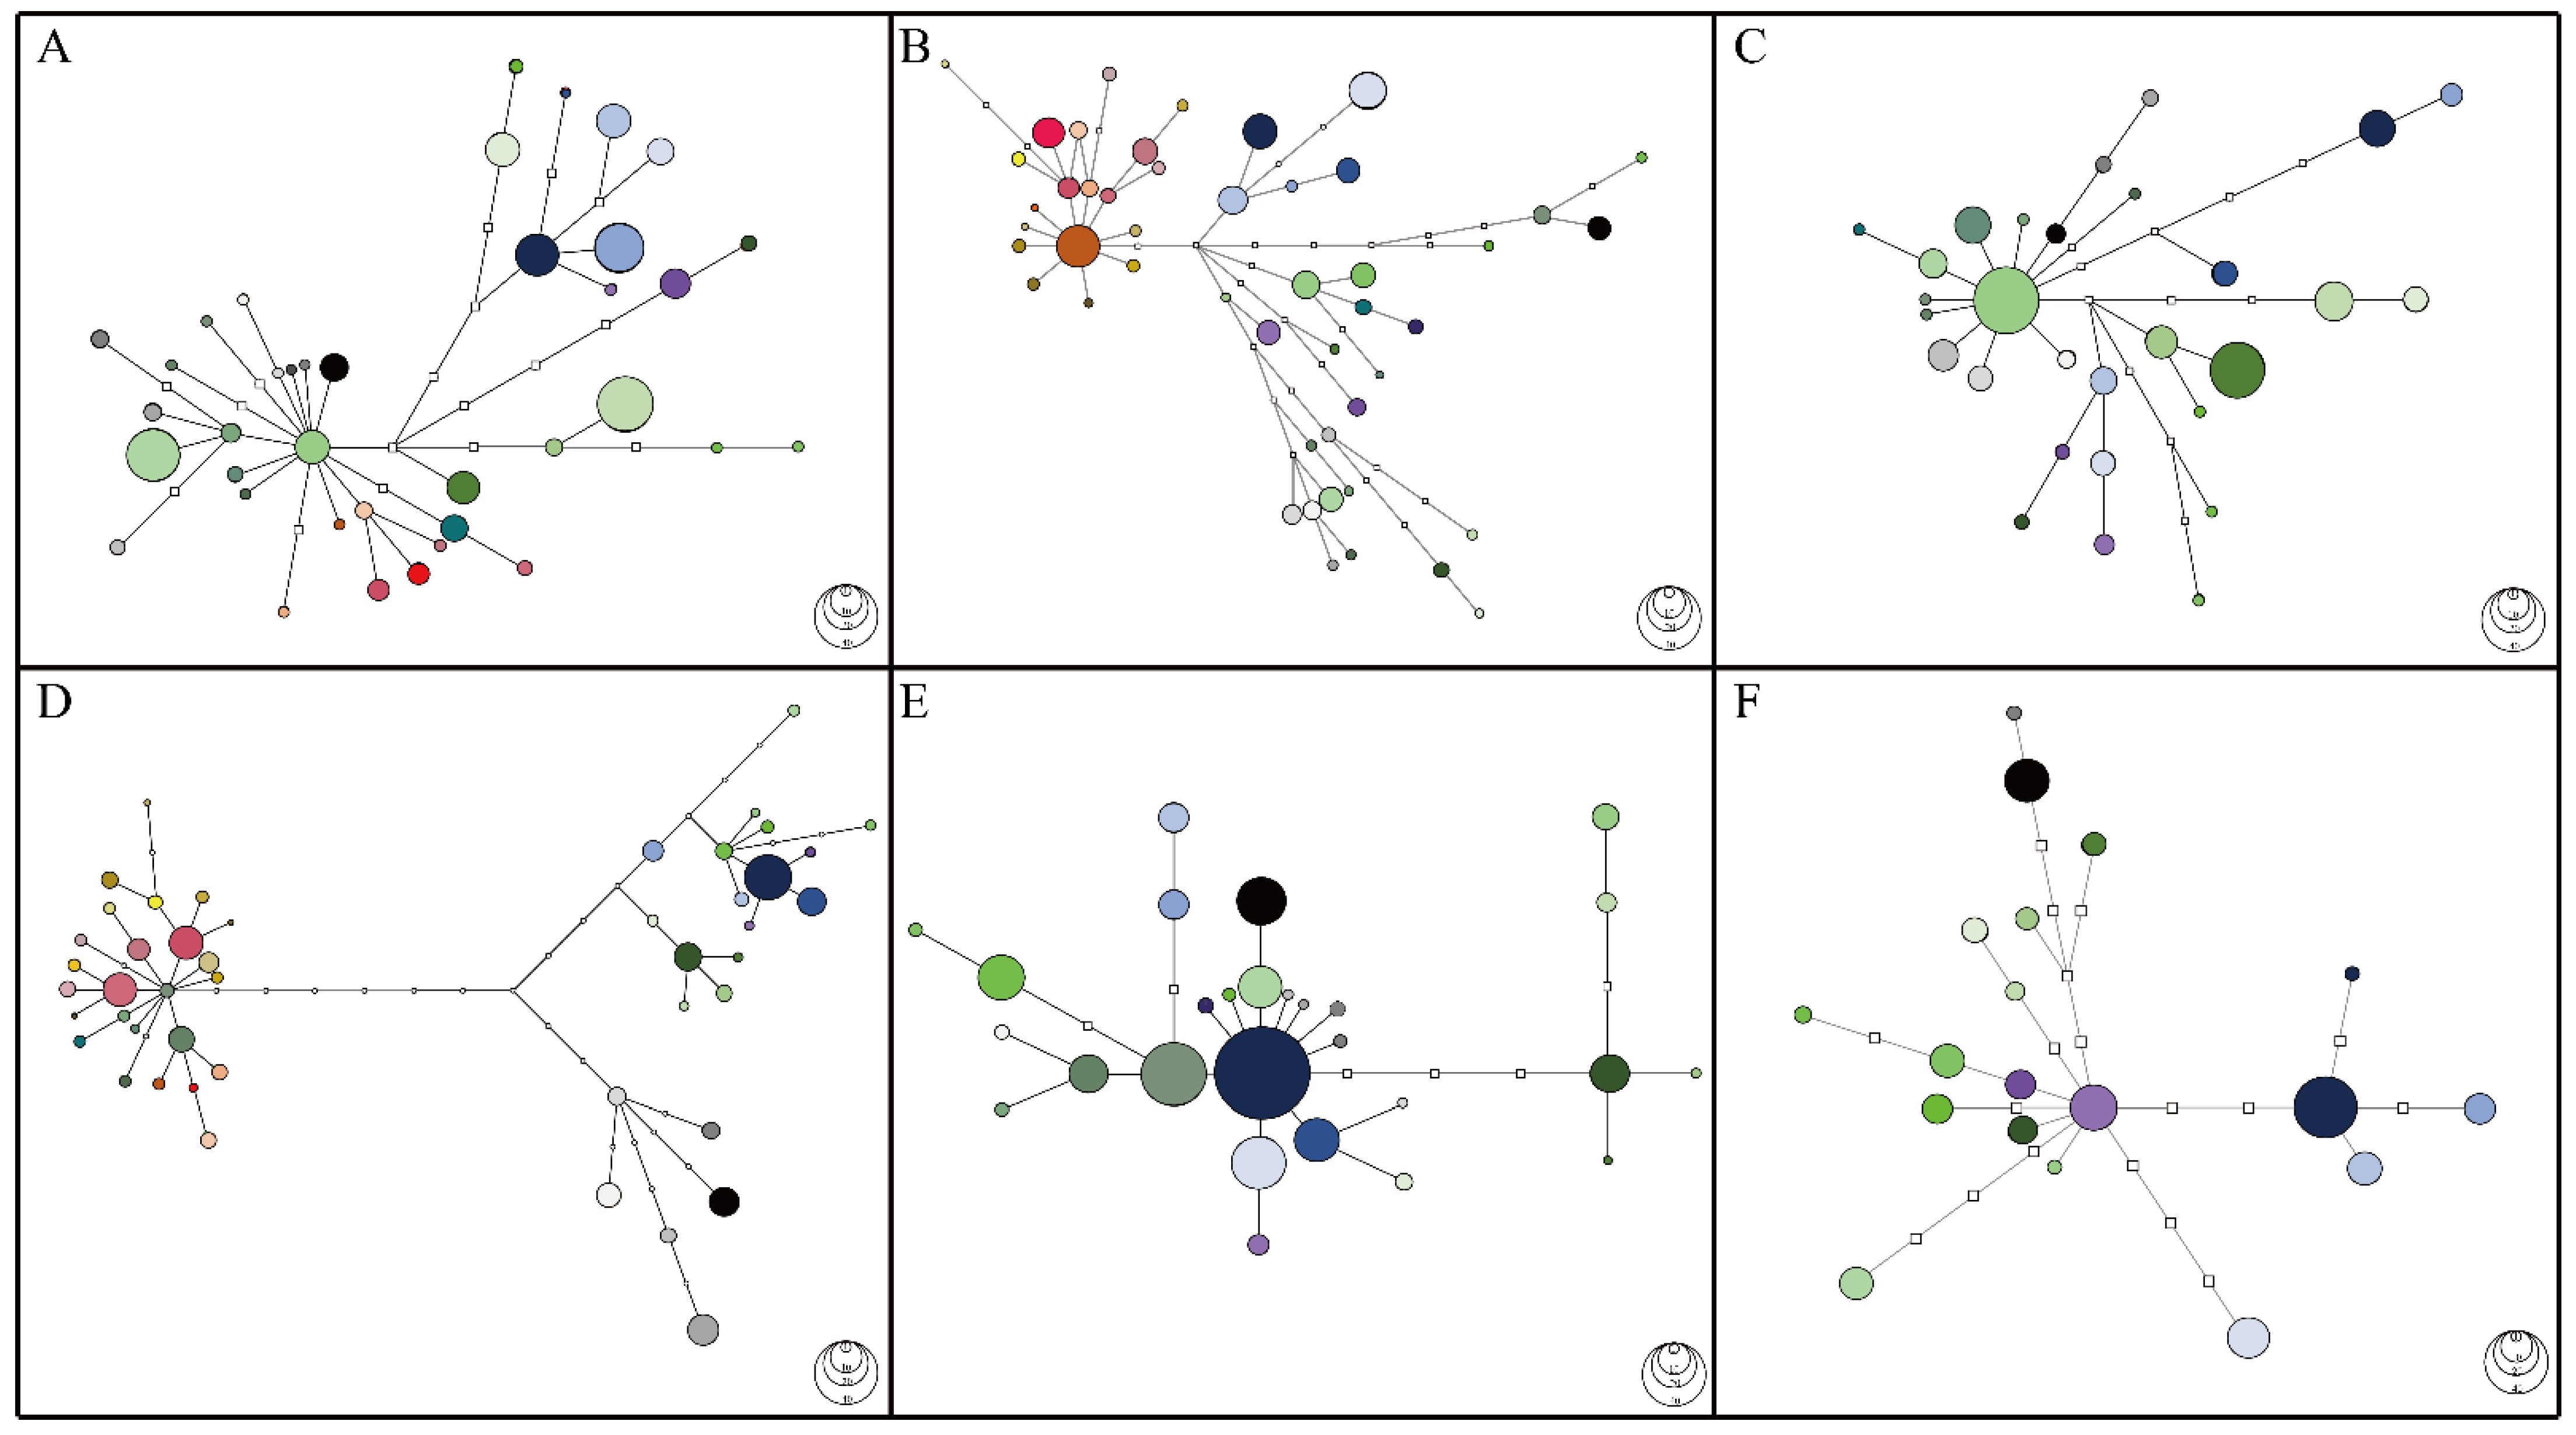
2.1. Haplotype Networks Reconstructed from Four Low-Copy Markers Reveal Three Groups of C. ramondioides Haplotypes Which Correspond to Geographical Locations

To infer the phylogeographic distribution pattern of C. ramondioides in East Asia (Figure 1), we reconstructed the haplotype network of each molecular marker used in this study. In total, 38, 47, 28, and 45 haplotypes were identified from the ATG intron 1, GroES intron 1, LFY intron 1, and CrCYC1 datasets, respectively (Figure 2A–D). Among the reconstructed haplotype network of the ATG intron 1, GroES intron 1, and LFY intron 1 datasets, the haplotypes distributed across SE-China formed a single group (Figure 2A–C). Haplotypes occurring in Taiwan and Iriomote descended from one Taiwan–Iriomote shared haplotypes among these three reconstructed haplotype networks, while haplotypes distributed in Honshu and Shikoku formed multiple lineages (Figure 2A–C). The haplotypes distributed across SE-China were two to four mutational steps away from the haplotypes distributed in the Taiwan–Iriomote region, while those distributed in Honshu and Shikoku were two to seven mutational steps away (Figure 2A–C). In the reconstructed CrCYC1 haplotype network, haplotypes formed three distinct groups, which corresponded to their geographical region with 10 to 11 mutational steps between each group (Figure 2D).
Among these four haplotype networks, the CrCYC1 topology formed three distinct groups with long mutational steps between clades. The phenomenon might be due to either the fast evolution of GCYC in Gesneriaceae or the fact that GCYC has been subjected to non-neutral evolution, or both. Furthermore, GCYC is a functional gene in regulating floral symmetry in Gesneriaceae and is subjected to selection. CrCYC1 is a member of the GCYC. To evaluate whether CrCYC1 evolved neutrally, the McDonald–Kreitman test was performed (see “Significant MK test results suggested that CrCYC1 deviates from the neutral evolution hypothesis” section). In summary, haplotype networks reconstructed from four low-copy nuclear markers suggested that haplotypes of C. ramondioides formed three groups corresponding to geographical regions.

2.2. Two Groups of C. ramondioides Are Proposed from the Reconstructed ITS Ribotype Network

Two groups may be identified from the reconstructed ITS ribotype network. One group includes haplotypes distributed across Honshu, SE-China, Taiwan, and Iriomote, with rare ribotypes connecting to it. The second group represents ribotypes descending from ribotypes distributed in Honshu–Iriomote, which differ from the former ribotype by four mutational steps (Figure 2E).
Unlike the three haplotype groups reconstructed from low-copy nuclear markers, noted above, multiple haplotypes connected to one geographically broadly distributed ITS ribotype were situated in the center of the ITS ribotype network (Figure 2E). The ITS marker is a product of concerted evolution, a process leading to the homogenization of different genes in a gene family—our sequencing chromatograms show multiple peaks at one site. Since C. ramondioides is reported as a diploid species, we expected no more than two types of alleles of C. ramondioides ITS to be present. Clone technology was applied to determine whether C. ramondioides ITS achieves concerted evolution.

2.3. Two Groups of C. ramondioides Are Shown by the Reconstructed cpDNA Haplotype Network

In the reconstructed cpDNA haplotype network, multiple lineages connected to a SE-China- and Taiwan-distributed haplotype form a star-like topology. Honshu- and Shikoku-distributed haplotypes formed two single lineages in the reconstructed haplotype network (Figure 2F).
When comparing the cpDNA topology with the other topologies, the Southeast China group cpDNA haplotypes formed multiple lineages instead of the monotypic lineages shown by the other four low-copy nuclear markers. As cpDNA is a maternally inherited and haploid genome, genetic drift should influence it at least four times faster than nrDNA, which should result in more complete lineage sorting. However, this was not the case in the China cpDNA haplotype. Therefore, both Tajima’s D and Fu’s Fs tests were run to examine whether cpDNA isolated from Conandron occurring in China deviates from neutral evolution.

2.4. Significant MK Test Results Suggest That CrCYC1 Deviates from the Neutral Evolution Hypothesis

To evaluate whether the CrCYC1 gene deviates from the neutral evolution hypothesis, a McDonald–Kreitman (MK) test was run. If Pn/Ps is not significantly different from Dn/Ds, this indicates that CrCYC1 does not deviate from the neutral hypothesis. The results show that Pn/Ps within C. ramondioides (20/5) was significantly higher than Dn/Ds between C. ramondioides and C. umbellifera (24/24; p = 0.013) (Table 1). The higher within-species Pn/Ps ratio than between-species Dn/Ds ratio was also observed when using GCYC1 of Hemiboea bicornuta and Oreocharis benthamii as outgroup sequences, respectively (Table 1). Significant MK test results suggest that the CrCYC1 dataset deviated from the neutral hypothesis, and it was thus excluded from further analysis.

2.5. Multiple ITS Haplotypes Were Identified from Selected Conandron Individuals

Eight Conandron individuals (two from Honshu and Shikoku, three from Southeast China, and three from Taiwan) were used to verify whether internal transcribed spacers (ITS) amplified from Conandron were subjected to concerted evolution. We obtained multiple haplotypes (ranging from three to six) from colony sequences (Supplementary Table S3). High haplotype numbers both suggested high intra-individual polymorphism of Conandron ITS and indicate incomplete concerted evolution of Conandron ITS. In addition, a recombination event is also detected in this dataset. Both incomplete concerted evolution and recombination contribute to ITS diversity in Conandron. Therefore, we excluded ITS from our multi-nuclear loci dataset to prevent it from blurring evolutionary signals of the Conandron populations.

2.6. Significant Tajima’s D and Fu’s Fs Suggest cpDNA Amplified from Southeast China Deviate from Neutral Evolution

The neutral theory assumes that a small effective population size is more likely to be significantly affected by evolutionary processes than a large effective population size. In diploid species, the effective population size of nrDNA is four times greater than that of cpDNA, and consequently, the effect of genetic drift should be four times faster. However, our results are contrary to this expectation. In the haplotype networks, China haplotypes formed a monophyletic group based on the three single-copy nuclear markers (Figure 2A–C) but not on the cpDNA marker (Figure 2F). We therefore assumed that the cpDNA from China may not have evolved neutrally. To test this assumption, we calculated Tajima’s D and Fu’s Fs to examine deviation from neutrality. We applied these two neutrality tests to both nrDNA and cpDNA markers.
Our results show that both test metrics significantly departed from neutrality in the cpDNA dataset, in contrast to those from the nrDNA markers (Table 2). The positive value derived from the neutrality test suggests that China’s population may experience diversifying selection. This result may explain why the China populations of C. ramondioides maintain genetic variation instead of losing genetic variation via genetic drift.

2.7. Genetic Diversity Measured in Conandron Populations

In total, 208 AGT intron 1 sequences, 270 GroES intron 1 sequences, and 192 LFY intron 1 sequences were retrieved from our ampliqon library. Reads of AGT intron 1 ranged from 102 reads to 1524 reads, reads of GroES intron 1 ranged from 524 reads to 3383 reads, and reads of LFY intron 1 ranged from 102 reads to 3011 reads. Comparisons of the genetic diversity indices (Hd and π) calculated from these molecular markers of C. ramondioides populations adjacent to the ECS provided equivocal genetic diversity index patterns (North: Hd, π vs. South: Hd, π, NorthATG2 intron1: Hd = 0.736; π = 4.64 × 10⁻³ vs. SouthATG2 intron1: Hd = 0.9; π = 5.64 × 10⁻³, NorthGroES intron1: Hd = 0.925; π = 13 × 10−3 vs. SouthGroES intron1: Hd = 0.818; π = 4.71 × 10⁻³, NorthLEAFY intron1: Hd = 0.823; π = 6.63 × 10⁻³ vs. SouthLEAFY intron1: Hd = 0.818; π = 6.15 × 10⁻³, NorthCrCYC1: Hd = 0.897; π = 4.7 × 10⁻³ vs. SouthCrCYC1: Hd = 0.937; π = 10.32 × 10⁻³, NorthITS: Hd = 0.802; π = 4.43 × 10⁻³ vs. SouthITS: Hd = 0.839; π = 3.43 × 10⁻³, NorthcpDNA: Hd = 0.633; π = 2.49 × 10⁻³ vs. SouthcpDNA: Hd = 0.894; π = 3.95 × 10⁻³) (Figure 3A,B; details are listed in Supplementary Table S1). A comparison of these two genetic indices obtained from populations located on either side of the Taiwan strait also showed equivocal patterns (TI: Hd, π vs. C: Hd, π, TIATG2 intron1: Hd = 0.86; π = 5.2 × 10⁻³ vs. CATG2 intron1: Hd = 0.68; π = 2.16 × 10⁻³, TIGroES intron1: Hd = 0.659; π = 2.26 × 10⁻³ vs. CGroES intron1: Hd = 0.726; π = 4.19 × 10⁻³, TILEAFY intron1: Hd = 0.738; π = 2.67 × 10⁻³ vs. CLEAFY intron1: Hd = 0.623; π = 5.02 × 10⁻³, TICrCYC1: Hd = 0.911; π = 3.02 × 10⁻³ vs. CCrCYC1: Hd = 0.818; π = 5.54 × 10⁻³, TIITS: Hd = 0.731; π = 3.45 × 10⁻³ vs. CITS: Hd = 0.777; π = 3.93 × 10⁻³, TIcpDNA: Hd = 0.883; π = 4.47 × 10⁻³ vs. CcpDNA: Hd = 0.821; π = 6.34 × 10⁻³) (Figure 3C,D, details are listed in Supplementary Table S1).

2.8. Significant Fst Suggests Population Differentiation among Assigned Geographical Regions

Significant pairwise Fst values are measured among three assigned groups of all markers (Table 3). For the ATG2 intron 1, the measured Fst values ranged from 0.571 to 0.748. For the GroES intron 1, the measured Fst values ranged from 0.298 to 0.513. As to the LFY intron 1 dataset, the measured Fst values ranged from 0.472 to 0.848. Lastly, the measured Fst value of cpDNA ranged from 0.269 to 0.35. The hierarchical AMOVA analysis of nuclear markers showed that either the highest or second highest genetic variation was assigned to the “among group” class (Table 4). The values of genetic variation assigned to the “among group” class were 39.61%, 36.75% and 47.81% of ATG2 intron 1, GroES intron 1, and LFY intron 1, respectively.

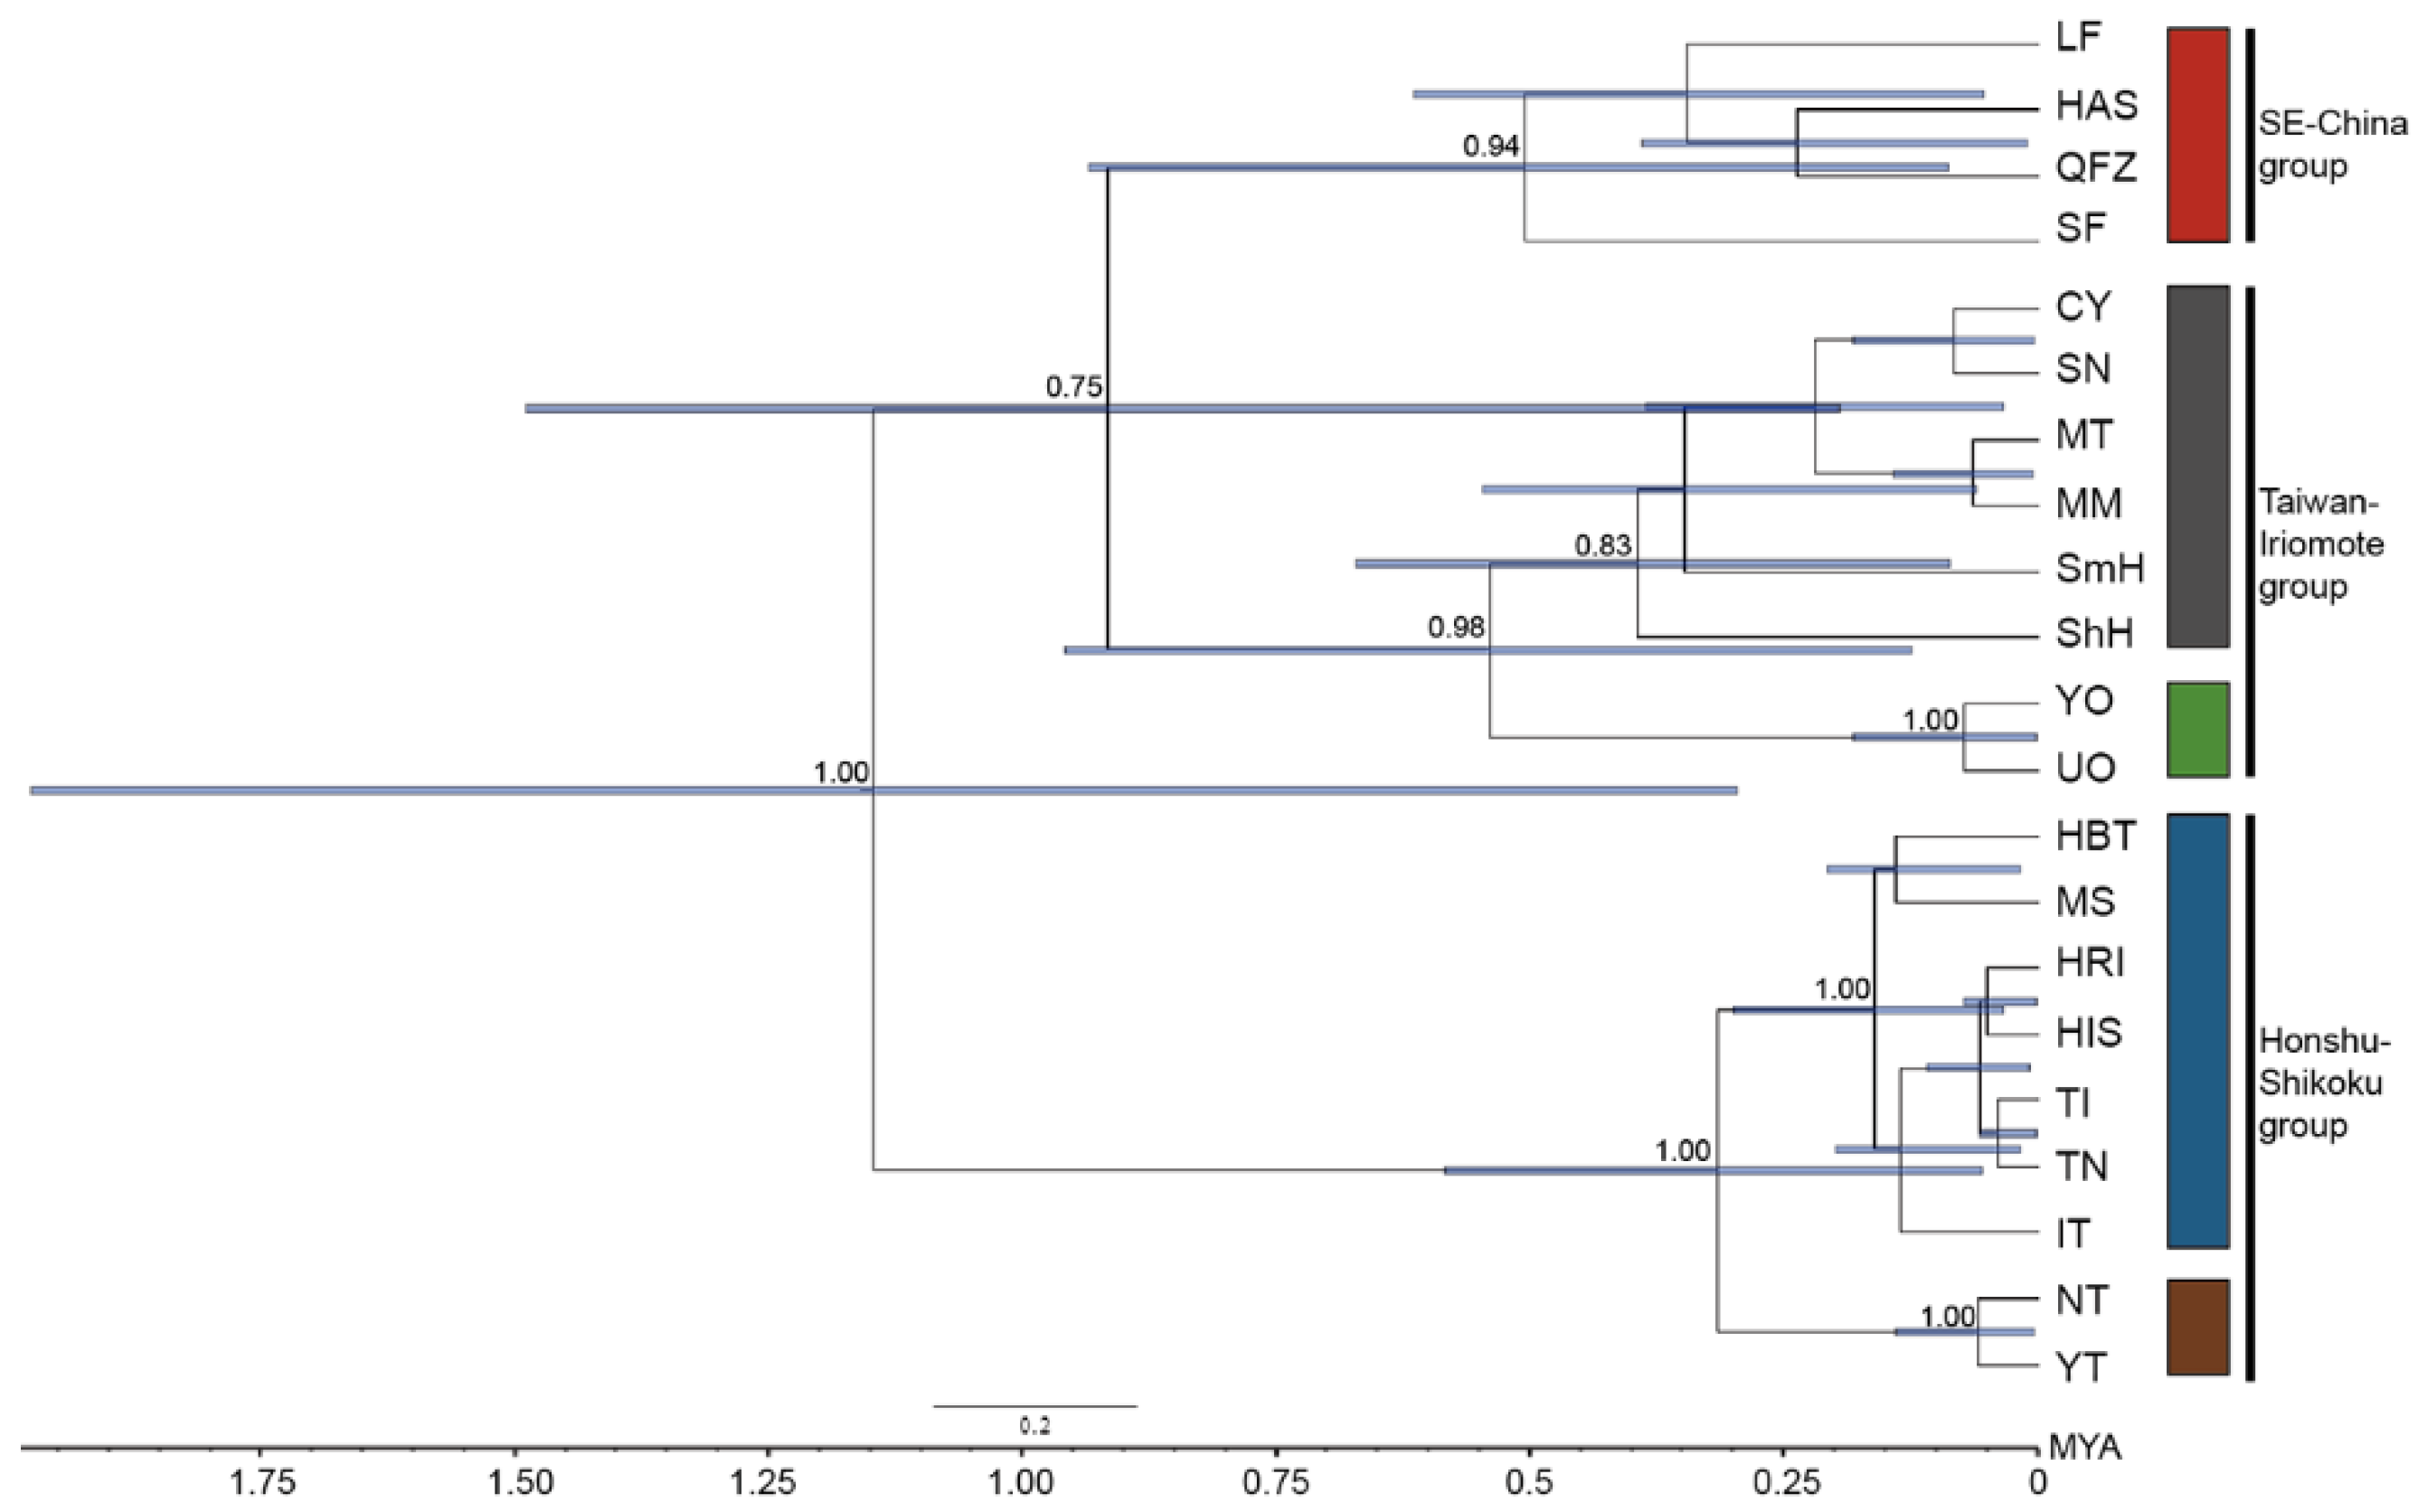
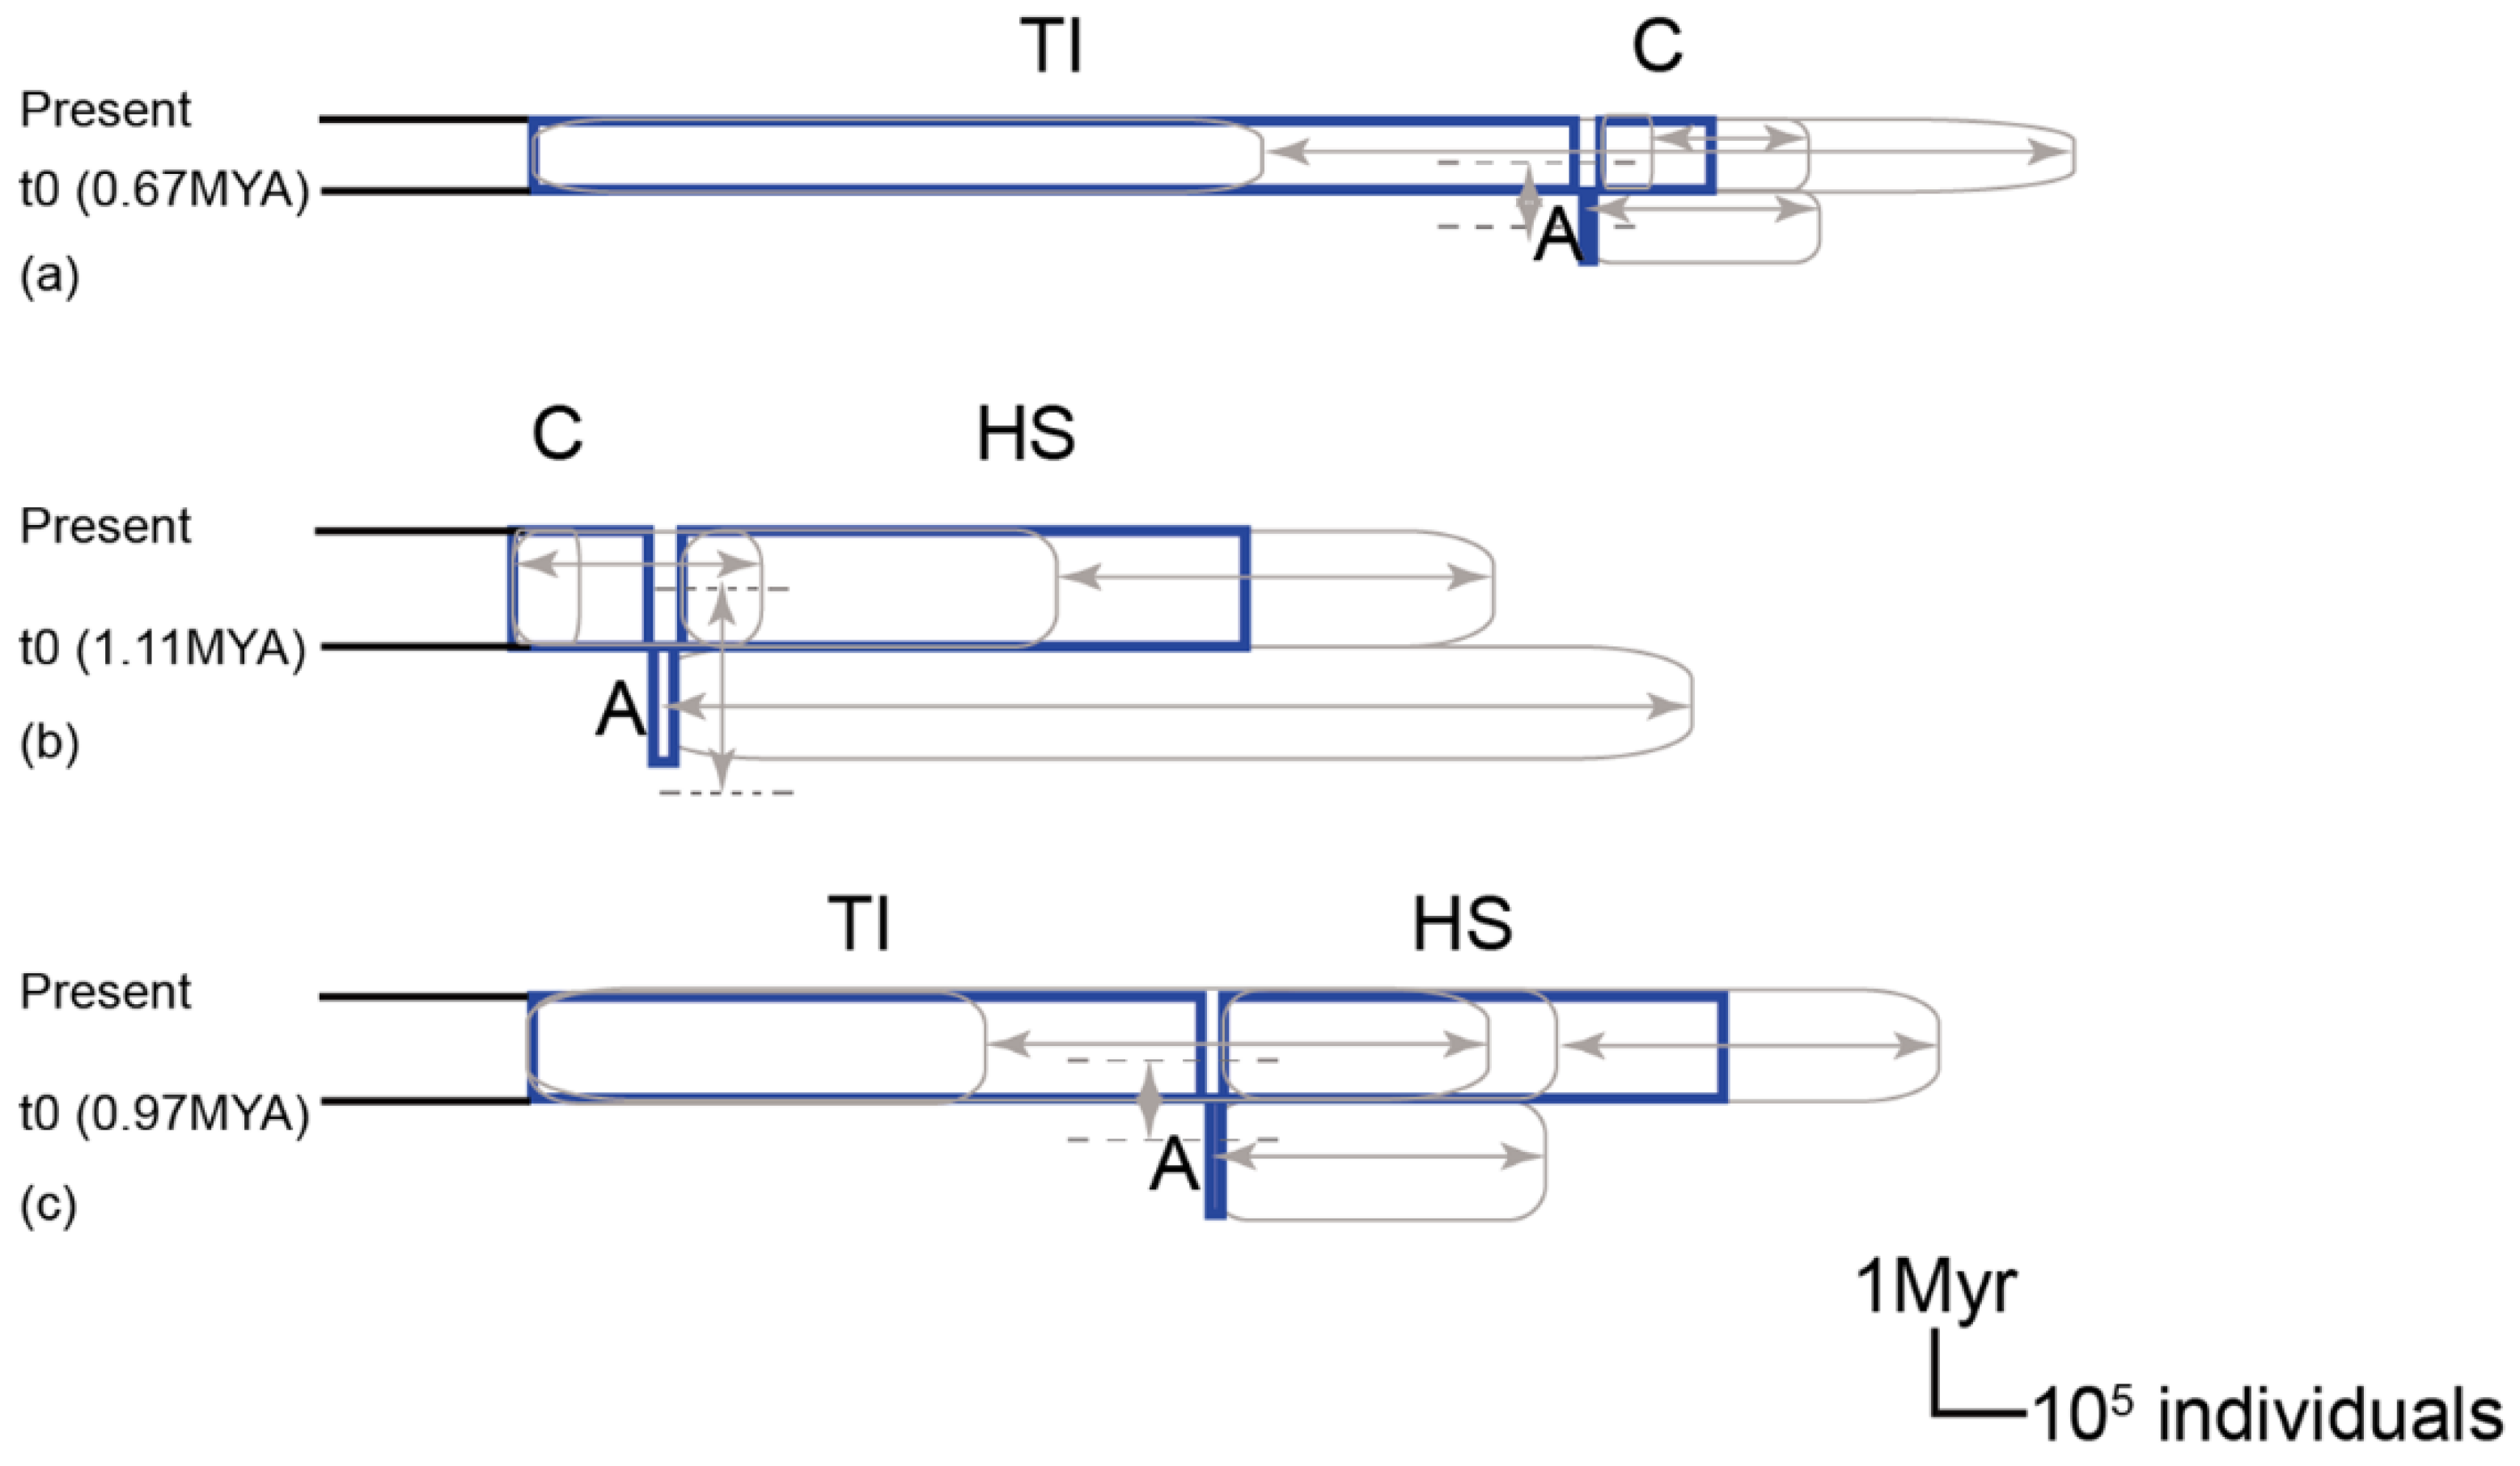
2.9. Lineage Divergence Order and Divergence Time among C. ramondioides Lineages Revealed by nrDNA

To trace the lineage divergence process of C. ramondioides, the species phylogeny was reconstructed by using the genetic information from the aforementioned three nuclear markers, including ATG2 intron 1, GroEs intron 1, and LFY intron 1. The reconstructed phylogeny showed C. ramondioides was assigned into five monophyletic clades with moderately to highly statistic support (posterior probability ≥0.75) (Figure 4). The Taiwan- and Iriomote-distributed populations were grouped with high statistical support (posterior probability = 0.98). This clade is referred to as the Taiwan–Iriomote clade for further isolation with migration model analysis. Then, the Taiwan–Iriomote clade was grouped with populations distributed in Southeast China (posterior probability = 0.75). The Honshu- and Shikoku-distributed C. ramondioides populations formed a monophyletic clade with high statistic support (posterior probability = 1). Lastly, the estimated lineage divergence time between the Honshu–Shikoku clade and the Southeast China–Taiwan–Iriomote clades was dated back to 1.13 (95% CI: 0.26–1.8) million years ago (MYA), while the estimated divergence time between the Southeast-China-distributed population and those distributed in Taiwan and Iriomote occurred 0.75 million years ago (95% CI: 0.37–1).
For the multi-population IMa2 analysis, we present summary statistics in Figure 5 and the marginal posterior density distribution in Figure S1. The mean estimates for times of split indicate divergence between the SE-China lineage (C) and the Taiwan–Iriomote lineage (TI) (t0) and between the common ancestor (A) of the C, TI, and Honshu + Shikoku (HS) lineages (t1) occurring 0.75 MYA (95%HPD: 0.45–1.3) and 1.14 MYA (95%HPD: 0.82–3.86), respectively. However, the confidence interval of t1 was relatively broad and provided a flat marginal distribution (Supplementary Figure S3a). One of eight migration parameters (2Nm) had non-zero peaks between the common ancestor of C and TI to HS (Supplementary Figure S3d). Mean estimates of adequate population size for the extant lineages were 547,070 individuals for the HS group, 810,240 individuals for the TI lineage, and 122,784 individuals for the C group. Flat and broad marginal posterior density distributions were provided for the effective ancestral population sizes, which provides little information regarding these parameters (Supplementary Figure S3b).
To further evaluate the reliability of multi-population IMa2 analysis, a pairwise IMa2 analysis was conducted. The divergence event between the TI and C group occurred the most recently (ca. 0.67 MYA with 95%HPD: 0.28–0.7 MYA) (Figure 6). The lineage divergence times estimated between the HS–C and the HS–TI pairs are 1.11 and 0.97 million years ago, respectively (Figure 6). By arranging the divergence time estimated from our pairwise IMa2 analysis, one can conclude that the divergence between HS and the TI–C occurred firstly, following divergence between TI and C group. The highest estimated effective population size of assigned C. ramondioides was the TI group, then HS group and finally C group (Supplementary Figure S4b,d). The estimated geneflow among C. ramondioides groups all peaked at 0 (Supplementary Figure S4e–g). Lastly, the broad and flat marginal posterior probability curves of the ancestral population suggested little information available for those estimated ancestral population parameters.

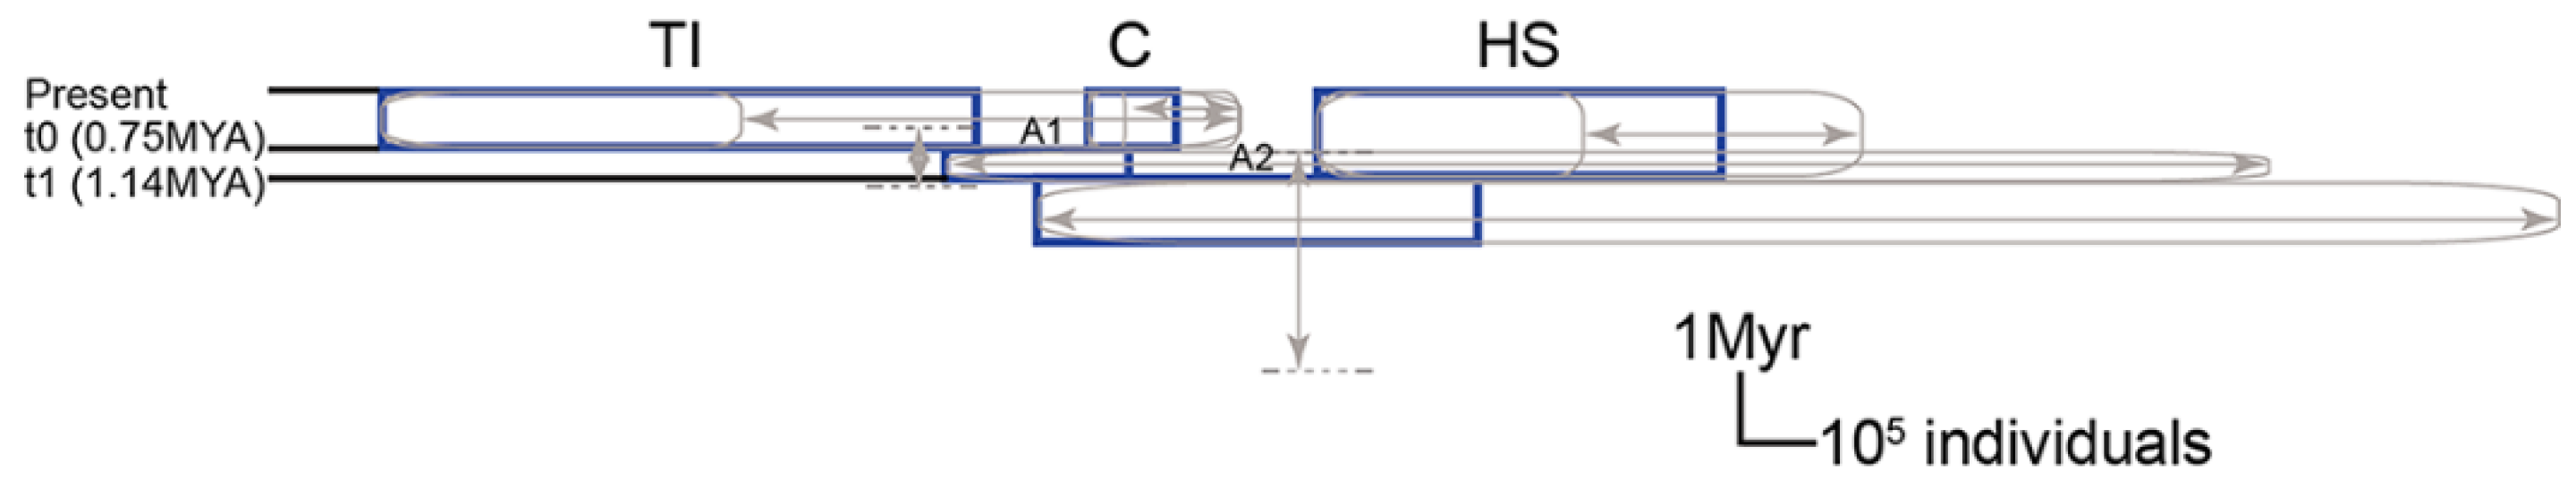
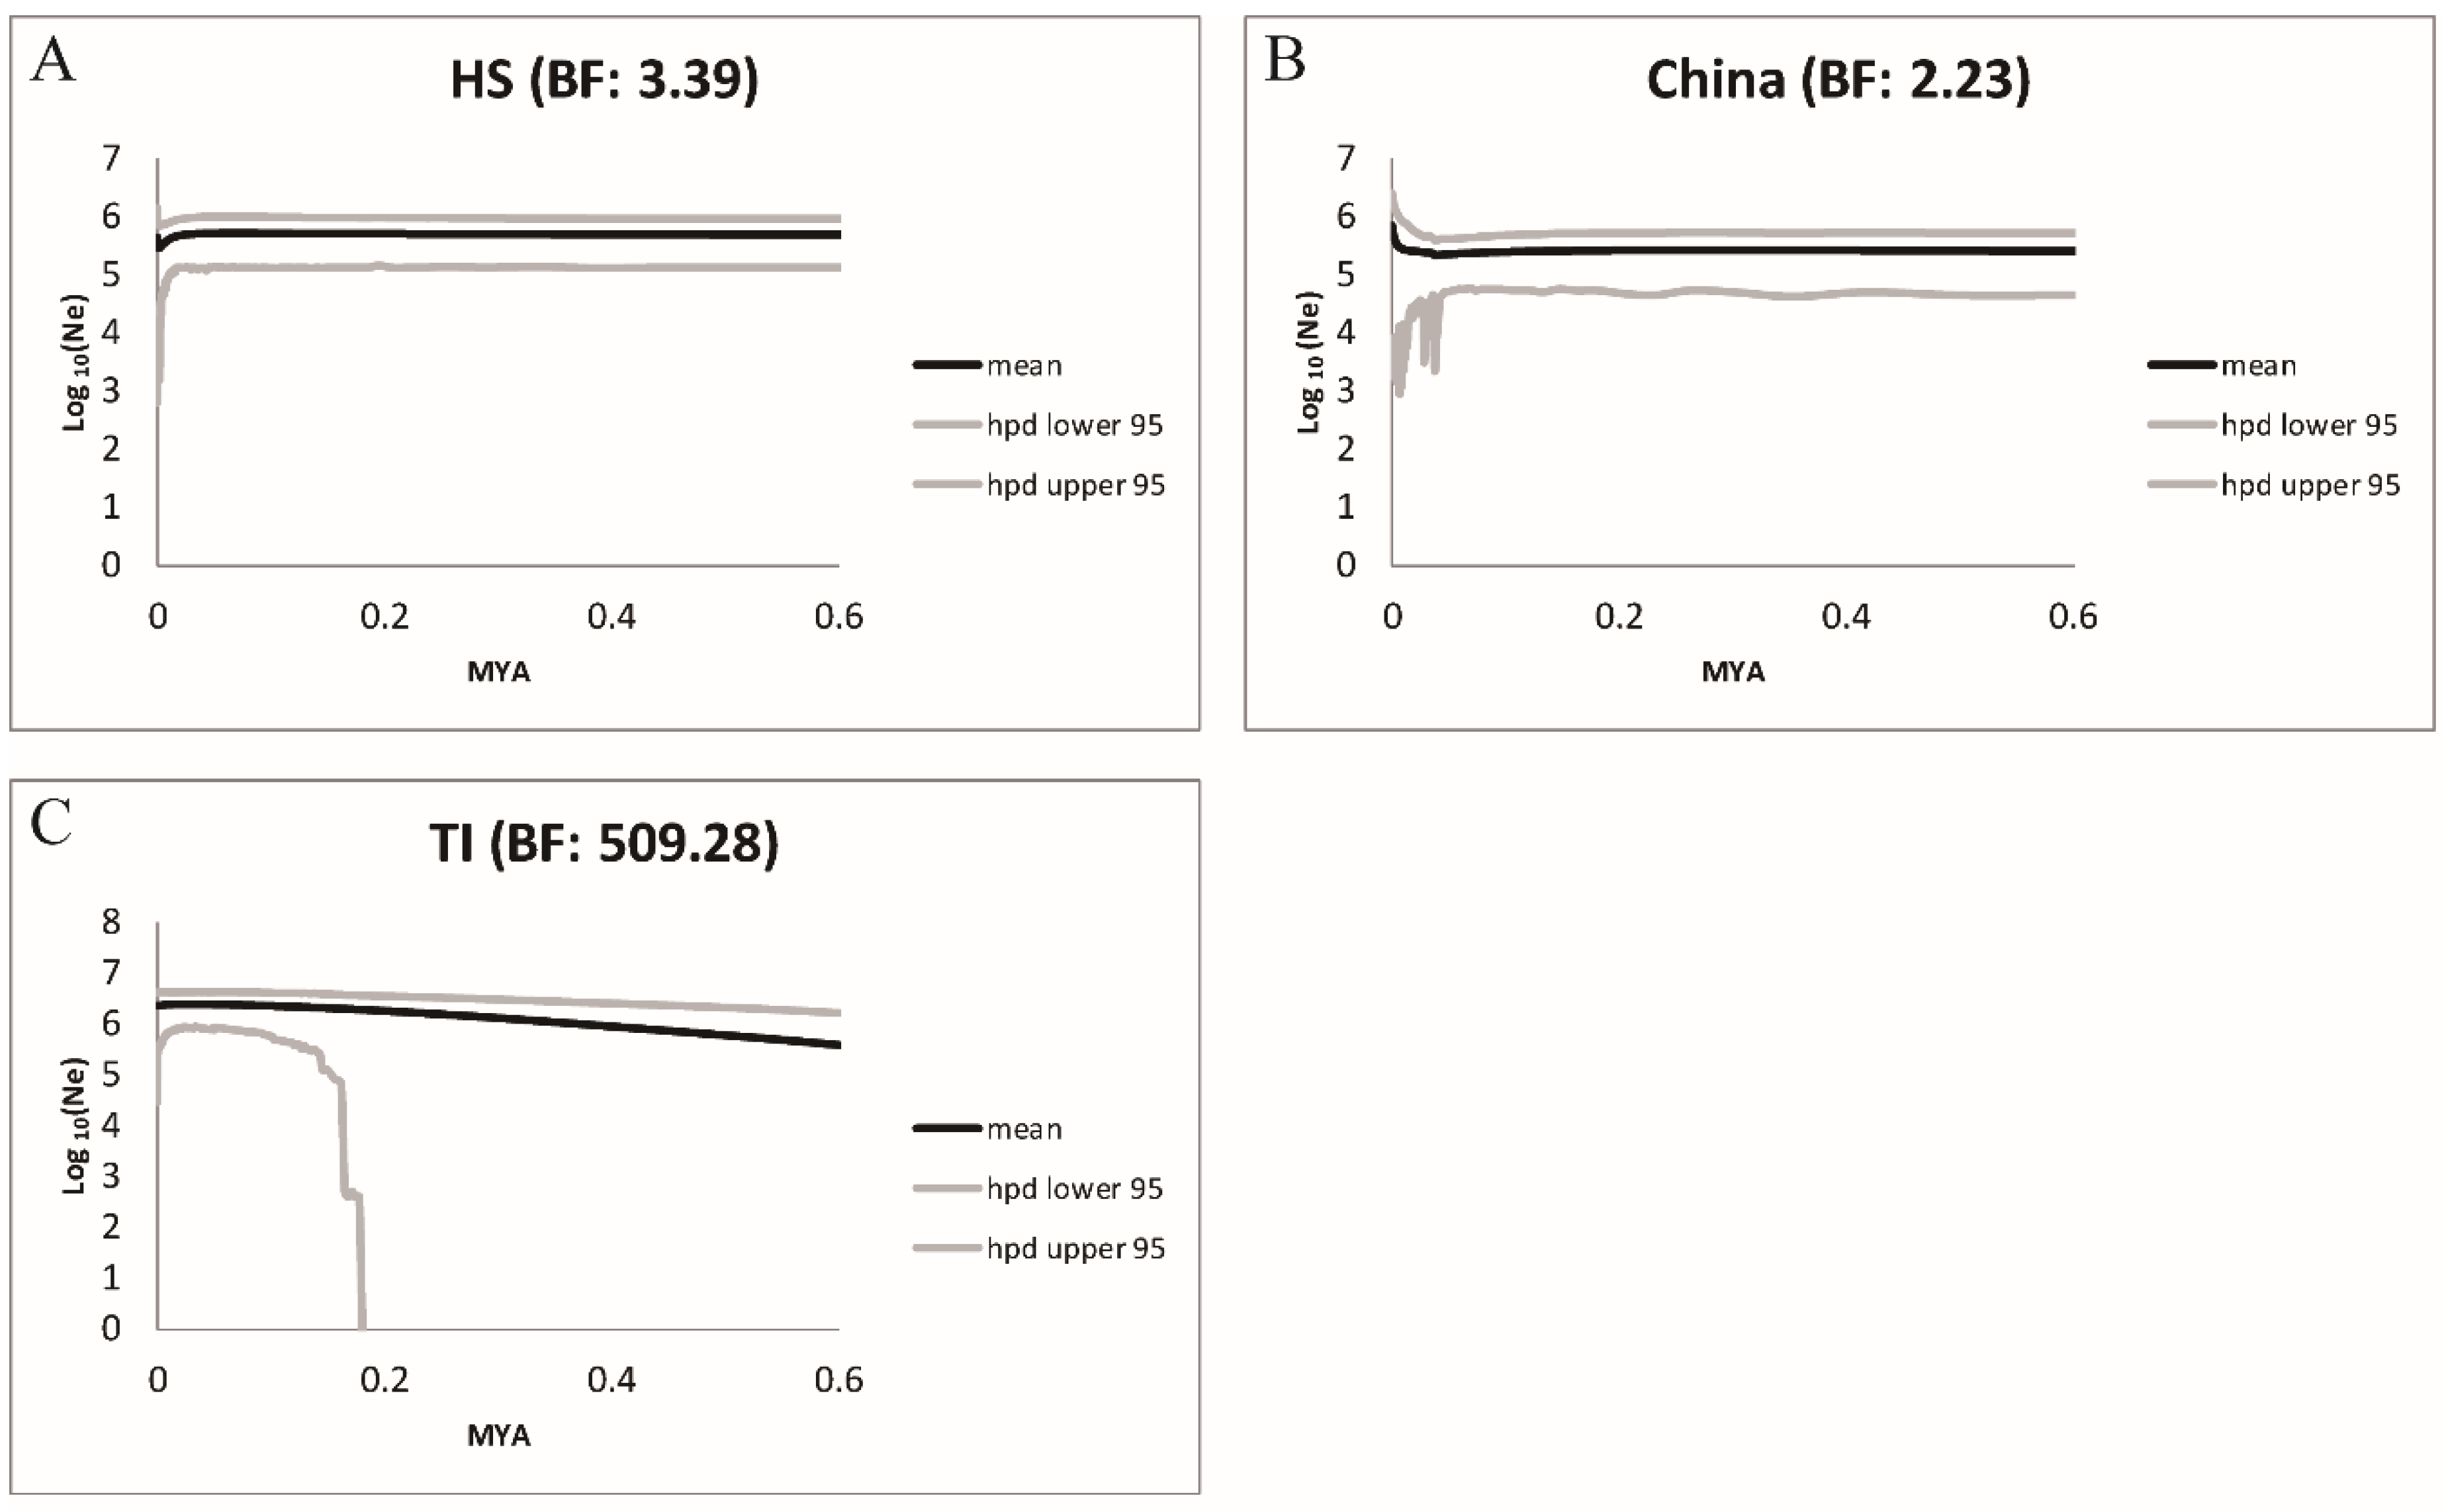
2.10. Population Dynamic through Time of Conandron

Most sampled populations in Taiwan exhibit non-significant negative Tajima’s D values estimated from nuclear markers and cpDNA markers (see Supplementary Table S1). Non-significant Tajima’s D values were also observed in individual populations and regional groups in Honshu and Shikoku. The non-significant Tajima’s D values were also obtained from Southeast China populations. In contrast, significant negative Fu’s Fs values were observed for the regional dataset, including Taiwan and Taiwan–Iriomote–Southeast China (see Supplementary Table S1, p < 0.05, bold numbers). It is regarded that Fu’s Fs is more sensitive for identifying population expansion and past population growth. Therefore, population expansion may have been restricted to Taiwan and Iriomote. Furthermore, population contraction may have been restricted to individual Honshu and Shikoku populations due to most populations and regional groups exhibiting non-significant positive Fu’s Fs values (see Supplementary Table S1). Most individual population and regional groups showed non-significant or slightly negative or positive Tajima’s D and Fu’s Fs values, suggesting a lack of population dynamics of Conandron in East Asia.
To trace population size change through time, an EBSP was applied to the HS, C, and TI groups. Our EBSP reconstructed from the HS group showed that the HS group has remained stable in population size since 0.6 MYA, and then experienced a recent population size decline (Figure 7A, BF = 3.39). The EBSP of the Southeast China group exhibited flat and narrow credible intervals, which hint at the Southeast China group maintaining stable population size since 0.2 MYA (Figure 7B, BF = 2.23). Lastly, the EBSP curve of the TI group exhibit a gradually increasing trend since 0.2MYA (Figure 7C, BF = 509.28). To conclude, the Conandron groups maintained a stable effective population size trend in East Asia.

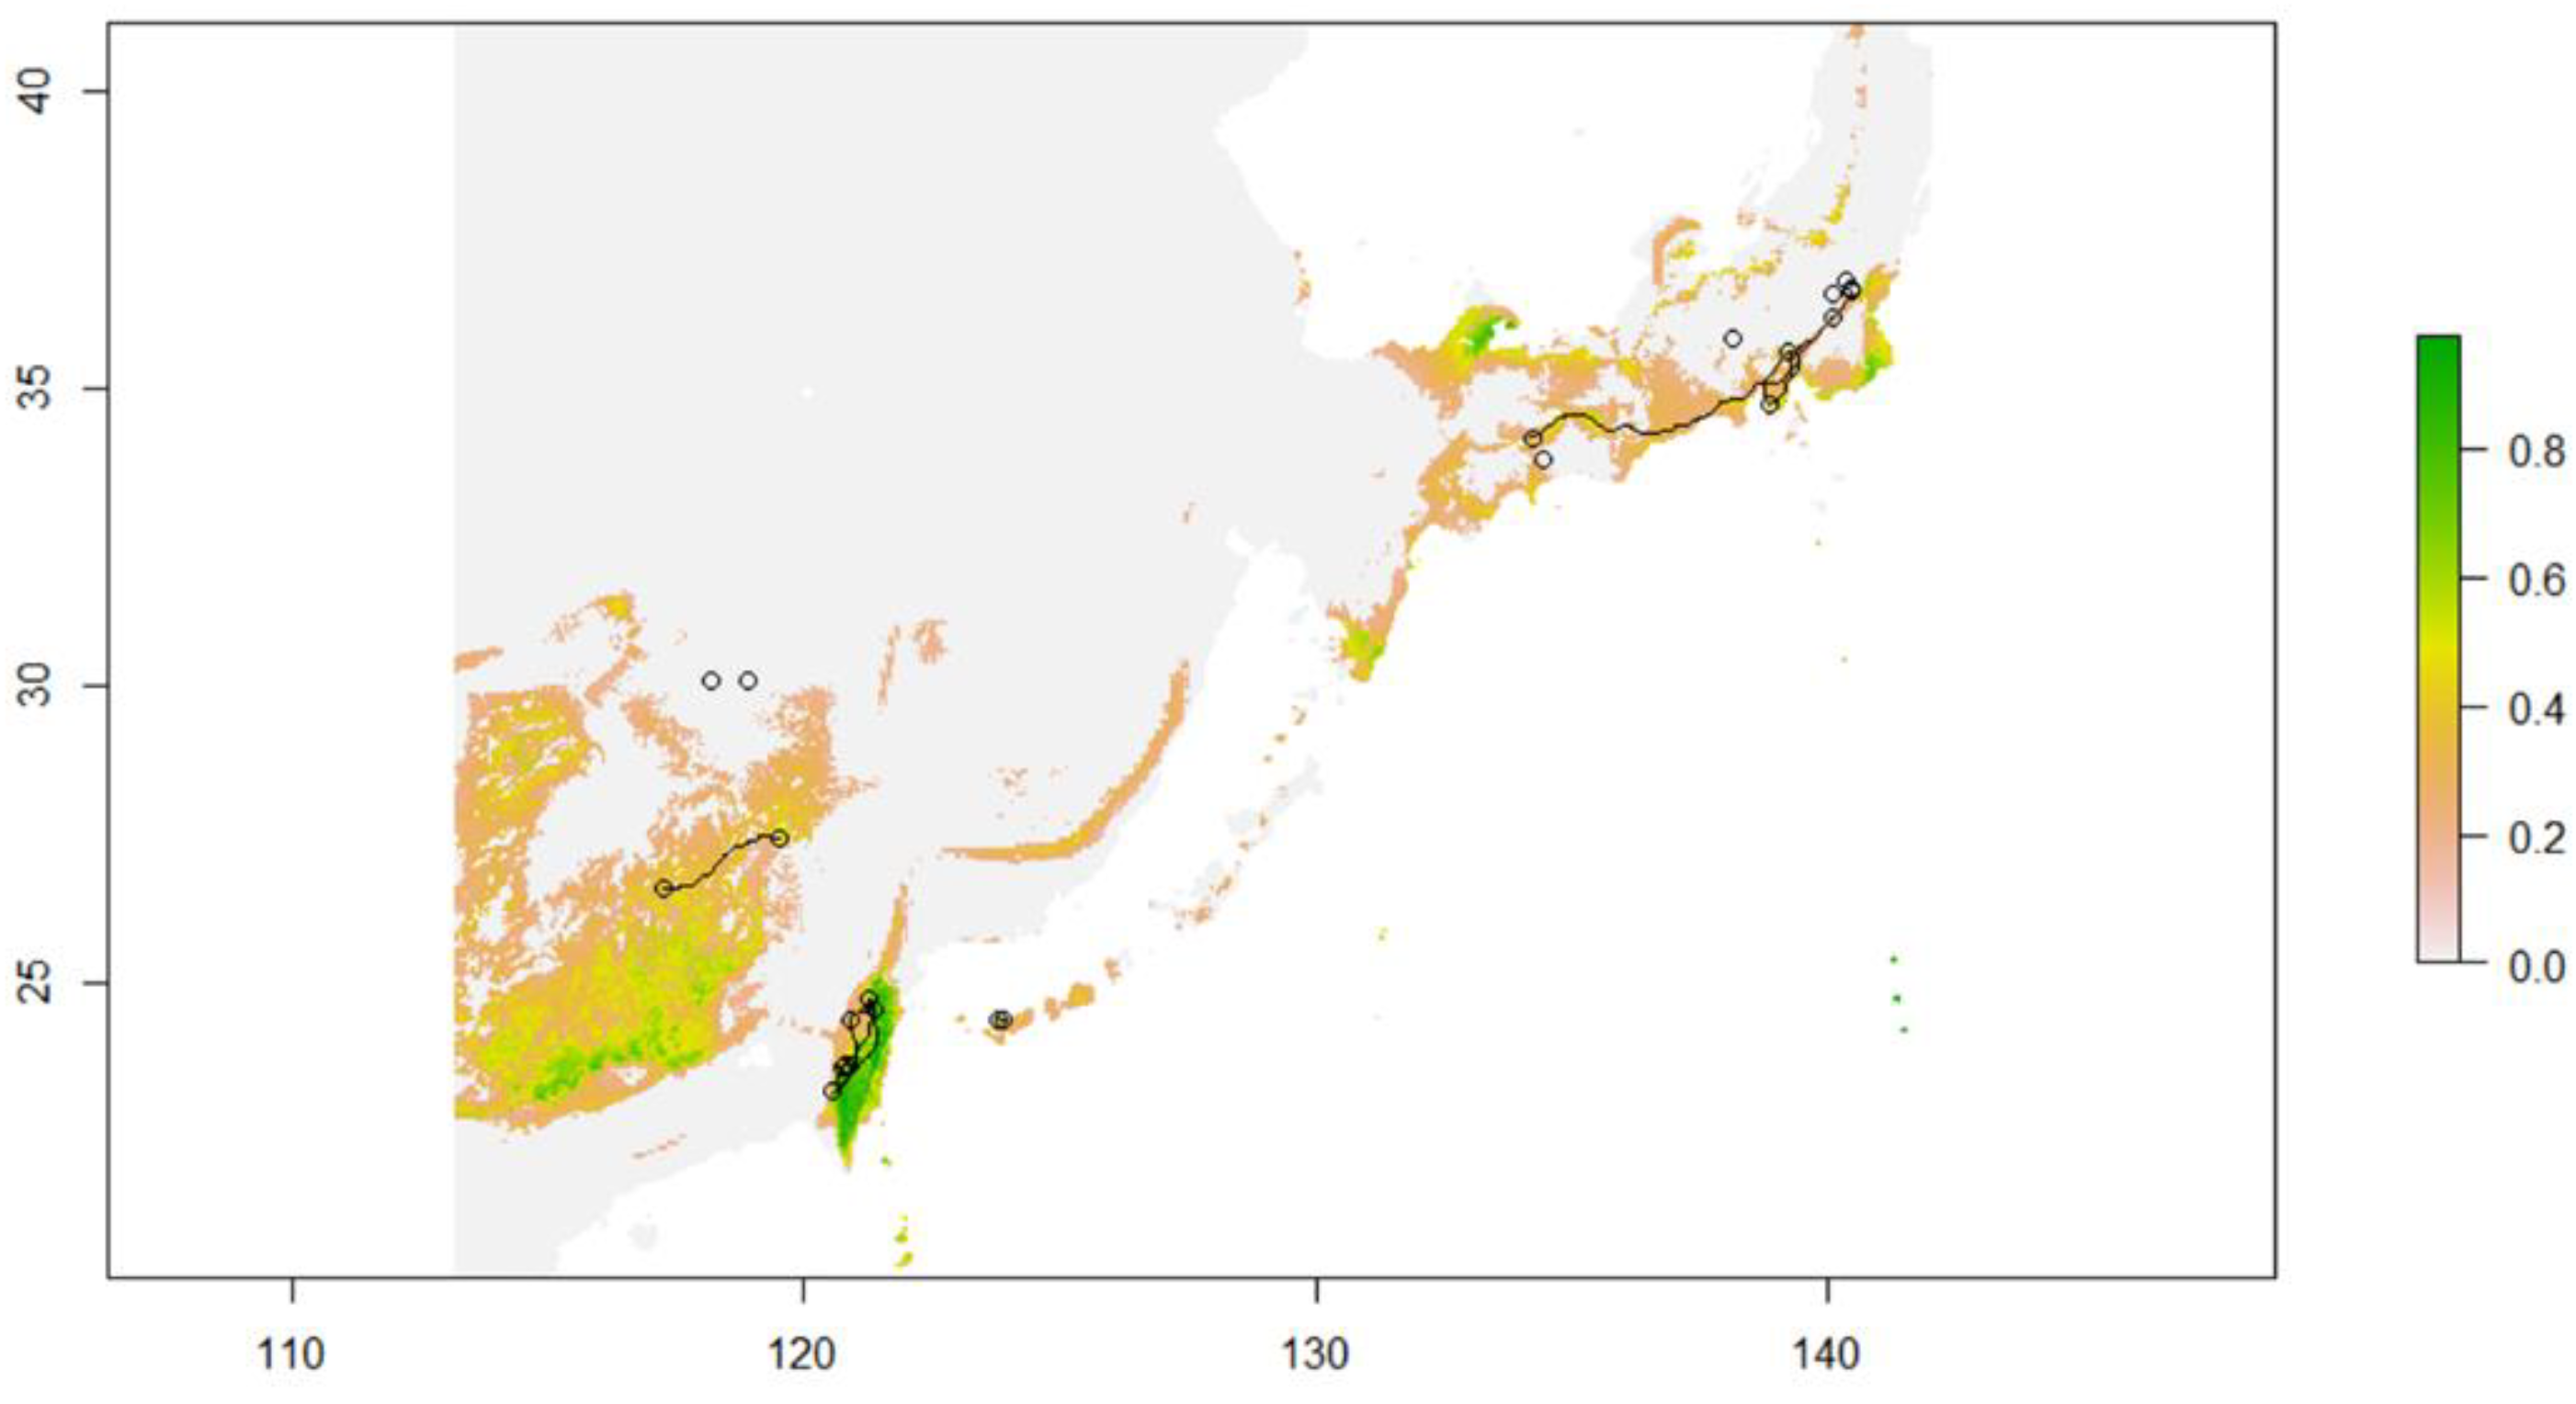
2.11. Modeled Migration Route of C. ramondioides during the LGM (Least-Cost Path)

The modeled potential suitable habitat ranges of Conandron are mainly located on current land masses (e.g., Taiwan, Honshu, and Southeast China) (Figure 8). Despite the fact that the ECS floor was exposed during the LGM, the modeled suitable habitat range for Conandron is restricted on the exposed ECS seafloor. Hence, no potential dispersal routes crossing the ECS seafloor were observed during the LGM. For Conandron populations, migration occurs within each landmass (e.g., within Japan, Southeast China, and Taiwan) (Figure 8).

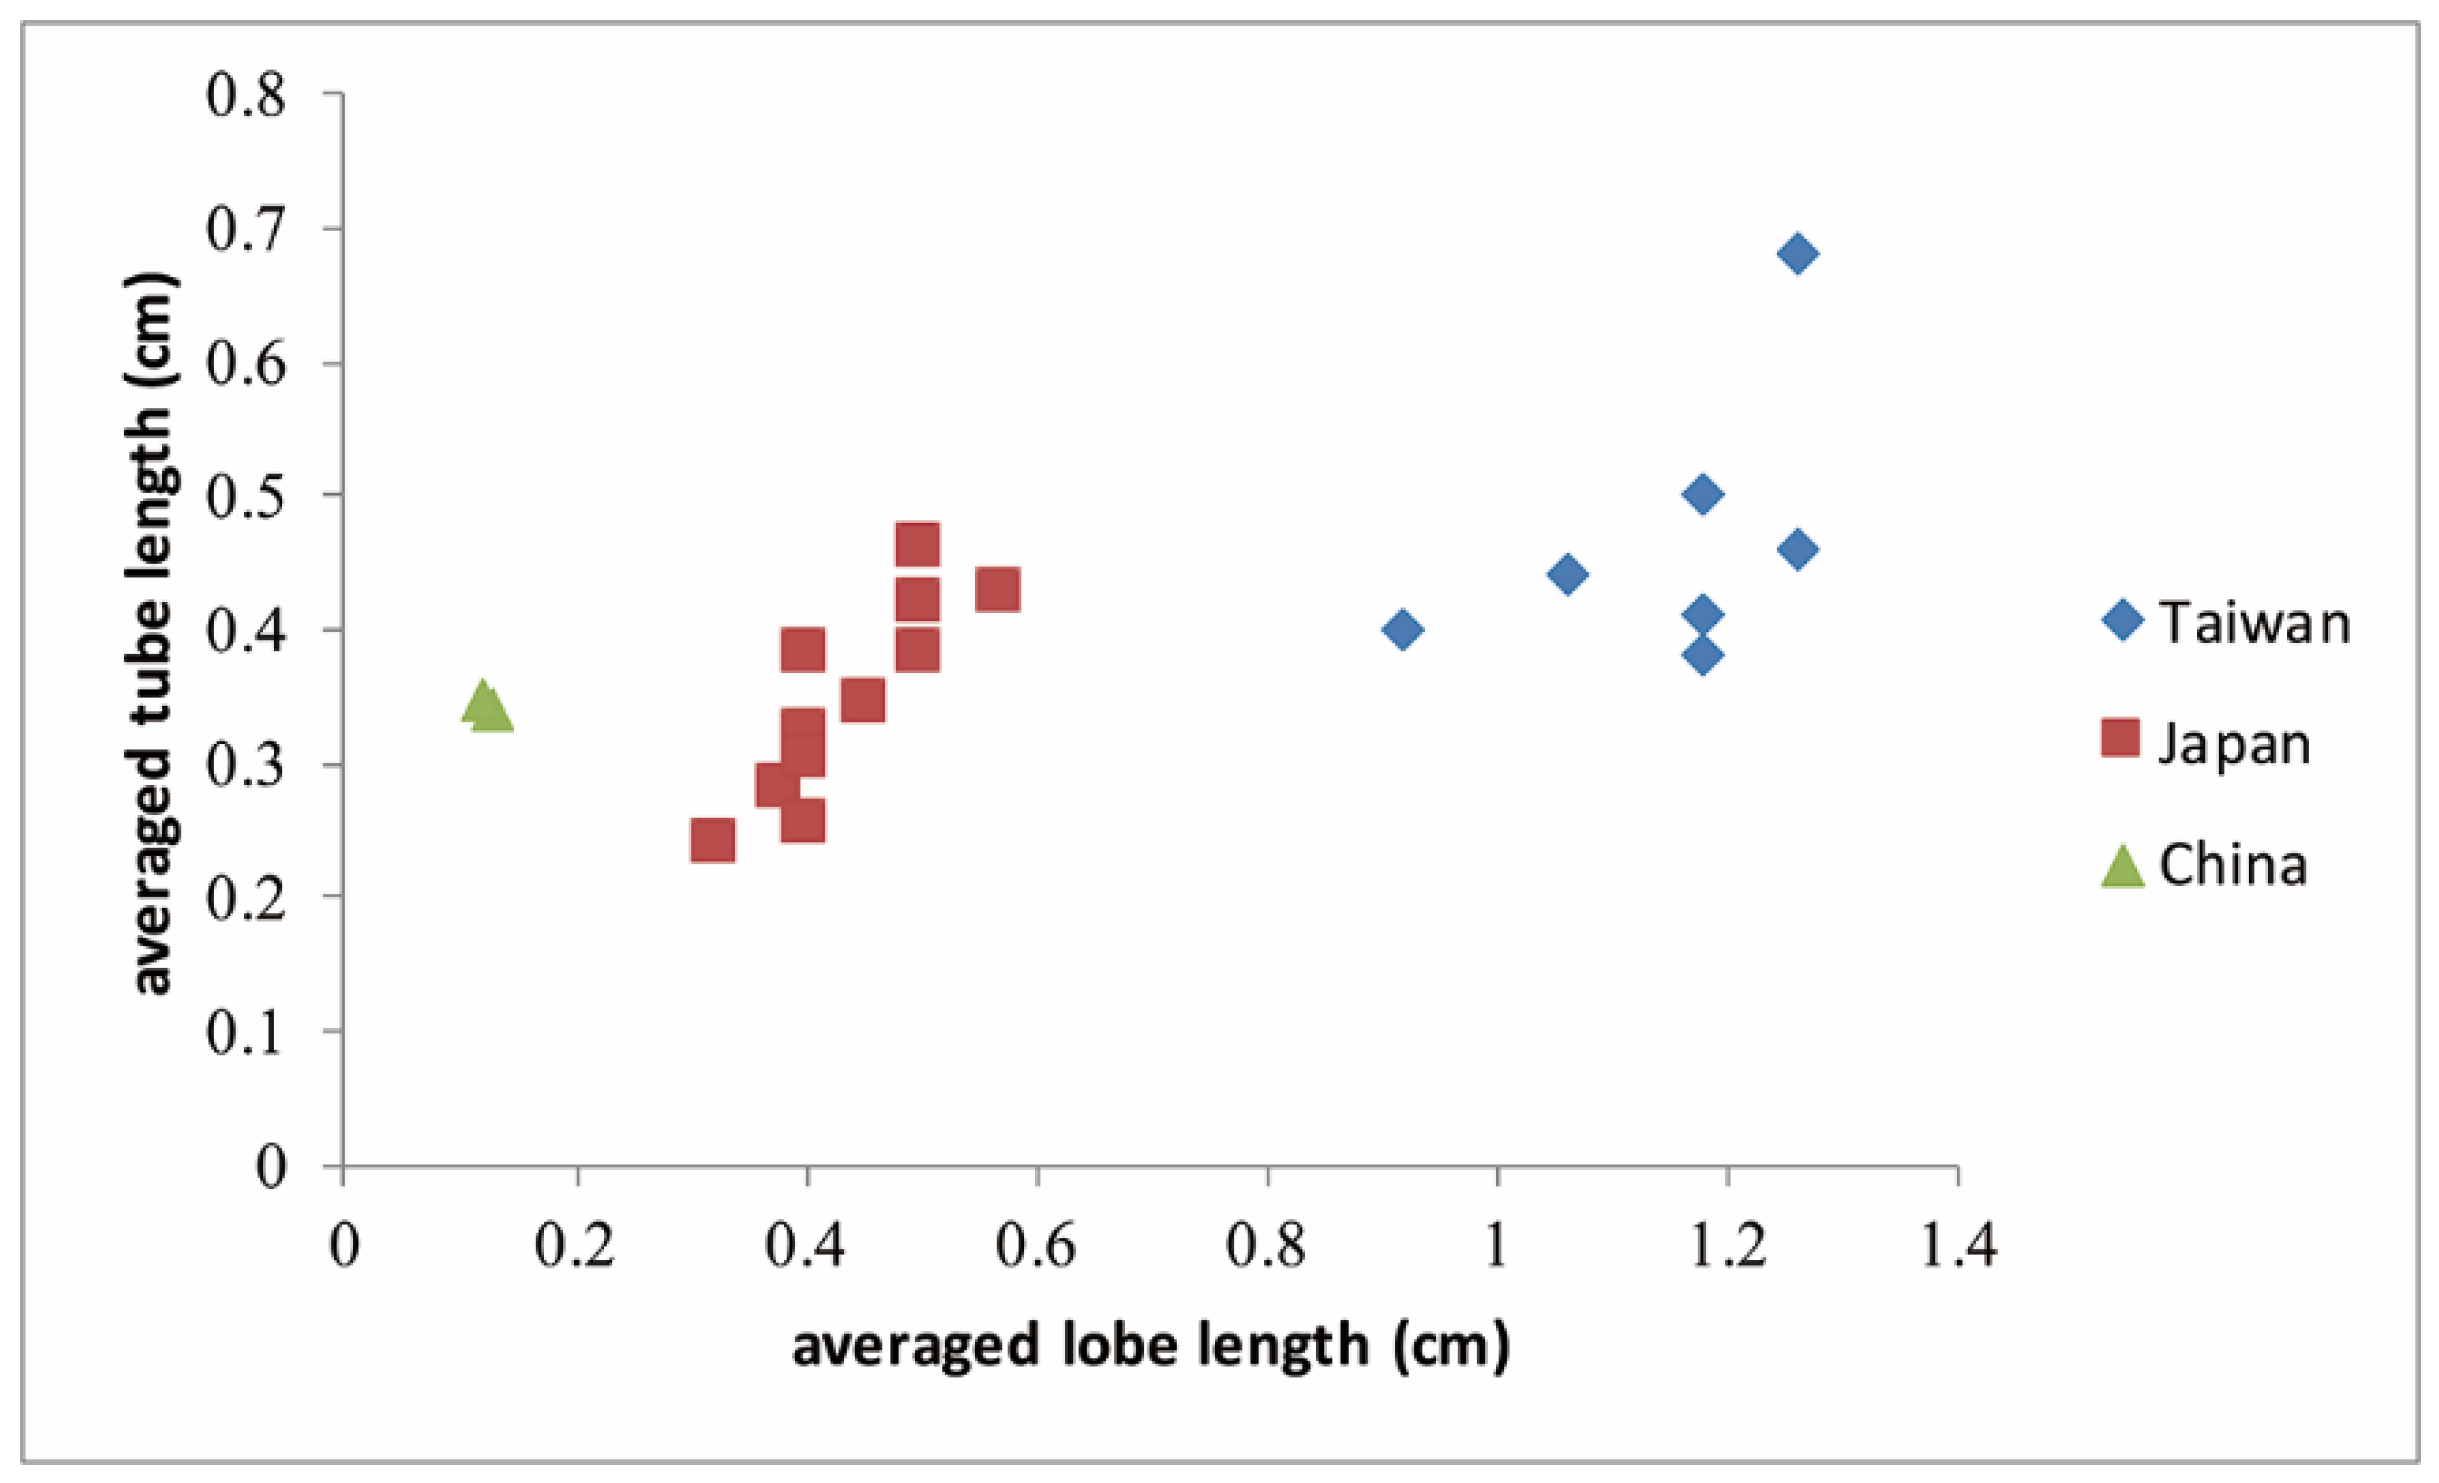
2.12. Morphological Variations Measured in C. ramondioides Individuals Distributed on the Continent and Islands

Three morphological groups were distinguished by plotting averaged lobe length versus averaged tube length (L/T) of available C. ramondioides flowers (Figure 9). The L/T of individuals distributed in Taiwan ranged from 1.853 to 3.105; for those distributed in Japan, 1.053 to 1.575; and for those distributed in China, 0.339 to 0.37.

3. Discussion

3.1. High Genetic Diversity and Strong Genetic Differentiation of C. ramondioides

Although the Conandron populations are isolated from each other and disjunctively distributed in East Asia, Conandron shows similar or even higher levels of nuclear and cpDNA haplotype and nucleotide diversity (Figure 3 and Supplementary Table S1) than has been reported for similar species occurring in East Asia (e.g., Hd = 0.8862, π = 0.00361 of Dendronbium, Hd = 0.895, π = 0.00306 of Ligularia, and Hd = 0.8, π = 0.00385 of Kirengeshoma) [15,23,24]. A high level of genetic diversity is generally thought to reflect long evolutionary histories [25] but also suggests that inter-population gene flow is restricted, thereby allowing for maintenance of a high level of genetic diversity. Bumblebees, whose foraging distance is restricted (ca. 267 m) [26], are thought to be the major pollinators of Conandron in Taiwan [27]. This suggests that long-distance dispersal by pollen is unlikely for Conandron. Furthermore, seeds of Conandron lack both hair-like appendages for attachment to seed dispersers and any structures attractive to animal seed consumers. These two morphological characteristics of Conandron seeds suggest that long-distance seed dispersal is unlikely. Moreover, the short stature of Conandron and its understory forest habitat may discourage visits from insect pollinators [28], reducing interpopulation gene flow and facilitating inter-population differentiation. Significant pairwise Fst values between groups (Table 3) and the among-group ΦCT index (Table 4) support this assumption. Considering its reproductive (limited pollen dispersal by pollinators) and morphological (lack of seed-dispersal adaptations) characteristics, gene flow among extant Conandron populations via pollen and seeds is probably severely constrained. This pattern may be a consequence of the species’ requirements of a cool and moist environment in temperate deciduous forest habitats at mid-elevation. Due to its biological features (high sensitivity to environmental change, limited pollen dispersal by pollinators, and lack of long-distance seed-dispersal ability), the repeated exposure of the ECS seafloor may not have served as a land bridge allowing migration among Conandron populations since the Quaternary. To further examine the lineage divergence and identify whether post-divergence gene flow ever occurred, construction of a phylogeny and estimated post-divergence gene flow of Conandron were conducted (see below).

3.2. Middle Pleistocene Lineage Diversification of Conandron

The haplotype network analysis using single-copy nuclear markers showed that Conandron populations could be assigned to three groups corresponding to geographical regions: the Honshu + Shikoku group, the Southeast China group, and the Taiwan + Iriomote group (Figure 2A–C). This suggests that fragmentation is likely. This diversification process was also supported by a multi-loci phylogeny (Figure 4). In this phylogeny, extant Japanese Conandron populations diverged from those in Southeast China, Taiwan, and Iriomote, following divergence between the Southeast China and the Taiwan and Iriomote populations (Figure 4). The genetic indices (Hd and π) showed equivocal patterns among molecular markers (Figure 3A,B). The equivocal patterns of the genetic indices suggest that the currently observed dispersal scenario, either from north to south or from south to north, is unlikely. Furthermore, genetic indices measured from molecular datasets of the TI and C groups exhibit equivocal patterns (Figure 3C,D), suggesting that recent dispersal between the TI and C populations is unlikely.
The scaled divergence time estimated by IMa analysis showed that the first diversification event occurred at c. 1.14 (95% HPD, 0.82–3.86) MYA between the north (Honshu and Shikoku) and the south (Southeast China, Taiwan, and Iriomote) groups, while a second diversification event occurred at c. 0.75 (95% HPD, 0.45–1.3) MYA between the Southeast China and Taiwan–Iriomote groups (Figure 5 and Figure 6). Our estimate of divergence time among Conandron groups corresponds to the Middle to Late Pleistocene eras, in which at least four glacial–interglacial cycles occurred [29]. Thus, the genetic divergence and distribution range of Conandron has been associated with these glacial–interglacial cycles. Although the Conandron populations are now separated, with some located on the Asian continent and others on adjacent islands (Honshu, Shikoku, Taiwan, and Iriomote), these localities were once connected by an exposed ECS seafloor during glacial periods, potentially allowing Conandron to disperse into East Asia. However, restricted post-divergence gene flow was measured between the north and south groups and between the C (Southeast China) and TI (Taiwan and Iriomote) groups, suggesting that dispersal among Conandron populations since lineage divergence was unlikely (Figure 5 and Figure 6). Furthermore, the EBSP-reconstructed population size dynamic showed that Conandron populations either maintained a stable population size (Honshu and Southeast China; Figure 7A,B, respectively) or increased slightly (Taiwan and Iriomote; Figure 7C). Maintaining a stable or mildly increasing population size may indicate that there are limited suitable habitats for Conandron in these regions.
Reconstructed paleo-environment conditions on the ECS land bridge were colder and drier than at present [30,31,32]. Given that Conandron is a cold-tolerant but drought-intolerant understory herb, the relatively drier paleo-environment conditions on the ECS land bridge (compared with the present) were not favorable for C. ramondioides. The ENM-modeled suitable habitat range may provide further support for this hypothesis (Figure 8). The modeled suitable habitat ranges of C. ramondioides show a lack of suitable habitats on the ECS land bridge during the LGM (Figure 8), suggesting that migration of C. ramondioides over the land bridge was unlikely. To conclude, we identified a lack of geographically shared haplotypes, a restricted gene-flow post-divergence, and limited suitable habitat on the exposed ECS seafloor. This leads us to postulate that the extant disjunctly distributed Conandron experienced at least two vicariance events since the Middle Pleistocene.
Contrary to earlier hypotheses, the exposed ECS floor did not necessarily serve as a land bridge enabling migration of currently isolated populations or species. There is an increasing number of studies suggesting that the ECS land bridge acted as a barrier to some East Asian temperate plants by selectively hampering migration but allowing free migration of some other species. For example, genetic breaks across the ECS have been detected in the populations of several understory fern, herbs, orchids, and shrubs from temperate forests in East Asia (e.g., genus Lemmaphyllum, Ligularia hodgsonii, Dendrobium moniliforme, Platycrater arguta, Euptelea pleiosperma, and Euptelea polyandra) [15,23,24,33,34]. In contrast, genetic breaks were not identified in populations from both sides of the ECS in three widespread temperate forest tree species, Quercus variabilis [10], Cercidiphyllum japonicum [11], and Kalopanax septemlobus [13]. Reproductive characteristics of these trees, such as wind-dispersed pollen or seeds and vegetative propagation, would have made migration across the ECS land bridge during the glacial period possible. However, Conandron and other studied herbaceous species do not possess such reproductive traits. Thus, predictions regarding the role of the ECS land bridge have to take into account both the presence of the land bridge and other relevant biological features of each species, especially its reproductive characteristics.

3.3. Cryptic Diversification within C. ramondioides var. Taiwanensis

Based on its floral trait (lobe length to tube length ratio), two varieties were defined within the C. ramondioides [16]. One is C. ramondioides var. ramondioides (distributed in mainland Japan); the other is C. ramondioides var. taiwanensis (distributed in Taiwan and Iriomote). However, the Southeast-China-distributed Conandron is not included in the previous study. Here, our multi-loci phylogeny not only provides molecular support for the taxonomic treatment of Conandron varieties but also offers molecular support in lineage divergence of the Southeast-China-distributed Conandron. There are two lineage divergence events which occurred, leading to the genetic differentiation of Conandron into three distinct groups (Figure 4). The first lineage divergence occurred between mainland-Japan-distributed and Southeast-China- and Taiwan–Iriomote-distributed Conandron, which offer evidence in support of genetic distinctiveness of C. ramondioides var. ramondioides and C. ramondioides var. taiwanensis. The second lineage divergence event occurred between Taiwan–Iriomote-distributed and Southeast-China-distributed Conandron populations (Figure 4). Despite the Taiwan Strait being regarded as a dispersal route, allowing terrestrial species to migrate between the Asia continent and Taiwan during the glacial period, this is not the case for Conandron. Based on the lack of gene flow, Southeast-China- and Taiwan-distributed Conandron forming two distinct clades, and no shared haplotypes observed between Southeast-China- and Taiwan-distributed Conandron, one can postulate genetic differentiation has occurred between Southeast-China- and Taiwan-distributed Conandron.
Moreover, the modeled suitable habitat range provides another line of evidence in support of population differentiation between Southeast-China- and Taiwan-distributed Conandron (Figure 8). It is reported that the Taiwan Strait seafloor was exposed to air at least two times between 0.2–0.015 MYA [35], connecting the currently isolated Asian continent and Taiwan island. However, limited modeled suitable habitat range on the Taiwan Strait during the LGM period makes the Conandron migration between Southeast China and Taiwan through land bridge unlikely. The last line of evidence comes from Conandron’s biological features. The peduncle of C. ramondioides reaches about 9–15 cm above the ground in its forest habitat, and the stamen is connate at the basal position of the flower [36]. Furthermore, C. ramondioides lacks a hair-like appendage and may not be dispersed via animal. Based on these morphological features, overseas dispersal of C. ramondioides via wind or seed dispersers is unlikely. Thus, due to the lack of post-divergence gene flow, limited suitable habitat on the ECS during the LGM, and low dispersal ability, we postulate that a lineage diversification within C. ramondioides var. taiwanensis is likely.

3.4. Diversifying Selection May Contribute to Shape CrCYC1 Lineage Diversification

The reconstructed nuclear marker haplotype networks showed that Conandron haplotypes can be clustered into two or three distinct clades (Figure 2A–D). However, the distantly linked CrCYC1 haplotype network arouses our attention. In addition, only CrCYC1 haplotypes form three distinct clades by comparing with haplotype network topologies obtained from other nuclear markers. There are two possible evolutionary mechanisms behind this. The first one is the relatively high substitution rate of CrCYC1 in Conandron. The second one is that CrCYC1 may be affected by non-neutral evolutionary force in Conandron. The higher between-group genetic distance observed in CrCYC1 (values of genetic distance ranging from 0.015 to 0.018) than those in ITS (values of genetic distance ranging from 0.003 to 0.004), provide evidence to support the first assumption (see Supplementary Tables S4 and S5). The significant McDonald–Kreitman test results suggest that CrCYC1 in Conandron is subjected to non-neutral evolution force. The relatively abundant non-synonymous substitutions (Dn) rather than synonymous substitutions (Ds) (e.g., 20 non-synonymous substitutions to 5 synonymous substitutions, when using Cyrtandra as outgroup, See Table 1), suggests diversifying selection could play a key role in shaping CrCYC1 lineage diversification. This is because diversifying selection tends to maintain genetic diversity. Consequently, the CYC and its homologs are key genes in the establishment of floral symmetry with relaxed genetic constraints from the purifying selection [36,37,38,39,40]. Relaxing from genetic constraint allows genes to harbor in-frame substitutions. The relatively high haplotype and nucleotide diversity observed in CrCYC1 compared with other nuclear markers (Supplementary Table S1) may provide evidence to support this assumption.

3.5. Divergent ITS Sequences Suggest That Conandron ITS Resulted from Incomplete Concerted Evolution

C. ramondioides is considered a diploid species [16]. We thus initially assumed that the nuclear haplotypes of the species should be hetero- or homozygotes, and that the sequenced ITS colonies should contain either hetero- or homozygotes. However, the number of sequenced C. ramondioides internal transcribed spacers (ITS) ranged from three to six, suggesting heterogeneity. ITS is one of the most popular molecular markers used for reconstructing plant phylogeny due to rapid concerted evolution within and among nuclear ribosomal DNA component subunits, fast substitution rate, and availability of universal primers [41,42,43]. Concerted evolution is a genetic exchange process among genes within a gene family, leading to the homogenization of different genes in a gene family [44]. However, high intra-individual polymorphism identified in different plant groups, such as Lespedeza [45], Carapichea ipecacuanha [46], Pyrus [47], and Mammillaria [48], suggests that incomplete concerted evolution of ITS in plants is common.

3.6. Lineage Discordance between cpDNA and nrDNA in C. ramondioides

When observing haplotype network topologies, the cpDNA haplotype network exhibits different topology compared with nrDNA haplotype networks (Figure 2A–D). There is a chloroplast haplotype observed in both Taiwan-distributed Conandron populations and the coastal-Fujian-distributed Conandron populations (Figure 2F, Supplementary Table S1). In addition, chloroplast haplotypes isolated from Southeast China formed three independent lineages in the cpDNA haplotype network (Figure 2F), which were never observed in other nrDNA haplotype networks (Figure 2A–D). Though incomplete lineage sorting hypothesis is applied to explain inconsistency between haplotype networks [49,50], it may not be the case here. The first observation is that the shared chloroplast haplotype (CP11) is not a widely distributed haplotype in the Conandron distribution range in East Asia, as would be expected because of the signal of incomplete lineage sorting. Second, the effective population size of cpDNA is four times smaller than that of nrDNA in a diploid species [51]. In other words, genetic drift should sweep out rare haplotypes four times faster in cpDNA than in nrDNA. If so, the reciprocal monophyly observed from the nrDNA pattern should be even more evident in cpDNA. However, it is not observed in the cpDNA haplotype network (Figure 2F). Furthermore, the genetic drift may not be the only force acting on the cpDNA of Southeast-China-distributed Conandron. The positive values obtained from the neutrality test suggested that cpDNA isolated from Southeast-China-distributed Conandron populations may experience diversifying selection (Table 2). The last potential reason which may contribute to the inconsistency between cpDNA and nrDNA here is the substitution rate difference between cpDNA and nrDNA. The measured parsimony informative sites of cpDNA are fewer than those measured from nrDNA dataset (0.024 from the cpDNA dataset; 0.059 from the AGT intron 1 dataset; 0.082 from the GroES1 dataset; and 0.055 from the LFY1 dataset), suggesting cpDNA evolving slower than nrDNA in Conandron. Hence, we conclude that the discrepancy between cpDNA and nrDNA in C. ramondioides var. taiwanensis is either caused by non-neutrally evolving cpDNA in the SE-China populations, slowly evolving cpDNA, or both.
In summary, the current disjunctive distribution pattern of C. ramondioides resulted from vicariance events. Three lines of evidence support this conclusion. Firstly, three groups corresponding to geographical regions were identified in our multi-loci phylogeny following restricted post-divergence gene flow. Secondly, there is a lack of potential past dispersal routes across an exposed ECS land bridge. Thirdly, we measured flower morphological traits (L/T) from the geographical regions, which revealed corresponding morphological groups. Our study represents a comprehensive approach to revealing the speciation process of East Asian endemic species by integrating information from molecular evolution, paleo-climate simulation, and morphological trait measurements.

4. Materials and Methods

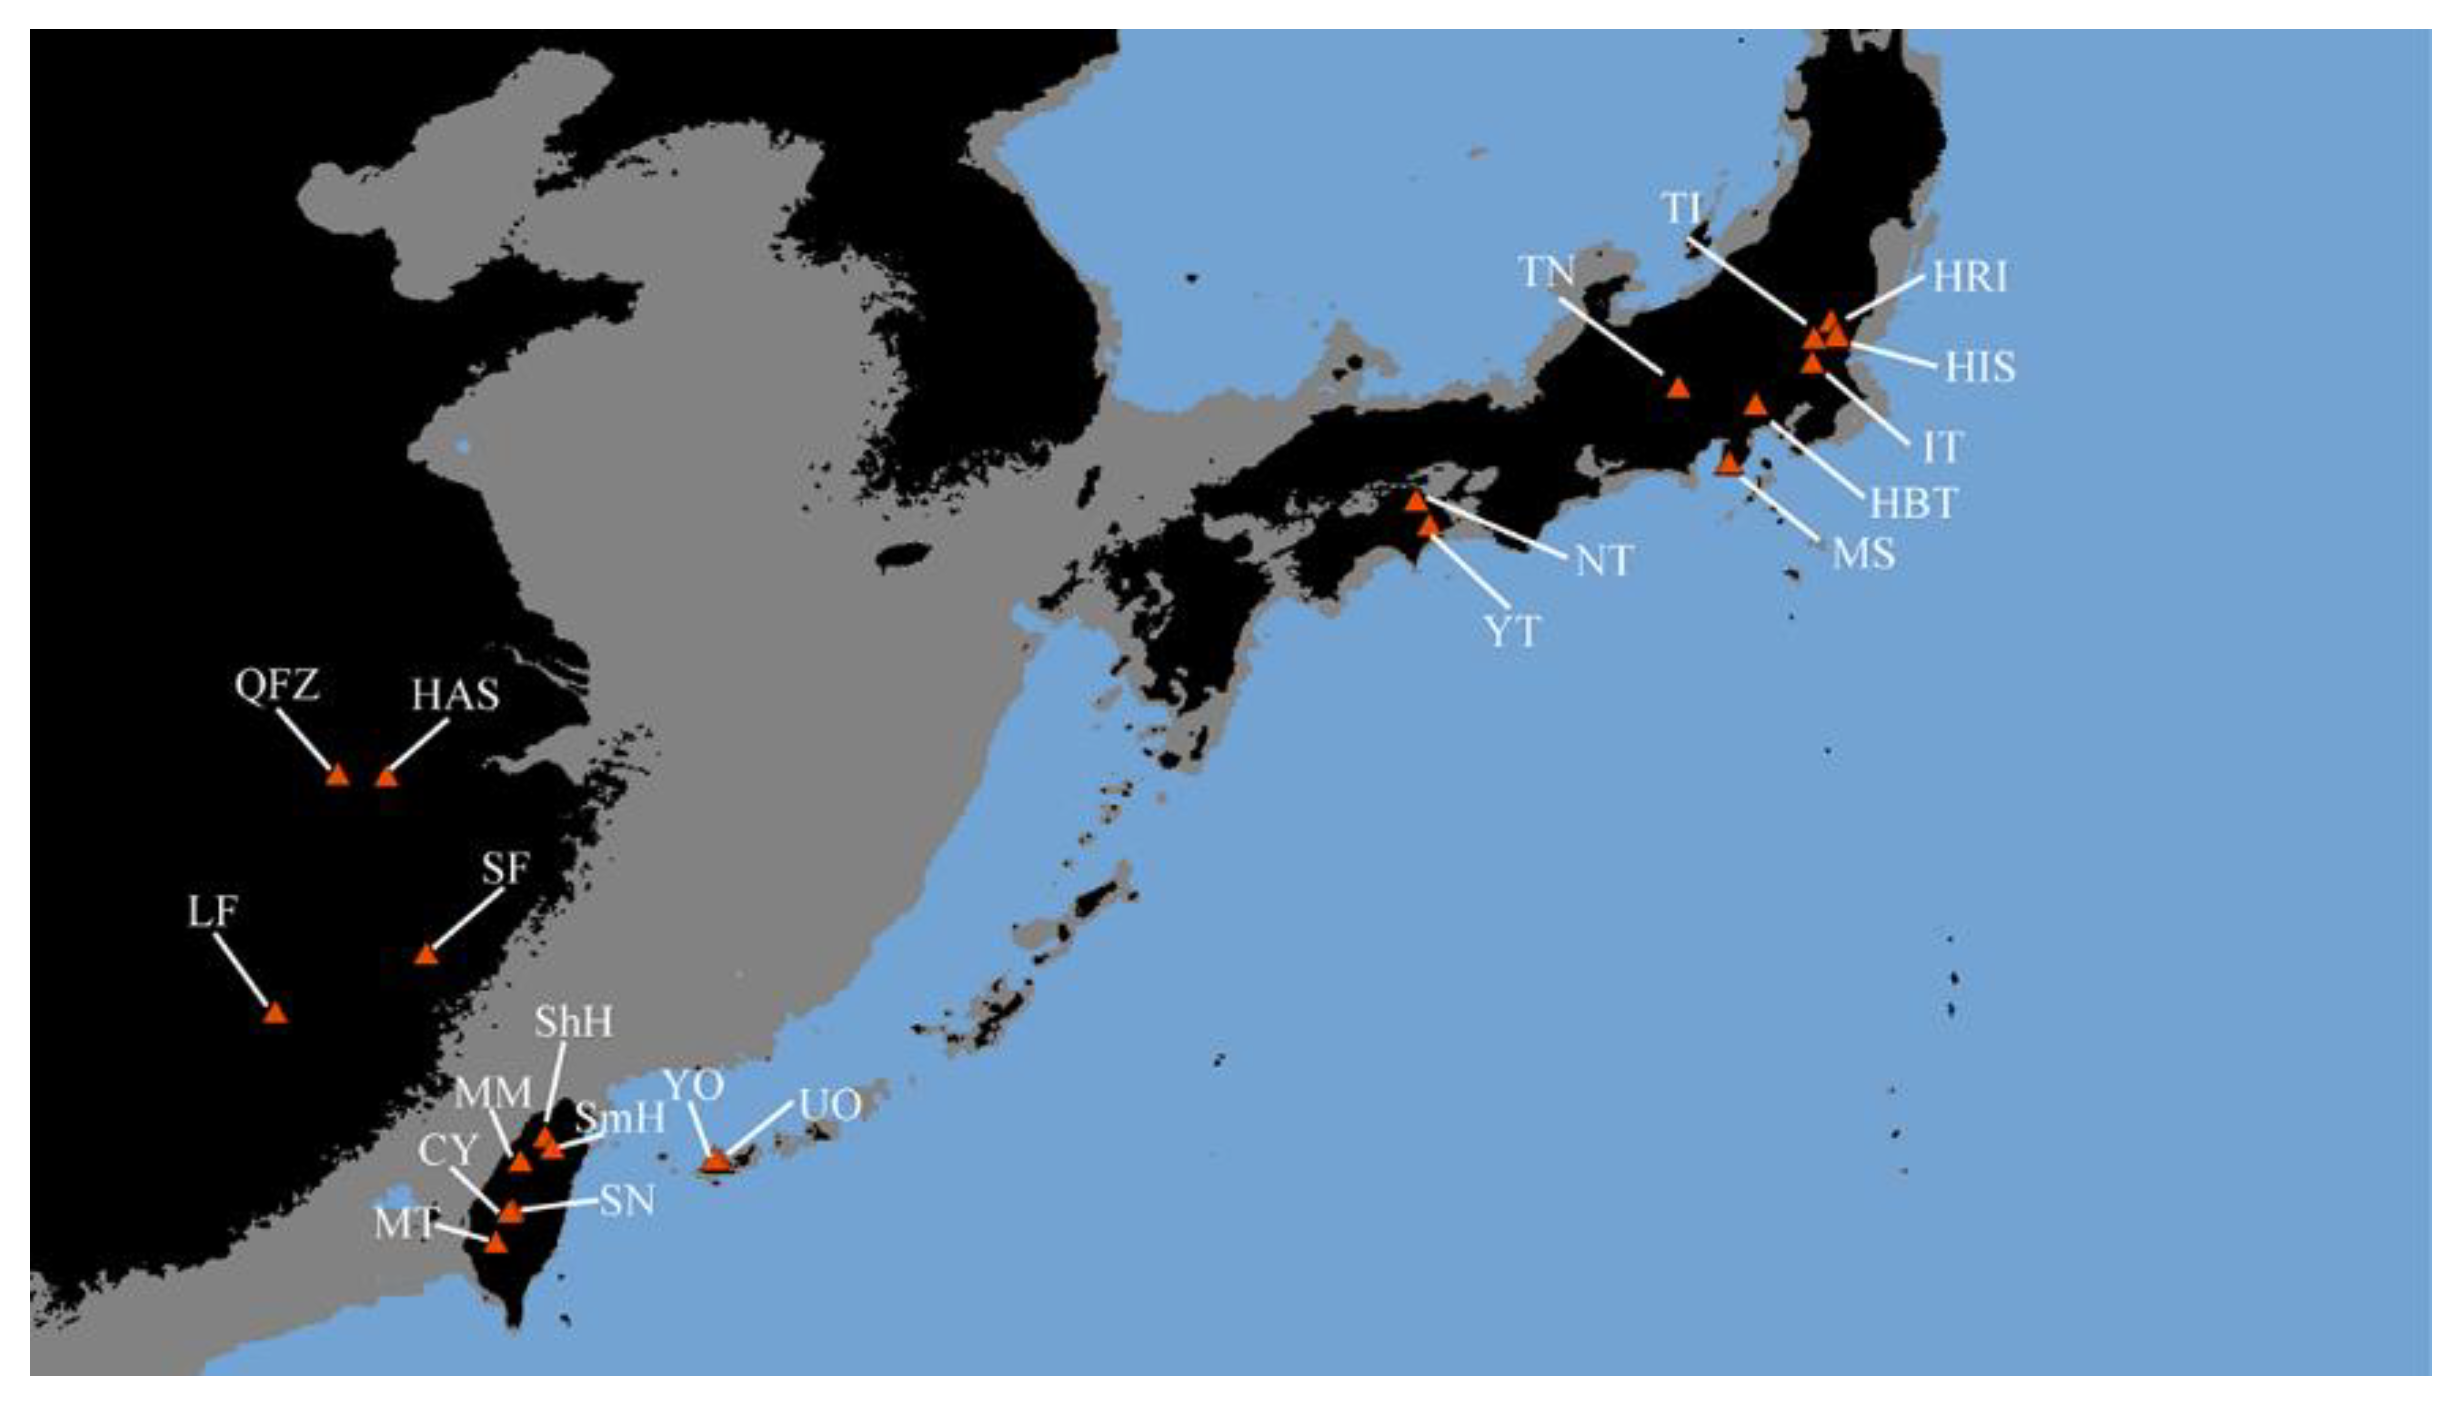
4.1. Sample Collection and Genomic DNA Extraction

We sampled nine populations of C. ramondioides var. ramondioides and twelve populations of C. ramondioides var. taiwanensis (197 individuals in total), covering most of the species’ distribution range in East Asia (Figure 1). The exact localities are listed in Supplementary Table S1. Leaf samples were collected in the field and then dried with silica gel. Dried leaves were ground into powder for DNA extraction using a homogenizer with liquid nitrogen, following the cetyltrimethylammonium bromide (CTAB) procedure [52]. The DNA concentration for each sample was determined using a Nanodrop RNA/DNA Spectrophotometer (Thermo, Taipei, Taiwan).

4.2. Amplification of cpDNA Markers and Nuclear Markers

To evaluate the divergence patterns of C. ramondioides populations across East Asia, two cpDNA markers (trnL-trnF and trnH-psbA) and five nuclear markers (CrCYC1, ITS, AGT intron 1, GroES intron 1, and LEAFY intron 1) were amplified from all sampled individuals. The first four markers (trnL-trnF, trnH-psbA, CrCYC1, and ITS) were sequenced using the Sanger sequencing method [53] in 2016. The primer pairs used for amplifying the trnL-trnF region were from Taberlet et al. [54]. The forward primer ‘trnH’ (CGC GCA TGG TGG ATT CAC AAT CC) and the reverse primer ‘psbA’ (GTTATGCATGAA CGT AAT GCT C) were used to amplify the trnH-psbA region [55]. The PCR reaction was made up to a total volume of 25 μL, containing 13 μL of 2× Ampliqon master mix Red (Ampliqon, Odense, Denmark), 0.25 μL of each primer at 2 μM, 10.5 μL of ddH2O, and 1 μL of template at 20 ng/μL. The PCR profile for cpDNA markers amplification was 35 cycles of 30 sec at 94 °C, 30 s at 56 °C, and 1 min at 72 °C, with a final extension of 5 min at 72 °C, after an initial denaturing for 3 min at 94 °C for both trnL-trnF and trnH-psbA. For nuclear markers, CrCYC1 sequences were amplified using the forward primer “SPF” (5’-AGCAAGACATGCTTTCTGG-3’) and the reverse primer “SPR” (5’-GACATTGGATTCAATATGGTG-3’) [56], while the forward primer “ITS 5P” (5′-GGAAGGAGAAGTCGTAACAAGG-3′) and the reverse primer “ITS 8P” (5′-CACGCTTCTCCAGACTACA-3′) were used for amplifying the ITS region [57]. The PCR profile was 35 cycles of 30 s at 94 °C, 30 s at 58 °C, and 50 s at 72 °C, with a final extension of 10 min at 72 °C, after an initial denaturing for 3 min at 94 °C for CrCYC1 and ITS amplification. The PCR reaction was made up to a total volume of 25 μL, containing 13 μL of 2× Ampliqon master mix Red, 0.25 μL of each primer at 2 μM, 10.5 μL of ddH2O, and 1 μL of template at 20 ng/μL. All PCR products were examined with 1.0% (w/v) agarose gel electrophoresis, and then the band of correct size was used for sequencing. The PCR products were sequenced using an ABI 3700 automatic sequencer (Genomics, New Taipei City, Taiwan). All sequences were examined firstly with a Sequence Scanner v1.0 and then aligned for further analysis. To examine within-individual homogeneity of ITS, we amplified nine individuals (three from Japan, three from Southeast China, and three from Taiwan) using ITS primer pairs with a proofreading KAPA HiFi PCR kit (KAPA Biosystems, Potters Bar, UK). These nine PCR products were cloned using a pGEM-T Easy Vector kit (Promega, Madison, WI, USA), following the manufacturer’s protocols. Finally, five to six clones of each PCR product were sequenced. Sequences were deposited in GenBank under the following Accession Numbers: CrCYC1 (OP631034-OP631413), ITS (OP578698-OP579075), trnL-trnF (OP689756-OP689952) and trnH-psbA (OP689953-OP690149).
We developed specific single-copy nuclear intron markers for C. ramondioides in 2018 [58]. Due to the species’ high genetic variability, single-copy nuclear intron markers are preferable to non-coding cpDNA markers [59]. Out of eleven potential single-copy markers, three (AGT intron 1, GroES intron 1, and LEAFY intron 1) were selected for amplicon library preparation. These three markers generated a single band on the gel electrophoresis. Amplicon library preparations of these three loci were conducted following the 16S metagenomic sequencing library preparation guide provided by Illumina Technology (San Diego, CA, USA). The amplicon library was then sequenced on the Illumina MiSeq sequencing system. Paired-end Illumina reads (2 × 300 bp) were imported into CLC Bio Genomics workbench 7.0.4 (QIAGEN Bioinformatics, Venlo, Netherlands) and merged to derive overlapping pairs. Only reads with over 100 counts were kept for further analysis. Sequences were deposited in GenBank under the following Accession Numbers: AGT intron 1 (OP598596-P598799), GroES intron 1 (OP631506-OP631663 and MH311300-MH311413), and LEAFY intron 1 (OP631414-OP631505 and MH237973-238072).

4.3. Genetic Structure of Populations and Geographical Structure Analysis

Sequences of all six markers (ATG2 intron 1, GroES intron 1, LFY intron 1, CrCYC1, ITS, and concatenated cpDNA) were aligned with the MUSCLE algorithm [60] implemented in MEGA 6 [61] and then manually edited using BioEdit v. 7.2.5 [62]. We estimated nucleotide diversity (π) and haplotype diversity (Hd) using DnaSP ver 5.0 [63] for each marker for each population, assigned region, and at the species level. When measuring the genetic diversity of populations on both sides of the ECS, we assigned the Honshu and Shikoku populations as the North group and the Taiwan, Iriomote, and SE-China populations as the South group (see Supplementary Table S1). The Hd and π values of East Asian herbaceous plants have a range of 0.61–0.9 and 0.0001–0.003, respectively [14,15,24].
The ECS is considered a barrier inhibiting gene flow for shrubs or herbs [12,15,24]. Thus, Conandron populations distributed on the main islands of Japan (Honshu and Shikoku), Taiwan, and Southeast China were classified into these separate geographical regions for examination of the genetic structure. Iriomote populations were assigned to the Taiwan group since they are geographically close to Taiwan. An analysis of molecular variance (AMOVA) of our genetic data was performed using the program Arlequin ver 3.5 [64]. F-statistics were calculated to estimate the proportion of gene variability found among populations (Fst), among the population within groups (Fsc), and among groups (Fct) of our datasets. If the ECS serves as a barrier, we would expect the highest genetic variation to be attributed to the group level. The statistical significance of all estimated fixation indices was tested with 10,000 permutations [65].
To assess the genetic relationships of sampled C. ramondioides individuals for each tested marker, we constructed a statistical parsimony network with a 95% connection limit using the R package “Haplotypes” [66]. Indels were coded using the simple indel coding method, which treated indels with different start and end positions as separate characters [67].

4.4. Inferring Lineage Divergence of C. ramondioides Populations from Nuclear Markers

To rebuild the relationship among Conandron populations, *BEAST with multi-locus species tree examination in the BEAST v2.4.7 program [68,69] was used to estimate gene trees. Each isolated sequence could be assigned into a group along with the collection site. Each collection site was treated as an operational taxonomic unit (OTU) in species tree analyses. The program jModeltest v2.1.3 was used to estimate the substitution model of each locus [70], the HKY model was set for the LFY and GroES1 dataset, and HKY+G for the ATG2 intron 1 dataset. Considering the low rate of discrepancy anticipated at the intraspecific level, a strict clock model was selected for all three loci [71]. For the clock rate prior, a mean and initial value of 0.0037 per substitutions/site/million years and a standard deviation of 2.55 (95% interquartile range of 0.012–0.0027) were set under a lognormal prior distribution of the LFY dataset (Supplementary Table S2). The substitution rates were also determined by a mean value and initial value of 0.0037 per substitutions/site/million years with more broadly distributed lognormal prior distributions (ATG2 intron 1 and GroES intron 1: 95% interquartile range of 0.187–0.000074) to cover a wide range of substitution rate of these two loci. The Yule tree prior and a piecewise linear root population size model for species tree priors were used. Markov chain Monte Carlo (MCMC) runs were set for 50 million generations with sampling every 5000 generations and discarding the first 10% as burn-in. Three independent MCMC chains with these settings were performed. The log and species tree files from the replicates were combined into single-log and single-tree files using the logCombiner program in BEAST v2.4.7 [68,69]. The convergence level of these three MCMC chains could be visualized and checked in the program Tracer v1.6.0 [72].
The grouping pattern was inferred from the multi-loci species tree; we further reconstructed the population differentiation process by gene flow with an isolation with migration model, which was implemented in IMa2 [73]. An infinite site model was set for each of the three nuclear markers. Truncated uniform distribution priors of all six parameters of the IMa2 were set according to the author’s recommendations [73]. To cover a broad range of these scaled parameters, including lineage splitting time, effective population size of both extant and ancestral populations, and the gene flow among assigned groups [3], the upper bond of these parameters were set with the theta estimated from the Taiwan–Iriomote group, which had the highest theta of the three Conandron groups. The geometric mean of Watterson’s theta [74] per sequence over three markers was 3.2. The mutation rate of LFY (per locus with 3.7 × 10−9 × 393 bp for the LFY marker) was used as a reference for the other two loci to rescale the IMa2 parameters.
Furthermore, the same upper bound settings were applied to our pairwise dataset of the three Conandron groups. Divergence time estimated from a pairwise analysis will show splitting order among groups [75]; therefore, the results confirm the lineage divergence process inferred from both multi-population IMa2 and *BEAST2. Finally, 40 Metropolis-coupling MCMC (MCMCMC) chains with heating parameters of -ha0.96 and -hb0.85 were set for all pairs. The first 105 iterations of pairwise group pairs were discarded as burn-in, followed by 106 iterations for sampling (100 iterations per sample). To confirm whether our analysis exhibited convergence, three independent runs were performed. To determine the statistical significance of gene flow between groups, the Likelihood ratio tests (LRT) were computed [76].

4.5. Population Demographical History

To evaluate whether the molecular markers conformed with the expectations of neutrality theory, both Tajima’s D [77] and Fu’s Fs [78] were applied using DnaSP5.0 [32], based on 1000 coalescent simulations. The two statistics are expected to be nearly zero or zero for a stable population, but significant negative values indicate a sudden expansion in population size, while significant positive values suggest the occurrence of processes such as a population subdivision or recent population bottlenecks. As a transcription factor, selection could affect CrCYC1 at the codon level. Therefore, the CrCYC1 dataset was subjected to further examination of deviation from neutral evolution using the McDonald–Kreitman test [79] as implemented in the McDonald–Kreitman test online web interface [80].
We reconstructed the effective population size change in Conandron groups (including Honshu–Shikoku, Taiwan–Iriomote, and Southeast China groups) through time by assessing whether the species had undertaken population expansion or decline during cold periods (e.g., last glacial maximum). An extended Bayesian skyline plot (EBSP) implemented in BEAST v2.4.7 was used, and EBSP uses coalescent-based models to estimate posterior probabilities of effective population size change through time [81]. Substitution models for each dataset and molecular clock prior were set as for the *BEAST analysis. The “coalescent: constant size” tree prior was set for each group in three EBSP runs. Each run comprised 50 million generations with sampling every 5000 steps, of which the first 10% were discarded as burn-in. We integrated individual information from the three log files and the corresponding three gene trees into a single file using the logCombiner program in BEAST v2.4.7. Skyline plots were generated in Microsoft EXCEL. Bayes factors (BF) of each group were then measured to evaluate statistical significance of each EBSP. A BF greater than 3 suggested significant population size change through time.

4.6. Simulation of the Least-Cost Path to Visualize Potential Dispersal Routes of Conandron Populations during the Last Glacial Maximum in East Asia

To estimate the least-cost path between populations, we first generated a resistance map by using a reciprocal of a suitable map. Resistance-to-suitability mapping is simply a monotonic transformation in which locations with higher suitability exhibit lower resistance. Therefore, the potential suitable habitat range of Conandron was modeled using the maximum entropy method [82,83]. Firstly, available specimen occurrence data were acquired from GBIF (http://www.gbif.org/, accessed on 1 December 2017), and 19 BIOCLIM variables from the WorldClim data set [84], including “current” and “last glacial maximum”, were used at a 2.5-mile spatial resolution (~5 km). Secondly, potentially suitable habitat ranges for the “current occurrence” of Conandron were modeled and then projected to the “last glacial maximum occurrence” layers to show potential suitable habitat ranges of Conandron during the LGM period.
Finally, the pairwise least-cost path was measured among 21 populations from the resistance map using the R package “gdistance” [85]. The resistance map was first converted to a raster format composed of cells. In “gdistance”, the calculation of routes starts with connecting cell centers to each other, which become nodes on the resistance map. “gdistance” implements three cell connection methods: von Neumann, Moore, and king’s and knight’s move. In the von Neumann method, cells connect orthogonally to their four neighbors. In the Moore method, cells connect to their eight nearest neighbors orthogonally and diagonally. In the king’s and knight’s moves method, cells connect to their sixteen neighbors vertically over one square and orthogonally, diagonally, and horizontally across two squares. To explore all possible routes, all three connecting methods were tested.

4.7. Identification of Cryptic Species of C. ramondioides via Floral Morphology Measurements

Corolla morphology (lobe length to tube length ratio) has been proposed as a key trait to distinguish C. ramondioides populations distributed across Japan from those in Taiwan and Iriomote [16]. Therefore, the available C. ramondioides corolla was measured following the method of Kokubugata and Peng [24].

Supplementary Materials

The supporting information can be downloaded at: https://www.mdpi.com/article/10.3390/ijms232314932/s1. References [61,86,87,88,89] are cited in Supplementary Materials.

Author Contributions

Conceptualization, K.-T.H., H.-C.K., C.-N.W. and Y.-S.C.; methodology, K.-T.H. and H.-C.K.; project administration, C.-N.W. and Y.-S.C.; software, K.-T.H. and H.-C.K.; resources, G.K. and M.M.; supervision, Y.-S.C.; writing—original draft, K.-T.H.; writing—review and editing, K.-T.H., C.-N.W. and Y.-S.C. All authors have read and agreed to the published version of the manuscript.

Funding

This research is found by the Taiwan National Science and Technology Council grant number (MOST 111-2311-B-002-016 and MOST 111-2313-B-002-035) to Yi-Sheng Cheng and the Taiwan National Science and Technology Council grant number (MOST 111-2313-B-002-027-MY2) to Chun-Neng Wang.

Data Availability Statement

All sequences data are submitted to NCBI.

Acknowledgments

We thank Guo Zhen Yang for providing information about the distribution of Conandron in Taiwan. We also thank Shih-Ying Hwang for offering phylogeographical analysis advice.

Conflicts of Interest

The authors declare no conflict of interest.

References

  1. Volckaert, E.; Gobin, B. Ornamental Plants and Floriculture. Encycl. Life Support Syst. (EOLLSS) 2014. Sample Chapters C 10. Available online: https://www.eolss.net/sample-chapters/c10/E1-05A-51.pdf (accessed on 13 March 2022).
  2. Odeh, R.; Guy, C.L. Gardening for Therapeutic People-Plant Interactions during Long-Duration Space Missions. Open Agric. 2017, 2, 1–13. [Google Scholar] [CrossRef]
  3. Manchester, S.R.; Chen, Z.D.; Lu, A.M.; Uemura, K. Eastern Asian endemic seed plant genera and their paleogeographic history throughout the Northern Hemisphere. J. Syst. Evol. 2009, 47, 1–42. [Google Scholar] [CrossRef]
  4. Cheng, Y.P.; Hwang, S.Y.; Lin, T.P. Potential refugia in Taiwan revealed by the phylogeographical study of Castanopsis carlesii Hayata (Fagaceae). Mol. Ecol. 2005, 14, 2075–2085. [Google Scholar] [CrossRef] [PubMed]
  5. Chiang, T.Y.; Schaal, B.A. Phylogeography of Plants in Taiwan and the Ryukyu Archipelago. Taxon 2006, 55, 31–41. [Google Scholar] [CrossRef]
  6. Picó, F.X.; Abdelaziz, M.; Castilla, A.R. Introduction to the Special Issue: The ecology and genetics of population differentiation in plants. AoB Plants 2021, 13, plab057. [Google Scholar] [CrossRef] [PubMed]
  7. Rieseberg, L.H.; Willis, J.H. Plant speciation. Science 2007, 317, 910–914. [Google Scholar] [CrossRef] [PubMed]
  8. Chang, F.; Li, T.; Xiong, Z.; Xu, Z. Evidence for sea level and monsoonally driven variations in terrigenous input to the northern East China Sea during the last 24.3 ka. Paleoceanography 2015, 30, 642–658. [Google Scholar] [CrossRef]
  9. Siddall, M.; Rohling, E.J.; Almogi-Labin, A.; Hemleben, C.; Meischner, D.; Schmelzer, I.; Smeed, D.A. Sea-level fluctuations during the last glacial cycle. Nature 2003, 423, 853–858. [Google Scholar] [CrossRef] [PubMed]
  10. Chen, D.; Zhang, X.; Kang, H.; Sun, X.; Yin, S.; Du, H.; Yamanaka, N.; Gapare, W.; Wu, H.X.; Liu, C. Phylogeography of Quercus variabilis based on chloroplast DNA sequence in East Asia: Multiple glacial refugia and Mainland-migrated island populations. PLoS ONE 2012, 7, e47268. [Google Scholar] [CrossRef] [PubMed] [Green Version]
  11. Qi, X.-S.; Chen, C.; Comes, H.P.; Sakaguchi, S.; Liu, Y.-H.; Tanaka, N.; Sakio, H.; Qiu, Y.-X. Molecular data and ecological niche modelling reveal a highly dynamic evolutionary history of the East Asian Tertiary relict Cercidiphyllum (Cercidiphyllaceae). N. Phytol. 2012, 196, 617–630. [Google Scholar] [CrossRef] [PubMed]
  12. Qi, X.S.; Yuan, N.; Comes, H.P.; Sakaguchi, S.; Qiu, Y.-X. A strong ‘filter’ effect of the East China Sea land bridge for East Asia’s temperate plant species: Inferences from molecular phylogeography and ecological niche modelling of Platycrater arguta (Hydrangeaceae). BMC Evol. Biol. 2014, 14, 41. [Google Scholar] [CrossRef] [Green Version]
  13. Sakaguchi, S.; Qiu, Y.-X.; Liu, Y.-H.; Qi, X.S.; Kim, S.H.; Han, J.; Takeuchi, Y.; Worth, J.R.P.; Yamasaki, M.; Sakurai, S.; et al. Climate oscillation during the Quaternary associated with landscape heterogeneity promoted allopatric lineage divergence of a temperate tree Kalopanax septemlobus (Araliaceae) in East Asia. Mol. Ecol. 2012, 21, 3823–3838. [Google Scholar] [CrossRef]
  14. Sata, H.; Shimizu, M.; Iwasaki, T.; Ikeda, H.; Soejima, A.; Kozhevnikov, A.E.; Kozhevnikova, Z.V.; Im, H.T.; Jang, S.K.; Azuma, T.; et al. Phylogeography of the East Asian grassland plant, Viola orientalis (Violaceae), inferred from plastid and nuclear restriction site-associated DNA sequencing data. J. Plant Res. 2021, 134, 1181–1198. [Google Scholar] [CrossRef] [PubMed]
  15. Ye, M.; Liu, W.; Xue, Q.; Hou, B.; Luo, J.; Ding, X. Phylogeography of the endangered orchid Dendrobium moniliforme in East Asia inferred from chloroplast DNA sequences. Mitochondrial DNA A DNA Mapp. Seq. Anal. 2017, 28, 880–891. [Google Scholar] [PubMed]
  16. Kokubugata, G.; Peng, C.I. Floral morphology and recognition of varieties in Conandron ramondioides (Gesneriaceae) from Japan and Taiwan. Edinb. J. Bot. 2004, 61, 21–30. [Google Scholar] [CrossRef]
  17. Morris, A.B.; Ickert-Bond, S.M.; Brunson, D.B.; Soltis, D.E.; Soltis, P.S. Phylogeographical structure and temporal complexity in American sweetgum (Liquidambar styraciflua; Altingiaceae). Mol. Ecol. 2008, 17, 3889–3900. [Google Scholar] [CrossRef] [PubMed]
  18. Schaal, B.A.; Hayworth, D.A.; Olsen, K.M.; Rauscher, J.T.; Smith, W.A. Phylogeographic studies in plants: Problems and prospects. Mol. Ecol. 1998, 7, 465–474. [Google Scholar] [CrossRef]
  19. Shaw, J.; Shafer, H.L.; Leonard, O.R.; Kovach, M.J.; Schorr, M.; Morris, A.B. Chloroplast DNA sequence utility for the lowest phylogenetic and phylogeographic inferences in angiosperms: The tortoise and the hare IV. Am. J. Bot. 2014, 101, 1987–2004. [Google Scholar] [CrossRef] [Green Version]
  20. Shaw, J.; Small, R.L. Chloroplast DNA phylogeny and phylogeography of the North American plums (Prunus subgenus Prunus section Prunocerasus, Rosaceae). Am. J. Bot. 2005, 92, 2011–2030. [Google Scholar] [CrossRef] [Green Version]
  21. Knowles, L.L.; Maddison, W.P. Statistical Phylogeography. Mol. Ecol. 2002, 11, 2623–2635. [Google Scholar] [CrossRef]
  22. Wolfe, K.H.; Li, W.H.; Sharp, P.M. Rates of nucleotide substitution vary greatly among plant mitochondrial, chloroplast, and nuclear DNAs. Proc. Natl. Acad. Sci. USA 1987, 84, 9054–9058. [Google Scholar] [CrossRef] [PubMed] [Green Version]
  23. Qiu, Y.X.; Sun, Y.; Zhang, X.P.; Lee, J.; Fu, C.X.; Comes, H.P. Molecular phylogeography of East Asian Kirengeshoma (Hydrangeaceae) in relation to quaternary climate change and landbridge configurations. N. Phytol. 2009, 183, 480–495. [Google Scholar] [CrossRef] [PubMed]
  24. Wang, J.F.; Gong, X.; Chiang, Y.C.; Kuroda, C.; Linder, P. Phylogenetic patterns and disjunct distribution in Ligularia hodgsonii Hook. (Asteraceae). J. Biogeogr. 2013, 40, 1741–1754. [Google Scholar] [CrossRef]
  25. Huang, S.; Chiang, Y.C.; Schaal, B.A.; Chou, C.H.; Chiang, T.Y. Organelle DNA phylogeography of Cycas taitungensis, a relict species in Taiwan. Mol. Ecol. 2001, 10, 2669–2681. [Google Scholar] [CrossRef]
  26. Wolf, S.; Moritz, R.F.A. Foraging distance in Bombus terrestris L. (Hymenoptera: Apidae). Apidologie 2008, 39, 419–427. [Google Scholar] [CrossRef]
  27. Ma, H.W. Autonomous Selfing Provides Potential Reproductive Assurance in Conandron ramondioides (Gesneriaceae). Master’s Thesis, National Taiwan University, Taipei, Taiwan, 2017. [Google Scholar]
  28. Peat, J.; Goulson, D. Effects of experience and weather on foraging rate and pollen versus nectar collection in the bumblebee, Bombus terrestris. Behav. Ecol. Sociobiol. 2005, 58, 152–156. [Google Scholar] [CrossRef]
  29. Lisiecki, L.E.; Raymo, M.E. A Pliocene-Pleistocene stack of 57 globally distributed benthic δ18O records. Paleoceanography 2005, 20, PA1003. [Google Scholar] [CrossRef] [Green Version]
  30. Jiang, D.; Lang, X. Last Glacial Maximum East Asian Monsoon: Results of PMIP Simulations. J. Clim. 2010, 23, 5030–5038. [Google Scholar] [CrossRef]
  31. Mishima, M.; Kawahata, H.; Suzuki, A.; Inoue, M.; Okai, T.; Omura, A. Reconstruction of the East China Sea paleoenvironment at 16 ka by comparison of fossil and modern Faviidae corals from the Ryukyus, southwestern Japan. J. Quatenary Sci. 2009, 24, 928–936. [Google Scholar] [CrossRef]
  32. Ruddiman, W.F.; Raymo, M.E.; Martinson, D.G.; Clement, B.M.; Backman, J. Pleistocene evolution: Northern hemisphere ice sheets and North Atlantic Ocean. Paleoceanography 1989, 4, 353–412. [Google Scholar] [CrossRef]
  33. Cao, Y.N.; Comes, H.P.; Sakaguchi, S.; Chen, L.Y.; Qiu, Y.X. Evolution of East Asia’s Arcto-Tertiary relict Euptelea (Eupteleaceae) shaped by Late Neogene vicariance and Quaternary climate change. BMC Evol. Biol. 2016, 16, 66. [Google Scholar] [CrossRef] [PubMed] [Green Version]
  34. Wei, X.P.; Zhang, X.C. Phylogeography of the widespread fern Lemmaphyllum in East Asia: Species differentiation and population dynamics in response to change in climate and geography. J. Syst.Evol. 2022, 60, 411–432. [Google Scholar] [CrossRef]
  35. Ota, H. Geographic patterns of endemism and speciation in amphibians and reptiles of the Ryukyu Archipelago, Japan, with special reference to their paleogeographical implications. Popul. Ecol. 1998, 40, 189–204. [Google Scholar] [CrossRef]
  36. Hsin, K.T.; Wang, C.N. Expression shifts of floral symmetry genes correlate to flower actinomorphy in East Asia endemic Conandron ramondioides (Gesneriaceae). Bot. Stud. 2018, 59, 24. [Google Scholar] [CrossRef] [PubMed] [Green Version]
  37. Hileman, L.C. Trends in flower symmetry evolution revealed through phylogenetic and developmental genetic advances. Philos. Trans. R. Soc. Lond. B Biol. Sci. 2014, 369, 20130348. [Google Scholar] [CrossRef] [Green Version]
  38. Hsu, H.J.; He, C.W.; Kuo, W.H.; Hsin, K.T.; Lu, J.Y.; Pan, Z.J.; Wang, C.N. Genetic Analysis of Floral Symmetry Transition in African Violet Suggests the Involvement of Trans-acting Factor for CYCLOIDEA Expression Shifts. Front. Plant Sci. 2018, 9, 1008. [Google Scholar] [CrossRef] [Green Version]
  39. Luo, D.; Carpenter, R.; Vincent, C.; Copsey, L.; Coen, E. Origin of floral asymmetry in Antirrhinum. Nature 1996, 383, 794–799. [Google Scholar] [CrossRef]
  40. Preston, J.C.; Hileman, L.C. Developmental genetics of floral symmetry evolution. Trends Plant Sci. 2009, 14, 147–154. [Google Scholar] [CrossRef]
  41. Alvarez, I.; Wendel, J.F. Ribosomal ITS sequences and plant phylogenetic inference. Mol. Phylogenet. Evol. 2003, 29, 417–434. [Google Scholar] [CrossRef] [Green Version]
  42. Baldwin, B.G.; Sanderson, M.J.; Porter, J.M.; Wojciechowski, M.F.; Campbell, C.S.; Donoghue, M.J. The its Region of Nuclear Ribosomal DNA: A Valuable Source of Evidence on Angiosperm Phylogeny. Ann. Mo. Bot. Gard. 1995, 82, 247–277. [Google Scholar] [CrossRef]
  43. Schoch, C.L.; Seifert, K.A.; Huhndorf, S.; Robert, V.; Spouge, J.L.; Levesque, C.A.; Chen, W.; Fungal Barcoding Consotium; Fungal Barcoding Consotium Author List; Bolchacova, E.; et al. Nuclear ribosomal internal transcribed spacer (ITS) region as a universal DNA barcode marker for Fungi. Proc. Natl. Acad. Sci. USA 2012, 109, 6241–6246. [Google Scholar] [CrossRef] [PubMed] [Green Version]
  44. Liao, D. Concerted evolution: Molecular mechanism and biological implications. Am. J. Hum. Genet. 1999, 64, 24–30. [Google Scholar] [CrossRef] [PubMed] [Green Version]
  45. Xu, B.; Zeng, X.M.; Gao, X.F.; Jin, D.-P.; Zhang, L.B. ITS non-concerted evolution and rampant hybridization in the legume genus Lespedeza (Fabaceae). Sci. Rep. 2017, 7, 40057. [Google Scholar] [CrossRef] [PubMed] [Green Version]
  46. de Sousa Queiroz, C.; de Carvalho Batista, F.R.; de Oliveira, L.O. Evolution of the 5.8S nrDNA gene and internal transcribed spacers in Carapichea ipecacuanha (Rubiaceae) within a phylogeographic context. Mol. Phylogenet. Evol. 2011, 59, 293–302. [Google Scholar] [CrossRef]
  47. Zheng, X.; Cai, D.; Yao, L.; Teng, Y. Non-concerted ITS evolution, early origin and phylogenetic utility of ITS pseudogenes in Pyrus. Mol. Phylogenet. Evol. 2008, 48, 892–903. [Google Scholar] [CrossRef]
  48. Harpke, D.; Peterson, A. Non-concerted ITS evolution in Mammillaria (Cactaceae). Mol. Phylogenet. Evol. 2006, 41, 579–593. [Google Scholar] [CrossRef]
  49. Avise, J.C. Phylogeography: The History and Formation of Species; Harvard University Press: Cambridge, MA, USA, 2000. [Google Scholar]
  50. Neigel, J.; Avise, J. Evolutionary Processes and Theory; Elsevier Inc.: Amsterdam, The Netherlands, 1986. [Google Scholar]
  51. Palumbi, S.R.; Cipriano, F.; Hare, M.P. Predicting nuclear gene coalescence from mitochondrial data: The three-times rule. Evolution 2001, 55, 859–868. [Google Scholar] [CrossRef]
  52. Doyle, J.J.; Doyle, J.L. A rapid DNA isolation procedure for small quantities of fresh leaf tissue. Phytochem. Bull. 1987, 19, 11–15. [Google Scholar]
  53. Sanger, F.; Nicklen, S.; Coulson, A.R. DNA sequencing with chain-terminating inhibitors. Proc. Natl. Acad. Sci. USA 1977, 74, 5463–5467. [Google Scholar] [CrossRef] [Green Version]
  54. Taberlet, P.; Coissac, E.; Pompanon, F.; Gielly, L.; Miquel, C.; Valentini, A.; Vermat, T.; Corthier, G.; Brochmann, C.; Willerslev, E. Power and limitations of the chloroplast trnL (UAA) intron for plant DNA barcoding. Nucleic Acids Res. 2007, 35, e14. [Google Scholar] [CrossRef] [Green Version]
  55. Tate, J.A.; Simpson, B.B. Paraphyly of Tarasa (Malvaceae) and Diverse Origins of the Polyploid Species. Syst. Bot. 2003, 28, 723–737. [Google Scholar]
  56. Xiao, L.H.; Wang, Y.Z. Single nucleotide polymorphisms of Gcyc1 (Cycloidea) in Conandron ramondioides (Gesneriaceae) from Southeast China. Plant Syst. Evol. 2007, 269, 145–157. [Google Scholar] [CrossRef]
  57. Möller, M.; Cronk, Q.C. Phylogeny and disjunct distribution: Evolution of Saintpaulia (Gesneriaceae). Proc. Royal Soc. B 1997, 264, 1827–1836. [Google Scholar] [CrossRef] [PubMed] [Green Version]
  58. Hsin, K.T.; Wang, C.N. Cheng, Y.S. Screening three single-copy nuclear markers to infer population divergence in Conandron ramondioides (Gesneriaceae). J. Nat. Taiwan Museum 2021, 74, 15–25. [Google Scholar]
  59. Krak, K.; Alvarez, I.; Caklová, P.; Costa, A.; Chrtek, J.; Fehrer, J. Development of novel low-copy nuclear markers for Hieraciinae (Asteraceae) and their perspective for other tribes. Am. J. Bot. 2012, 99, e74–e77. [Google Scholar] [CrossRef] [PubMed] [Green Version]
  60. Edgar, R.C. MUSCLE: Multiple sequence alignment with high accuracy and high throughput. Nucleic Acids Res. 2004, 32, 1792–1797. [Google Scholar] [CrossRef] [PubMed] [Green Version]
  61. Tamura, K.; Stecher, G.; Peterson, D.; Filipski, A.; Kumar, S. MEGA6: Molecular Evolutionary Genetics Analysis version 6.0. Mol. Biol. Evol. 2013, 30, 2725–2729. [Google Scholar] [CrossRef] [Green Version]
  62. Hall, T. BioEdit: A user-friendly biological sequence alignment editor and analysis program for Windows 95/98/NT. Nucleic Acids Symp. Ser. 1999, 41, 95–98. [Google Scholar]
  63. Librado, P.; Rozas, J. DnaSP v5: A software for comprehensive analysis of DNA polymorphism data. Bioinformatics 2009, 25, 1451–1452. [Google Scholar] [CrossRef] [Green Version]
  64. Excoffier, L.; Lischer, H.E. Arlequin suite ver 3.5: A new series of programs to perform population genetics analyses under Linux and Windows. Mol. Ecol. Resour. 2010, 10, 564–567. [Google Scholar] [CrossRef]
  65. Excoffier, L.; Smouse, P.E.; Quattro, J.M. Analysis of molecular variance inferred from metric distances among DNA haplotypes: Application to human mitochondrial DNA restriction data. Genetics 1992, 131, 479–491. [Google Scholar] [CrossRef]
  66. Aktas, C. R Package Haplotypes: Haplotype Inference and Statistical Analysis of Genetic Variation; R Foundation for Statistical Computing: Vienna, Austria, 2015. [Google Scholar]
  67. Simmons, M.P.; Ochoterena, H. Gaps as Characters in Sequence-Based Phylogenetic Analyses. Syst. Biol. 2000, 49, 369–381. [Google Scholar] [CrossRef] [PubMed] [Green Version]
  68. Bouckaert, R.; Heled, J.; Kühnert, D.; Vaughan, T.; Wu, C.H.; Xie, D.; Suchard, M.A.; Rambaut, A.; Drummond, A.J. BEAST 2: A software platform for Bayesian evolutionary analysis. PLoS Comput. Biol. 2014, 10, e1003537. [Google Scholar] [CrossRef] [PubMed] [Green Version]
  69. Heled, J.; Drummond, A.J. Bayesian Inference of Species Trees from Multilocus Data. Mol. Biol. Evol. 2010, 27, 570–580. [Google Scholar] [CrossRef] [PubMed]
  70. Posada, D. jModelTest: Phylogenetic model averaging. Mol. Biol. Evol. 2008, 25, 1253–1256. [Google Scholar] [CrossRef] [PubMed]
  71. Brown, R.P.; Yang, Z. Rate variation and estimation of divergence times using strict and relaxed clocks. BMC Evol. Biol. 2011, 11, 271. [Google Scholar] [CrossRef] [Green Version]
  72. Rambaut, A.; Drummond, A.J.; Xie, D.; Baele, G.; Suchard, M.A. Posterior Summarization in Bayesian Phylogenetics Using Tracer 1.7. Syst. Biol. 2018, 67, 901–904. [Google Scholar] [CrossRef] [PubMed] [Green Version]
  73. Hey, J. Isolation with Migration Models for More Than Two Populations. Mol. Biol. Evol. 2010, 27, 905–920. [Google Scholar] [CrossRef] [PubMed] [Green Version]
  74. Watterson, G.A. On the number of segregating sites in genetical models without recombination. Theor. Popul. Biol. 1975, 7, 256–276. [Google Scholar] [CrossRef]
  75. Hey, J. The divergence of chimpanzee species and subspecies as revealed in multipopulation isolation-with-migration analyses. Mol. Biol. Evol. 2010, 27, 921–933. [Google Scholar] [CrossRef] [Green Version]
  76. Nielsen, R.; Wakeley, J. Distinguishing migration from isolation: A Markov chain Monte Carlo approach. Genetics 2001, 158, 885–896. [Google Scholar] [CrossRef] [PubMed]
  77. Tajima, F. Evolutionary relationship of DNA sequences in finite populations. Genetics 1983, 105, 437–460. [Google Scholar] [CrossRef]
  78. Fu, Y.X. Statistical tests of neutrality of mutations against population growth, hitchhiking and background selection. Genetics. 1997, 147, 915–925. [Google Scholar] [CrossRef]
  79. McDonald, J.H.; Kreitman, M. Adaptive protein evolution at the Adh locus in Drosophila. Nature 1991, 351, 652–654. [Google Scholar] [CrossRef] [PubMed]
  80. Egea, R.; Casillas, S.; Barbadilla, A. Standard and generalized McDonald-Kreitman test: A website to detect selection by comparing different classes of DNA sites. Nucleic Acids Res. 2008, 36, W157–W162. [Google Scholar] [CrossRef] [Green Version]
  81. Heled, J.; Drummond, A.J. Bayesian inference of population size history from multiple loci. BMC Evol. Biol. 2008, 8, 289. [Google Scholar] [CrossRef] [PubMed] [Green Version]
  82. Elith, J.; Graham, C.H.; Anderson, R.P.; Dudík, M.; Ferrier, S.; Guisan, A.; Hijmans, R.J.; Huettmann, F.; Leathwick, J.R.; Lehmann, A.; et al. Novel methods improve prediction of species’ distributions from occurrence data. Ecography 2006, 29, 129–151. [Google Scholar] [CrossRef] [Green Version]
  83. Phillips, S.J.; Anderson, R.P.; Schapire, R.E. Maximum entropy modeling of species geographic distributions. Ecol. Modell. 2006, 190, 231–259. [Google Scholar] [CrossRef] [Green Version]
  84. Hijmans, R.J.; Cameron, S.E.; Parra, J.L.; Jones, P.G.; Jarvis, A. Very high resolution interpolated climate surfaces for global land areas. Int. J. Climatol. 2005, 25, 1965–1978. [Google Scholar] [CrossRef]
  85. van Etten, J. R Package gdistance: Distances and Routes on Geographical Grids. J. Stat. Softw. 2017, 76, 1–21. [Google Scholar] [CrossRef] [Green Version]
  86. Perret, M.; Chautems, A.; De Araujo, A.O.; Salamin, N. Temporal and spatial origin of Gesneriaceae in the New World inferred from plastid DNA sequences. Bot. J. Linn. 2012, 171, 61–79. [Google Scholar] [CrossRef] [Green Version]
  87. Möller, M.; Pfosser, M.; Jang, C.G.; Mayer, V.; Clark, A.; Hollingsworth, M.L.; Barfuss, M.H.J.; Wang, Y.Z.; Kiehn, M.; Weber, A. A preliminary phylogeny of the ‘didymocarpoid Gesneriaceae’ based on three molecular data sets: Incongruence with available tribal classifications. Am. J. Bot. 2009, 96, 989–1010. [Google Scholar] [CrossRef] [PubMed]
  88. Weber, A.; Middleton, D.J.; Forrestet, A.; Kiew, R.; Lim, C.L.; Rafidah, A.R.; Sontag, S.; Triboun, P.; Wei, Y.G.; Yao, T.L.; et al. Molecular systematics and remodelling of Chirita and associated genera (Gesneriaceae). Taxon 2011, 60, 767–790. [Google Scholar] [CrossRef]
  89. Kimura, M. A simple method for estimating evolutionary rates of base substitutions through comparative studies of nucleotide sequences. J. Mol. Evol. 1980, 16, 111–120. [Google Scholar] [CrossRef] [PubMed]
Figure 1. Locations of C. ramondioides sample collection. Samples were marked with abbreviations corresponding to those in Supplementary Table S1. Shaded sea areas indicate continental shelves that might have been exposed during the last glacial maximum.
Ijms 23 14932 g001
Figure 2. Statistical parsimony networks reconstructed from the six loci isolated from C. ramondioides. Hollow squares indicate hypothetical (i.e., extinct or not sampled) haplotypes; one mutational step is represented as a line connecting to each haplotype. The size of colored circle corresponds to haplotype frequency. (A). ATG2 intron 1, (B). GroES intron 1, (C). LFY intron 1, (D). CrCYC1, (E). ITS, and (F). cpDNA (trnL-F + trnH-psbA). Color codes are listed in Supplementary Figure S1. Haplotype and ribotype frequency maps are shown in Supplementary Figure S2.
Ijms 23 14932 g002
Figure 3. Genetic index values were measured from nuclear and cpDNA markers. (A,B): Hd and π were measured from five nuclear markers (ATG2 intron 1, GroES intron 1, LEAFY intron 1, CrCYC1, and ITS) and cpDNA of the North group (Honshu and Shikoku) and the South group (Southeast China, Taiwan, and Iriomote). (C,D): Hd and π measured from the five nuclear markers and cpDNA of the TI group (Taiwan and Iriomote) and the C group (Southeast China).
Ijms 23 14932 g003
Figure 4. Phylogeny of sampled C. ramondioides populations reconstructed by *BEAST2. The phylogenetic tree was reconstructed from the 3nrDNA dataset. Numbers above nodes represent posterior probability. Colored squares represent the geographic region.
Ijms 23 14932 g004
Figure 5. The reconstructed lineage divergence process inferred from a multi-population IMa2 analysis of C. ramondioides. TI denotes sampled populations distributed in Taiwan and Iriomote, C denotes sampled populations distributed in Southeast China, and HS denotes sampled populations distributed in Honshu and Shikoku. In the cartoon plot, effective population size of each clade and lineage divergence time among groups are indicated by a box and horizontal lines, respectively. Blue boxes and blue horizontal lines are scaled to denote the mean measured parameters. Gray boxes and lines, including double arrows and dashed lines, are scaled to present the 95% confidence intervals of the corresponding parameters. A1 denotes the ancestor population of C and TI. A2 denotes the ancestor population of C, TI and HS.
Ijms 23 14932 g005
Figure 6. Population divergence process among assigned C. ramondioides groups inferred from a pairwise IMa2 analysis. The group codes, figure labels, and figure format correspond to Figure 5. Scale bars for 100,000 individuals and 1 million years apply to all six plots. (a) The estimated divergence process between TI and C group. (b) The estimated divergence process between C and HS group. (c) The estimated divergence process between TI and HS group.
Ijms 23 14932 g006
Figure 7. The effective population size changes over time of C. ramondioides groups. (A). HS: Honshu–Shikoku group, (B). China: Southeast China group, (C). TI: Taiwan–Iriomote group.
Ijms 23 14932 g007
Figure 8. Modeled potential suitable habitat range and least-cost path of C. ramondioides during the last glacial maximum (LGM). Gray: land configuration during the LGM. Hollow circles: populations sampled during this study. Color bar: green to white denotes suitable to unsuitable habitat for Conandron during the LGM.
Ijms 23 14932 g008
Figure 9. Corolla tube versus lobe length measured from C. ramondioides flowers distributed in China, Taiwan, or Japan.
Ijms 23 14932 g009
Table 1. McDonald–Kreitman tests of CrCYC1C haplotypes.
Cyrtandra *Hemiboea *Oreocharis *
Polymorphism Divergence Polymorphism Divergence Polymorphism Divergence
Synonymous (dS)524920811
Non-synonymous (dN)202441301621
Total254850502432
χ2 value 6.11 5.876 0.904
p-value 0.013 0.015 0.34
* These three Gesneriaceae species are used as outgroups.
Table 2. Neutrality tests of four molecular markers estimated from the China populations.
Tajima’s DFu’s Fs
cpDNA2.9 (p < 0.01)7.86 (p < 0.01)
ATG2 intron 1−0.15 (p > 0.1)0.05 (p > 0.1)
GroES intron 11.63 (p > 0.1)2.04 (p > 0.1)
LFY intron 11.3 (p > 0.1)3.34 (p > 0.1)
Table 3. Pairwise Fst estimates from four loci of three identified C. ramondioides groups.
GroupHonshu+ShikokuTaiwan+Iriomote
Honshu+Shikoku-
(a) ATG2 intron 1Taiwan+Iriomote0.571 ***-
Southeast China0.748 ***0.691 ***
Honshu+Shikoku-
(b) GroES intron 1Taiwan+Iriomote0.449 ***-
Southeast China0.298 ***0.513 ***
Honshu+Shikoku-
(c) LFY intron 1Taiwan+Iriomote0.472 ***-
Southeast China0.674 ***0.848 ***
Honshu+Shikoku-
(d) cpDNATaiwan+Iriomote0.295 ***-
SE-China0.32 ***0.269 ***
*** p < 0.001.
Table 4. Hierarchical analysis of molecular variance (AMOVA) in Conandron obtained from sequences of three loci.
ATG2 intron 1
3 groups
Source of variationd.f.Sum of squaresVariance componentsPercentage variationFixation indicesp
Among groups2100.6350.77139.61ΦCT = 0.40.003
Among populations within groups775.0230.72137.04ΦSC = 0.61<0.0001
Within populations14465.4430.45423.34ΦST = 0.767<0.0001
Total153153.0001.947
GroES intron 1
Source of variationd.f.Sum of squaresVariance componentsPercentage variationFixation indicesp
Among groups2154.5830.84436.750ΦCT = 0.367<0.0001
Among populations within groups12109.2280.54123.550ΦSC = 0.372<0.0001
Within populations226205.0670.91139.700ΦST = 0.601<0.0001
Total239468.3672.290
LFY intron 1
Source of variationd.f.Sum of squaresVariance componentsPercentage variationFixation indicesp
Among groups277.3650.83947.810ΦCT = 0.4780.002
Among populations within groups764.4850.65737.410ΦSC = 0.717<0.0001
Within populations12432.1660.25914.780ΦST = 0.852<0.0001
Total133172.7691.741
Publisher’s Note: MDPI stays neutral with regard to jurisdictional claims in published maps and institutional affiliations.

