Abstract
Luffa leaf (LL) is an agricultural waste produced by loofah. In this work, LL was used as biomass carbon source for biochars for the first time. After carbonization, activation, and chemical co-precipitation treatments, a magnetic lignocellulose-derived hierarchical porous biochar was obtained. The specific surface area and total pore volume were 2565.4 m2/g and 1.4643 cm3/g, and the surface was rich in carbon and oxygen functional groups. The synthetic dye rhodamine B (RhB) and the antibiotic tetracycline hydrochloride (TH) were selected as organic pollutant models to explore the ability to remove organic pollutants, and the results showed good adsorption performances. The maximum adsorption capacities were 1701.7 mg/g for RhB and 1755.9 mg/g for TH, which were higher than most carbon-based adsorbents. After 10 cycles of use, the removal efficiencies were still maintained at more than 70%, showing good stability. This work not only verified the feasibility of lignocellulose LL as a carbon source to prepare biochar but also prepared a magnetic hierarchical porous adsorbent with good performances that can better treat RhB and TH, which provided a new idea and direction for the efficient removal of organic pollutants in water.
1. Introduction
With the rapid development of global industrialization, the problem of water pollution has attracted a lot of attention worldwide [1]. Various organic pollutants, such as organic dyes and antibiotics, have been detected in water bodies [2,3]. They are not only difficult to degrade naturally. They can cause teratogenesis, cancer, and death [4,5]. Traditional treatment methods, such as chemical precipitation [6], electrocatalysis [7], and microbial degradation [8], struggle to completely remove these impurities. Electrocatalysis, for example, can be costly due to using more expensive metals as electrodes [7]. The chemical precipitation method causes serious secondary pollution due to its use of a large number of flocculants [6]. Although the microbial method has low energy consumption and is sustainable, the treatment cycle is longer than for other methods [8]. Therefore, there is an urgent need to develop more efficient and green methods to quickly remove organic pollutants. The adsorption method has become a research hotspot in recent years due to its advantages of simple operation, mild conditions, and no secondary pollution [9,10]. The adsorbent, as a key index to measure the adsorption efficiency and evaluate the effect of an adsorption treatment, is one of the important parameters affecting the adsorption process.
In addition to some highly available sustainable biomass that is often used as adsorbents due to its excellent adsorption properties [9,10], carbon-based materials such as graphene [11], carbon nanotubes [12], and highly poly carbon fibers [13] also show great adsorption potential. However, such carbonaceous materials are not only extremely expensive but are also difficult to obtain. Biochar is a kind of carbon-rich product generated by the pyrolysis of biomass under anaerobic conditions [14]. Its advantages of easy access to carbon sources and low cost have given it a popular role in a new class of carbon-based materials [14]. Generally speaking, the properties of biochar are mainly determined by its natural structure and preparation process. The unique natural structure and more advanced preparation techniques often maximize the potential of biochar properties, which surprises researchers [15,16]. Lignocellulose is often used as one of the main carbon sources for biochar preparation and is composed of cellulose, hemicellulose, and lignin [17,18]. These lignocellulosic components intertwine with each other, forming complex structures [18] and eventually becoming organs with more attractive structures, such as flowers, rods, and leaves, through the process of biological differentiation during plant growth. Our team has been working on the development and utilization of lignocellulosic resources for nearly ten years [19,20,21], but until now, these valuable resources have not been thoroughly explored.
Towel gourd (Luffa cylindrica) is one of the most important melon vegetables. Due to its rich nutrition, high yield, and good economic benefits, loofah is not only widely planted throughout China but is also widely cultivated in the temperate and tropical regions of the world [22]. With the increasing demand for loofah and the continuous development of cultivation technology, the planting scale of loofah is expanding, and the agricultural waste produced by loofah is also increasing. Luffa leaf (LL) is a kind of agricultural waste produced by the cultivation of loofah. The main component is lignocellulose [23]. Although there have been some reports on LL in recent years, most of them have focused on the medicinal use of its extracts [24,25]. Few studies have reported on biochar preparation from LL, and its performance was not clear, which gives us great motivation to continue to exploit this valuable and abundant lignocellulosic resource.
In this work, LL was used as a carbon source to prepare hierarchical porous biochars. Three bases, including NaOH, KOH, and a mixed base (MB, consisted of equal masses of NaOH and KOH), were used to explore the best preparation activator and the influences of different activators on the preparation of biochars. In order to improve the stability and rapid recovery ability of LL-based hierarchical porous biochar (LLB), magnetic nanoparticles (Fe3O4) were loaded via a chemical co-precipitation method. Subsequently, the antibiotic tetracycline hydrochloride (TH) and the organic synthetic dye rhodamine B (RhB) were chosen as pollutant models to explore the removal efficiency of biochars in a water environment. Finally, the adsorption mechanism was also studied and discussed. The focus of this study was to explore the feasibility of using LL as a carbon source to prepare magnetic hierarchical porous biochar and to prepare a series of biochars with excellent performance, rapid recovery, and stable reproduction to provide effective ideas for the improved and more efficient removal of organic pollutants.
2. Results and Discussion
2.1. Preparation of Magnetic Biochar
The preparation process of magnetic hierarchical porous biochar is shown in Figure 1 and can be divided into two steps: the preparation of hierarchical porous biochar and a magnetic composite. Of course, there were also two possible reaction mechanisms, including the MB activation process and chemical co-precipitation.
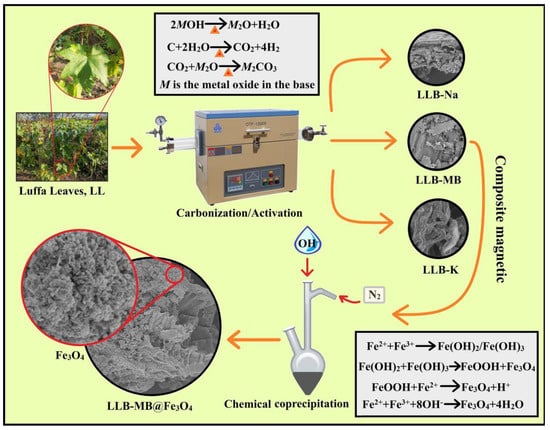
Figure 1.
Scheme of the preparation of magnetic hierarchical porous biochar.
MB Activation process [26,27,28]: In the high-temperature pyrolysis process, MB generates M2O and water, and is then further ionized to form K+, Na+, and OH−. These ions migrate or insert carbon precursors and react with them to generate carbon dioxide and water. The carbon dioxide further reacts with the oxide produced by MOH (Na2O or K2O) to form carbonate (Na2CO3 or K2CO3), which etches the carbonized sample. Finally, microporous or mesoporous structures are formed in the carbon.
Chemical co-precipitation [29,30,31]: Under N2 protection, Fe2+ and Fe3+ form unstable colloidal compounds (Fe(OH)2 and Fe(OH)3) in the presence of OH−. These alternate compounds partially react with H+ to form magnetic nanoparticles and FeOOH. As the pH of the solution increases, excess OH− continues to participate in the reaction, eventually forming Fe3O4.
2.2. Results of Characterizations
The results of the TGA and DTG curves, FT-IR spectra, XRD, and Raman spectra of the samples are shown in Figure 2. The effects of temperatures on LL were obtained by TGA and DTG tests under the protection of nitrogen with a heat rate of 10 °C/min, and the results are shown in Figure 2A. The TGA curves correspond to different stages of carbonized sample formation, indicating that there were three main stages of weight loss in the range from room temperature to 1200 °C. The first stage occurred from room temperature to 100 °C and was caused by the evaporation of water from the physical surface [32]. Then, the second stage occurred at 100–200 °C and may have been due to the loss of residual water from the pores inside LL [33]. The third stage started at 200 °C and ended at 500 °C. Like many types of lignocellulosic biomass [32,33,34], the main oxygenated components of LL were lignocellulose, which is composed of cellulose, hemicellulose, and lignin, and macromolecular organic materials such as proteins and fats [33,34]. These components can be decomposed into gas and tar during high-temperature pyrolysis and then removed, which causes significant weight loss. At 500 °C, the carbon yield was 44.92%. As the temperature continued to rise, the TGA and DTG curves did not show any further weight loss, especially when the temperature was 600 °C. The carbon yield was 43.81%, which was not much different from that at 500 °C. Therefore, considering the sustainable development and energy savings, the carbonization temperature of 500 °C was finally selected.
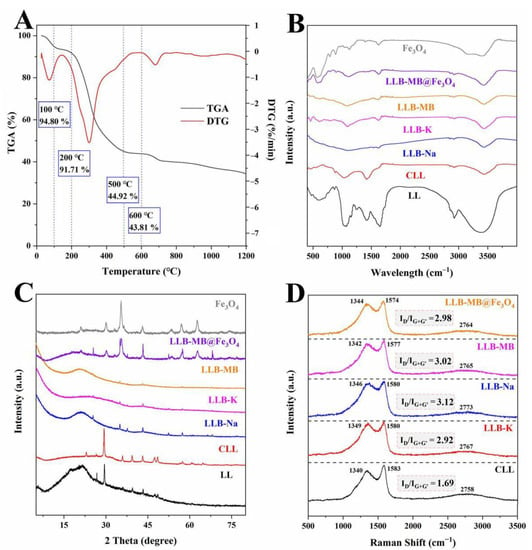
Figure 2.
(A) TGA and DTG curves of LL. (B) FT-IR spectra, (C) XRD, and (D) Raman spectra of samples.
The functional groups of the samples were analyzed by an FT-IR spectroscopy test, and the results are shown in Figure 2B. The wide band at 3250−3550 cm−1 represents the stretching vibration of the hydroxyl functional group (O-H) [32,33]. The bands at 2800−2900 cm−1 represent the symmetric and asymmetric stretching vibrations of the -CH, -CH2, and -CH3 groups [27,28,29]. The band at 1680−1720 cm−1 represents the stretching vibration of C=O [33]. The band at 1300−1400 cm−1 represents the C-H symmetric bending vibration of the methyl group. The band at 1200−1250 cm−1 represents the deformation vibration of the methylene group [32]. The bands around 980−1150 cm−1 represent the stretching vibration of the C-O in alcohols, phenols, acids, or esters [32,33]. The characteristic bands of Fe-O groups on Fe3O4 were observed at 575−585 cm−1 [26]. Thus, it can be inferred that Fe3O4 particles were successfully loaded on LLB-MB@Fe3O4.
The crystal structure of the samples was analyzed by XRD, and the results are shown in Figure 2C. The wide peak around 23° of LL was typical of lignocellulose [19,20]. Other irregular and obvious bands may be related to inorganic salts. The irregular and obvious bands of CLL were more prominent after carbonization, which might be due to salting out during the high-temperature pyrolysis process. After activation (regardless of the activators) these bands became weaker or even partially disappeared, largely due to the washing process during the preparation. In addition, from LLB-MB@Fe3O4 samples, characteristic peaks representing Fe3O4 can be clearly seen, such as (111), (220), (311), (400), (422), (511), and (440) [35,36], indicating successful magnetic recombination.
The presence of defects in the biochars was tested by Raman spectra, and the results are shown in Figure 2D. Three typical peaks obtained from the results, including the D-band with amorphous carbon around 1340−1349 cm−1 [37], the G-band with graphitic carbon around 1574−1583 cm−1 [38], and the G′-band (also named the 2D-band), which was sensitive to the number of graphene layers, had no defect and no D-peak, and could be fitted to a single peak of a single layer of graphene or to multiple peaks of a multilayer of graphene, which was caused by the double resonant Raman scattering with two-phonon emissions around 2758−2773 cm−1 [37,38]. To measure the degree of defect and disorder in carbons, the intensity ratio of the D-band and G-band with the G′-band (ID/IG+G′) was used as an important index. The ID/IG+G′ value of CLL was 1.69. After activation, the ID/IG+G′ values of LLB-Na and LLB-K were 2.92 and 3.12, which indicated that more amorphous carbon structures were generated in the biochars during activation when using NaOH or KOH as activators. Coincidentally, the ID/IG+G′ value of LLB-MB was 3.02, which was lower than LLB-Na and higher than LLB-K. After magnetic recombination, the ID/IG+G′ value of LLB-MB@Fe3O4 was 2.98.
The morphology of the samples was observed by SEM and TEM, and the results are shown in Figure 3. LL showed obvious lignofibers with a large number of lamellar structures. It was also clear that there were significant macropores, which may be solvent channels in the process of plant growth [19,20]. After carbonization, the surface of CLL became rough and compact due to intense dehydration, and there were obvious folds and furrows. Figure 3C–E show LLBs treated with different activators, which had visible differences, such as the degree of fragmentation and etching. This result indicated that different activators, including MB, had different effects on biochar preparation processes. After recombination, a large number of regular particles appeared on the surface of LLB-MB@Fe3O4 (Figure 2F), indicating that the chemical co-precipitate method was indeed successful in loading Fe3O4 onto the biochar. To further confirm the successful recombination, Fe3O4 (Figure 3I) and LLB-MB@Fe3O4 (Figure 3H) were tested by TEM, supporting this conclusion.
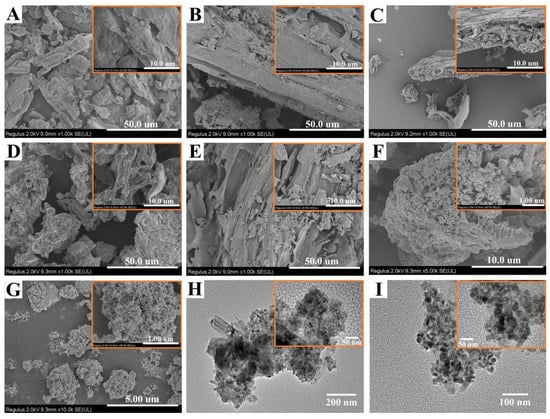
Figure 3.
(A) SEM images of (A) LL, (B) CLL, (C) LLB-Na, (D) LLB-K, (E) LLB-MB, (F) LLB-MB@Fe3O4, and (G) Fe3O4. TEM images of (H) LLB-MB@Fe3O4 and (I) Fe3O4.
The surface chemical and electronic states of the samples were tested by XPS spectroscopy, and the results are shown in Figure 4. LLB-MB contained mainly C (84.24%), O (13.89%), and N (1.87%) elements. Meanwhile, LLB-MB@Fe3O4 contained C (62.98%), O (26.5%), N (2.59%), and Fe (7.93%) elements. Further fitting these elements can obtain different functional keys. The high-resolution C1s spectrum of LLB-MB and LLB-MB@Fe3O4 showed three classical peaks, which were obtained at 284.14–284.18 eV, 285.05–285.08 eV, and 287.81–288.27 eV, corresponding to C-C, C-O, and C=O, respectively [32,33]. The high-resolution O1s spectrum of LLB-MB and LLB-MB@Fe3O4 had peaks at 529.98 eV, 531.59–531.61 eV, 532.83–532.97, and 534.38 eV, corresponding to quinones, C=O, C-O, and -OH, respectively [32,33]. The high-resolution N1s spectrum of LLB-MB and LLB-MB@Fe3O4 both had peaks at 397.41–397.61 eV and 399.57–400.16 eV, corresponding to pyridinic-N and pyrrolic-N [39]. Additionally, LLB-MB had a special peak at 401.09 eV corresponding to graphite-N [39], which may have disappeared during the process of the chemical co-precipitation of the composite magnetic properties.
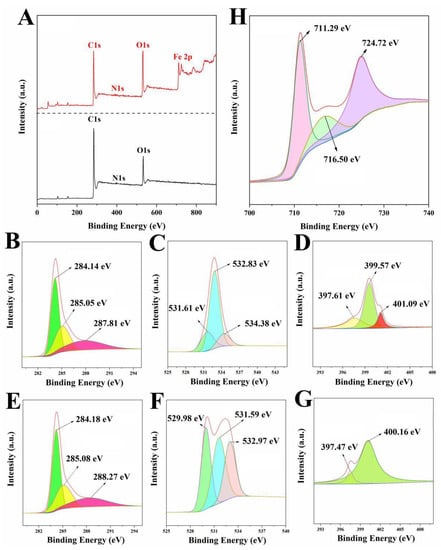
Figure 4.
(A) XPS spectra of LLB-MB and LLB-MB@Fe3O4. The C1s, O1s, and N1s of LLB (B−D) and LLB-MB@Fe3O4 (E−G). (H) The Fe 2p of LLB-MB@Fe3O4.
A N2 adsorption–desorption isotherm was used to test the specific surface area and porosity of the samples, and the results are shown in Figure 5 and Table 1. The specific surface area and total pore volume of CLL were 9.0 m2/g and 0.0253 cm3/g, respectively, which were far from sufficient to support CLL as a porous biochar. Therefore, further activation treatment was needed to increase the porosity and improve the adsorption performance. The effect of alkali activation was not in doubt [27,28,29], so different activators, including NaOH, KOH, and MB, were used for the further processing of CLL. After activation, the results showed that all LLBs exhibited typical type IV isotherms with typical H3 hysteresis loops (Figure 5A) [40,41], which indicated the existence of mesopore structures in the prepared biochars. Additionally, all LLBs had significant capillary absorption at the relative pressure range of 0.0 to 0.3 (Figure 5B), which was strong proof of the existence of a microporous structure [19]. Meanwhile, the specific surface areas and total pore volumes of LLB-Na, LLB-K, and LLB-MB were 2139.2 m2/g and 1.1886 cm3/g, 1500.8 m2/g and 1.0692 cm3/g, and 2446.6 m2/g and 1.6990 cm3/g, respectively. It can be seen from the above data that different activators indeed had different activation behaviors, which caused different activation results. Beyond that, the specific surface area and total pore volume of LLB-MB were obviously greater than those of LLB-Na and LLB-K, which indicated that MB-mediated activation was more effective than single-base activation for CLL. More notably, after magnetic recombination, the surface area of LLB-MB@Fe3O4 (2565.4 m2/g) was again increased compared with LLB-MB, which can be explained by the presence of uniformly loaded magnetic nanoparticles that improved the specific surface area of biochar [28]. On the other hand, the successful loading of Fe3O4 occupied part of the volume of the mesopore. Although the total pore volume decreased slightly (1.4643 m3/g), the proportion of capillary micropores increased, thus increasing the specific surface area of LLB-MB@Fe3O4, which can also be seen in Figure 5B. In addition, the pore size distribution results also showed the presence of both microporous and mesoporous structures, and combined with the macropores naturally presented in LL, it was concluded that LLB was successfully produced after activation (i.e., lignocellulose-derived hierarchical porous biochar). The mean pore sizes of LLB-Na, LLB-K, and LLB-MB were 2.22, 2.85, and 2.78 nm, which were larger than the molecular sizes of RhB (1.2 nm) and TH (1.3 nm), which can be used as adsorbents for efficient organic pollutant removal. At the same time, the mean pore size of LLB-MB@Fe3O4 was 2.28 nm, which was also applicable to the above conclusion.
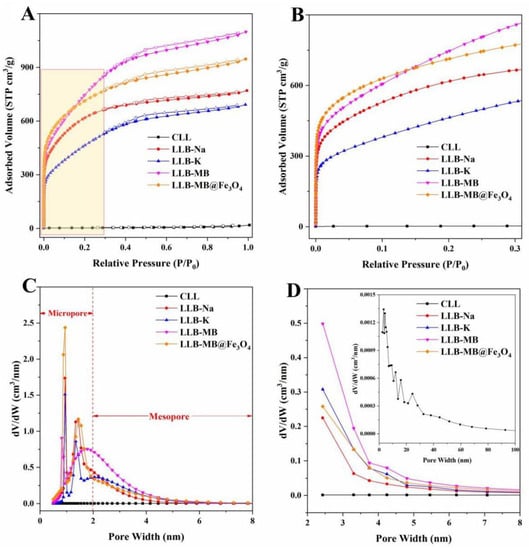
Figure 5.
N2 adsorption–desorption isotherms of samples under relative pressures of (A) 0.0−1.0 and (B) 0.0−0.3. Pore distributions of samples based on the (C) NLDFT method and (D) BJH method.

Table 1.
The data of N2 adsorption–desorption for CITG, CMITG, ITGB, and MITGB.
2.3. Results of Adsorption Experiments
2.3.1. Adsorption Kinetics
Adsorption kinetics describe the changes in the adsorbent and model adsorbent with contact time [42]. The influence of contact time on the adsorption capacity of RhB and TH by LLB-MB and LLB-Mb@Fe3O4 was explored at different initial solution concentrations at 303 K, and the results are shown in Figure 6 and Figure 7. It can be seen that if the adsorbent was LLB-MB or LLB-Mb@Fe3O4 and if the pollutant was RhB or TH the overall trends of each adsorption process were similar. that is, the adsorption capacities rapidly increased in the first 15 min and then reached equilibrium in 60 min. Further increasing the adsorption time did not lead to an obvious increase in the adsorption amount. To study the control mechanism of the chemical reactions in the adsorption processes, three common adsorption kinetics models, including pseudo-first-order kinetic (PFK, Equation (1)), pseudo-second-order kinetic (PSK, Equation (2)), and intraparticle diffusion models (IPD, Equation (3)), were used to analyze the adsorption kinetic data (Table 2 and Table 3), shown as follows:
where Qt (mg/g), C (mg/g), k1 (min−1), k2 (g mg−1 min−1), and k3 (mg g−1 min−0.5) represent the adsorption capacities of samples at different time points (t); the thickness of the boundary layer; and the PFK, PSK, and IPD adsorption kinetic rate constants, respectively.
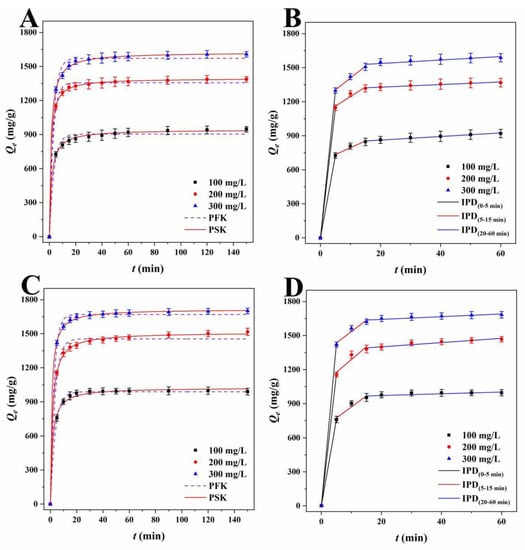
Figure 6.
PFK and PSK plots of RhB for (A) LLB-MB and (C) LLB-MB@Fe3O4 at 303 K. IPD plots of RhB for (B) LLB-MB and (D) LLB-MB@Fe3O4 at 303 K.
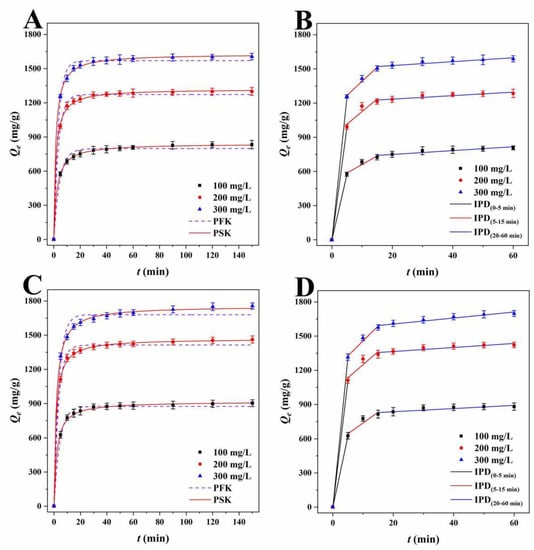
Figure 7.
PFK and PSK plots of TH for (A) LLB-MB and (C) LLB-MB@Fe3O4 at 303 K. IPD plots of TH for (B) LLB-MB and (D) LLB-MB@Fe3O4 at 303 K.

Table 2.
PFK and PSK model parameters for RhB and TH at 303 K.

Table 3.
IPD model parameters for RhB and TH at 303 K.
Lagergren’s PFK model was used to investigate the adsorption process, and the correlation coefficients (R2) of LLB-MB and LLB-MB@Fe3O4 ranged from 0.9842 to 0.9957 and from 0.9451 to 0.9987 for RhB. The PFK correlation coefficients (R2) of TH were 0.9450−0.9953 and 0.9863−0.9939 for LLB-MB and LLB-MB@Fe3O4. Although the theoretical adsorption capacities (Qe.cat) calculated from the model (904.1, 1356.3, and 1571.5 mg/g of LLB-MB for RhB; 988.3, 1415.9, and 1670.0 mg/g of LLB-MB@Fe3O4 for RhB; 798.3, 1237.1, and 1570.1 mg/g of LLB-MB for TH; and 874.8, 1413.7, and 1680.4 mg/g of LLB-MB@Fe3O4 for TH) were slightly lower than the experimental Qe (941.6, 1386.6, and 1606.5 mg/g of LLB-MB for RhB; 998.1, 1502.2, and 1698.2 mg/g of LLB-MB@Fe3O4 for RhB; 831.4, 1298.0, and 1602.4 mg/g of LLB-MB for TH; and 896.1, 1453.5, and 1749.9 mg/g of LLB-MB@Fe3O4 for TH), they still indicated that the PFK model may be applicable to the adsorption process in some aspects. At the same time, it also showed that the adsorption capacity will increase with the initial concentration increasing to some extent [42,43]. While Ho-McKay’s PSK model was used to fit the data, the correlation coefficients (R2) of LLB-MB and LLB-MB@Fe3O4 ranged from 0.9987 to 0.9998 and from 0.9964 to 0.9998 for RhB and ranged from 0.9989 to 0.9998 and from 0.9983 to 0.9994 for TH, which showed the applicability of PSK in the adsorption process. In addition, the adsorption processes of LLB-MB and LLB-MB@Fe3O4 for RhB and TH may be chemical reactions, and the adsorption behaviors of chemisorption bonds formed by transfer, exchange, or sharing can control the adsorption rate and affect the adsorption process of the adsorbents [28,42,43].
As for the Weber–Morris IPD model, which was used to fit the experimental data (Table 3), if the curve of Qt relative to t0.5 is a straight line through the origin, then it can be speculated that IPD should be an important step in determining the adsorption rate [27]. However, no single linearity can be observed in Figure 6B,D or Figure 7B,D but rather three linear regions with different adsorption rate constants. In the first stage (0−5 min), the rapid adsorption of LLB-MB and LLB-MB@Fe3O4 was due to the abundant adsorption sites on the outer surface. At this stage, the mass transfer behavior of the boundary layer diffusion was considered possible [27]. The second stage (5−15 min) was the IPD stage. At this stage, RhB or TH gradually entered the pore and bound to the inner surface of LLB-MB and LLB-MB@Fe3O4. The diffusion resistance caused by the small pore size of the adsorbent reduced the adsorption rate. In the third stage (20−60 min), the diffusion resistance continued to increase, and the adsorption rate continued to decrease and finally reached the adsorption equilibrium. The above results indicated that IPD played an important role in the adsorption process of RhB and TH. However, in the second and third adsorption stages, the linear fitting curves did not cross the origin, so it was not the only factor affecting the adsorption processes [27].
2.3.2. Adsorption Isotherm
The effect of concentration on adsorption capacity of adsorbent has usually been studied by studying adsorption isotherms [44,45]. The adsorption behaviors of adsorbents (LLB-MB and LLB-MB@Fe3O4) and adsorbates (RhB and TH) at 303 K were investigated with different initial solution concentrations, and the results are shown in Figure 8. It can be seen from the results that the adsorption capacities of the adsorbents increased with increases in the initial concentrations of the solutions. The adsorption isotherm data (Table 4) were investigated using the Langmuir isotherm model (Equation (4)) and the Freundlich isotherm model (Equation (5)):
where Qm (mg/g), KL (L/mg), and KF (mg g−1(L mg−1)1/n) represent the maximum adsorption capacity of sample, calculated by the adsorption isotherm model, the Langmuir model, and the Freundlich adsorption isotherm constants, respectively.
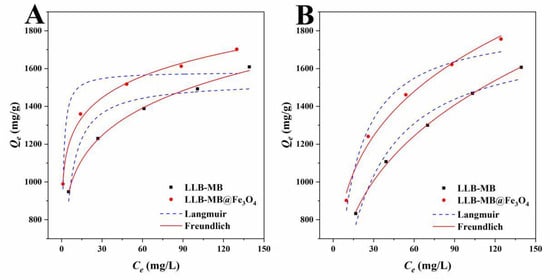
Figure 8.
Langmuir and Freundlich isotherms of (A) RhB and (B) TH for LLB-MB and LLB-MB@Fe3O4 at 303 K.

Table 4.
Adsorption isotherm parameters for RhB and TH at 303 K.
The Langmuir isotherm model was often used to describe the adsorption of homogeneous monolayer molecules, while the Freundlich isotherm model was used to analyze heterogeneous multilayer adsorption processes. The Langmuir correlation coefficients (R2) were 0.8738 for RhB and 0.9662 for TH for LLB-MB and were 0.8637 for RhB and 0.9728 for TH for LLB-MB@Fe3O4. The Freundlich correlation coefficients (R2) were 0.9972 and 0.9991 for LLB-MB for RhB and TH, and 0.9957 and 0.9912 for LLB-MB@Fe3O4 for RhB and TH. Meanwhile, the intensity factors (nF) of LLB-MBand LLB-MB@Fe3O4 were 6.30 and 9.13 for RhB, and 3.27 and 4.01 for TH, respectively. In conclusion, it can be inferred that the adsorption processes of RhB and TH were not simple single-layer adsorption processes but were likely to accumulate in heterogeneous multilayer adsorption [44,45,46].
2.3.3. Adsorption Thermodynamics
Temperature was one of the most important factors affecting adsorption, which usually affected the adsorption process by influencing the thermal motion of molecules and promoting or inhibiting the formation of chemical bonds [47]. The effects of different temperatures (293, 298, 303, 308 K, and 313 K) on the adsorption of organic pollutants by LLB-MB and LLB-MB@Fe3O4 are shown in Figure 9. With the increase in temperature from 293 K to 313 K, the adsorption capacities were both increased. Obviously, the temperature increase promoted the adsorption process. That is, the influence of a high-temperature environment on the adsorption of organic pollutants (RhB and TH) by biochar adsorbents (LLB-MB and LLB-MB@Fe3O4) was favorable.
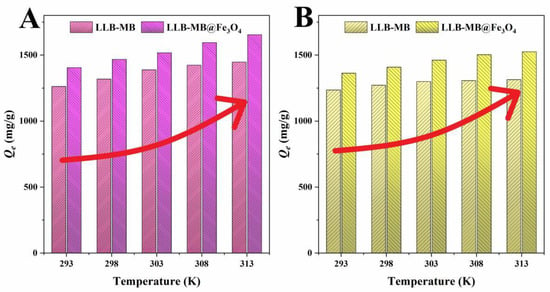
Figure 9.
Adsorption thermodynamics of (A) RhB and (B) TH for LLB-MB and LLB-MB@Fe3O4.
To further describe the effects of temperatures on the adsorption process, the data were analyzed by the thermodynamic parameters (Table 5). The thermodynamic equations are as follows:
where ΔS (J mol−1 K−1) and ΔG (kJ/mol) represent the thermodynamic parameters standard entropy and standard free Gibbs energy, while ΔH (kJ/mol) and R represent the standard enthalpy and the gas constant (8.314 J/K·mol), respectively.

Table 5.
Adsorption thermodynamic parameters for RhB and TH.
It was not difficult to find that if the adsorbent was LLB-MB or LLB-MB@Fe3O4 and if the model pollutant was RhB or TH, the adsorption process was spontaneous, because all the ΔG values were negative [48]. The thermodynamic enthalpy (ΔH) values for the LLB-MB and LLB-MB@Fe3O4 adsorption were 16.23 and 26.98 kJ/mol for RhB and were 6.47 and 15.45 kJ/mol for TH, which further confirmed the endothermic property of the adsorption process. At the same time, the absolute values of the enthalpy change of all adsorbents were greater than 4.2 kJ/mol, in the range of 6.78−10.07 kJ/mol, which further indicated the existence of chemisorption in the adsorption process [49]. The ΔS values of adsorption were all positive, which indicated that the randomness and chaos degree of the interface between hierarchical porous biochars and solutions increased with the increasing temperatures [32,33,50].
2.3.4. Effect of pH
The pH value of the solution environment was an important factor affecting the adsorption process by affecting the surface properties of the adsorbents and the chemical properties of the adsorbed pollutant molecules to promote or inhibit the adsorption capacities [32,33]. The effect of pH on the adsorbents’ (LLB-MB and LLB-MB@Fe3O4) abilities to remove organic pollutants was studied in the pH range from 2 to 10, and the results are shown in Figure 10. With increases in the initial pH values, the adsorption capacities of LLB-MB and LLB-MB@Fe3O4 for RhB increased and then stabilized, while the TH removal capacities increased and then decreased. This phenomenon can be explained by the fact that RhB is a cationic dye, and the presence of a large amount of H+ in the solution at a lower pH value will compete with RhB for adsorption sites on the surfaces of biochars [27,28]. In addition, when the pH value of a solution is less than the pHpzc of biochars (LLB-MB = 4.22 and LLB-MB@Fe3O4 = 4.45), the surfaces of biochars were positively charged and had electrostatic repulsion to RhB. With increases in pH, especially while the pH was greater than pHpzc, the surfaces of biochars started to become negatively charged, and the electrostatic attraction between the biochar and the cationic dye promoted the adsorption process. However, the enhancement of the RhB adsorption capacity by higher pH was not endless. When the pH value was greater than 6, increasing the pH value did not continue to significantly improve the RhB removal abilities of biochars, which indicated that electrostatic attraction was not the only force affecting the adsorption of cationic dye by biochars. For the adsorption of TH by biochars, pH had a more obvious influence, probably because it not only affected the surface electrochemical performance of biochars but also had great influences on the adsorbed molecular properties of TH. That is, TH existed in different forms (TH+, TH0, TH−, and TH2−) under different pH values [34,51]. When the pH value was lower than 3.30, TH+ was dominant and the zeta potential of biochars was positive. At this time, the mutually repulsive electrostatic attraction inhibited the adsorption processes. When the pH was higher than 3.30 and lower than 7.68, TH existed in the form of TH0 or TH+−. When the pH was greater than 7.68 and less than 9.68, TH existed in the form of TH−. Further, when the pH was greater than 9.68, TH was dominated by TH2−, which was not conducive to the adsorption of biochars with negative charges.
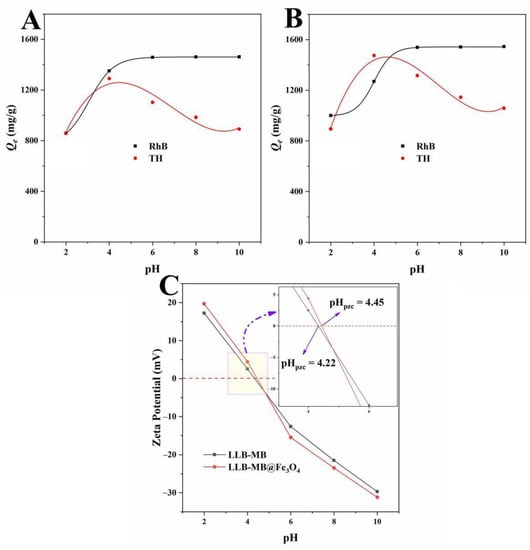
Figure 10.
Effects of pH on the adsorption capacities of (A) LLB and (B) LLB-MB@Fe3O4. (C) Zeta potentials of LLB and LLB-MB@Fe3O4.
2.3.5. Results of Cycle Tests
The regeneration capacities of adsorbents were one of the most important parameters to evaluate the practical performance of biochar adsorbents [34,51]. Through the cycle tests, the cycling abilities of biochars to remove organic pollutants over ten cycles was tested, and the results are shown in Figure 11. By increasing of the number of cycles, the removal abilities of LLB-MB and LLB-MB@Fe3O4 decreased significantly. Although their removal efficiencies were significantly reduced, this reduction is inevitable for most lignocellulosic biochar. This may be caused by two reasons. On one hand, with the increase in cycles, the organic pollutants adsorbed by biochars form by-products on their surfaces in the process of re-carbonization, which may lead to a reduction in adsorption sites [28,51]. On the other hand, with increasing re-carbonization times the porous structures and surfaces of biochars become more fragile, which further affects the adsorption performance [39]. After 10 cycles, the RhB and TH removal efficiencies of LLB-MB were 50.1% and 51.3%, and the RhB and TH removal efficiencies of LLB-MB@Fe3O4 were 70.4% and 72.3%. Compared with LLB-MB, the cycle stability of LLB-MB@Fe3O4 was significantly higher. It can be speculated that the presence of magnetic nanoparticles may give the structure of LLB-MB@Fe3O4 higher mechanical strength than LLB-MB [39], either during adsorption or during re-carbonization.
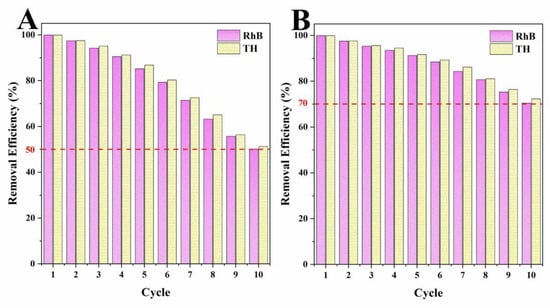
Figure 11.
Cycle tests of (A) LLB-MB and (B) LLB-MB@Fe3O4.
2.4. Probable Adsorption Mechanisms
In this study, the large specific surface area and high total pore volume (2565.4 m2/g and 1.4643 cm3/g) of LLB-MB@Fe3O4 provided a large number of adsorption sites. Therefore, pore filling might exist and may have played an important role during the adsorption processes of efficient organic pollutant removal. In addition, there was a large number of unsaturated functional groups containing carbon, oxygen, and nitrogen on the surface of LLB-MB@Fe3O4, according to the results of the FT-IR and XPS tests. These functional bonds were likely to form hydrogen bonds between LLB-MB@Fe3O4 and RhB and TH molecules, which also could improve the removal ability. In addition, aromatic rings exist in LLB-MB@Fe3O4, which may also have π–π interactions with aromatic rings in RhB and TH to enhance the adsorption capacity. Finally, in the appropriate pH environment, there was a strong electrostatic attraction between LLB-MB@Fe3O4 and RhB and TH, which further promoted the adsorption process. According to some reported studies, magnetic nanoparticles may also exchange electrons with pollutant molecules to promote the chemisorption process. However, based on the above data in this work, the existence of this force was not confirmed, and we will focus on it in subsequent research. Thus, it can be speculated that LLB-MB@Fe3O4 exhibited a powerful ability for efficient organic pollutant (RhB and TH) removal in water under the joint action of pore filling, π–π interactions, H-bond interactions, and electrostatic attraction (Figure 12).
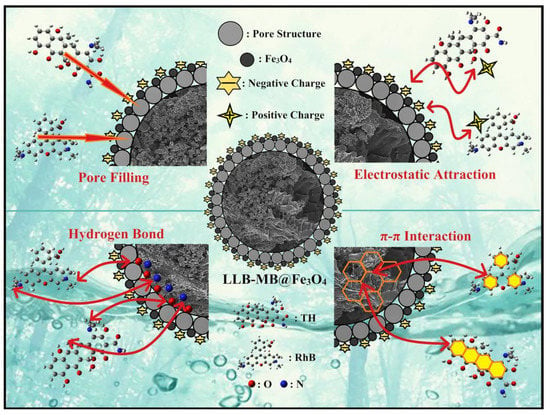
Figure 12.
Probable adsorption mechanisms of LLB-MB@Fe3O4 for organic pollutant removal.
2.5. Comparison
The adsorption capacity was one of the most important parameters to evaluate the actual performance of the adsorbents. Therefore, the adsorption capacities of biochars were compared with those of other carbon-based adsorbents, including our previous reported results, and the results are shown in Table 6. It can be seen that LLB-MB and LLB-MB@Fe3O4 had some of the highest adsorption capacities among the carbon-based adsorbents, which fully indicated that the prepared biochars have great potential in wastewater treatment and can be used for efficient organic pollutant removal.

Table 6.
Comparison of biochars with other carbon-based adsorbents.
3. Materials and Methods
3.1. Materials and Reagents
In 2022, Luffa leaf (LL) was obtained from the experimental area of Jilin Agricultural University (Changchun, China), washed, dried, and crushed. NaOH, HCl, KOH, FeSO4, and FeCl3 were purchased from Beijing Chemical Works (Beijing, China) and used without further purification. RhB (CAS: 81-88-9, ≥95%) and TH (CAS: 64-75-5, 96%) were supplied by Aladdin Chemical (Shanghai) Co., Ltd. (Shanghai, China), and the structural formulas are shown in Figure S1 (Supplementary Material).
3.2. Preparation of LLBs
The obtained LL was carbonized at 500 °C for 60 min with a heating rate of 10 °C/min under the protection of nitrogen atmosphere. After the carbonized LL (CLL) cooled to room temperature, the CLL was mixed with a NaOH, KOH, or MB activator at a ratio of 4:1 and heated at 700 °C for 60 min. Then, the activated mixture was washed with HCl and deionized water until reaching a neutral pH. Afterwards, the biochars were dried and kept in a desiccator. The abbreviations LLB-K, LLB-Na, and LLB-MB represent the LL-based biochars activated by using KOH, NaOH, and MB as activators, respectively.
3.3. Preparation of Magnetic Biochar
First, 1.0 g of biochar was added to a flask containing 50 mL of Fe2+ (5 mM) and Fe3+ (10 mM) under N2 protection. The reaction system was placed in an 80 °C ultrasonic oscillator. After mixing evenly, a 0.1 M NaOH solution was added to adjust the solution’s pH to 10.0 and hold for 30 min. After the mixture cooled to room temperature, the composite sample was recovered with a magnet, washed with deionized water to neutral, and dried in vacuum to a constant weight.
3.4. Adsorption Performances
In a batch adsorption experiment, 0.10 g/L of adsorbents were added to a flask containing organic pollutant solutions (RhB or TH). The flask was placed in a constant-temperature shaker at 150.0 RPM in the dark. After the adsorption process reached equilibrium, the suspension was centrifuged and diluted with the supernatant. The concentration of the solution was determined with an Agilent Cary-300 UV-vis spectrophotometer. The adsorption capacities of the samples were calculated with Equation (9):
where Qe (mg/g), Ce (mg/L), C0 (mg/L), M (g), and V (L) represent the adsorption capacity of the adsorbent, the equilibrium concentration of the solution, the initial concentration of the solution, the mass of the adsorbent, and the volume of the solution, respectively.
The organic pollutant solutions were prepared at different concentrations (100, 200, and 300 mg/L), and 0.1 g/L of adsorbents were dispersed into flasks containing RhB or TH solutions at 303 K. Then, the concentrations of the solutions were determined at preset time intervals.
The organic pollutant solutions at different initial concentrations (100, 150, 200, 250, and 300 mg/L) were prepared and used to test the adsorption isotherm at 303 K. After adsorption saturation, the absorbances of the solutions were measured.
The effects of temperatures (293, 298, 303, 308, and 313 K) on the adsorption capacity of the RhB and TH were investigated with the initial concentration of 200 mg/L with 0.1 g/L of adsorbents.
The variation in the adsorption capacities of the adsorbents with pH (2, 4, 6, 8, and 10) was also investigated. The solutions were adjusted with 0.1 M HCl and NaOH solutions.
3.5. Cycling Stability Studies
In each cycle, 1.0 g/L of adsorbents were placed into a flask containing 100 mg/L of organic pollutants. After adsorption, the recycled adsorbents were washed and re-carbonized at 500 °C under the protection of nitrogen atmosphere for 60 min. Then, the re-carbonized adsorbents were re-used as new adsorbents in the next cycle test.
3.6. Characterization Methods
Scanning electron microscopy (SEM, Hitachi S4800, Hitachi, Japan) and transmission electron microscope (TEM, FEI Tecnai G2 S-Twin F20, Hillsboro, USA) were used to examine the morphology of the materials. A thermogravimetric analysis of the samples was carried out under the protection of nitrogen flow (TGA, Netzsch STA409PC, Selb, Germany). An FT-IR spectrometer was used to characterize the surface functional groups of the materials between 400 and 4000 cm−1 at a resolution of 1 cm−1 (FT-IR, Thermo Fisher Nicolet iS50, Waltham, MA, USA). The X-ray diffraction patterns of the powders were observed by an X-ray diffractometer with a filtered Cu-Ka X-ray source (XRD, Bruker D8 Advance, Bremen, Germany). The Raman spectra of the samples were obtained using a Renishaw 2000 model Raman spectrometer with a laser power of 100 mW and a 20 s exposure time at 514 nm to investigate the presence of defects in the biochar materials. X-ray photoelectron spectroscopy was used to test the electronic binding energies of the samples (XPS, Thermo Escalab 250Xi+, USA). A zeta potential instrument was used to characterize the surface charges of the samples (zeta potential, Zetasizer Nano ZS90, Malvern, UK). N2 adsorption–desorption isotherms were used to obtain the porosities of the samples at 77 K (N2 adsorption–desorption isotherms, Quantachrome Autosorb iQ2, Boynton Beach, USA). The Brunauer–Emmett–Teller (BET) theory was used to calculate the surface area. The non-local density functional theory (NLDFT) and the Barrett–Joyner–Halenda (BJH) model were used to analyze the pore size distribution of the samples.
4. Conclusions
In this study, LL was used as a biomass carbon source to prepare magnetic lignocellulose-derived hierarchical porous biochar via carbonization, activation, and chemical co-precipitation methods. The specific surface area and total pore volume were 2565.4 m2/g and 1.4643 cm3/g, and the surface was rich in carbon and oxygen functional groups. The synthetic dye RhB and the antibiotic TH were selected as organic pollutant models to explore the abilities for the removal of organic pollutants, and the results showed good adsorption performances. The maximum adsorption capacities were 1701.7 mg/g for RhB and 1755.9 mg/g for TH, which were higher than most carbon-based adsorbents. After 10 cycles of use, the removal efficiencies were still maintained at more than 70%, showing good stability. Finally, the probable mechanisms affecting the adsorption process were studied, which may include pore filling, π–π interactions, hydrogen bond interactions, and electrostatic attraction. This work not only verified the feasibility of LL as a carbon source for lignocellulose but also prepared a magnetic hierarchical porous biochar with good performances that can better treat RhB and TH, which provided a new idea and direction for the efficient removal of organic pollutants in water.
Supplementary Materials
The supporting information can be downloaded at: https://www.mdpi.com/article/10.3390/ijms232415703/s1.
Author Contributions
Conceptualization, S.C.; Data curation, Y.Z.; Funding acquisition, Y.S.; Investigation, Y.S. and M.F.; Methodology, M.F.; Supervision, S.C.; Validation, M.F.; Visualization, Y.Z.; Writing—original draft, Y.S.; Writing—review & editing, S.C. All authors have read and agreed to the published version of the manuscript.
Funding
This research was funded by [Jilin Scientific and Technological Development Program] grant number [20220203108SF] And The APC was funded by [20220203108SF].
Institutional Review Board Statement
Not applicable.
Informed Consent Statement
Not applicable.
Data Availability Statement
Not applicable.
Acknowledgments
We are thankful for the support of the Jilin Scientific and Technological Development Program (20220203108SF). This research was also supported by the National College Students Innovation and Entrepreneurship Project in China.
Conflicts of Interest
The authors declare no conflict of interest.
References
- Jiang, T.; Wang, B.; Gao, B.; Cheng, N.; Feng, Q.; Chen, M.; Wang, S. Degradation of organic pollutants from water by biochar-assisted advanced oxidation processes: Mechanisms and applications. J. Hazard. Mater. 2023, 442, 130075. [Google Scholar] [CrossRef] [PubMed]
- Dapaah, M.F.; Niu, Q.; Yu, Y.; You, T.; Liu, B.; Cheng, L. Efficient persistent organic pollutant removal in water using MIL-metal–organic framework driven Fenton-like reactions: A critical review. Chem. Eng. J. 2022, 431, 134182. [Google Scholar] [CrossRef]
- Christensen, E.R.; Wang, Y.; Huo, J.; Li, A. Properties and fate and transport of persistent and mobile polar organic water pollutants: A review. J. Environ. Chem. Eng. 2022, 10, 107201. [Google Scholar] [CrossRef]
- Naghdi, S.; Shahrestani, M.M.; Zendehbad, M.; Djahaniani, H.; Kazemian, H.; Eder, D. Recent advances in application of metal-organic frameworks (MOFs) as adsorbent and catalyst in removal of persistent organic pollutants (POPs). J. Hazard. Mater. 2023, 442, 130127. [Google Scholar] [CrossRef] [PubMed]
- Du, C.; Zhang, Y.; Zhang, Z.; Zhou, L.; Yu, G.; Wen, X.; Chi, T.; Wang, G.; Su, Y.; Deng, F.; et al. Fe-based metal organic frameworks (Fe-MOFs) for organic pollutants removal via photo-Fenton: A review. Chem. Eng. J. 2022, 431, 133932. [Google Scholar] [CrossRef]
- Liu, X.; Lu, J.; Fang, X.; Zhou, J.; Chen, Q. Complexation modelling and oxidation mechanism of organic pollutants in cotton pulp black liquor during iron salt precipitation and electrochemical treatment. Chemosphere 2022, 308, 136374. [Google Scholar] [CrossRef]
- Tian, L.; Zhu, M.; Zhang, L.; Zhou, L.; Fan, J.; Wu, D.; Zou, J. New insights on the role of NaCl electrolyte for degradation of organic pollutants in the system of electrocatalysis coupled with advanced oxidation processes. J. Environ. Chem. Eng. 2022, 10, 107414. [Google Scholar] [CrossRef]
- Idris, M.O.; Kim, H.; Yaqoob, A.A.; Ibrahim, M.N.M. Exploring the effectiveness of microbial fuel cell for the degradation of organic pollutants coupled with bio-energy generation. Sustain. Energy Technol. Assess. 2022, 52, 102183. [Google Scholar] [CrossRef]
- Zaidi, N.A.H.M.; Lim, L.B.L.; Usman, A.; Kooh, M.R.R. Efficient adsorption of malachite green dye using Artocarpus odoratissimus leaves with artificial neural network modelling. Desalination Water Treat. 2018, 101, 313–324. [Google Scholar] [CrossRef]
- Kooh, M.R.R.; Thotagamuge, R.; Chau, Y.C.; Mahadi, A.H.; Lim, C.M. Machine learning approaches to predict adsorption capacity of Azolla pinnata in the removal of methylene blue. J. Taiwan Inst. Chem. E. 2022, 132, 104134. [Google Scholar] [CrossRef]
- Liu, L.; Kong, G.; Zhu, Y.; Lai, D.; Zhang, S.; Che, C. Ultralight, compressive and superhydrophobic methyltriethoxysilane-modified graphene aerogels for recyclable and selective organic pollutants adsorption from water. Appl. Surf. Sci. 2022, 598, 153694. [Google Scholar] [CrossRef]
- Buffa, A.; Mandler, D. Adsorption and detection of organic pollutants by fixed bed carbon nanotube electrochemical membrane. Chem. Eng. J. 2019, 359, 130–137. [Google Scholar] [CrossRef]
- Hu, X.; Zou, C.; Zou, X. The formation of supramolecular carbon nanofiber via amidation reaction on the surface of amino single walled carbon nanotubes for selective adsorption organic pollutants. J. Colloid. Interface Sci. 2019, 542, 112–122. [Google Scholar] [CrossRef] [PubMed]
- Zeghioud, H.; Fryda, L.; Djelal, H.; Assadi, A.; Kane, A. A comprehensive review of biochar in removal of organic pollutants from wastewater: Characterization, toxicity, activation/functionalization and influencing treatment factors. J. Water Process Eng. 2022, 47, 102801. [Google Scholar] [CrossRef]
- Qiu, B.; Shao, Q.; Shi, J.; Yang, C.; Chu, H. Application of biochar for the adsorption of organic pollutants from wastewater: Modification strategies, mechanisms and challenges. Sep. Purif. Technol. 2022, 300, 121925. [Google Scholar] [CrossRef]
- Shao, F.; Xu, J.; Kang, X.; Hu, Z.; Shao, Y.; Lu, C.; Zhao, C.; Ren, Y.; Zhang, J. An attempt to enhance the adsorption capacity of biochar for organic pollutants-Characteristics of CaCl2 biochar under multiple design conditions. Sci. Total Environ. 2023, 854, 158675. [Google Scholar] [CrossRef]
- Guo, J.; Xu, J.; Liu, X.; Dai, L.; Zhang, C.; Xiao, X.; Huo, K. Enabling dual valorization of lignocellulose by fluorescent lignin carbon dots and biochar-supported persulfate activation: Towards waste-treats-pollutant. J. Hazard. Mater. 2022, 435, 129072. [Google Scholar] [CrossRef]
- Zhang, J.; Koubaa, A.; Xing, D.; Wang, H.; Wang, Y.; Liu, W.; Zhang, Z.; Wang, X.; Wang, Q. Conversion of lignocellulose into biochar and furfural through boron complexation and esterification reactions. Bioresour. Technol. 2020, 312, 123586. [Google Scholar] [CrossRef]
- Jin, Y.; Zhang, B.; Chen, G.; Chen, H.; Tang, S. Combining biological and chemical methods to disassemble of cellulose from corn straw for the preparation of porous carbons with enhanced adsorption performance. Int. J. Biol. Macromol. 2022, 209, 315–329. [Google Scholar] [CrossRef]
- Chen, S.; Xia, Y.; Zhang, B.; Chen, H.; Chen, G.; Tang, S. Disassembly of lignocellulose into cellulose, hemicellulose, and lignin for preparation of porous carbon materials with enhanced performances. J. Hazard. Mater. 2021, 408, 124956. [Google Scholar] [CrossRef]
- Shao, L.; Chen, H.; Li, Y.; Li, J.; Chen, G.; Wang, G. Pretreatment of corn stover via sodium hydroxide–urea solutions to improve the glucose yield. Bioresour. Technol. 2020, 307, 123191. [Google Scholar] [CrossRef]
- Xue, D.; Wang, J.; Yao, S. High production of β-glucosidase from a marine Aspergillus niger immobilized on towel gourd vegetable sponges. Chinese Chem. Lett. 2015, 26, 1011–1015. [Google Scholar] [CrossRef]
- Anbumani, D.; Dhandapani, K.; Manoharan, J.; Babujanarthanam, R.; Bashir, A.K.H.; Muthusamy, K.; Alfarhan, A.; Kanimozhi, K. Green synthesis and antimicrobial efficacy of titanium dioxide nanoparticles using Luffa acutangula leaf extract. J. King Saud Univ. Sci. 2022, 34, 101896. [Google Scholar] [CrossRef]
- Vanajothi, R.; Sudha, A.; Manikandan, R.; Rameshthangam, P.; Srinivasan, P. Luffa acutangula and Lippia nodiflora leaf extract induces growth inhibitory effect through induction of apoptosis on human lung cancer cell line. Biomed. Prev. Nutr. 2012, 2, 287–293. [Google Scholar] [CrossRef]
- Xu, S.; Qiang, Y.; Fu, A.; Tan, B. Luffa cylindrica roem leaves extract as the environment-friendly inhibitor for copper in sulfuric acid environment. J. Mol. Liq. 2021, 343, 117619. [Google Scholar] [CrossRef]
- Chen, S.; Chen, G.; Chen, H.; Sun, Y.; Yu, X.; Su, Y.; Tang, S. Preparation of porous carbon-based material from corn straw via mixed alkali and its application for removal of dye. Colloid. Surfaces A 2019, 568, 173–183. [Google Scholar] [CrossRef]
- Chen, S.; Zhang, B.; Xia, Y.; Chen, H.; Chen, G.; Tang, S. Influence of mixed alkali on the preparation of edible fungus substrate porous carbon material and its application for the removal of dye. Colloid. Surfaces A 2021, 609, 125675. [Google Scholar] [CrossRef]
- Chen, X.; Yu, G.; Chen, Y.; Tang, S.; Su, Y. Cow dung-based biochar materials prepared via mixed base and its application in the removal of organic pollutants. Int. J. Mol. Sci. 2022, 23, 10094. [Google Scholar] [CrossRef]
- Eskandari, M.J.; Hasanzadeh, I. Size-controlled synthesis of Fe3O4 magnetic nanoparticles via an alternating magnetic field and ultrasonic-assisted chemical co-precipitation. Mater. Sci. Eng. B 2021, 266, 115050. [Google Scholar] [CrossRef]
- Jesus, A.C.B.; Jesus, J.R.; Lima, R.J.S.; Moura, K.O.; Almeida, J.M.A.; Duque, J.G.S.; Meneses, C.T. Synthesis and magnetic interaction on concentrated Fe3O4 nanoparticles obtained by the co-precipitation and hydrothermal chemical methods. Ceram. Int. 2020, 46, 11149–11153. [Google Scholar] [CrossRef]
- Wu, S.; Sun, A.; Zhai, F.; Wang, J.; Xu, W.; Zhang, Q.; Volinsky, A.A. Fe3O4 magnetic nanoparticles synthesis from tailings by ultrasonic chemical co-precipitation. Mater. Lett. 2011, 65, 1882–1884. [Google Scholar] [CrossRef]
- Zhang, B.; Jin, Y.; Qi, J.; Chen, H.; Chen, G.; Tang, S. Porous carbon materials based on Physalis alkekengi L. husk and its application for removal of malachite green. Environ. Technol. Innov. 2021, 21, 101343. [Google Scholar] [CrossRef]
- Xia, Y.; Jin, Y.; Qi, J.; Chen, H.; Chen, G.; Tang, S. Preparation of biomass carbon material based on Fomes fomentarius via alkali activation and its application for the removal of brilliant green in wastewater. Environ. Technol. Innov. 2021, 23, 101659. [Google Scholar] [CrossRef]
- Xia, Y.; Zhang, B.; Guo, Z.; Tang, S.; Su, Y.; Yu, X.; Chen, S.; Chen, G. Fungal mycelium modified hierarchical porous carbon with enhanced performance and its application for removal of organic pollutants. J. Environ. Chem. Eng. 2022, 10, 108699. [Google Scholar] [CrossRef]
- Lu, L.; Li, J.; Ng, D.H.L.; Yang, P.; Song, P.; Zuo, M. Synthesis of novel hierarchically porous Fe3O4@MgAl–LDH magnetic microspheres and its superb adsorption properties of dye from water. J. Ind. Eng. Chem. 2017, 46, 315–323. [Google Scholar] [CrossRef]
- Liu, H.; Ren, X.; Chen, L. Synthesis and characterization of magnetic metal–organic framework for the adsorptive removal of rhodamine B from aqueous solution. J. Ind. Eng. Chem. 2016, 34, 278–285. [Google Scholar] [CrossRef]
- Amaral, M.M.; Yukuhiro, V.Y.; Vicentini, R.; Peterlevitz, A.C.; Silva, L.M.D.; Fernandez, P.; Zanin, H. Direct observation of the CO2 formation and C–H consumption of carbon electrode in an aqueous neutral electrolyte supercapacitor by in-situ FTIR and Raman. J. Energy Chem. 2022, 71, 488–496. [Google Scholar] [CrossRef]
- Li, K.; Liu, Q.; Cheng, H.; Hu, M.; Zhang, S. Classification and carbon structural transformation from anthracite to natural coaly graphite by XRD, Raman spectroscopy, and HRTEM. Spectrochim. Acta A 2021, 249, 119286. [Google Scholar] [CrossRef]
- Chen, X.; Lin, J.; Su, Y.; Tang, S. One-step carbonization synthesis of magnetic biochar with 3D network structure and its application in organic pollutant control. Int. J. Mol. Sci. 2022, 23, 12579. [Google Scholar] [CrossRef]
- Chen, S.; Tang, S.; Sun, Y.; Wang, G.; Chen, H.; Yu, X.; Su, Y.; Chen, G. Preparation of a highly porous carbon material based on quinoa husk and its application for removal of dyes by adsorption. Materials 2018, 11, 1407. [Google Scholar] [CrossRef]
- Chen, S.; Wang, Z.; Xia, Y.; Zhang, B.; Chen, H.; Chen, G.; Tang, S. Porous carbon material derived from fungal hyphae and its application for the removal of dye. RSC Adv. 2019, 9, 25480. [Google Scholar] [CrossRef] [PubMed]
- Al-Maabreh, A.M.; Abuassaf, R.A.; Hmedat, D.A.; Alkhabbas, M.; Edris, G.; Hussein-Al-Ali, S.H.; Alawaideh, S. Adsorption characteristics of hair dyes removal from aqueous solution onto oak cupules powder coated with ZnO. Int. J. Mol. Sci. 2022, 23, 11959. [Google Scholar] [CrossRef] [PubMed]
- Tonk, S.; Rapo, E. Linear and nonlinear regression analysis for the adsorption of remazol dye by romanian brewery waste by-product, Saccharomyces cerevisiae. Int. J. Mol. Sci. 2022, 23, 11827. [Google Scholar] [CrossRef] [PubMed]
- Rodriguez-Lopez, M.I.; Pellicer, J.A.; Gomez-Morte, T.; Aunon, D.; Gomez-Lopez, V.M.; Yanez-Gascon, M.J.; Gil-Izquierdo, A.; Ceron-Carrasco, J.P.; Crini, G.; Nunez-Delicado, E.; et al. Removal of an azo dye from wastewater through the use of two technologies: Magnetic cyclodextrin polymers and pulsed light. Int. J. Mol. Sci. 2022, 23, 8406. [Google Scholar] [CrossRef] [PubMed]
- Liang, D.; Tian, X.; Zhang, Y.; Zhu, G.; Gao, Q.; Liu, J.; Yu, X. A weed-derived hierarchical porous carbon with a large specific surface area for efficient dye and antibiotic removal. Int. J. Mol. Sci. 2022, 23, 6146. [Google Scholar] [CrossRef]
- Cai, Z.; Liu, Q.; Li, H.; Wang, J.; Tai, G.; Wang, F.; Han, J.; Zhu, Y.; Wu, G. Waste-to-resource strategy to fabricate functionalized MOFs composite material based on Durian Shell biomass carbon fiber and Fe3O4 for highly efficient and recyclable dye adsorption. Int. J. Mol. Sci. 2022, 23, 5900. [Google Scholar] [CrossRef] [PubMed]
- Ali, N.S.; Jabbar, N.M.; Alardhi, S.M.; Majdi, H.S.; Albayati, T.M. Adsorption of methyl violet dye onto a prepared bio-adsorbent from date seeds: Isotherm, kinetics, and thermodynamic studies. Heliyon 2022, 8, e10276. [Google Scholar] [CrossRef]
- Saeed, T.; Naeem, A.; Din, I.U.; Farooq, M.; Khan, I.W.; Hamayun, M.; Malik, T. Synthesis of chitosan composite of metal-organic framework for the adsorption of dyes; kinetic and thermodynamic approach. J. Hazard. Mater. 2022, 427, 127902. [Google Scholar] [CrossRef]
- Koyuncu, D.D.E.; Okur, M. Removal of AV 90 dye using ordered mesoporous carbon materials prepared via nanocasting of KIT-6: Adsorption isotherms, kinetics and thermodynamic analysis. Sep. Purif. Technol. 2021, 257, 117657. [Google Scholar] [CrossRef]
- Kumbhar, P.; Narale, D.; Bhosale, R.; Jambhale, C.; Kim, J.; Kolekar, S. Synthesis of tea waste/Fe3O4 magnetic composite (TWMC) for efficient adsorption of crystal violet dye: Isotherm, kinetic and thermodynamic studies. J. Environ. Chem. Eng. 2022, 10, 107893. [Google Scholar] [CrossRef]
- Zhang, B.; Jin, Y.; Huang, X.; Tang, S.; Chen, H.; Su, Y.; Yu, X.; Chen, S.; Chen, G. Biological self-assembled hyphae/starch porous carbon composites for removal of organic pollutants from water. Chem. Eng. J. 2022, 450, 138264. [Google Scholar] [CrossRef]
- Wu, W.; Wu, C.; Zhang, G.; Liu, J.; Li, Y.; Li, G. Synthesis and characterization of magnetic K2CO3-activated carbon produced from bamboo shoot for the adsorption of Rhodamine b and CO2 capture. Fuel 2023, 332, 126107. [Google Scholar] [CrossRef]
- Tang, L.; Cai, Y.; Yang, G.; Liu, Y.; Zeng, G.; Zhou, Y.; Li, S.; Wang, J.; Zhang, S.; Fang, Y.; et al. Cobalt nanoparticles-embedded magnetic ordered mesoporous carbon for highly effective adsorption of rhodamine B. Appl. Surf. Sci. 2014, 314, 746–753. [Google Scholar] [CrossRef]
- Spessato, L.; Duarte, V.A.; Viero, P.; Zanella, H.; Fonseca, J.M.; Arroyo, P.A.; Almeida, V.C. Optimization of Sibipiruna activated carbon preparation by simplex-centroid mixture design for simultaneous adsorption of rhodamine B and metformin. J. Hazard. Mater. 2021, 411, 125166. [Google Scholar] [CrossRef]
- Xue, S.; Tan, J.; Ma, X.; Xu, Y.; Wan, R.; Tao, H. Boron-doped activated carbon derived from Zoysia sinica for Rhodamine B adsorption: The crucial roles of defect structures. FlatChem 2022, 34, 100390. [Google Scholar] [CrossRef]
- Xue, S.; Tu, B.; Li, Z.; Ma, X.; Xu, Y.; Li, M.; Fang, C.; Tao, H. Enhanced adsorption of Rhodamine B over Zoysia sinica Hance-based carbon activated by amminium chloride and sodium hydroxide treatments. Colloid. Surface A 2021, 618, 126489. [Google Scholar] [CrossRef]
- Yang, Z.; Zhao, Z.; Yang, X.; Ren, Z. Xanthate modified magnetic activated carbon for efficient removal of cationic dyes and tetracycline hydrochloride from aqueous solutions. Colloid. Surface A 2021, 615, 126273. [Google Scholar] [CrossRef]
- Xia, C.; Huang, H.; Liang, D.; Xie, Y.; Kong, F.; Yang, Q.; Fu, J.; Dou, Z.; Zhang, Q.; Meng, Z. Adsorption of tetracycline hydrochloride on layered double hydroxide loaded carbon nanotubes and site energy distribution analysis. Chem. Eng. J. 2022, 443, 136398. [Google Scholar] [CrossRef]
- Liu, D.; Gu, W.; Zhou, L.; Lei, J.; Wang, L.; Zhang, J.; Liu, Y. From biochar to functions: Lignin induced formation of Fe3C in carbon/Fe composites for efficient adsorption of tetracycline from wastewater. Sep. Purif. Technol. 2023, 304, 122217. [Google Scholar] [CrossRef]
- Yang, G.; Gao, Q.; Yang, S.; Yin, S.; Cai, X.; Yu, X.; Zhang, S.; Fang, Y. Strong adsorption of tetracycline hydrochloride on magnetic carbon-coated cobalt oxide nanoparticles. Chemosphere 2020, 239, 124831. [Google Scholar] [CrossRef]
- Chen, Y.; Liu, J.; Zeng, Q.; Liang, Z.; Ye, X.; Lv, Y.; Liu, M. Preparation of Eucommia ulmoides lignin-based high-performance biochar containing sulfonic group: Synergistic pyrolysis mechanism and tetracycline hydrochloride adsorption. Bioresour. Technol. 2021, 329, 124856. [Google Scholar] [CrossRef] [PubMed]
Publisher’s Note: MDPI stays neutral with regard to jurisdictional claims in published maps and institutional affiliations. |
© 2022 by the authors. Licensee MDPI, Basel, Switzerland. This article is an open access article distributed under the terms and conditions of the Creative Commons Attribution (CC BY) license (https://creativecommons.org/licenses/by/4.0/).