Article

Enhanced Ca2+ Entry Sustains the Activation of Akt in Glucose Deprived SH-SY5Y Cells

1
Division of Animal and Human Physiology, Department of Biology, National and Kapodistrian University of Athens, Panepistimiopolis, 15784 Athens, Greece
2
Laboratory of Animal Physiology, Department of Biochemistry and Biotechnology, University of Thessaly, 41500 Larissa, Greece
*
Author to whom correspondence should be addressed.
These authors contributed equally to this work.
Int. J. Mol. Sci. 2022, 23(3), 1386; https://doi.org/10.3390/ijms23031386
Submission received: 31 December 2021 / Revised: 23 January 2022 / Accepted: 24 January 2022 / Published: 26 January 2022
(This article belongs to the Special Issue Molecular Signaling in Stroke)

Abstract

:
The two crucial cellular insults that take place during cerebral ischemia are the loss of oxygen and loss of glucose, which can both activate a cascade of events leading to neuronal death. In addition, the toxic overactivation of neuronal excitatory receptors, leading to Ca2+ overload, may contribute to ischemic neuronal injury. Brain ischemia can be simulated in vitro by oxygen/glucose deprivation, which can be reversible by the re-establishment of physiological conditions. Accordingly, we examined the effects of glucose deprivation on the PI3K/Akt survival signaling pathway and its crosstalk with HIF-1α and Ca2+ homeostasis in SH-SY5Y human neuroblastoma cells. It was found that glucose withdrawal decreased HIF-1α protein levels even in the presence of the ischemia-mimicking CoCl2. On the contrary, and despite neuronal death, we identified a strong activation of the master pro-survival kinase Akt, a finding that was also confirmed by the increased phosphorylation of GSK3, a direct target of p-Akt. Remarkably, the elevated Ca2+ influx recorded was found to promptly trigger the activation of Akt, while a re-addition of glucose resulted in rapid restoration of both Ca2+ entry and p-Akt levels, highlighting the plasticity of neurons to respond to ischemic challenges and the important role of glucose homeostasis for multiple neurological disorders.

Graphical Abstract

1. Introduction

Cerebral ischemia is a state of extreme metabolic stress occurring when the supply of oxygen and glucose is interrupted in a part of the brain, mainly due to the blockade of a cerebral artery [1]. Neuronal damage and ultimately death may result from the activation of signaling cascade pathways that are not yet fully understood [2,3]. To reduce damage from toxic insults, such as glutamate excitotoxicity and oxidative stress, neuronal cells have to deploy a set of molecular mechanisms allowing adaptation, if not restoration.
The heterodimeric hypoxia-inducible factor (HIF) is a transcription factor that is predominantly connected to the hypoxic status of cells and tissues mainly through its subunit HIF-1α [4], which includes one oxygen-dependent degradation domain that affects its stability [5]. In normoxic conditions, HIF-1α is ubiquitinated and degraded by the proteasome [5]. However, when intracellular oxygen levels are reduced, either in vivo or in vitro [6], or in the presence of various growth factors, oncogenes and cobalt chloride [7], the levels of HIF-1α are increased and HIF-1α translocates to the nucleus. There, it heterodimerizes with the constantly expressed HIF-1β subunit forming HIF-1 [5]. Extensive research has shown that HIF-1 regulates the transcription of at least 180 genes containing the 5′-(A/G)CGTG-3′motif, known as hypoxia-responsive element [5,8,9]. The vast majority of these genes are related to erythropoiesis, vascular reconstruction, metabolism, and cell survival [9,10]. Increased levels of both HIF-1 and its subunit HIF-1α are associated with the survival of cancer cells residing in the center of large and solid tumors, where they experience hypoxic or even anoxic conditions [5,11]. There, the reduced levels of oxygen results in the upregulation of HIF-1, and subsequently HIF-1α levels, which is responsible for the switch of cells metabolism from oxidative phosphorylation to anaerobic glycolysis and increase in glucose uptake [4,12]. Therefore, HIF-1 protects cells from any hypoxic-related impairments and helps them to adapt and survive in the hypoxic/ischemic environment [4,6].
One of the most prominent pro-survival signaling pathways is PI3K/Akt. Akt, a serine/threonine-specific protein kinase associated with the plasma membrane, is induced by the activation of phosphatidylinositol 3-kinase (PI3K), following stimulation of growth factor receptors with tyrosine kinase activity or G-protein-coupled receptors [13,14]. Once activated by phosphorylation, Akt translocates to the cytosol where it interacts with a plethora of substrates. The PI3K/Akt pathway is considered to mediate survival signals also in a wide range of neuronal cell types [15,16], while in one case, prolonged glucose deprivation induces Akt phosphorylation at Thr308 and the activation of its downstream targets, conferring cell survival under metabolic stress [17]. Inhibition of p-Akt in hypoxic-ischemic cortical neurons has a negative regulatory effect on HIF1-α, a key component of cellular response to brain ischemia [18]. As mentioned previously, HIF-1 is forcefully regulated by cellular oxygen availability [19,20]. However, in addition to oxygen, glucose also seems to have a modulating impact on HIF1-α levels, as reduced glucose availability results in decreased HIF-1α protein levels and expression of HIF1-dependent genes [21,22].
Recent studies suggest that the PI3K/Akt signaling pathway also possesses a primary role in intracellular Ca2+ homeostasis [23] and contributes to ischemic tolerance to sublethal oxygen and glucose deprivation in cortical neurons [24]. Ca2+ is a universal multifaceted second messenger able to encode cellular responses to a wide variety of external stimuli, thus playing a crucial role in neuronal signal transduction, regulation of neuronal excitability, and many cellular functions, such as gene transcription and cell proliferation [25,26]. Disturbances in neuronal Ca2+ homeostasis have been implicated in a variety of neuropathological conditions, including ischemia. In vitro ischemia, modeled by oxygen and glucose deprivation (OGD) in cultured neuronal cells, triggers cytosolic Ca2+ overload either due to Ca2+ influx through the plasma membrane, or by depletion of the intracellular Ca2+ stores. Particularly, the endoplasmic reticulum (ER) function has been shown to be disturbed during OGD conditions, whereas the dysfunction of SERCA, an ER-residing Ca2+ pump, represents an important mediator for ischemic Ca2+ overload and toxicity in various neuronal cell types, including cultured hippocampal neurons [27], isolated CA1 neurons [28], rat sensory neurons [29], and SH-SY5Y human neuroblastoma cells [30].
Herein, we discuss the involvement of PI3K/Akt during transient and prolonged ischemia, as well as during the restoration of glucose concentration in the human neuroblastoma cell line (SH-SY5Y) together with its crosstalk with HIF-1α and Ca2+. In addition to ER Ca2+ depletion, we show that glucose deprivation stimulates Ca2+ influx, which leads to a direct activation of Akt.

2. Results

Both glucose deprivation and oxygen withdrawal can affect cell function and fate. To assess their different impacts, we exposed SH-SY5Y cells to a glucose-free culture medium or the hypoxia-mimicking agent CoCl2.

2.1. Effect of Glucose Deprivation on p-Akt, p-GSK3α/β and HIF-1α Protein Levels

First, we examined the activation of the pro-survival signaling molecules Akt and GSK3α/β and the levels of HIF-1α, in SH-SY5Y cells exposed to increasing concentrations of glucose (0–2 mg/mL) for 24 h. Our results showed that activation of Akt is dose-dependent with low concentrations of glucose, and more specifically glucose deprivation (0 and 0.5 mg/mL) resulting in the highest induction of p-Akt levels, despite cell death (Figure 1A,B and Figure S1A). This effect was validated by the phosphorylation pattern of GSK3α/β, the downstream target of p-Akt, which was similarly influenced. In contrast, HIF-1α protein levels were reversely affected as glucose deprivation (0 and 0.5 mg/mL of glucose) led to a statistically significant decrease in HIF-1α levels compared to the control (2 mg/mL glucose), while higher concentrations resulted in an increase in the respective protein levels, reaching a peak at 1.5 mg/mL of glucose (Figure 1A,B). These results indicate that glucose deprivation has opposite effects on HIF-1α and p-Akt levels.
We further confirmed our findings by testing glucose deprivation effects in a time-dependent manner. In these experiments, p-Akt levels were immediately increased after the onset of glucose deprivation (glucose-free medium), reaching an almost 2.5-fold increase (Figure 1C,D). Similarly, GSK3α/β phosphorylation levels displayed the same pattern, although to a lesser extent. On the contrary, HIF-1α protein levels rapidly diminished after only 0.5 h of glucose deprivation and remained low throughout the 24 h incubation period.

2.2. Hypoxic Conditions Induced by CoCl2 Increases p-Akt, p-GSK3α/β and HIF-1a Protein Levels

Ischemia is characterized by the obtrusion of not only glucose availability, but also oxygen delivery, more commonly known as hypoxia. Here, we examined the responses of Akt, GSK3α/β, and HIF-1α by exposing the cells to CoCl2, a long-established artificial, hypoxia-mimicking agent.
Our results clearly illustrate that increasing concentrations of CoCl2 (from 50 up to 400 μM) resulted in a significant induction of Akt and GSK3α/β phosphorylation in the span of 24 h (Figure 2A,B). As expected, HIF-1α levels already increased in the presence of only 50 μΜ CoCl2.
We further confirmed our findings in time-course responses and in the presence of 400 μM CoCl2. As shown in Figure 2C,D, p-Akt and p-GSK3α/β levels gradually rose after exposure of cells to CoCl2 for longer incubation periods (0.5, 2, 8, and 24 h). Moreover, HIF-1α levels were found to be drastically increased by four-fold compared to control conditions (0 h) already in 0.5 h of incubation with CoCl2, and gradually peaked at 24 h.
So far, our results indicate that glucose deprivation has a strong and opposite impact on Akt phosphorylation and HIF-1α, while hypoxia influences mostly HIF-1α levels. However, since CoCl2 also causes a moderate increase in p-Akt levels, it could be assumed that these two proteins may be associated. It is already known that Akt and HIF-1α crosstalk, especially in cancer, resulting in combined or enhanced effects [31,32]. To attest to this crosstalk, cells were pre-treated for 30 min with 100 nM wortmannin, a PI3K/Akt-specific inhibitor, and subsequently incubated in a complete medium containing 400 μM CoCl2 or in a medium without glucose (0 mg/mL) for 4 h. CoCl2 and glucose deprivation elicited the expected effects on p-Akt and HIF-1α levels, while wortmannin almost completely inhibited Akt phosphorylation (Figure S2A). In addition, PI3K/Akt inhibition mitigated the response of all three proteins studied under hypoxia and glucose deprivation conditions, indicating a correlation of Akt phosphorylation and HIF-1α protein levels.
Next, to investigate whether glucose deprivation leads to HIF-1α proteasome degradation, cells were treated with 10 μM MG132, a proteasome specific inhibitor, for 4 h. No significant changes in HIF-1α levels were detected after pre-treatment with MG132, either in the presence or absence of glucose (Figure S2B). Therefore, we conclude that the observed fluctuations in HIF-1α levels were not due to proteasome-mediated degradation.

2.3. Combined Effect of CoCl2 and Glucose Deprivation on p-Akt, and HIF-1a Protein Levels

For better simulation of ischemic conditions, cells were cultured in a glucose-free medium (containing 10% FBS) supplemented with 400 μΜ CoCl2 or 1 mg/mL glucose for short (2, 4 h) and long (24 h) incubation periods. Interestingly, the combined action of CoCl2 and glucose deprivation also caused the activation of Akt (Figure 3). This result verifies the unexpected increase in Akt phosphorylation observed in each condition alone (and glucose deprivation).
Additionally, glucose deprivation attenuated HIF-1α levels in all incubation periods examined, even in the presence of CoCl2. Of note, the effect of glucose withdrawal was more pronounced during short-term treatments.

2.4. Re-Administration of Glucose Restores p-Akt Levels

Subsequently, we examined whether glucose re-addition in the culture medium could reverse the activation of Akt. To accomplish this, the conditioned medium (cM) from SH-SY5Y cells was collected when the cells were at 70–80% confluency and was added to SH-SY5Y cells that were glucose deprived for 30 min. The duration of the cM incubation period combined with glucose deprivation intervals varied and is depicted in Figure 4A.
This set of experiments showed that glucose deprivation elicits a statistically significant increase in p-Akt levels, and that re-addition of glucose (substitution of culture medium with cM) could conditionally counter-balance this response (Figure 4B). Akt phosphorylation appears to be highly sensitive to cM components, including glucose, the presence of which is apparently one of the most important parameters influencing p-Akt levels at the time of cell harvesting. Noticeably, p-Akt levels were found to be increased each time cells were collected immediately from the glucose deprivation condition, regardless of what had preceded. However, this increase is readily reversed in the presence of glucose for as little as 5 min (Figure 4C).

2.5. Ca2+ Measurements

Excessive mobilization of Ca2+ is considered to contribute to ischemic neuronal damage. Ca2+ is derived from extracellular or intracellular routes, namely, the ER. It is well established that depletion of the ER from Ca2+ induces a subsequent, store-operated channel (SOC)-mediated Ca2+ influx from the extracellular environment. In order to assess Ca2+ mobilization during glucose deprivation, Fura-2 AM loaded cells were challenged with 100 nΜ Thapsigargin (Tg). Tg is an irreversible inhibitor of the SERCA pumps, which triggers the depletion of the ER from Ca2+ ions, and is thus, widely used to measure ER Ca2+ content [33]. ER Ca2+ depletion, in turn, results in the subsequent stimulation of store operated Ca2+ entry (SOCE), which can be evaluated upon the addition of 3 mΜ CaCl2. In this set of measurements, we observed that glucose deprivation for either 4 or 24 h leads to increased basal levels of [Ca2+]i, reduced ER Ca2+ content, and increased SOCE (Table 1, Figure 5). Surprisingly, although the Tg-induced response was almost completely abolished after 24 h of glucose deprivation, the re-addition of glucose for only 2 h restored the ER Ca2+ content. Regarding SOCE, we found that 4 h and 24 h of glucose deprivation induced a significant increase in Ca2+ entry, which was also restored to control levels after the re-addition of glucose.

2.6. Ca2+-Induced Modulation of PI3K/Akt and HIF-1α
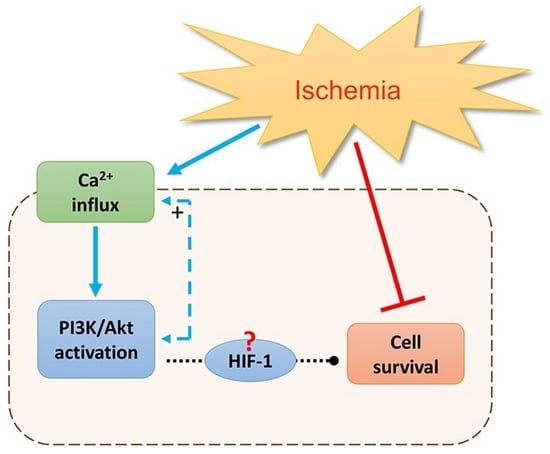
We have previously shown that Ca2+ mobilization affects both the p-Akt and HIF-1α levels in cancer epithelial cells [34]. Hence, we questioned whether this crosstalk is also taking place in SH-SY5Y cells. For this, cells were treated with Ca2+ chelating or mobilizing agents. First, we examined the effect of BAPTA-AM, a Ca2+ chelating agent, and our findings revealed that HIF-1α and p-Akt levels increased as soon as 30 min after a 20 μΜ BAPTA-AM addition, reaching a peak at 8 h (Figure 6A). However, prolonged incubation with BAPTA-AM is known to have toxic effects through the inhibition of protein translation, and this is the most probable reason why these proteins steeply diminish at 24 h of incubation. This result indicates that a decrease in cytosolic Ca2+ favors the increase of both HIF-1α and p-Akt.
Next, we used thapsigargin (Tg) to simulate ER Ca2+ depletion, which was found to accompany glucose deprivation (Figure 5). Cells were incubated in the presence of increasing concentrations of Tg (0–100 nM) for 24 h, and our results showed a gradual increase in p-Akt in contrast to HIF-1α levels, which were drastically diminished. (Figure 6B). Of note, the profile of changes induced by Tg was impressively similar to that of glucose deprivation. Interestingly, the same pattern was detected in primary neuronal cultures, indicating a common underlying mechanism (Figure S3). Upon ER Ca2+ depletion, the major sensor of ER Ca2+ content and critical partner of store-operated Ca2+ entry, STIM1 (Stromal interaction molecule 1), moves close to the plasma membrane and facilitates Ca2+ entry through the ORAI1 component of the store-operated channel. We noticed unchanged levels of STIM1 after glucose deprivation and Tg treatment for 24 h (Figure 6D), demonstrating that the location or activity of both or either ORAI1 or STIM1 could be altered.
Finally, we sought to address whether Ca2+ entry, immediate or subsequent to ER Ca2+ depletion, could account for the increase in p-Akt levels observed during glucose deprivation. For this, we used cells re-suspended in KRH solution containing 3 mM CaCl2 and then incubated either with ionomycin (IONO) or miltefosine (HePC) for 0, 3, 6, or 10 min (Figure 6E,F). IONO and HePC are factors that instantly trigger massive Ca2+ mobilization (Figure 6C) and were used to examine the effect of early Ca2+ entry on the Akt phosphorylation levels. As a final point, we examined whether the stimulation of SOCE could also activate Akt. Cell suspension in the KRH solution devoid of CaCl2 was pre-incubated in the presence of Tg for 10 min, and samples were collected at 0, 3, 6, and 10 min after Ca2+ re-addition. All the above experimental procedures showed that p-Akt levels increased rapidly upon plasma membrane Ca2+ entry (Figure 6E,F).

3. Discussion

Reduced brain oxygen and glucose transport under ischemic conditions causes energy deficiency, which leads to oxidative stress, inflammation, blood-brain barrier dysfunction, and eventually, cell death. Unless blood circulation is restored rapidly, tissue necrosis begins from the center of the occluded area, which spreads completely within one to three days and affects all cell types [35]. Areas of the brain such as the cerebral cortex, cerebellum, hypothalamus, and hippocampus are extremely vulnerable to ischemic conditions. Severe hippocampal damage results in difficulty forming new memories and often affects memories created before the ischemic attack. In addition, Purkinje cells in the cerebellum are particularly sensitive to such conditions [36]. However, there is a significant heterogeneity in the ability of different brain cell types, even cells of the same type located in distinct regions, to cope with focal ischemia. Thus, neurons and oligodendrocytes [37] are the most vulnerable to ischemia, while most astrocytes are less prone to these conditions, due to better maintenance of their energy metabolism [38,39]. Consequently, cells have to employ numerous different mechanisms in order to adapt and function in hypoxic conditions.
In the present study, the response of SH-SY5Y neuroblastoma cells was investigated mainly under ischemia-like glucose deprivation conditions. Because much of the neuronal damage associated with cerebral ischemia is delayed for hours or even days after the initial attack, it is likely that immediate intervention after the onset of ischemia may prevent or alleviate the injury. For this reason, we also examined the effect of the short recovery of glucose levels, in an attempt to restore physiological conditions.
The hypoxia-inducible factor 1 (HIF-1), and particularly its subunit HIF-1α, is the master regulator of cellular adaptation in a low oxygen environment. HIF-1α is required for cellular protection and metabolic alterations and, as such, is considered one of the many downstream targets of Akt. We and several other groups have established that under conditions that promote cell survival, there is a dose-dependent increase in both the protein levels of HIF-1α and p-Akt [34,40,41,42]. In addition, previous results of our group indicate that a partial connection between these two proteins takes place even under specific stressful conditions, i.e., in the presence of the carcinogenic benzo [α] pyrene [42]. Here, a similar connection was also proved both during glucose deprivation and in the presence of CoCl2. This is particularly significant in glucose deprivation conditions, during which Akt could maintain HIF-1α levels to a minimum, counteracting its drastic decrease in this condition.
The regulation of HIF-1α levels is also connected to Ca2+ signaling, as highlighted by a number of studies [43,44,45]. We have previously shown that chelation of cytosolic Ca2+ by BAPTA-AM leads to increased protein levels of HIF-1α [34], a finding that was also confirmed in the present study using SH-SY5Y cells. This significant increase in HIF-1α levels was suggested to rely on inhibition of PHD2 (prolyl hydroxylase domain-2) [46], thus preventing its degradation in the proteasome, but total cellular Ca2+ levels were not affected during the hypoxic conditions. Moreover, it has been observed that cilnidipine, a Ca2+ channel blocker, repressed the synthesis of the HIF-1α protein by inhibiting the activity of Akt, in non-neuronal cells [47]. However, this inhibition was again not dependent on Ca2+ homeostasis changes. Thus, although most studies indicate that low Ca2+ concentrations favor HIF-1α stability, this type of regulation needs to be explored in more detail.
It is well known that ischemia causes ER stress, consequently leading to an imbalance between survival and death signals and Ca2+ influx from the extracellular space [30]. Ca2+ entry is activated by the depletion of Ca2+ from the ER and mediated by STIM1, which moves close to the plasma membrane and forms highly Ca2+ selective pores with ORAI1. This leads to Ca2+ influx from the extracellular space directly into the ER through the Ca2+ release-activated Ca2+ current (ICRAC) [48,49]. Even though ER Ca2+ depletion represents an undisputed factor of neuronal cell injury, the modulation of the STIM1/ORAI1 complex during ischemia is still under scrutiny. For instance, ORAI1 and STIM1 levels are significantly reduced in hypoxic cortical neurons [50], whereas STIM1 expression is elevated in hippocampal neurons exposed to chemically induced hypoxia [51]. We found that STIM1 levels remain unchanged after long-term incubation with Tg or in the absence of glucose, i.e., when ER is depleted and Ca2+ entry is stimulated. We consider that either the localization or activity of the STIM1/ORAI1 complex is more susceptible to changes, and further studies are needed in this direction.
Apart from low oxygen levels, hypoglycemia is another major feature of ischemia. We found that HIF-1α and Akt are differentially affected by these two components. Specifically, HIF-1α is increased in simulated hypoxic conditions but is drastically decreased in the absence of glucose. Although the correlation between glucose and HIF-1α is anticipated, Akt, on the contrary, is activated in both conditions in spite of cell death. Other studies also present evidence that activation of Akt accompanies cell death [52], and a role in resistance to ER stress is attributed to Akt [53]. However, a direct link between ER-induced Ca2+ entry and Akt activation has not been established yet. The immediate and sustained Ca2+ influx at early times after West Nile virus infection was found to play a predominant role in cell signaling, and specifically in the activation of Akt [54]. Aligned with the above, we found a rapid activation of Akt in cell suspensions deprived of growth factors upon stimulation of Ca2+ entry. This type of activation could also explain the increase in p-Akt that we observed in the presence of BAPTA-AM, contrary to the one we found in our previous work on epithelial cells [34]. Possibly, the presence of BAPTA-AM in SH-SY5Y cells, causes a shift in the balance of Ca2+ between the ER and the cytosol, leading to ER Ca2+ depletion and subsequent Ca2+ influx. Hence, local elementary events of Ca2+ mobilization, such as SOCE, seem to rigorously influence the mechanisms of cellular homeostasis by fine tuning ER Ca2+ stores for cellular signaling and function.
As mentioned above, a key mediator of the SOCE mechanism is the plasma membrane channel ORAI1. Recently, it has been shown that in the presence of PI3K inhibitors, the abundance of ORAI1 at the cell’s surface is restricted [55]. Additionally, it is reported that specific Ca2+ channels in lipid rafts comprise important sites linking Ca2+ entry directly to Akt signaling [56], a phenomenon that could result from the hyper-activation of store-operated receptors. Based on the above, and on our results, we might suggest that, under specific conditions, PI3K/Akt activation and Ca2+ entry form a mutually serving functional loop. In the latter, Ca2+ entry leads to the activation of PI3K/Akt, which is then engaged to support Ca2+ channel trafficking and is not accessible to downstream cell survival pathways.
In summary, we have demonstrated that glucose deprivation, a component of ischemia, activates Ca2+ entry in a reversible manner. This Ca2+ entry plays a primordial role in replenishing the depleted Ca2+ ER while it also sustains the activation of Akt. Such Ca2+ fluctuations, aside from which proteins are regulated, may play a key role in the pathophysiology of ageing, diabetes, and a broad range of neurological diseases. As timely and effective restoration of ER Ca2+ content could represent a potential treatment for neurodegeneration, these findings may prove to be useful not only for the prevention of stroke progression but also for neurodegenerative diseases with underlying Ca2+ disorders.

4. Materials and Methods

4.1. Cell Culture and Treatments

SH-SY5Y human neuroblastoma cells (CRL-2266, obtained from the American Type Culture Collection, Rockville, MD, USA) were maintained in RPMI 1640 medium (Gibco, Grand Island, NY, USA) supplemented with 10% fetal bovine serum (FBS), 100 U/mL penicillin, 100 μg/mL streptomycin (PAA Laboratories, Pasching, Austria) at 37 °C in a humidified atmosphere of 5% CO2. Hypoxic conditions were simulated by adding CoCl2 (50–400 μΜ, Sigma-Aldrich, St. Louis, MO, USA) in culture medium and hypoglycaemic conditions were simulated by glucose-free RPMI medium supplemented with 10% FBS. Depletion of ER was induced by thapsigargin (Tg; 12.5–100 nM, Sigma-Aldrich), an inhibitor of SERCA pump. Wortmannin (100 nM, Sigma-Aldrich) was used as a specific inhibitor of PI3K/Akt and MG132 (10 μΜ, Calbiochem, San Diego, CA, USA) as a proteasome inhibitor.
For a limited number of experiments, primary neuronal cultures were used. Briefly, pregnant C57BL/6 mice, were sacrificed by cervical dislocation and fetuses (embryonic day 16–18) were removed under sterile conditions, placed in ice cold PBS, and kept on ice for microscopic dissection. Cortices were minced and digested with 0.125% trypsin (Sigma-Aldrich, St. Louis, MO, USA) in calcium, magnesium-free PBS containing 5 μg/mL DNAse at 37 °C for 20 min. Cells were suspended in Neurobasal medium (Gibco BRL, Grand Island, NY, USA), plated in 35 mm plates (Greiner Bio-One, Cellstar, Kremsmünster, Austria) at a density of 5 × 10⁵ cells and incubated at 37 °C in a humidified atmosphere of 5% CO2. All animal procedures were carried out according to the Greek Law 56/2013, in conformity with European Union guidelines.

4.2. Preparation of Total Protein Extracts and Western Blot Analysis

For Western blot experiments, SH-SY5Y cells were washed twice with ice-cold PBS, harvested by scraping, lysed in ice-cold Buffer G containing 20 mM β-glycerophosphate, 20 mM NaF, 2 mM EDTA, 0.2 mM Na3VO4, 10 mM benzamidine, 20 mM HEPES, pH 7.5, supplemented with 0.5% (v/v) Triton X-100 and a mixture of protease inhibitors (200 μΜ leupeptin, 5 mM DTT, 300 μΜ PMSF, and 10 μΜ E64) and incubated on ice for 30 min. Lysates were then centrifuged at 10,000× g for 10 min and protein concentration in the supernatant was determined by the Bradford assay (Bio-Rad). Equal amounts of total protein (50 μg protein per sample) were separated in 8% (w/v) SDS-PAGE gels and blotted onto nitrocellulose membranes (Porablot NCP; Macherey-Nagel, Düren, Germany). Membranes were incubated overnight at 4 °C with the respective primary antibodies (Table S1) and proteins were detected using the enhanced chemiluminescence’s reaction (ECL, Thermo Scientific, NH, USA) onto a X-OMAT AR film or in an 8800 FluorChem Imaging System (Alpha Innotech Corp., San Leandro, CA, USA). The intensity of each immunoreactive band was estimated by densitometric quantification using the ImageJ Software (https://imagej.nih.gov/ij; NIH, Bethesda, MD, USA). The levels of the phosphorylated proteins were expressed as the ratio of the pixel intensity of the phosphorylated protein to the intensity of the total protein in each case. In all cases, β-actin was used as an internal loading control.

4.3. Cytosolic Ca2+ Measurement

Intracellular Ca2+ concentration ([Ca2+]i) was measured in SH-SY5Y cells using the Ca2+-sensitive dye, Fura-2. Briefly, cells were detached, centrifuged, and resuspended in complete Krebs–Ringer–Henseleit (KRH) buffer (125 mM NaCl, 5 mM KCl, 1.2 mM MgSO4, 1.2 mM KH2PO4, 25 mM Hepes/NaOH, 2 mM CaCl2, 6 mM glucose) containing 50 μΜ DTPA. Afterwards, cells (10 × 106 cells/mL) were loaded with 5 μM Fura-2 AM (Calbiochem, CA, USA) in KRH containing 200 μΜ sulfinpyrazone and incubated at 37 °C for 30 min. After washing, cells were centrifuged and resuspended in KRH buffer (1 × 10⁶ cells/sample) or in KRH without glucose in case of simulating ischemic conditions. Cell aliquots were transferred to a thermostatted cuvette in a Perkin Elmer LS-50 fluorometer (Norwalk, CT, USA) and maintained at 37 °C, under continuous stirring. Fura-2 fluorescence was monitored with excitation and emission wavelengths of 340 nm and 510 nm respectively. Ca2+ entry was measured in cell samples resuspended in a Ca2+-free KRH containing 10 μM EGTA. Thapsigargin, the sarcoplasmic-endoplasmic reticulum Ca2+-ATPase blocker, was added to induce depletion of intracellular Ca2+ stores. The recording was continued for up to 10 min until the end of the first peak and Ca2+, at a final concentration of 3mM, was then added. Traces were recorded and analysed as previously described [57] using the equation [Ca2+]i = Kd × (F − Fmin)/(Fmax − F), where Kd is the dissociation constant of the Fura-2–Ca2+ complex that was assumed to be 225 nM. The minimum values (Fmin) were determined by an intrinsic calibration procedure after the addition of 3 mM EGTA whereas, to estimate the maximal values (Fmax), CaCl2 (13 mM) was added after cell lysis with 0.1% Triton X-100. Changes in [Ca2+]i were determined by measuring peak or plateau values and expressing them as the change from basal levels.

4.4. Cell Viability Assay

SH-SY5Y cells (3 × 10⁴ cells/well) were seeded into 96-well plates and cultured in RPMI 1640 medium for 24 h at 37 °C. Afterwards, cells were treated with increasing concentrations of CoCl2 (6.25–400 μM), glucose (0–2 mg/mL) in RPMI containing 10% FBS for 24 h. Cell viability was determined using the MTT colorimetric method. Briefly, at the end of the incubation period 2.5 mg/mL MTT (Applichem, Darmstadt, Germany) solution was added to the culture medium and cells were incubated at 37 °C for 4 h. Afterwards, the cultured medium was removed and 100 μL of DMSO was added to each well to dissolve the formazan crystals. The absorbance of each sample was measured at 570 nm in an ELISA plate reader (Denley, West Sussex, UK). Cell viability was expressed as the percentage of the absorbance value compared to control cells.

4.5. Data Analysis

Protein levels were normalized using β-actin or GAPDH as internal loading controls. In each experiment, the pixel intensity values of the examined proteins of treated samples (ratio of values of protein of interest to values of loading control) were expressed as fold changes of control samples (set at 1).
All data shown are representative of at least three independent experiments and are presented as mean ± standard error of the mean (S.E.M.). Statistical significance of differences was evaluated using one-way ANOVA, followed by Dunnett’s multiple comparison test. Probability (p) values < 0.05 were considered significant. Statistical analysis was performed using the GraphPad Prism software (version 8.0.0; San Diego, CA, USA).

Supplementary Materials

The following supporting information can be downloaded at: https://www.mdpi.com/article/10.3390/ijms23031386/s1.

Author Contributions

Conceptualization, P.P.; investigation, M.K., D.L., I.G., M.P. (Maria Paschalidi); validation, D.L., M.P. (Maria Paschou) and M.K.; writing—original draft preparation, I.G., D.L., E.P.; writing—review and editing, M.P. (Maria Paschou), P.P.; supervision, P.P.; project administration, P.P.; funding acquisition, P.P. All authors have read and agreed to the published version of the manuscript.

Funding

This research received no external funding. This research was funded by the Special Account for Research Grants of the National and Kapodistrian University of Athens, Greece.

Institutional Review Board Statement

Not applicable.

Informed Consent Statement

Not applicable.

Data Availability Statement

Not applicable.

Conflicts of Interest

The authors declare no conflict of interest.

References

  1. Béjot, Y.; Garnier, P. Cerebral Ischemia. In Hormesis in Health and Disease; CRC Press: Boca Raton, FL, USA, 2014. [Google Scholar] [CrossRef]
  2. Janardhan, V.; Qureshi, A.I. Mechanisms of ischemic brain injury. Curr. Cardiol. Rep. 2004, 6, 117–123. [Google Scholar] [CrossRef] [PubMed]
  3. Lee, J.M.; Grabb, M.C.; Zipfel, G.J.; Choi, D.W. Brain tissue responses to ischemia. J. Clin. Investig. 2000, 106, 723–731. [Google Scholar] [CrossRef] [PubMed] [Green Version]
  4. Fulda, S.; Debatin, K.M. HIF-1-regulated glucose metabolism: A key to apoptosis resistance? Cell Cycle 2007, 6, 790–792. [Google Scholar] [CrossRef] [PubMed] [Green Version]
  5. Liu, W.; Shen, S.M.; Zhao, X.Y.; Chen, G. Q. Targeted genes and interacting proteins of hypoxia inducible factor-1. Int. J. Biochem. Mol. Biol. 2012, 3, 165–178. [Google Scholar] [PubMed]
  6. Li, Q.F.; Zhu, Y.S.; Jiang, H. Isoflurane preconditioning activates HIF-1α, iNOS and Erk1/2 and protects against oxygen-glucose deprivation neuronal injury. Brain Res. 2008, 1245, 26–35. [Google Scholar] [CrossRef]
  7. Skinner, H.D.; Zheng, J.Z.; Fang, J.; Agani, F.; Jiang, B.H. Vascular endothelial growth factor transcriptional activation is mediated by hypoxia-inducible factor 1α, HDM2, and p70S6K1 in response to phosphatidylinositol 3-kinase/AKT signaling. J. Biol. Chem. 2004, 279, 45643–45651. [Google Scholar] [CrossRef] [Green Version]
  8. Lin, Y.; Liu, A.; Lu, N.; Li, Y.; Song, Q.; Yu, H.; Li, X. Inhibitive effects of low oxygen and glucose deprivation on brain-pancreas relative protein expression via hypoxia- inducible factor-1 pathways. Cell. Physiol. Biochem. 2008, 22, 353–362. [Google Scholar] [CrossRef]
  9. Mishra, O.P.; Zubrow, A.B.; Ashraf, Q.M. Nitric oxide-mediated activation of extracellular signal-regulated kinase (ERK) and c-Jun N-terminal kinase (JNK) during hypoxia in cerebral cortical nuclei of newborn piglets. Neuroscience 2004, 123, 179–186. [Google Scholar] [CrossRef]
  10. Déry, M.A.C.; Michaud, M.D.; Richard, D.E. Hypoxia-inducible factor 1: Regulation by hypoxic and non-hypoxic activators. Int. J. Biochem. Cell Biol. 2005, 37, 535–540. [Google Scholar] [CrossRef]
  11. Zhong, H.; De Marzo, A.M.; Laughner, E.; Lim, M.; Hilton, D.A.; Zagzag, D.; Buechler, P.; Isaacs, W.B.; Semenza, G.L.; Simons, J.W. Overexpression of hypoxia-inducible factor 1α in common human cancers and their metastases. Cancer Res. 1999, 59, 5830–5835. [Google Scholar]
  12. Williams, K.J.; Telfer, B.A.; Airley, R.E.; Peters, H.P.W.; Sheridan, M.R.; Van der Kogel, A.J.; Harris, A.L.; Stratford, I.J. A protective role for HIF-1 in response to redox manipulation and glucose deprivation: Implications for tumorigenesis. Oncogene 2002, 21, 282–290. [Google Scholar] [CrossRef] [PubMed]
  13. Franke, T.F.; Yang, S.I.; Chan, T.O.; Datta, K.; Kazlauskas, A.; Morrison, D.K.; Kaplan, D.R.; Tsichlis, P.N. The protein kinase encoded by the Akt proto-oncogene is a target of the PDGF-activated phosphatidylinositol 3-kinase. Cell 1995, 81, 727–736. [Google Scholar] [CrossRef] [Green Version]
  14. Kohn, A.D.; Kovacina, K.S.; Roth, R.A. Insulin stimulates the kinase activity of RAC-PK, a pleckstrin homology domain containing ser/thr kinase. EMBO J. 1995, 14, 4288–4295. [Google Scholar] [CrossRef] [PubMed]
  15. Brunet, A.; Park, J.; Tran, H.; Hu, L.S.; Hemmings, B.A.; Greenberg, M.E. Protein Kinase SGK Mediates Survival Signals by Phosphorylating the Forkhead Transcription Factor FKHRL1 (FOXO3a). Mol. Cell. Biol. 2001, 21, 952–965. [Google Scholar] [CrossRef] [Green Version]
  16. Rodgers, S.J.; Ferguson, D.T.; Mitchell, C.A.; Ooms, L.M. Regulation of PI3K effector signalling in cancer by the phosphoinositide phosphatases. Biosci. Rep. 2017, 37. [Google Scholar] [CrossRef] [Green Version]
  17. Gao, M.; Liang, J.; Lu, Y.; Guo, H.; German, P.; Bai, S.; Jonasch, E.; Yang, X.; Mills, G.B.; Ding, Z. Site-specific activation of AKT protects cells from death induced by glucose deprivation. Oncogene 2014, 33, 745–755. [Google Scholar] [CrossRef] [Green Version]
  18. Zhang, L.; Qu, Y.; Tang, J.; Chen, D.; Fu, X.; Mao, M.; Mu, D. PI3K/Akt signaling pathway is required for neuroprotection of thalidomide on hypoxic-ischemic cortical neurons in vitro. Brain Res. 2010, 1357, 157–165. [Google Scholar] [CrossRef]
  19. Sutter, C.H.; Laughner, E.; Semenza, G.L. Hypoxia-inducible factor 1α protein expression is controlled by oxygen-regulated ubiquitination that is disrupted by deletions and missense mutations. Proc. Natl. Acad. Sci. USA 2000, 97, 4748–4753. [Google Scholar] [CrossRef] [Green Version]
  20. Semenza, G.L. Expression of hypoxia-inducible factor 1: Mechanisms and consequences. Biochem. Pharmacol. 2000, 59, 47–53. [Google Scholar] [CrossRef]
  21. Zhou, J.; Hara, K.; Inoue, M.; Hamada, S.; Yasuda, H.; Moriyama, H.; Endo, H.; Hirota, K.; Yonezawa, K.; Nagata, M.; et al. Regulation of hypoxia-inducible factor 1 by glucose availability under hypoxic conditions. Kobe J. Med. Sci. 2007, 53, 283–296. [Google Scholar]
  22. Serra-Pérez, A.; Planas, A.M.; Núñez-O’Mara, A.; Berra, E.; García-Villoria, J.; Ribes, A.; Santalucía, T. Extended ischemia prevents HIF1α degradation at reoxygenation by impairing prolyl-hydroxylation: Role of krebs cycle metabolites. J. Biol. Chem. 2010, 285, 18217–18224. [Google Scholar] [CrossRef] [PubMed] [Green Version]
  23. Marchi, S.; Rimessi, A.; Giorgi, C.; Baldini, C.; Ferroni, L.; Rizzuto, R.; Pinton, P. Akt kinase reducing endoplasmic reticulum Ca2+ release protects cells from Ca2+-dependent apoptotic stimuli. Biochem. Biophys. Res. Commun. 2008, 375, 501–505. [Google Scholar] [CrossRef] [Green Version]
  24. Bhuiyan, M.I.H.; Jung, S.Y.; Kim, H.J.; Lee, Y.S.; Jin, C. Major role of the PI3K/Akt pathway in ischemic tolerance induced by sublethal oxygen-glucose deprivation in cortical neurons in vitro. Arch. Pharm. Res. 2011, 34, 1023–1034. [Google Scholar] [CrossRef]
  25. Brini, M.; Calì, T.; Ottolini, D.; Carafoli, E. Neuronal calcium signaling: Function and dysfunction. Cell. Mol. Life Sci. 2014, 71, 2787–2814. [Google Scholar] [CrossRef]
  26. Augustine, G.J.; Santamaria, F.; Tanaka, K. Local calcium signaling in neurons. Neuron 2003, 40, 331–346. [Google Scholar] [CrossRef] [Green Version]
  27. Hernández-Fonseca, K.; Massieu, L. Disruption of endoplasmic reticulum calcium stores is involved in neuronal death induced by glycolysis inhibition in cultured hippocampal neurons. J. Neurosci. Res. 2005, 82, 196–205. [Google Scholar] [CrossRef]
  28. Larsen, G.A.; Skjellegrind, H.K.; Berg-Johnsen, J.; Moe, M.C.; Vinje, M.L. Depolarization of mitochondria in isolated CA1 neurons during hypoxia, glucose deprivation and glutamate excitotoxicity. Brain Res. 2006, 1077, 153–160. [Google Scholar] [CrossRef]
  29. Henrich, M.; Buckler, K.J. Effects of anoxia, aglycemia, and acidosis on cytosolic Mg2+, ATP, and pH in rat sensory neurons. Am. J. Physiol. Cell Physiol. 2008, 294, C280–C294. [Google Scholar] [CrossRef] [Green Version]
  30. Nguyen, H.N.; Wang, C.; Perry, D.C. Depletion of intracellular calcium stores is toxic to SH-SY5Y neuronal cells. Brain Res. 2002, 924, 159–166. [Google Scholar] [CrossRef]
  31. Stegeman, H.; Span, P.N.; Peeters, W.J.M.; Verheijen, M.M.G.; Grénman, R.; Meijer, T.W.H.; Kaanders, J.H.A.M.; Bussink, J. Interaction between hypoxia, AKT and HIF-1 signaling in HNSCC and NSCLC: Implications for future treatment strategies. Future Sci. OA 2016, 2. [Google Scholar] [CrossRef] [Green Version]
  32. Arsham, A.M.; Plas, D.R.; Thompson, C.B.; Simon, M.C. Akt and hypoxia-inducible factor-1 independently enhance tumor growth and angiogenesis. Cancer Res. 2004, 64, 3500–3507. [Google Scholar] [CrossRef] [Green Version]
  33. Thastrup, O.; Cullen, P.J.; Drobak, B.K.; Hanley, M.R.; Dawson, A.P. Thapsigargin, a tumor promoter, discharges intracellular Ca2+ stores by specific inhibition of the endoplasmic reticulum Ca2+-ATPase. Proc. Natl. Acad. Sci. USA 1990, 87, 2466–2470. [Google Scholar] [CrossRef] [Green Version]
  34. Divolis, G.; Mavroeidi, P.; Mavrofrydi, O.; Papazafiri, P. Differential effects of calcium on PI3K-Akt and HIF-1α survival pathways. Cell Biol. Toxicol. 2016, 32, 437–449. [Google Scholar] [CrossRef]
  35. Du, C.; Hu, R.; Csernansky, C.A.; Hsu, C.Y.; Choi, D.W. Very delayed infarction after mild focal cerebral ischemia: A role for apoptosis? J. Cereb. Blood Flow Metab. 1996, 16, 195–201. [Google Scholar] [CrossRef]
  36. Dirnagl, U.; Iadecola, C.; Moskowitz, M.A. Pathobiology of ischaemic stroke: An integrated view. Trends Neurosci. 1999, 22, 391–397. [Google Scholar] [CrossRef]
  37. Lee, D.R.; Helps, S.C.; Gibbins, I.L.; Nilsson, M.; Sims, N.R. Losses of NG2 and NeuN immunoreactivity but not astrocytic markers during early reperfusion following severe focal cerebral ischemia. Brain Res. 2003, 989, 221–230. [Google Scholar] [CrossRef]
  38. Thoren, A.E.; Helps, S.C.; Nilsson, M.; Sims, N.R. Astrocytic function assessed from 1-14C-acetate metabolism affer temporary focal cerebral ischemia in rats. J. Cereb. Blood Flow Metab. 2005, 25, 440–450. [Google Scholar] [CrossRef] [Green Version]
  39. Thoren, A.E.; Helps, S.C.; Nilsson, M.; Sims, N.R. The metabolism of 14C-glucose by neurons and astrocytes in brain subregions following focal cerebral ischemia in rats. J. Neurochem. 2006, 97, 968–978. [Google Scholar] [CrossRef]
  40. Kimbro, K.S.; Simons, J.W. Hypoxia-inducible factor-1 in human breast and prostate cancer. Endocr. Relat. Cancer 2006, 13, 739–749. [Google Scholar] [CrossRef]
  41. Lee, M.; Spokes, K.C.; Aird, W.C.; Abid, M.R. Intracellular Ca2+ can compensate for the lack of NADPH oxidase-derived ROS in endothelial cells. FEBS Lett. 2010, 584, 3131–3136. [Google Scholar] [CrossRef] [Green Version]
  42. Mavrofrydi, O.; Papazafiri, P. Hypoxia-inducible factor-1α increase is an early and sensitive marker of lung cells responding to benzo[a] pyrene. J. Environ. Pathol. Toxicol. Oncol. 2012, 31, 335–347. [Google Scholar] [CrossRef] [PubMed]
  43. Werno, C.; Zhou, J.; Brüne, B. A23187, ionomycin and thapsigargin upregulate mRNA of HIF-1α via endoplasmic reticulum stress rather than a rise in intracellular calcium. J. Cell. Physiol. 2008, 215, 708–714. [Google Scholar] [CrossRef] [PubMed]
  44. Yuan, G.; Nanduri, J.; Khan, S.; Semenza, G.L.; Prabhakar, N.R. Induction of HIF-1α expression by intermittent hypoxia: Involvement of NADPH oxidase, Ca2+ signaling, prolyl hydroxylases, and mTOR. J. Cell. Physiol. 2008, 217, 674–685. [Google Scholar] [CrossRef] [PubMed] [Green Version]
  45. Lin, J.; Denmeade, S.; Carducci, M. HIF-1α and Calcium Signaling as Targets for Treatment of Prostate Cancer by Cardiac Glycosides. Curr. Cancer Drug Targets 2009, 9, 881–887. [Google Scholar] [CrossRef] [Green Version]
  46. Berchner-Pfannschmidt, U.; Petrat, F.; Doege, K.; Trinidad, B.; Freitag, P.; Metzen, E.; De Groot, H.; Fandrey, J. Chelation of cellular calcium modulates hypoxia-inducible gene expression through activation of Hypoxia-Inducible Factor-1α. J. Biol. Chem. 2004, 279, 44976–44986. [Google Scholar] [CrossRef] [Green Version]
  47. Oda, S.; Oda, T.; Takabuchi, S.; Nishi, K.; Wakamatsu, T.; Tanaka, T.; Adachi, T.; Fukuda, K.; Nohara, R.; Hirota, K. The calcium channel blocker cilnidipine selectively suppresses hypoxia-inducible factor 1 activity in vascular cells. Eur. J. Pharmacol. 2009, 606, 130–136. [Google Scholar] [CrossRef]
  48. Parekh, A.B. Store-operated CRAC channels: Function in health and disease. Nat. Rev. Drug Discov. 2010, 9, 399–410. [Google Scholar] [CrossRef]
  49. Gruszczynska-Biegala, J.; Pomorski, P.; Wisniewska, M.B.; Kuznicki, J. Differential roles for STIM1 and STIM2 in store-operated calcium entry in rat neurons. PLoS ONE 2011, 6, e19285. [Google Scholar] [CrossRef] [Green Version]
  50. Secondo, A.; Petrozziello, T.; Tedeschi, V.; Boscia, F.; Vinciguerra, A.; Ciccone, R.; Pannaccione, A.; Molinaro, P.; Pignataro, G.; Annunziato, L. ORAI1/STIM1 Interaction Intervenes in Stroke and in Neuroprotection Induced by Ischemic Preconditioning Through Store-Operated Calcium Entry. Stroke 2019, 50, 1240–1249. [Google Scholar] [CrossRef]
  51. Wang, L.; Lei, Q.; Zhao, S.; Xu, W.J.; Dong, W.; Ran, J.H.; Shi, Q.H.; Fu, J.F. Ginkgolide B Maintains Calcium Homeostasis in Hypoxic Hippocampal Neurons by Inhibiting Calcium Influx and Intracellular Calcium Release. Front. Cell. Neurosci. 2021, 14, 486. [Google Scholar] [CrossRef]
  52. Price, J.; Zaidi, A.K.; Bohensky, J.; Srinivas, V.; Shapiro, I.M.; Ali, H. Akt-1 mediates survival of chondrocytes from endoplasmic reticulum-induced stress. J. Cell. Physiol. 2010, 222, 502–508. [Google Scholar] [CrossRef] [PubMed]
  53. Hu, P.; Han, Z.; Couvillon, A.D.; Exton, J.H. Critical role of endogenous Akt/IAPs and MEK1/ERK pathways in counteracting endoplasmic reticulum stress-induced cell death. J. Biol. Chem. 2004, 279, 49420–49429. [Google Scholar] [CrossRef] [PubMed] [Green Version]
  54. Scherbik, S.V.; Brinton, M.A. Virus-Induced Ca 2+ Influx Extends Survival of West Nile Virus-Infected Cells. J. Virol. 2010, 84, 8721–8731. [Google Scholar] [CrossRef] [PubMed] [Green Version]
  55. Kim, J.H.; Park, E.Y.; Hwang, K.H.; Park, K.S.; Choi, S.J.; Cha, S.K. Soluble αKlotho downregulates Orai1-mediated store-operated Ca2+ entry via PI3K-dependent signaling. Pflugers Arch. Eur. J. Physiol. 2021, 473, 647–658. [Google Scholar] [CrossRef] [PubMed]
  56. Fedida-Metula, S.; Feldman, B.; Koshelev, V.; Levin-Gromiko, U.; Voronov, E.; Fishman, D. Lipid rafts couple store-operated Ca2+ entry to constitutive activation of PKB/Akt in a Ca2+/calmodulin-, Src- and PP2A-mediated pathway and promote melanoma tumor growth. Carcinogenesis 2012, 33, 740–750. [Google Scholar] [CrossRef] [Green Version]
  57. Grynkiewicz, G.; Poenie, M.; Tsien, R.Y. A new generation of Ca2+ indicators with greatly improved fluorescence properties. J. Biol. Chem. 1985, 260, 3440–3450. [Google Scholar] [CrossRef]
Figure 1. Opposite effects of glucose deprivation on p-Akt, p-GSK3α/β and HIF-1α protein levels. (A) Representative Western blot images of SH-SY5Y cells treated with increasing glucose concentrations (0–2 mg/mL in RPMI containing 10% FBS) for 24 h. (B) Quantification of p-Akt, p-GSK3α/β and HIF-1α protein levels for dose-dependent effect. Data are presented as mean ± S.E.M., n = 3, * p < 0.05, † p < 0.001, compared to control (2 mg/mL). (C) Representative Western blot images of cells incubated for 0.5–24 h in the absence of glucose (GD, glucose deprivation) in RPMI containing 10% FBS. (D) Quantification of p-Akt, p-GSK3α/β and HIF-1α protein levels for time-dependent effect. Data are presented as mean ± S.E.M., n = 3, * p < 0.05, ** p < 0.01, † p < 0.001, compared to control (0 h).
Ijms 23 01386 g001
Figure 2. CoCl2 increases p-Akt, p-GSK3α/β and HIF-1α in a dose- and time- dependent manner. (A) Representative Western blot images of SH-SY5Y cells treated with increasing CoCl2 concentrations (50–400 μM) for 24 h. (B) Quantification of p-Akt, p-GSK3α/β and HIF-1α protein levels for dose–dependent effect. (C) Representative Western blot images of cells treated with 400 μΜ CoCl2 for 0.5–24 h. (D) Quantification of p-Akt, p-GSK3α/β and HIF-1α protein levels for time–dependent effect. Data are presented as mean ± S.E.M., n = 3, * p < 0.05, ** p < 0.01, † p < 0.001 compared to control (0 μΜ and 0 h for (C,D) respectively).
Ijms 23 01386 g002
Figure 3. Glucose deprivation decreases HIF-1α levels during hypoxia. Representative Western blot images of p-Akt and HIF-1α protein levels (from two separate experiments) in SH-SY5Y cells incubated for 2, 4, and 24 h in the absence of glucose (GD, glucose deprivation), or in the presence of 1 mg/mL glucose, either without or with CoCl2.
Ijms 23 01386 g003
Figure 4. Glucose deprivation–induced Akt phosphorylation is partially restored after the glucose re-addition. (A) Protocol of repetitive periods of glucose deprivation using a glucose-free medium and glucose re-addition using a conditioned medium (cM). Control cells were incubated in a complete growth medium. (B) Representative Western blot images and quantification of p-Akt levels in SH-SY5Y cells incubated as shown in (A), compared to control cells. Data are presented as mean ± S.E.M., n = 3, * p < 0.05, ** p < 0.01, † p < 0.001, compared to control. (C) Representative Western blot image of p-Akt in glucose-deprived SH-SY5Y cells (for 60 min) followed by glucose supplementation (1 mg/mL) for 5, 10, and 15 min.
Ijms 23 01386 g004
Figure 5. Reversal of changes in Ca2+ homeostasis caused by short- and long-term glucose deprivation (GD) upon the re-addition of glucose. ER Ca2+ content was measured upon stimulation of cells with Tg in Ca2+ free-KRH and SOCE was measured by addition of 3 mM CaCl2 (arrows). Glucose deprivation of SH-SY5Y cells lasted 4 and 24 h and glucose restoration for 1 and 2 h, respectively. Representative traces from 4–6 independent experiments.
Ijms 23 01386 g005
Figure 6. Ca2+ entry activates Akt. (A) Representative Western blot images and quantification of p-Akt and HIF-1α levels in SH-SY5Y cells incubated with 20 μΜ BAPTA-AM, a Ca2+ chelating agent, for 0.5 up to 24 h. (B) Representative Western blot images and quantification of p-Akt, and HIF-1α levels in SH-SY5Y cells treated with thapsigargin (Tg, 0–100 nM) for 24 h. (C) Ca2+ entry induced by ionomycin (IONO) or miltefosine (HePC) measured in Fura-2 loaded SH-SY5Y cells in Ca2+ containing KRH (representative traces from 3–6 independent experiments). (D) Representative Western blot image of STIM1 levels during glucose deprivation (GD) or Tg (100 nM) treatment for 24 h. (E,F) Representative Western blot images and quantification of p-Akt levels in SH-SY5Y cells detached and re-suspended in KRH buffer supplemented with IONO (500 nM) or HePC (20 μM). In the case of CaCl2 (3 mM), cells were pre-treated with Tg in Ca2+ free-KRH for 10 min. Cells were harvested after 0, 3, 6, and 10 min of incubation. All data are presented as mean ± S.E.M., n = 4, * p < 0.05, ** p < 0.01, † p < 0.001, compared to controls.
Ijms 23 01386 g006
Table 1. Effect of glucose deprivation on intracellular Ca2+ concentration ([Ca2+]i), ER Ca2+ content and Ca2+ entry.
Cell Culture Condition[Ca2+]i, nMER Ca2+ Content
(% [Ca2+]i)
Ca2+ Entry
(% of ER Ca2+ Content)
Control47.8 ± 4297.9 ± 2171.8 ± 8
GD 4 h64.3 ± 8 *107.5 ± 14 **98.3 ± 6 **
GD 4 h & 1 h Gluc62.5 ± 8 *146.8 ± 12 **82.4 ± 5
GD 24 h83.2 ± 12 *23.6 ± 2 482.6 ± 3
GD 24 h & 2 h Gluc78.9 ± 6 *106.4 ± 12 66.7 ± 9
Values shown are means ± S.E.M. from 4–6 independent experiments. * p < 0.05, ** p < 0.01,  p < 0.001 compared to control,  p < 0.001 compared to the corresponding GD sample.
Publisher’s Note: MDPI stays neutral with regard to jurisdictional claims in published maps and institutional affiliations.

