Abstract
MicroRNAs (miRNAs) play a significant role in plant response to different abiotic stresses. Thus, identification of abiotic stress-responsive miRNAs holds immense importance in crop breeding programmes to develop cultivars resistant to abiotic stresses. In this study, we developed a machine learning-based computational method for prediction of miRNAs associated with abiotic stresses. Three types of datasets were used for prediction, i.e., miRNA, Pre-miRNA, and Pre-miRNA + miRNA. The pseudo K-tuple nucleotide compositional features were generated for each sequence to transform the sequence data into numeric feature vectors. Support vector machine (SVM) was employed for prediction. The area under receiver operating characteristics curve (auROC) of 70.21, 69.71, 77.94 and area under precision-recall curve (auPRC) of 69.96, 65.64, 77.32 percentages were obtained for miRNA, Pre-miRNA, and Pre-miRNA + miRNA datasets, respectively. Overall prediction accuracies for the independent test set were 62.33, 64.85, 69.21 percentages, respectively, for the three datasets. The SVM also achieved higher accuracy than other learning methods such as random forest, extreme gradient boosting, and adaptive boosting. To implement our method with ease, an online prediction server “ASRmiRNA” has been developed. The proposed approach is believed to supplement the existing effort for identification of abiotic stress-responsive miRNAs and Pre-miRNAs.
1. Introduction
MicroRNAs (miRNAs) are 20–24 nucleotides long, small non-coding RNA molecules, widely distributed in the plant kingdom [1,2]. By regulating the expression of stress-responsive genes, miRNAs play a vital role in plant response to different abiotic stresses and are thus regarded as the bio-regulators of plant stress response [3,4,5,6]. Due to the importance of miRNAs in regulating the plant response to different environmental stresses, many experimental and computational studies have been carried out to identify and characterize abiotic stress-responsive miRNAs. Specifically, miRNAs in response to drought [7,8,9,10,11,12,13,14,15], cold [16,17,18,19], heat [20,21,22], light [23,24,25,26,27,28,29,30], salt [15,31,32], and oxidative [33,34,35,36,37,38] stresses have been identified in several crop species. In addition, miRNAs involved in mineral-nutrient and mechanical stresses have also been reported in previous studies [39,40,41].
The miRNAs response to abiotic stresses depends upon the types of genotype, stress, tissue, and miRNA [42]. Down-regulated expression of miR408 in rice [11], cotton [43], and peach [44] and up-regulated expression miR408 in Arabidopsis [8], Medicago [45], and barley [13] during drought stress is an example of genotype-dependent response of miRNAs. With regard to tissue-dependent response of miRNAs, the study by Wang et al. [46] revealed the altered expression profile of miRNAs in roots as compared to leaves in response to drought and salinity stresses in cotton. The miR169 was inhibited by drought stress [47] but was found to be induced by salinity treatment in Arabidopsis [48], which demonstrates that abiotic stresses induce the expression of miRNAs in a stress-dependent manner. Similarly, miR398 was induced by UVB light in Arabidopsis but was inhibited by salinity, cold, and oxidative stress [34,49]. As far as plant response to abiotic stresses in miRNAs-dependent manner is concerned, the expression of miR397 was significantly induced but the expression of miR398 was significantly inhibited in Arabidopsis under salinity stress [8]. All the above cited studies suggest that miRNAs play a significant role in plant response to different abiotic stresses.
Most of the abiotic stress-responsive miRNAs have been identified by experimental methods such as RT-PCR, cloning, RNA-microarrays, and northern blots [50,51]. In addition, the NGS and deep sequencing technologies have also led to the identification of a large number of abiotic stress-responsive miRNAs [52]. All the miRNAs identified through wet lab experiments and sequencing methods have been populated in the form of databases such as miRBase [53], miRNEST [54], PMRD [55], miRPlant [56], PlantMirnaT [57], PASmiR [58], PncStress [59], NtUE-Webresource [41], and others [50]. The PncStress database is the most updated, and it contains the experimentally validated miRNA sequences associated with different environmental stresses. Nevertheless, the experimental methods and high throughput sequencing technologies are resource intensive, as far as identification of stress-responsive miRNAs is concerned. Further, no computational tool is available for the prediction of abiotic stress-responsive miRNAs using the miRNA sequence data. Keeping in view the importance of miRNAs in plant response to abiotic stresses and non-availability of computational methods for predicting such miRNAs, our objective in this study is to develop a machine learning-based computational tool for predicting abiotic stress-responsive miRNAs using the features derived from the miRNA sequences. The present study is expected to supplement the wet-lab experiments and other sequencing technologies for identification of miRNAs under abiotic stresses.
2. Results
2.1. Feature Selection Analysis
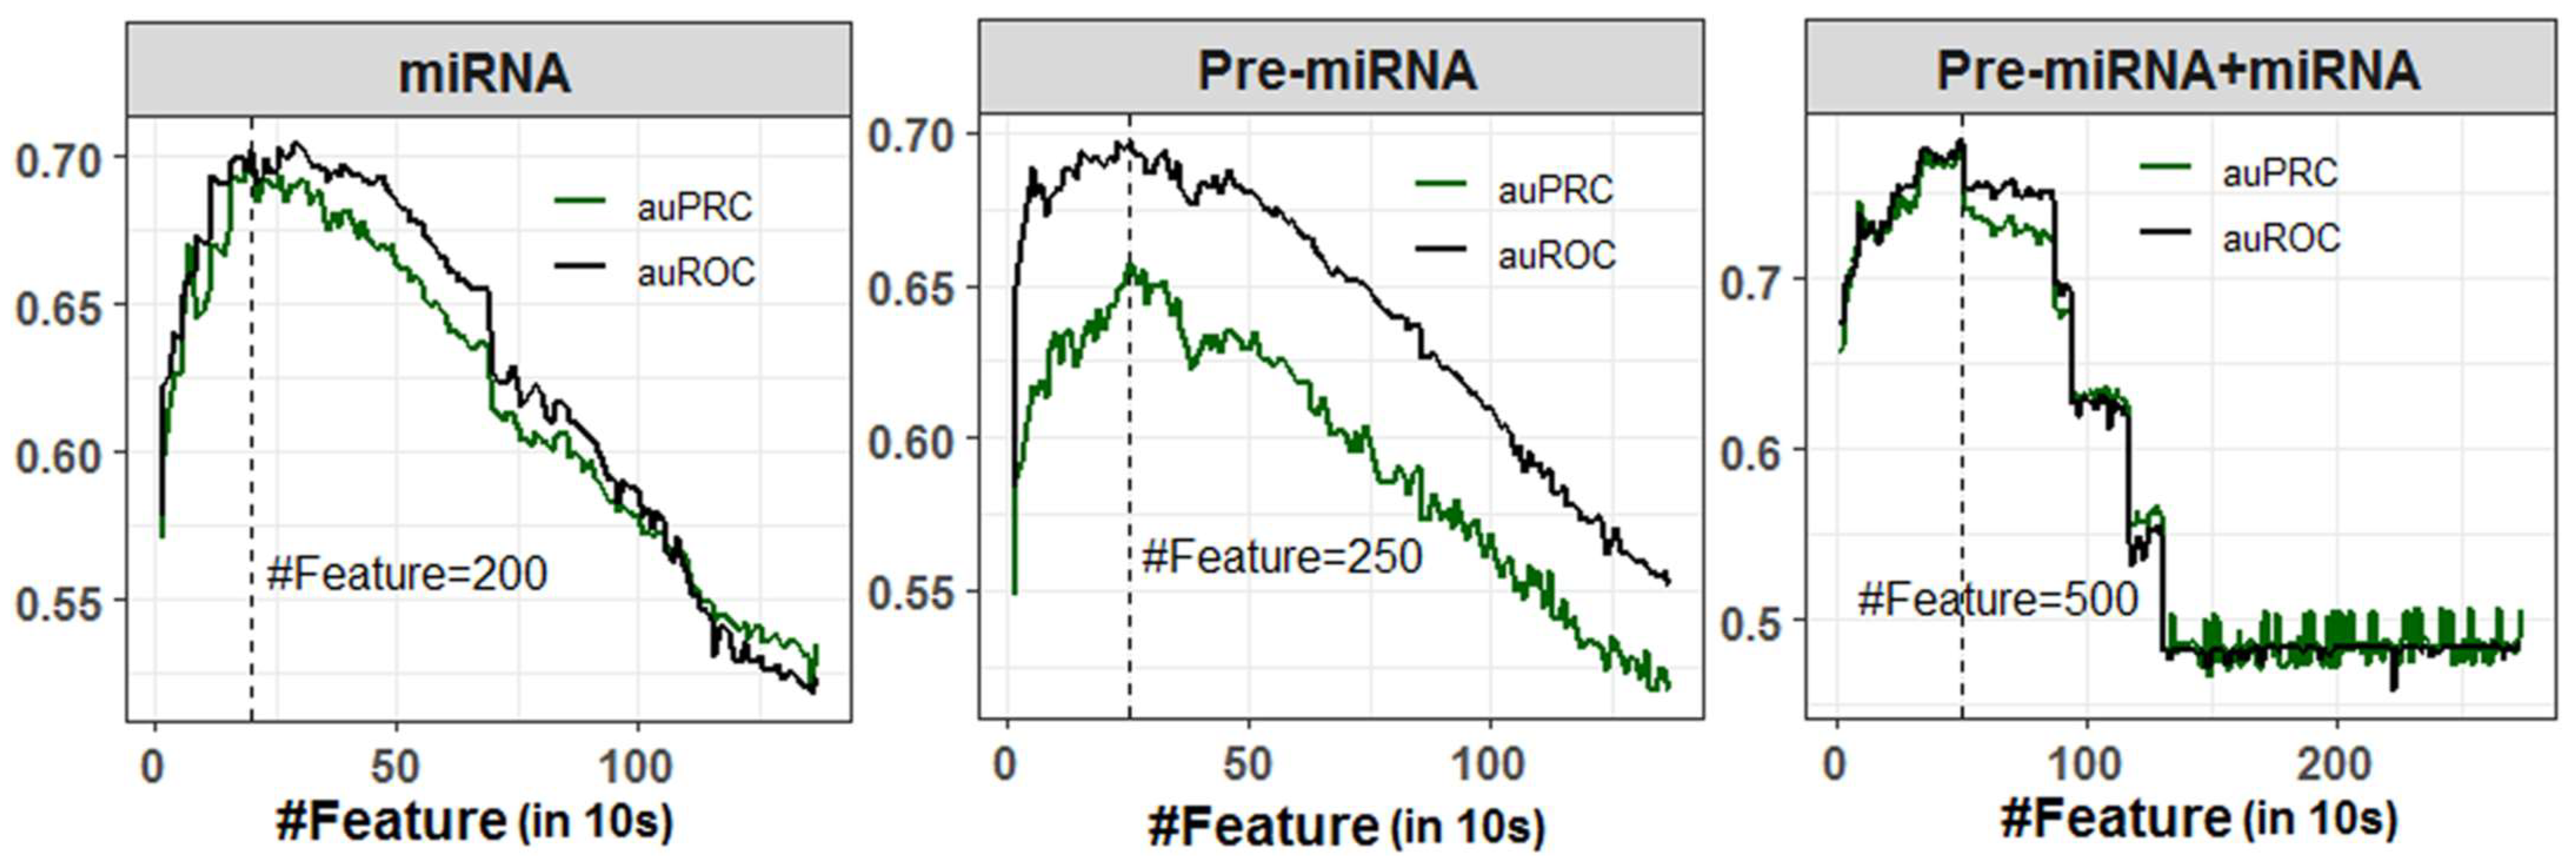
A total of 1372 numeric features (Pseudo K-tuple nucleotide composition: PseKNC) was generated for each miRNA and Pre-miRNA sequence. However, the features were highly correlated as there were large numbers of sparse features generated due to the smaller sequence length of miRNAs (20–24 nucleotides) and Pre-miRNAs (80–120 nucleotides). Correlated or redundant features may negatively affect the classification accuracy. Thus, SVM-RFE feature selection method was employed to select important features for the classification of stress-responsive miRNAs and non-stress-responsive miRNAs with higher accuracy, where randomly selected 50% observations of the dataset were utilized for classification. An optimal feature set containing 200 features was selected for classification using miRNA sequences, where the values of auROC (70.19%) and auPRC (70.11%) were observed to be higher (Figure 1). While classification was performed with Pre-miRNA dataset, higher auROC (69.74%) and auPRC (65.73%) were obtained with an optimal subset of 250 selected features (Figure 1). As far as classification with Pre-miRNA + miRNA dataset is concerned, higher classification accuracies (auROC: 78.04% and auPRC: 77.08%) were found with 500 selected features (Figure 1). It was also found that the classification accuracies (auROC and auPRC) were increased up to 200, 250, and 500 selected features, respectively, for miRNA, Pre-miRNA, and Pre-miRNA + miRNA datasets and started declining thereafter (Figure 1). Lowest accuracies were observed for all three datasets when classification was performed using all the PseKNC features.
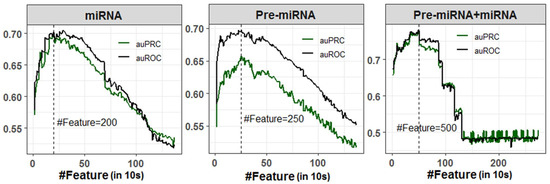
Figure 1.
Feature selection for miRNA, Pre-miRNA, and Pre-miRNA + miRNA datasets. The optimal number of features were selected based on the higher accuracies in terms of auROC and auPRC. A total of 200, 250, and 500 features were selected for miRNA, Pre-miRNA, and Pre-miRNA + miRNA datasets, respectively.
2.2. Cross-Validated Prediction Analysis with Selected Features
Final prediction analysis was performed for miRNA, Pre-miRNA and Pre-miRNA + miRNA datasets with the respective selected feature sets, where the SVM with RBF kernel was utilized as predictor. Moreover, to achieve maximum classification accuracy, the parameters gamma and cost were optimized through a grid search approach with and , with step size 2. However, the higher accuracies were found with the default parameters () for all three datasets and are given in Table 1.

Table 1.
Performance metrics of support vector machine (SVM) for predicting abiotic stress associated miRNAs and Pre-mirNAs. The predictions were made with the selected feature sets. The prediction accuracies with the Pre-miRNA + miRNA dataset were found higher as compared to that of the miRNA and Pre-miRNA datasets.
The performance metrics were observed to be ~64–70% with the miRNA dataset, whereas for the Pre-miRNA dataset the performance metrics were found be ~63–69%. As far as prediction with Pre-miRNA + miRNA dataset is concerned, the prediction accuracies such as Sen (74.00%), Spe (68.80%), Acc (71.40%), Pre (70.34%), F-score (72.12%), auROC (77.94%), and auPRC (77.32%) were observed to be higher than the respective accuracies obtained with miRNA and Pre-miRNA datasets. In contrast, there was not much difference observed between the accuracies of miRNA and Pre-miRNA datasets. It was also observed that the sensitivities were higher than the corresponding specificities for all three datasets (Table 1). The higher accuracy of prediction with Pre-miRNA + miRNA dataset may be attributed to the use of more features (550) as compared to those of miRNA (200) and Pre-miRNA (250) datasets.
2.3. Performance Analysis with Other Learning Methods
The performance of predicting abiotic stress-responsive miRNAs was further analyzed with other start-of-the-art machine learning algorithms such as random forest (RF; Breiman [60]), extreme gradient boosting (XGB; Chen and Guestrin [61]), and adaptive boosting (ADB; Freund and Schapire [62]). The R-packages randomForest [63], xgboost [64], and adabag [65] were, respectively, utilized for implementing the RF, XGB, and ADB learning methods. For prediction with the miRNA dataset, the accuracies of RF (Sen: 55.20%, Spe: 58.13%, Acc: 56.66%, Pre: 56.86%, F-score: 56.02%, auROC: 58.88%, auPRC: 69.96%) were observed to be higher than those of XGB (51.21%, 56.00%, 53.61%, 53.78%, 52.46%, 54.79%, 56.03%) and ADB (52.26%, 57.06%, 54.67%, 54.91%, 53.55%, 57.45%, 57.01%) (Table 2).
Table 2.
Performance metrics of random forest (RF), adaptive boosting (ADB), and extreme gradient boosting (XGB) methods. The performance of RF, ADB, and XGB were analyzed using the selected feature sets for predicting abiotic stress responsive miRNAs and Pre-miRNAs. The RF method achieved higher accuracies as compared to the other two methods. Nevertheless, the accuracies were not found to be much different among the three learning methods. For all three learning methods, the accuracies are observed to be higher with the Pre-miRNA + miRNA dataset.
Similarly, the performance metrics of RF (58–65%) with the Pre-miRNA dataset were further observed to be 2–10% higher than those of XGB (54–58%) and 2–7% higher than those of ADB (57–60%), with the exception of specificity (Table 2). When predicting with the Pre-miRNA + miRNA dataset, the prediction accuracies of RF were also observed higher as compared to those of the XGB and ADB learning methods. In addition, the differences in accuracies between RF and XGB and between RF and ADB were less than those of prediction with miRNA and Pre-miRNA datasets (Table 2). Similar to SVM, the performance of RF, XGB, and ADB were observed to be higher for the Pre-miRNA + miRNA dataset as compared to the miRNA and Pre-miRNA datasets. Further, the performance accuracies of XGB were observed to be higher than those of ADB. The prediction accuracies of XGB and ADB methods were found less than 60% with Pre-miRNA and miRNA datasets, and more than 60% with the Pre-miRNA + miRNA dataset (Table 2).
2.4. Comparison of SVM with Other Learning Methods
When the performance of SVM was compared with that of other learning algorithms, SVM was found to outperform RF, XGB, and ADB in all three datasets (Table 1 and Table 2). For Pre-miRNA and miRNA datasets, the accuracies of SVM were >60%, whereas the accuracies were less than 60% for RF, XGB, and ADB methods. Similarly, for the Pre-miRNA + miRNA dataset, SVM achieved more than 70% accuracy as compared to less than 70% accuracy for the learning methods RF, XGB, and ADB (Table 1 and Table 2). One of the probable reasons for the higher accuracy with SVM is the features selected through SVM-RFE may not be an optimal feature set for other learning methods. It was also found that most of the prediction probabilities of RF and ADB were nearer to the random guess (0.5) (Figure 2). The variability in the prediction probabilities was higher for the XGB methods as compared to others, where the probabilities were evenly distributed around the random values. For SVM, most of the probabilities were found to be higher than the random guess (0.5), where the mode of the distribution was found to be around 0.75 for all three datasets (Figure 2).
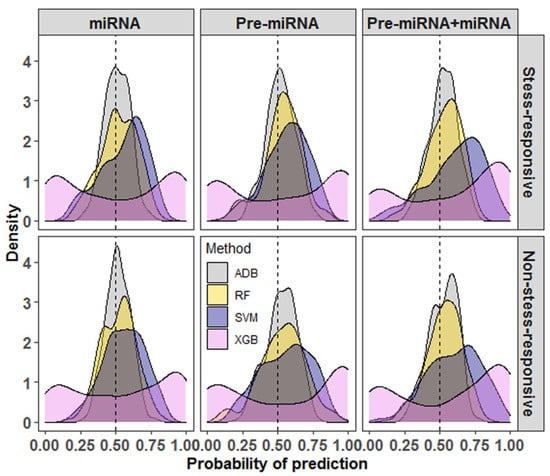
Figure 2.
Density graphs for the probabilities of prediction for different machine learning methods. It can be seen that most of the probabilities of prediction with SVM are higher than the random guess (0.5) as compared to random forest (RF), extreme gradient boosting (XGB), and adaptive boosting (ADB) methods. The XGB is observed to be the lowest performer among the considered methods. The variability in the prediction probabilities is lowest for the ADB and highest for the XGB methods.
2.5. Analysis with Leave-One-Out Cross Validation
The performance of SVM was further analyzed by following a leave-one-out cross validation (LOOCV) approach. Similar to the 5-fold cross validation (5F-CV), higher accuracies were found with Pre-miRNA + miRNA as compared to the Pre-miRNA and miRNA datasets. For the miRNA dataset, the performance metrics of 5F-CV and LOOCV were observed to be almost same (Table 3). In contrast, the sensitivity of LOOCV was ~1% higher than that of 5F-CV but the specificity of LOOCV was ~1% less than that of 5F-CV (Table 3). When compared using the Pre-miRNA dataset, the sensitivity, F-score, and accuracy of 5F-CV were observed to be ~1% higher than the respective metrics of LOOCV, whereas the specificity and auROC of LOOCV were ~1% higher than that of 5F-CV (Table 3). The precision and auPRC of both 5F-CV and LOOCV were found to be almost same. In the case of the Pre-miRNA + miRNA dataset, the auROC and auPRC of LOOCV were higher as compared to that of 5F-CV, whereas the other performance metrics obtained with LOOCV and 5F-CV were similar (Table 3). The accuracies of both LOOCV and 5F-CV were found to be almost similar for all three datasets with few exceptions.
Table 3.
Prediction accuracies with 5-fold cross validation (5F-CV) and leave-one-out cross validation (LOOCV). The prediction accuracies are higher for the Pre-miRNA + miRNA as compared to the other two datasets. The performances with 5F-CV and LOOCV are similar when all the metrics are accounted for. Among the metrics, the auROC and auPRC are higher.
2.6. Prediction for the Independent Test Set
For the independent dataset, we collected 89 abiotic stress-responsive miRNAs from the existing studies [4,17,23,42,51,55,58,66,67,68,69,70]. After removing the identical sequences and the sequences with non-standard residues (other than A, U, G, C), 72 miRNAs were retained for the independent set. It was also ensured that these miRNAs were not present in the 1428 miRNAs collected for the training set. As far as the Pre-miRNA independent dataset is concerned, 70 Pre-miRNAs were retrieved for 70 miRNAs (out of 72) from the miRbase database. As far as a negative set is concerned, 100 sequences each for miRNAs and corresponding Pre-miRNAs were randomly taken from the miRBase database. Prediction for the test set was performed using the model trained with SVM with the selected feature sets. Summary of the test dataset and accuracies are given in Table 4. Similar to the 5-fold cross validation accuracies (Table 1), higher prediction accuracies were obtained for Pre-miRNA + miRNA as compared to the miRNA and Pre-miRNA test datasets. Specifically, overall accuracies of 62.33%, 64.85%, and 69.21% were obtained for the independent sets of miRNA, Pre-miRNA, and miRNA + Pre-miRNA, respectively (Table 4). Overall prediction accuracies of test instances of miRNA (62.33%), Pre-miRNA (64.85%), and miRNA + Pre-miRNA (69.21%) were also observed to be similar with the 5-fold cross validation accuracies of miRNA (65.33%), Pre-miRNA (66.40%), and miRNA + Pre-miRNA (71.40%), respectively.
Table 4.
Summary of the independent datasets and their prediction accuracies. The accuracies are on par with the accuracies of 5-fold cross validation. The accuracies are also observed higher for the miRNA + Pre-miRNA dataset.
2.7. Prediction Server ASRmiRNA
For easy implementation of the proposed approach, we established an online prediction server ASRmiRNA (http://cabgrid.res.in:8080/asrmirna, accessed on 28 December 2021) for prediction of abiotic stress-responsive miRNAs and Pre-miRNAs. The front end of the server was designed using HTML, whereas the developed R-code is run at the back end with the help of PHP. The prediction can be made by using three types of datasets, i.e., miRNA, Pre-miRNA, and miRNA + Pre-miRNA. The user has to paste the sequences in FASTA format in the text box provided. In the case of miRNA + Pre-miRNA, the user has to supply both miRNAs and their corresponding Pre-miRNAs in the respective text boxes. The results are presented in tabular format, where the probabilities with which each sequence is predicted as stress-responsive or non-stress-responsive are provided.
3. Discussion
Plants experience several environmental stresses that adversely affect their growth and development [71,72]. Abiotic stresses such as cold, drought, heat, light, oxidation, and salt are the major ones that limit the growth and productivity of crop plants to a large extent [73,74]. In defense of such abiotic stresses, plants adopt different mechanisms, and regulating the expression of abiotic stress-responsive genes via miRNAs is one of them. The miRNAs act as a post-transcriptional regulators of gene expression in a sequence-specific manner to respond to different abiotic stresses, where the gene expression is regulated via translational inhibition [50]. The miRNA recruits the Argonaute proteins to specifically target mRNA via base-pairing, to repress their translation and stability [75]. Although it cannot be guaranteed that the miRNA sequence is solely responsible for the abiotic stress response, at the same time it cannot be ignored that the whole process of translational repression occurs with the specific base pairing of miRNA with the target region where the order of nucleotides in the miRNA plays an important role. In particular, targeting is dependent upon the base pairing of the seed region, nucleotides (nts) 2–7 of the miRNA to sites in mRNA 3′UTRs. In addition, the 3′ end of the miRNAs has also been found to be involved in regulating the target specificity and regulation [76], where the extent of base-pairing to the miRNA 3′-end can influence the stability of the miRNA itself, and this signifies the importance of miRNA sequence beyond the seed region [75]. Thus, we believe the sequence of miRNA itself has a pivotal role in the whole process of regulation of the gene expression. Therefore, identification of abiotic stress-responsive miRNAs based on the sequence information is an important area of research as far as the plant response to different environmental stresses is concerned. The existing methods for miRNA identification such as cloning, high throughput sequencing, and microarrays [8] are costly as well as time consuming. Thus, there is a need to develop an alternate method for identification of abiotic stress-responsive miRNAs, and hence the present study is focused on developing a computational method for prediction of miRNAs associated with abiotic stress response. More specifically, we employed machine learning methods for prediction of abiotic stress-responsive miRNAs using sequence-derived features. For prediction, we employed three types of datasets, i.e., miRNA, Pre-miRNA, and combination of miRNA and Pre-miRNA.
One of the most important tasks in machine learning-based prediction using biological sequence data is to encode the sequences into numeric features, as machine learning algorithms (MLA) can only take numerical inputs [2,77,78,79,80]. Further, the miRNA sequences are only 20–24 nucleotides long, which is also a limitation to generate large number of discriminative features. In the present study, we utilized the psudo K-tuple nucleotide compositional (PseKNC) features to transform the miRNA sequences into numeric feature vectors. The PseKNC was successfully adopted in earlier studies [61,81,82,83] for prediction using biological sequence data. Here, we considered K = 2, 3, 4, and 5, and therefore total numbers of feature generated were Because miRNA sequences are only 20–24 nucleotides long, there is a higher probability of generated features containing large numbers of 0s, which may introduce redundancy in the feature set.
Prediction accuracies can be misleading with the presence of redundant or irrelevant features. Thus, it is important to select important features among all the generated features. In this study, we utilized the SVM-RFE [84] for selecting the feature set for best discriminating the abiotic stress-responsive miRNAs and Pre-miRNAs from non-stress-responsive miRNAs and Pre-miRNAs, respectively. The SVM-RFE method has also been successfully adopted in many applications such as signal processing [85], genomics [86,87], proteomics [88], and metabolomics [89,90]. After ranking all the features using SVM-RFE, the classification accuracies in terms of auROC and auPRC were plotted in an iterative manner by adding 10 features at a time, until all the features are exhausted. The numbers of features were selected where the higher values of auROC and auPRC were obtained. The number of features selected for miRNA, Pre-miRNA, and Pre-miRNA + miRNA datasets were 200, 250, and 500, respectively. The number of features selected for Pre-miRNA dataset is larger than that of miRNA, because it is expected that the number of sparse features for miRNA will be more as compared to Pre-miRNA, as miRNA sequence length is much smaller than that of Pre-miRNA. Further, the number of features selected with the Pre-miRNA + miRNA dataset is larger and this because the number of features considered for Pre-miRNA + miRNA dataset is 2744 (1372 for miRNA and 1372 for Pre-miRNA).
Due to high generalized predictive ability, the SVM has been successfully utilized in different domains of research. Ability to handle large and noisy data is also one of the reasons for wide and successful implementation of SVM in many computational studies [91,92,93,94]. Thus, we preferred SVM over other machine learning algorithms for classification of stress responsive miRNAs and Pre-miRNAs. Further, the prediction accuracies were measured by following the 5-fold cross validation approach. The prediction accuracies with miRNA and Pre-miRNA datasets were found to be almost similar. This may be because 20–24 nucleotides long miRNA was present within Pre-miRNA, and also the number of features was almost the same. In contrast, the prediction accuracies with the Pre-miRNA + miRNA dataset were ~5% higher compared to those of the miRNA and Pre-miRNA datasets. One of the possible explanations for higher accuracy may be the use of larger number of selected features (500) in the case of the Pre-miRNA + miRNA dataset.
The performance of SVM was further compared with that of other start-of-the-art machine learning algorithms, i.e., random forest (RF), adaptive boosting (ADB), and extreme gradient boosting (XGB). The SVM outperformed all three learning algorithms. SVM achieved ~10% higher accuracy than the RF and 12–14% higher accuracy than that of the ADB and XGB algorithms. Further, RF was observed to achieve higher accuracy as compared to that of the ADB and XGB learning methods when miRNA and Pre-miRNA datasets were used. In contrast, similar accuracies were found for all three methods when predicting with the Pre-miRNA + miRNA dataset. The lower accuracies of prediction for RF, ADB, and XGB may be because the features selected using SVM may not be appropriate to achieve higher accuracy with the other learning methods. The higher accuracies of SVM as compared to RF, XGB, and ADB were also obtained in our earlier studies [95,96].
The performance of the proposed approach (SVM with selected features) was also assessed by using an independent dataset that comprises sequences of miRNAs collected from existing studies. The Pre-miRNA sequences of the respective miRNAs were obtained from the miRBase database. The overall accuracies for the independent set were found to be almost similar with the cross-validation accuracies. This shows that the accuracies were neither over estimated nor under estimated. Similar to 5-fold cross validation accuracies, the accuracies of Pre-miRNA + miRNA independent dataset were observed to be higher than those of miRNA and Pre-miRNA independent sets.
The 376 miRNA sequences used in this study were from 108 plant species with >50% sequences for Arabidopsis thaliana. In other words, each plant species has ~3 sequences on average. As it is difficult to train a machine learning model using fewer numbers of observations, the prediction was not performed on individual plant species.
Development of any computational method must be available in the form of a software package or prediction server for its usefulness by the user community, particularly those who are from a non-computational background. Thus, we established a prediction server ASRmiRNA (http://cabgrid.res.in:8080/asrmirna, accessed on 28 December 2021) for the identification of miRNAs and Pre-miRNAs associated with the abiotic stress response of plants.
4. Materials and Methods
4.1. Retrieval and Processing of Sequence Data
We collected 1428 abiotic stress-responsive miRNA sequences from the PncStress database [59], which is accessible at http://bis.zju.edu.cn/pncstress/, accessed on 28 December 2021. This database contains 4227 experimentally validated stress-responsive non-coding RNAs (miRNA, LncRNA, and circRNA) from 114 plants, covering 48 biotic and 91 abiotic stresses. After removing the identical sequences, we obtained 668 miRNA sequences. The abiotic-stress responsive miRNA sequences were used to construct the positive set. For the negative set, we collected 9716 miRNA sequences from the miRBase database [97], which is available at https://www.mirbase.org/, accessed on 28 December 2021. Out of 9716 sequences, 5701 sequences were retained after excluding the identical sequences, and these were utilized as the negative set. To avoid homologous bias in the prediction accuracy, both positive and negative datasets were subjected to the homology reduction at 80% sequence identity using the CD-HIT program [98]. After removing the redundant sequences, a total of 376 and 3823 miRNA sequences were respectively obtained for the positive and negative sets. In addition, we also used the Pre-miRNA sequences of the abiotic stress-responsive miRNAs for prediction. Out of 376 non-redundant miRNAs, we retrieved 251 corresponding Pre-miRNAs from the miRBase database. All the Pre-miRNAs were available for the 3823 miRNA sequences of the miRbase. Thus, we considered 251 abiotic stress-responsive Pre-miRNAs as the positive set and 3823 Pre-miRNAs as the negative set as far as prediction with Pre-miRNA sequences is concerned. Furthermore, another dataset was prepared by considering both miRNAs and Pre-miRNAs. In summary, three datasets were prepared for the analysis, i.e., miRNA, Pre-miRNA, and Pre-miRNA + miRNA.
4.2. Pseudo K-Tuple Nucleotide Compositional Features
In this study, we generated pseudo K-tuple nucleotide compositional (PseKNC; Chen et al. [99]) features to transform each miRNA sequence into a numeric feature vector because the pseudo composition of nucleotides can take into account the long-range sequence order effect [99]. Each sequence can be transformed to a numeric vector of elements, where a set of correlation factors captured the sequence order effect. Mathematically, the tier correlation factor between all the most contagious K-tuple nucleotides in a sequence of nucleotides is
where
Here, is the property of the K-tuple nucleotides in the sequence, and is the total number of such property [99]. Now, the dimensional feature vector can be represented as , where
Here, is the normalized frequency of the K-tuple nucleotides in the sequence, and is the weight factor. The first elements reflect the effect of K-tuple nucleotide composition and to elements reflect the effect of long-range sequence order. As the miRNA sequences are around 20–24 nucleotides, we considered up to 3-tier correlation only, hence λ = 3 was taken. The weight factor as considered. Specifically, the values of K = 2, 3, 4, and 5 were considered and the number of features generated were 19, 67, 259, and 1027, respectively. In total, 1372 features were generated for each miRNA sequence. The Pse-in-One web server [100] was utilized to generate the PseKNC features.
4.3. Prediction with Support Vector Machine Algorithm
We used support vector machine (SVM; Coretes and Vapnik [101]) for prediction, as it has been successfully employed for prediction in existing biological studies [78,79,102,103,104,105,106]. The SVM maps the input data to high dimensional features and searches for an optimal separating hyper plane with maximum margin for the classification of observations of different classes. Let be the class label for the observation vector . The hyper plane can then be written as , where and represent weight and bias factors, respectively. The process of choosing the optimal hyper plane involves a convex optimization problem, which can be formulated as
subject to the constraints
The cost parameter controls the trade-off between the margin and the misclassification error, and is the slack variable represents the distance between the boundary and the classification point. The minimization can also be formulated as a maximization problem with Lagrangian theory, i.e.,
subject to the constraints
Here, is the Lagrangian multiplier and is the kernel function that plays the most important role of transforming the input dataset to high-dimensional feature space in which the observations of different classes are linearly separable. As far as kernel function is concerned, we employed the radial basis (RBF) kernel function that can be represented as . The decision function can now be written as , where indicates that the observation vector is classified in the +1 class and −1 class otherwise. The SVM was implemented using the “e1071” R-package [107].
4.4. Feature Selection with SVM-Recursive Feature Elimination Approach
Feature selection helps to filter out the redundant and noisy features and thereby reduce the computational complexity and improve the classification accuracy [108,109]. In this study, we employed the SVM-recursive feature elimination (SVM-RFE; Guyon et al. [110]) method for selection of important features. The SVM-RFE is a backward feature elimination technique, where the features are removed iteratively based on SVM classifier weights. The weight vector for the SVM classifier can be obtained as , where is the total number of features, is the Lagrangian multiplier estimated from the training dataset, is the feature vector for the ith observation, and is the class label of the corresponding observation. The top-ranked features that are removed in the last iteration of SVM-RFE are considered most important, whereas the bottom-ranked ones are the least informative and removed in the first iteration. In other words, an SVM model is built in each iteration based on the current features subset , and the weight () of each feature in is computed. The features are then ranked on the basis of and the bottom-ranked features are removed from . This procedure is repeated until is empty. For a specific application, it is important to determine how many features should be retained for the analysis. In this study, the top features that induced a classifier with best classification accuracy were selected as per earlier studies [90,110]. The SVM-RFE method was implemented using the “sigFeature” R-package [111].
4.5. Cross-Validation Approach
Cross-validation (CV) procedure is a widely accepted approach to estimate the accuracy of classification/prediction algorithms by running training and testing on different partitions of the dataset [112,113]. The K-fold and leave-one-out CV (LOOCV) are often used to evaluate the performance of learning algorithms. In this study, we used both 5-fold CV and LOOCV procedures to evaluate the performance of classifiers. For 5-fold CV, both positive and negative datasets were randomly partitioned into five equal-size subsets. One subset each from positive and negative sets constituted the test set that was used to evaluate the model trained with the remaining four subsets from both classes. Each subset was tested exactly once, and the process was repeated five times. The performance was calculated by taking the average over all five subsets. The LOOCV is the least arbitrary method, as it always yields a unique result for a given dataset [104]. In LOOCV, each observation was singled out as a test instance and the remaining observations were used to train the model. This process was repeated until all the instances were exhausted as test instances. A flow chart describing all the steps involved in the proposed approach is shown in Figure 3.
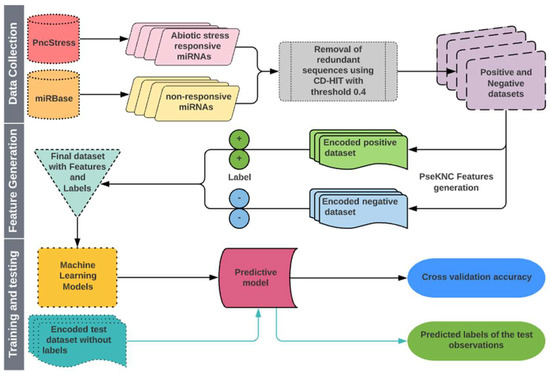
Figure 3.
Flow diagram showing the steps involved in the proposed approach for prediction of abiotic stress-responsive Pre-miRNAs and miRNAs.
4.6. Performance Evaluation Criteria
To objectively evaluate the anticipated accuracy of the classifiers, a set of quantitative performance metrics such as sensitivity (Sen), specificity (Spe), accuracy (Acc), precision (Pre), and F-score was utilized. The metrics are defined as follows:
TP, TN, FP, and FN represent the number of true positives, true negatives, false positives, and false negatives, respectively. In addition, we also used area under receiver characteristic curve (auROC; Fawcett [114]) and area under precision-recall curve (auPRC; Davis and Goadrich [115]) to measure the performance of the classifiers.
4.7. Prediction with Balanced Dataset
The numbers of sequences in negative datasets (3823) were much larger than that of positive datasets—that is, miRNA (376), Pre-miRNA (251), and miRNA + Pre-miRNA (251). Prediction with such imbalanced datasets may result in higher accuracy for the negative class as compared to the positive class [61,78,79,116,117]. To avoid such biasness while predicting with MLA, balanced datasets containing equal number of instances from both positive and negative classes were prepared, where the sequences of the negative class were randomly drawn from the available sequences. For instance, the balanced dataset for miRNA contains 376 positive and 376 negative sequences (randomly drawn from 3823 sequences). The balanced datasets for Pre-miRNA and miRNA + Pre-miRNA were similarly prepared.
Author Contributions
Conceptualization, P.K.M. and O.P.D.; methodology, P.K.M.; software, T.K.S., P.K.M. and S.B.; validation, S.B., A.K. and U.K.; formal analysis, P.K.M., S.B., T.K.S., A.K., A.G. and U.K.; investigation, P.K.M., A.G., A.R.R., K.P.S. and O.P.D.; resources, T.K.S., U.K., A.G. and A.R.R.; data curation, S.B. and P.K.M.; writing—original draft preparation, P.K.M.; writing—review and editing, P.K.M., A.R.R., U.K., K.P.S. and O.P.D.; visualization, P.K.M., A.K. and U.K.; supervision, K.P.S. and O.P.D. All authors have read and agreed to the published version of the manuscript.
Funding
This research received no external funding.
Institutional Review Board Statement
Not applicable.
Informed Consent Statement
Not applicable.
Data Availability Statement
The data presented in this study are available at http://cabgrid.res.in:8080/asrmirna/dataset.html, accessed on 28 December 2021.
Acknowledgments
The authors sincerely acknowledge the Director, ICAR-IASRI, New Delhi for providing necessary computational facilities. The authors are also thankful to Jai Bhagwan for maintaining the web site. OPD acknowledge the partial funding support from the USDA-AFRI hatch program (MAS 00508).
Conflicts of Interest
The authors declare no conflict of interest.
References
- Axtell, M.J.; Bartel, D.P. Antiquity of MicroRNAs and Their Targets in Land Plants. Plant Cell 2005, 17, 1658–1673. [Google Scholar] [CrossRef] [PubMed] [Green Version]
- Zhang, B.; Pan, X.; Cannon, C.H.; Cobb, G.P.; Anderson, T.A. Conservation and divergence of plant microRNA genes. Plant J. 2006, 46, 243–259. [Google Scholar] [CrossRef] [PubMed]
- Covarrubias, A.A.; Reyes, J.L. Post-transcriptional gene regulation of salinity and drought responses by plant microRNAs. Plant. Cell Environ. 2010, 33, 481–489. [Google Scholar] [CrossRef] [PubMed]
- Khraiwesh, B.; Zhu, J.K.; Zhu, J. Role of miRNAs and siRNAs in biotic and abiotic stress responses of plants. Biochim. Biophys. Acta 2012, 1819, 137–148. [Google Scholar] [CrossRef] [Green Version]
- Wani, S.H.; Tripathi, P.; Zaid, A.; Challa, G.S.; Kumar, A.; Kumar, V.; Upadhyay, J.; Joshi, R.; Bhatt, M. Transcriptional regulation of osmotic stress tolerance in wheat (Triticum aestivum L.). Plant Mol. Biol. 2018, 97, 469–487. [Google Scholar] [CrossRef]
- Gahlaut, V.; Jaiswal, V.; Kumar, A.; Gupta, P.K. Transcription factors involved in drought tolerance and their possible role in developing drought tolerant cultivars with emphasis on wheat (Triticum aestivum L.). Theor. Appl. Genet. 2016, 129, 2019–2042. [Google Scholar] [CrossRef]
- Zhao, B.; Liang, R.; Ge, L.; Li, W.; Xiao, H.; Lin, H.; Ruan, K.; Jin, Y. Identification of drought-induced microRNAs in rice. Biochem. Biophys. Res. Commun. 2007, 354, 585–590. [Google Scholar] [CrossRef]
- Liu, H.H.; Tian, X.; Li, Y.J.; Wu, C.A.; Zheng, C.C. Microarray-based analysis of stress-regulated microRNAs in Arabidopsis thaliana. RNA 2008, 14, 836–843. [Google Scholar] [CrossRef] [Green Version]
- Liu, C.G.; Calin, G.A.; Volinia, S.; Croce, C.M. MicroRNA expression profiling using microarrays. Nat. Protoc. 2008, 3, 563–578. [Google Scholar] [CrossRef]
- Arenas-Huertero, C.; Pérez, B.; Rabanal, F.; Blanco-Melo, D.; De La Rosa, C.; Estrada-Navarrete, G.; Sanchez, F.; Covarrubias, A.A.; Reyes, J.L. Conserved and novel miRNAs in the legume Phaseolus vulgaris in response to stress. Plant Mol. Biol. 2009, 70, 385–401. [Google Scholar] [CrossRef]
- Zhou, L.; Liu, Y.; Liu, Z.; Kong, D.; Duan, M.; Luo, L. Genome-wide identification and analysis of drought-responsive microRNAs in Oryza sativa. J. Exp. Bot. 2010, 61, 4157–4168. [Google Scholar] [CrossRef] [PubMed]
- Kulcheski, F.R.; de Oliveira, L.F.V.; Molina, L.G.; Almerão, M.P.; Rodrigues, F.A.; Marcolino, J.; Barbosa, J.F.; Stolf-Moreira, R.; Nepomuceno, A.L.; Marcelino-Guimarães, F.C.; et al. Identification of novel soybean microRNAs involved in abiotic and biotic stresses. BMC Genom. 2011, 12, 307. [Google Scholar] [CrossRef] [PubMed] [Green Version]
- Kantar, M.; Lucas, S.J.; Budak, H. miRNA expression patterns of Triticum dicoccoides in response to shock drought stress. Planta 2011, 233, 471–484. [Google Scholar] [CrossRef] [PubMed]
- Frazier, T.P.; Sun, G.; Burklew, C.E.; Zhang, B. Salt and Drought Stresses Induce the Aberrant Expression of microRNA Genes in Tobacco. Mol. Biotechnol. 2011, 49, 159–165. [Google Scholar] [CrossRef] [PubMed]
- Barrera-Figueroa, B.E.; Gao, L.; Diop, N.N.; Wu, Z.; Ehlers, J.D.; Roberts, P.A.; Close, T.J.; Zhu, J.K.; Liu, R. Identification and comparative analysis of drought-associated microRNAs in two cowpea genotypes. BMC Plant Biol. 2011, 11, 127. [Google Scholar] [CrossRef] [PubMed] [Green Version]
- Sunkar, R.; Zhu, J.K. Novel and stress-regulated microRNAs and other small RNAs from Arabidopsis. Plant Cell 2004, 16, 2001–2019. [Google Scholar] [CrossRef] [Green Version]
- Lu, X.Y.; Huang, X.L. Plant miRNAs and abiotic stress responses. Biochem. Biophys. Res. Commun. 2008, 368, 458–462. [Google Scholar] [CrossRef]
- Zhang, J.; Xu, Y.; Huan, Q.; Chong, K. Deep sequencing of Brachypodium small RNAs at the global genome level identifies microRNAs involved in cold stress response. BMC Genom. 2009, 10, 449. [Google Scholar] [CrossRef] [Green Version]
- Lv, D.K.; Bai, X.; Li, Y.; Ding, X.D.; Ge, Y.; Cai, H.; Ji, W.; Wu, N.; Zhu, Y.M. Profiling of cold-stress-responsive miRNAs in rice by microarrays. Gene 2010, 459, 39–47. [Google Scholar] [CrossRef]
- Xin, M.; Wang, Y.; Yao, Y.; Xie, C.; Peng, H.; Ni, Z.; Sun, Q. Diverse set of microRNAs are responsive to powdery mildew infection and heat stress in wheat (Triticum aestivum L.). BMC Plant Biol. 2010, 10, 123. [Google Scholar] [CrossRef] [Green Version]
- Cao, X.; Wu, Z.; Jiang, F.; Zhou, R.; Yang, Z. Identification of chilling stress-responsive tomato microRNAs and their target genes by high-throughput sequencing and degradome analysis. BMC Genom. 2014, 15, 26619. [Google Scholar] [CrossRef] [PubMed] [Green Version]
- Sihag, P.; Sagwal, V.; Kumar, A.; Balyan, P.; Mir, R.R.; Dhankher, O.P.; Kumar, U. Discovery of miRNAs and Development of Heat-Responsive miRNA-SSR Markers for Characterization of Wheat Germplasm for Terminal Heat Tolerance Breeding. Front. Genet. 2021, 12, 1336. [Google Scholar] [CrossRef] [PubMed]
- Sun, W.; Xu, X.H.; Wu, X.; Wang, Y.; Lu, X.; Sun, H.; Xie, X. Genome-wide identification of microRNAs and their targets in wild type and phyB mutant provides a key link between microRNAs and the phyB-mediated light signaling pathway in rice. Front. Plant Sci. 2015, 6, 372. [Google Scholar] [CrossRef] [PubMed] [Green Version]
- Li, H.; Liang, Z.; Ding, G.; Shi, L.; Xu, F.; Cai, H. A natural light/dark cycle regulation of carbon-nitrogen metabolism and gene expression in rice shoots. Front. Plant Sci. 2016, 7, 1318. [Google Scholar] [CrossRef] [PubMed] [Green Version]
- Martin, A.; Adam, H.; Díaz-Mendoza, M.; Źurczak, M.; González-Schain, N.D.; Suárez-López, P. Graft-transmissible induction of potato tuberization by the microRNA miR172. Development 2009, 136, 2873–2881. [Google Scholar] [CrossRef] [Green Version]
- Qiao, Y.; Zhang, J.; Zhang, J.; Wang, Z.; Ran, A.; Guo, H.; Wang, D.; Zhang, J. Integrated RNA-seq and sRNA-seq analysis reveals miRNA effects on secondary metabolism in Solanum tuberosum L. Mol. Genet. Genom. 2017, 292, 37–52. [Google Scholar] [CrossRef]
- Zhang, H.; He, H.; Wang, X.; Wang, X.; Yang, X.; Li, L.; Deng, X.W. Genome-wide mapping of the HY5-mediated gene networks in Arabidopsis that involve both transcriptional and post-transcriptional regulation. Plant J. 2011, 65, 346–358. [Google Scholar] [CrossRef]
- Sun, Z.; Li, M.; Zhou, Y.; Guo, T.; Liu, Y.; Zhang, H.; Fang, Y. Coordinated regulation of Arabidopsis microRNA biogenesis and red light signaling through Dicer-like 1 and phytochrome-interacting factor 4. PLoS Genet. 2018, 14, 7247. [Google Scholar] [CrossRef]
- Li, Y.; Varala, K.; Hudson, M.E. A survey of the small RNA population during far-red light-induced apical hook opening. Front. Plant Sci. 2014, 5, 156. [Google Scholar] [CrossRef] [Green Version]
- Dong, F.; Wang, C.; Dong, Y.; Hao, S.; Wang, L.; Sun, X.; Liu, S. Differential expression of microRNAs in tomato leaves treated with different light qualities. BMC Genom. 2020, 21, 37. [Google Scholar] [CrossRef] [Green Version]
- Zhao, B.; Ge, L.; Liang, R.; Li, W.; Ruan, K.; Lin, H.; Jin, Y. Members of miR-169 family are induced by high salinity and transiently inhibit the NF-YA transcription factor. BMC Mol. Biol. 2009, 10, 29. [Google Scholar] [CrossRef] [PubMed] [Green Version]
- Ding, D.; Zhang, L.; Wang, H.; Liu, Z.; Zhang, Z.; Zheng, Y. Differential expression of miRNAs in response to salt stress in maize roots. Ann. Bot. 2009, 103, 29. [Google Scholar] [CrossRef] [PubMed] [Green Version]
- Li, T.; Li, H.; Zhang, Y.X.; Liu, J.Y. Identification and analysis of seven H2O2-responsive miRNAs and 32 new miRNAs in the seedlings of rice (Oryza sativa L. ssp. indica). Nucleic Acids Res. 2011, 39, 2821. [Google Scholar] [CrossRef] [PubMed] [Green Version]
- Sunkar, R.; Kapoor, A.; Zhu, J.K. Posttranscriptional induction of two Cu/Zn superoxide dismutase genes in Arabidopsis is mediated by downregulation of miR398 and important for oxidative stress tolerance. Plant Cell 2006, 18, 2051–2065. [Google Scholar] [CrossRef] [PubMed] [Green Version]
- Sunkar, R.; Zhu, J.K. Micro RNAs and Short-interfering RNAs in Plants. J. Integr. Plant Biol. 2007, 49, 817–826. [Google Scholar] [CrossRef]
- Sunkar, R.; Li, Y.F.; Jagadeeswaran, G. Functions of microRNAs in plant stress responses. Trends Plant Sci. 2012, 17, 196–203. [Google Scholar] [CrossRef] [PubMed]
- Jagadeeswaran, G.; Saini, A.; Sunkar, R. Biotic and abiotic stress down-regulate miR398 expression in Arabidopsis. Planta 2009, 229, 1009–1014. [Google Scholar] [CrossRef]
- Jagadeeswaran, G.; Li, Y.F.; Sunkar, R. Redox signaling mediates the expression of a sulfate-deprivation-inducible microRNA395 in Arabidopsis. Plant J. 2014, 77, 85–96. [Google Scholar] [CrossRef] [Green Version]
- Kumar, R. Role of microRNAs in biotic and abiotic stress responses in crop plants. Appl. Biochem. Biotechnol. 2014, 174, 93–115. [Google Scholar] [CrossRef]
- Phillips, J.R.; Dalmay, T.; Bartels, D. The role of small RNAs in abiotic stress. FEBS Lett. 2007, 581, 3592–3597. [Google Scholar] [CrossRef]
- Suravajhala, P.; Kumar, A.; Pandeya, A.; Malik, G.; Sharma, M.; Kumari, H.P.; Kumar, S.A.; Gahlaut, V.; Gajula, M.N.V.P.; Singh, K.P.; et al. A web resource for nutrient use efficiency-related genes, quantitative trait loci and microRNAs in important cereals and model plants [version 1; referees: 2 approved]. F1000Research 2018, 7. [Google Scholar] [CrossRef] [Green Version]
- Zhang, B. MicroRNA: A new target for improving plant tolerance to abiotic stress. J. Exp. Bot. 2015, 66, 1749–1761. [Google Scholar] [CrossRef] [PubMed]
- Xie, F.; Wang, Q.; Sun, R.; Zhang, B. Deep sequencing reveals important roles of microRNAs in response to drought and salinity stress in cotton. J. Exp. Bot. 2015, 66, 789–804. [Google Scholar] [CrossRef] [PubMed] [Green Version]
- Eldem, V.; Çelikkol Akçay, U.; Ozhuner, E.; Bakir, Y.; Uranbey, S.; Unver, T. Genome-Wide Identification of miRNAs Responsive to Drought in Peach (Prunus persica) by High-Throughput Deep Sequencing. PLoS ONE 2012, 7, e50298. [Google Scholar] [CrossRef] [Green Version]
- Trindade, I.; Capitão, C.; Dalmay, T.; Fevereiro, M.P.; dos Santos, D.M. miR398 and miR408 are up-regulated in response to water deficit in Medicago truncatula. Planta 2009, 231, 705–716. [Google Scholar] [CrossRef]
- Wang, M.; Wang, Q.; Zhang, B. Response of miRNAs and their targets to salt and drought stresses in cotton (Gossypium hirsutum L.). Gene 2013, 530, 26–32. [Google Scholar] [CrossRef]
- Li, W.X.; Oono, Y.; Zhu, J.; He, X.J.; Wu, J.M.; Iida, K.; Lu, X.Y.; Cui, X.; Jin, H.; Zhu, J.K. The Arabidopsis NFYA5 Transcription Factor Is Regulated Transcriptionally and Posttranscriptionally to Promote Drought Resistance. Plant Cell 2008, 20, 2238. [Google Scholar] [CrossRef] [Green Version]
- Xu, Q.; He, Q.; Li, S.; Tian, Z. Molecular characterization of StNAC2 in potato and its overexpression confers drought and salt tolerance. Acta Physiol. Plant. 2014, 36, 1841–1851. [Google Scholar] [CrossRef]
- Jia, X.; Wang, W.X.; Ren, L.; Chen, Q.J.; Mendu, V.; Willcut, B.; Dinkins, R.; Tang, X.; Tang, G. Differential and dynamic regulation of miR398 in response to ABA and salt stress in Populus tremula and Arabidopsis thaliana. Plant Mol. Biol. 2009, 71, 51–59. [Google Scholar] [CrossRef]
- Shriram, V.; Kumar, V.; Devarumath, R.M.; Khare, T.S.; Wani, S.H. Micrornas as potential targets for abiotic stress tolerance in plants. Front. Plant Sci. 2016, 7, 817. [Google Scholar] [CrossRef]
- Luo, M.; Gao, Z.; Li, H.; Li, Q.; Zhang, C.; Xu, W.; Song, S.; Ma, C.; Wang, S. Selection of reference genes for miRNA qRT-PCR under abiotic stress in grapevine. Sci. Rep. 2018, 8, 444. [Google Scholar] [CrossRef] [PubMed]
- Tripathi, A.; Goswami, K.; Sanan-Mishra, N. Role of bioinformatics in establishing microRNAs as modulators of abiotic stress responses: The new revolution. Front. Physiol. 2015, 6, 286. [Google Scholar] [CrossRef] [PubMed] [Green Version]
- Kozomara, A.; Griffiths-Jones, S. miRBase: Annotating high confidence microRNAs using deep sequencing data. Nucleic Acids Res. 2014, 42, D68–D73. [Google Scholar] [CrossRef] [PubMed] [Green Version]
- Szcześniak, M.W.; Deorowicz, S.; Gapski, J.; Kaczyński, Ł.; Makałowska, I. miRNEST database: An integrative approach in microRNA search and annotation. Nucleic Acids Res. 2012, 40, D198–D204. [Google Scholar] [CrossRef] [PubMed]
- Zhang, Z.; Yu, J.; Li, D.; Zhang, Z.; Liu, F.; Zhou, X.; Wang, T.; Ling, Y.; Su, Z. PMRD: Plant microRNA database. Nucleic Acids Res. 2010, 38, D806–D813. [Google Scholar] [CrossRef] [PubMed] [Green Version]
- An, J.; Lai, J.; Sajjanhar, A.; Lehman, M.L.; Nelson, C.C. MiRPlant: An integrated tool for identification of plant miRNA from RNA sequencing data. BMC Bioinform. 2014, 15, 275. [Google Scholar] [CrossRef] [PubMed] [Green Version]
- Rhee, S.; Chae, H.; Kim, S. PlantMirnaT: miRNA and mRNA integrated analysis fully utilizing characteristics of plant sequencing data. Methods 2015, 83, 80–87. [Google Scholar] [CrossRef] [PubMed]
- Zhang, S.; Yue, Y.; Sheng, L.; Wu, Y.; Fan, G.; Li, A.; Hu, X.; Shangguan, M.; Wei, C. PASmiR: A literature-curated database for miRNA molecular regulation in plant response to abiotic stress. BMC Plant Biol. 2013, 13, 33. [Google Scholar] [CrossRef] [Green Version]
- Wu, W.; Wu, Y.; Hu, D.; Zhou, Y.; Hu, Y.; Chen, Y.; Chen, M. PncStress: A manually curated database of experimentally validated stress-responsive non-coding RNAs in plants. Database 2020, 2020, baaa001. [Google Scholar] [CrossRef] [Green Version]
- Breiman, L. Random Forests. Mach. Learn. 2001, 45, 5–32. [Google Scholar] [CrossRef] [Green Version]
- Jia, J.; Liu, Z.; Xiao, X.; Liu, B.; Chou, K.C. iPPBS-Opt: A Sequence-Based Ensemble Classifier for Identifying Protein-Protein Binding Sites by Optimizing Imbalanced Training Datasets. Molecules 2016, 21, 95. [Google Scholar] [CrossRef] [PubMed] [Green Version]
- Freund, Y.; Schapire, R.E. A Short Introduction to Boosting. J. Jpn. Soc. Artif. Intell. 1999, 14, 771–780. [Google Scholar]
- Liaw, A.; Wiener, M. Classification and Regression by randomForest. R News 2002, 2, 18–22. [Google Scholar]
- Chen, T.; Guestrin, C. XGBoost: A Scalable Tree Boosting System. arXiv 2016, arXiv:1603.02754. [Google Scholar]
- Alfaro, E.; Gáamez, M.; García, N. adabag: An R Package for Classification with Boosting and Bagging. J. Stat. Softw. 2013, 54, 1–35. [Google Scholar] [CrossRef] [Green Version]
- Luan, M.; Xu, M.; Lu, Y.; Zhang, L.; Fan, Y.; Wang, L. Expression of zma-miR169 miRNAs and their target ZmNF-YA genes in response to abiotic stress in maize leaves. Gene 2015, 555, 178–185. [Google Scholar] [CrossRef]
- Singh, I.; Smita, S.; Mishra, D.C.; Kumar, S.; Singh, B.K.; Rai, A. Abiotic stress responsive mirna-target network and related markers (SNP, SSR) in Brassica juncea. Front. Plant Sci. 2017, 8, 1943. [Google Scholar] [CrossRef] [Green Version]
- Barciszewska-Pacak, M.; Milanowska, K.; Knop, K.; Bielewicz, D.; Nuc, P.; Plewka, P.; Pacak, A.M.; Vazquez, F.; Karlowski, W.; Jarmolowski, A.; et al. Arabidopsis microRNA expression regulation in a wide range of abiotic stress responses. Front. Plant Sci. 2015, 6, 410. [Google Scholar] [CrossRef]
- Singh, D.K.; Mehra, S.; Chatterjee, S.; Purty, R.S. In silico identification and validation of miRNA and their DIR specific targets in Oryza sativa Indica under abiotic stress. Non-Coding RNA Res. 2020, 5, 167–177. [Google Scholar] [CrossRef]
- Wani, S.H.; Kumar, V.; Khare, T.; Tripathi, P.; Shah, T.; Ramakrishna, C.; Aglawe, S.; Mangrauthia, S.K. miRNA applications for engineering abiotic stress tolerance in plants. Biologia 2020, 75, 1063–1081. [Google Scholar] [CrossRef]
- Sunkar, R. MicroRNAs with macro-effects on plant stress responses. Semin. Cell Dev. Biol. 2010, 21, 805–811. [Google Scholar] [CrossRef] [PubMed]
- Kumar, A.; Chauhan, A.; Sharma, M.; Kompelli, S.K.; Gahlaut, V.; Ijaq, J.; Singh, K.P.; Gajula, M.P.; Suravajhala, P.; Balyan, H.S.; et al. Genome-Wide Mining, Characterization and Development of miRNA-SSRs in Arabidopsis thaliana. bioRxiv 2017, 203851. [Google Scholar] [CrossRef] [Green Version]
- Mathur, S.; Agrawal, D.; Jajoo, A. Photosynthesis: Response to high temperature stress. J. Photochem. Photobiol. B Biol. 2014, 137, 116–126. [Google Scholar] [CrossRef] [PubMed]
- Tyagi, S.; Kumar, A.; Gautam, T.; Pandey, R.; Rustgi, S.; Mir, R.R. Development and use of miRNA-derived SSR markers for the study of genetic diversity, population structure, and characterization of genotypes for breeding heat tolerant wheat varieties. PLoS ONE 2021, 16, e0231063. [Google Scholar] [CrossRef]
- Chipman, L.B.; Pasquinelli, A.E. miRNA Targeting: Growing beyond the Seed. Trends Genet. 2019, 35, 215–222. [Google Scholar] [CrossRef]
- Yan, Y.; Acevedo, M.; Mignacca, L.; Desjardins, P.; Scott, N.; Imane, R.; Quenneville, J.; Robitaille, J.; Feghaly, A.; Gagnon, E.; et al. The sequence features that define efficient and specific hAGO2-dependent miRNA silencing guides. Nucleic Acids Res. 2018, 46, 8181–8196. [Google Scholar] [CrossRef]
- Asefpour Vakilian, K. Machine learning improves our knowledge about miRNA functions towards plant abiotic stresses. Sci. Rep. 2020, 10, 3041. [Google Scholar] [CrossRef] [Green Version]
- Meher, P.K.; Sahu, T.K.; Banchariya, A.; Rao, A.R. DIRProt: A computational approach for discriminating insecticide resistant proteins from non-resistant proteins. BMC Bioinform. 2017, 18, 190. [Google Scholar] [CrossRef] [Green Version]
- Meher, P.K.; Sahu, T.K.; Gahoi, S.; Rao, A.R. ir-HSP: Improved recognition of heat shock proteins, their families and sub-types based on g-spaced di-peptide features and support vector machine. Front. Genet. 2018, 8, 235. [Google Scholar] [CrossRef] [Green Version]
- Meher, P.K.; Sahu, T.K.; Mohanty, J.; Gahoi, S.; Purru, S.; Grover, M.; Rao, A.R. nifPred: Proteome-wide identification and categorization of nitrogen-fixation proteins of diaztrophs based on composition-transition-distribution features using support vector machine. Front. Microbiol. 2018, 9, 1100. [Google Scholar] [CrossRef]
- Chen, W.; Lin, H.; Chou, K.C. Pseudo nucleotide composition or PseKNC: An effective formulation for analyzing genomic sequences. Mol. Biosyst. 2015, 11, 2620–2634. [Google Scholar] [CrossRef] [PubMed]
- Chen, W.; Tang, H.; Ye, J.; Lin, H.; Chou, K.C. iRNA-PseU: Identifying RNA pseudouridine sites. Mol. Ther. Nucleic Acids 2016, 5, e332. [Google Scholar] [CrossRef] [PubMed]
- Feng, P.; Ding, H.; Yang, H.; Chen, W.; Lin, H.; Chou, K.C. iRNA-PseColl: Identifying the Occurrence Sites of Different RNA Modifications by Incorporating Collective Effects of Nucleotides into PseKNC. Mol. Ther. Nucleic Acids 2017, 7, 155–163. [Google Scholar] [CrossRef] [PubMed] [Green Version]
- Wang, J.; Shan, G.; Duan, X.; Wen, B. Improved SVM-RFE feature selection method for multi-SVM classifier. In Proceedings of the 2011 International Conference on Electrical and Control Engineering, Yichang, China, 16–18 September 2011; pp. 1592–1595. [Google Scholar] [CrossRef]
- Hidalgo-Muñoz, A.R.; López, M.M.; Pereira, A.T.; Santos, I.M.; Tomé, A.M. Spectral turbulence measuring as feature extraction method from EEG on affective computing. Biomed. Signal Process. Control 2013, 6, 945–950. [Google Scholar] [CrossRef]
- Duan, K.B.; Rajapakse, J.C.; Wang, H.; Azuaje, F. Multiple SVM-RFE for gene selection in cancer classification with expression data. IEEE Trans. Nanobiosci. 2005, 4, 228–233. [Google Scholar] [CrossRef] [PubMed]
- Tang, Y.; Zhang, Y.-Q.; Huang, Z. Development of Two-Stage SVM-RFE Gene Selection Strategy for Microarray Expression Data Analysis. IEEE/ACM Trans. Comput. Biol. Bioinform. 2008, 4, 365–381. [Google Scholar] [CrossRef]
- Dao, F.Y.; Yang, H.; Su, Z.D.; Yang, W.; Wu, Y.; Ding, H.; Chen, W.; Tang, H.; Lin, H. Recent Advances in Conotoxin Classification by Using Machine Learning Methods. Molecules 2017, 22, 1057. [Google Scholar] [CrossRef] [PubMed] [Green Version]
- Mahadevan, S.; Shah, S.L.; Marrie, T.J.; Slupsky, C.M. Analysis of metabolomic data using support vector machines. Anal. Chem. 2008, 80, 7562–7570. [Google Scholar] [CrossRef]
- Lin, X.; Yang, F.; Zhou, L.; Yin, P.; Kong, H.; Xing, W.; Lu, X.; Jia, L.; Wang, Q.; Xu, G. A support vector machine-recursive feature elimination feature selection method based on artificial contrast variables and mutual information. J. Chromatogr. B. Analyt. Technol. Biomed. Life Sci. 2012, 910, 149–155. [Google Scholar] [CrossRef]
- Brown, M.P.S.; Grundy, W.N.; Lin, D.; Cristianini, N.; Sugnet, C.W.; Furey, T.S.; Ares, M.; Haussler, D. Knowledge-based analysis of microarray gene expression data by using support vector machines. Proc. Natl. Acad. Sci. USA 2000, 97, 262–267. [Google Scholar] [CrossRef] [PubMed] [Green Version]
- Ding, C.H.Q.; Dubchak, I. Multi-class protein fold recognition using support vector machines and neural networks. Bioinformatics 2001, 17, 349–358. [Google Scholar] [CrossRef] [PubMed] [Green Version]
- Guo, S.H.; Deng, E.Z.; Xu, L.Q.; Ding, H.; Lin, H.; Chen, W.; Chou, K.C. iNuc-PseKNC: A sequence-based predictor for predicting nucleosome positioning in genomes with pseudo k-tuple nucleotide composition. Bioinformatics 2014, 30, 1522–1529. [Google Scholar] [CrossRef] [PubMed] [Green Version]
- Chen, W.; Feng, P.M.; Deng, E.Z.; Lin, H.; Chou, K.C. iTIS-PseTNC: A sequence-based predictor for identifying translation initiation site in human genes using pseudo trinucleotide composition. Anal. Biochem. 2014, 462, 76–83. [Google Scholar] [CrossRef] [PubMed]
- Meher, P.K.; Mohapatra, A.; Satpathy, S.; Sharma, A.; Saini, I.; Pradhan, S.K.; Rai, A. PredCRG: A computational method for recognition of plant circadian genes by employing support vector machine with Laplace kernel. Plant Methods 2021, 17, 46. [Google Scholar] [CrossRef]
- Meher, P.K.; Satpathy, S. Improved recognition of splice sites in A. thaliana by incorporating secondary structure information into sequence-derived features: A computational study. 3 Biotech 2021, 11, 484. [Google Scholar] [CrossRef]
- Kozomara, A.; Birgaoanu, M.; Griffiths-Jones, S. miRBase: From microRNA sequences to function. Nucleic Acids Res. 2019, 47, D155–D162. [Google Scholar] [CrossRef]
- Huang, Y.; Niu, B.; Gao, Y.; Fu, L.; Li, W. CD-HIT Suite: A web server for clustering and comparing biological sequences. Bioinformatics 2010, 26, 680–682. [Google Scholar] [CrossRef]
- Chen, W.; Lei, T.Y.; Jin, D.C.; Lin, H.; Chou, K.C. PseKNC: A flexible web server for generating pseudo K-tuple nucleotide composition. Anal. Biochem. 2014, 456, 53–60. [Google Scholar] [CrossRef]
- Liu, B.; Liu, F.; Wang, X.; Chen, J.; Fang, L.; Chou, K.C. Pse-in-One: A web server for generating various modes of pseudo components of DNA, RNA, and protein sequences. Nucleic Acids Res. 2015, 43, W65. [Google Scholar] [CrossRef] [Green Version]
- Cortes, C.; Vapnik, V.; Saitta, L. Support-vector networks. Mach. Learn. 1995, 20, 273–297. [Google Scholar] [CrossRef]
- Meher, P.K.; Sahu, T.K.; Raghunandan, K.; Gahoi, S.; Choudhury, N.K.; Rao, A.R. HRGPred: Prediction of herbicide resistant genes with k-mer nucleotide compositional features and support vector machine. Sci. Rep. 2019, 9, 778. [Google Scholar] [CrossRef] [PubMed]
- Xiao, X.; Wang, P.; Chou, K.C. iNR-PhysChem: A sequence-based predictor for identifying nuclear receptors and their subfamilies via physical-chemical property matrix. PLoS ONE 2012, 7, e30869. [Google Scholar] [CrossRef] [PubMed] [Green Version]
- Chen, W.; Feng, P.M.; Lin, H.; Chou, K.C. iRSpot-PseDNC: Identify recombination spots with pseudo dinucleotide composition. Nucleic Acids Res. 2013, 41, e68. [Google Scholar] [CrossRef] [PubMed] [Green Version]
- Picardi, E.; D’Antonio, M.; Carrabino, D.; Castrignanò, T.; Pesole, G. ExpEdit: A webserver to explore human RNA editing in RNA-Seq experiments. Bioinformatics 2011, 27, 1311–1312. [Google Scholar] [CrossRef] [PubMed] [Green Version]
- Bahn, J.H.; Lee, J.H.; Li, G.; Greer, C.; Peng, G.; Xiao, X. Accurate identification of A-to-I RNA editing in human by transcriptome sequencing. Genome Res. 2012, 22, 142. [Google Scholar] [CrossRef] [Green Version]
- Misc Functions of the Department of Statistics, Probability Theory Group (Formerly: E1071); [R Package e1071 Version 1.7-9]; TU Wien: Vienna, Austria, 2021.
- Aksu, Y.; Miller, D.J.; Kesidis, G.; Yang, Q.X. Margin-maximizing feature elimination methods for linear and nonlinear kernel-based discriminant functions. IEEE Trans. Neural Netw. 2010, 21, 701–717. [Google Scholar] [CrossRef]
- Huang, M.L.; Hung, Y.H.; Lee, W.M.; Li, R.K.; Jiang, B.R. SVM-RFE based feature selection and taguchi parameters optimization for multiclass SVM Classifier. Sci. World J. 2014, 2014, 795624. [Google Scholar] [CrossRef]
- Guyon, I.; Weston, J.; Barnhill, S.; Vapnik, V. Gene Selection for Cancer Classification using Support Vector Machines. Mach. Learn. 2002, 46, 389–422. [Google Scholar] [CrossRef]
- Das, P.; Roychoudhury, S.; Tripathy, S. Canadian Journal of Biotechnology Category: Bioinformatics sigFeature: An R-package for significant feature selection using SVM-RFE & t-statistic. Can. J. Biotech. 2017, 1. [Google Scholar] [CrossRef]
- Henderson, J.; Salzberg, S.; Fasman, K.H. Finding genes in DNA with a Hidden Markov Model. J. Comput. Biol. 1997, 4, 127–141. [Google Scholar] [CrossRef] [Green Version]
- Geras, K.J.; Sutton, C. Multiple-source cross-validation. In Proceedings of the 30th International Conference on International Conference on Machine Learning, Atlanta, GA, USA, 16–21 June 2013; pp. 1292–1300. [Google Scholar]
- Fawcett, T. An introduction to ROC analysis. Pattern Recognit. Lett. 2006, 27, 861–874. [Google Scholar] [CrossRef]
- Davis, J.; Goadrich, M. The Relationship Between Precision-Recall and ROC Curves. In Proceedings of the 23rd International Conference on Machine Learning, Pittsburgh, PA, USA, 25–29 June 2006. [Google Scholar]
- Xiao, X.; Min, J.L.; Lin, W.Z.; Liu, Z.; Cheng, X.; Chou, K.C. iDrug-Target: Predicting the interactions between drug compounds and target proteins in cellular networking via benchmark dataset optimization approach. J. Biomol. Struct. Dyn. 2015, 33, 2221–2233. [Google Scholar] [CrossRef] [PubMed]
- Liu, B.; Yang, F.; Chou, K.C. 2L-piRNA: A Two-Layer Ensemble Classifier for Identifying Piwi-Interacting RNAs and Their Function. Mol. Ther. Nucleic Acids 2017, 7, 267. [Google Scholar] [CrossRef] [PubMed] [Green Version]


Publisher’s Note: MDPI stays neutral with regard to jurisdictional claims in published maps and institutional affiliations. |
© 2022 by the authors. Licensee MDPI, Basel, Switzerland. This article is an open access article distributed under the terms and conditions of the Creative Commons Attribution (CC BY) license (https://creativecommons.org/licenses/by/4.0/).