Article

Phytoglobin Expression Alters the Na+/K+ Balance and Antioxidant Responses in Soybean Plants Exposed to Na2SO4

1
Department of Plant Science, University of Manitoba, Winnipeg, MB R3T 2N2, Canada
2
Botany and Microbiology Department, Faculty of Science, Kafrelsheikh University, Kafrelsheikh 33516, Egypt
3
Department of Botany and Microbiology, Faculty of Science, Tanta University, Tanta 31527, Egypt
4
Department of Biological Sciences, University of Manitoba, Winnipeg, MB R3T 2N2, Canada
*
Author to whom correspondence should be addressed.
Int. J. Mol. Sci. 2022, 23(8), 4072; https://doi.org/10.3390/ijms23084072
Submission received: 9 February 2022 / Revised: 1 April 2022 / Accepted: 2 April 2022 / Published: 7 April 2022
(This article belongs to the Special Issue Nitric Oxide Signalling and Metabolism in Plants)

Abstract

:
Soybean (Glycine max) is an economically important crop which is very susceptible to salt stress. Tolerance to Na2SO4 stress was evaluated in soybean plants overexpressing or suppressing the phytoglobin GmPgb1. Salt stress depressed several gas exchange parameters, including the photosynthetic rate, caused leaf damage, and reduced the water content and dry weights. Lower expression of respiratory burst oxidase homologs (RBOHB and D), as well as enhanced antioxidant activity, resulting from GmPgb1 overexpression, limited ROS-induced damage in salt-stressed leaf tissue. The leaves also exhibited higher activities of the H2O2-quenching enzymes, catalase (CAT) and ascorbate peroxidase (APX), as well as enhanced levels of ascorbic acid. Relative to WT and GmPgb1-suppressing plants, overexpression of GmPgb1 attenuated the accumulation of foliar Na+ and exhibited a lower Na+/K+ ratio. These changes were attributed to the induction of the Na+ efflux transporter SALT OVERLY SENSITIVE 1 (SOS1) limiting Na+ intake and transport and the inward rectifying K+ channel POTASSIUM TRANSPORTER 1 (AKT1) required for the maintenance of the Na+/K+ balance.

Graphical Abstract

1. Introduction

Salinity influences plant growth and development and has negative effects on productivity [1]. Occurring virtually under all climatic conditions as a result of natural events and human practices, salinity is more prominent in arid environments where the discrepancy between the plant demand for water and the water provided by precipitation results in the accumulation of minerals in the soil [2]. It is estimated that about 20% of irrigated land is salt-affected [3], and plant survival is dependent on the salinity tolerance of the species. Soybean (Glycine max), a valuable source of proteins and oils, is especially susceptible to high salt concentrations, and several desirable agronomic traits during both vegetative and reproductive stages are severely affected [4]. Among the different stages of development, seedlings are the most vulnerable to salt stress, as demonstrated by substantial growth retardation which compromises the subsequent phases of development and, ultimately, plant productivity [5].
Plants exposed to salinity experience several types of stress including osmotic, ionic, and oxidative stress. Osmotic stress arises from a reduction of the soil’s osmotic potential, which impairs the ability of plants to absorb water [6]. Ionic stress occurs as a result of toxic accumulation of ions, especially of Na+, which contributes to mineral imbalance and nutrient deficiency, as well as damage of cellular components [7]. Oxidative stress is caused by excessive accumulation of reactive oxygen species (ROS) causing cellular damage [8].
The combination of these effects leads to two temporally separated responses. The initial inhibition of growth, occurring within hours as a result of depressed cell elongation and decreased stomatal conductance, is followed by damage resulting from nutritional imbalance and oxidative stress [9,10]. Therefore, mitigation of nutritional imbalance through maintenance of ion homeostasis and attenuation of oxidative stress through the activation of antioxidant responses are desirable traits in salinity tolerance [11], also reported in soybean [5].
The main factor contributing to salinity stress is Na+, which alters water management, damages cellular organelles and membranes, and impedes energetic and photosynthetic processes [12]. Besides depressing the activity of many enzymes involved in the synthesis of chlorophyll, Na+ impairs components of the photosynthetic electron transport chain [13,14] and proteins required for the reduction of CO2 [15]. Many of these effects have been linked to the Na+ disturbance in the cellular level of K+ which is required in many photosynthetic functions [16]. Noxious levels of Na+, in fact, not only competitively inhibit the K+ influx, but also induce the K+ efflux through depolarization of plasma membranes [17]. Therefore, maintenance of a low Na+/K+ ratio through the retention of cellular K+ and/or exclusion of Na+ from sensitive tissues is a desirable trait of salt tolerance [18]. This notion is best exemplified by the acquired tolerance to salinity resulting from supplementation of K+ or exclusion of cellular Na+ through the upregulation of Na+ efflux transporters [19,20,21,22].
Besides altering the K+ homeostasis, excess Na+ causes oxidative stress through accumulation of reactive oxygen species (ROS) [8]. A soybean Na+/H+ antiporter, SALT-OVERLY SENSITIVE 1 (SOS1), alleviated toxicity by limiting the Na+ accumulation in leaves [22]. Overexpression of SOS1 also mitigated oxidative stress resulting from ROS accumulation [22]. Required at low levels to regulate many aspects of growth and development, ROS can become noxious if they exceed physiological thresholds, as observed during different conditions of stress, including salinity [23]. Elevated levels of ROS alter the function of membranes by oxidizing fatty acids and lipids and cause inhibition of enzymes and damage to nucleic acids. If not attenuated, these effects culminate in cell death [24,25], as also reported in soybean plants grown under saline conditions [5].
Cellular ROS homeostasis is modulated by their synthesis, mainly through the NADPH oxidase complex, and their scavenging through the antioxidant machinery with glutathione and ascorbate acting as major antioxidants [26]. Soybean plants exposed to salt stress exhibit a rapid increase in the activities of both superoxide dismutase (SOD) and catalase (CAT) [22] and major changes in the activity of the enzymes participating in the ascorbate–glutathione redox system [5]. An enhanced antioxidant system in response to salinity is, thus, a major component in dealing with stress [5].
Among the modulators of ROS and antioxidant responses is nitric oxide (NO) [27]. Overproduction of NO during several stress conditions such as hypoxia or water deficit augments ROS and depresses the activities of several antioxidant enzymes, thus triggering cellular and tissue damage which compromise plant survival [28,29,30]. Nitric oxide also modulates the Na+/K+ homeostasis during salinity stress through regulation of the inward rectifying K+ channel POTASSIUM TRANSPORTER 1 (AKT1), albeit with contrasting results [31,32]. In these studies, cellular NO levels were modulated using pharmacological applications, i.e., NO donors or scavengers, which pose some challenges when interpreting the results due to uniformity of applications and duration of the effect of treatment [33]. The same authors acknowledged that the mechanisms of NO action in salinity stress could be better analyzed using a transgenic approach.
Modulating NO can be achieved using transgenic plants with different levels of phytoglobins (Pgbs); plant proteins known for their NO scavenging properties [34]. Induced at the onset of abiotic and biotic stress, Pgbs have been shown to play a protective role by attenuating oxidative stress through cell- and tissue-specific suppression of NO [28,30,35,36]. Overexpression of the soybean GmPgb1 mitigated the growth inhibition of waterlogging [37] and drought [38] through reduction of NO, ROS, and oxidative stress. To further our knowledge on the function of Pgb1 as a stress attenuator, we examined the behavior of previously characterized soybean plants overexpressing or downregulating GmPgb1 [37] to Na2SO4 stress. It is hypothesized that during salt stress, overexpression of GmPgb1 attenuates the depression of several morphophysiological parameters through limitation of ROS-induced oxidative damage and Na+ accumulation. To address this hypothesis, we measured biomass, water content, leaf damage, and K+ and Na+ concentrations, as well as photosynthetic gas exchange parameters and the enzymes related to oxidative stress known to be influenced by salinity.

2. Results

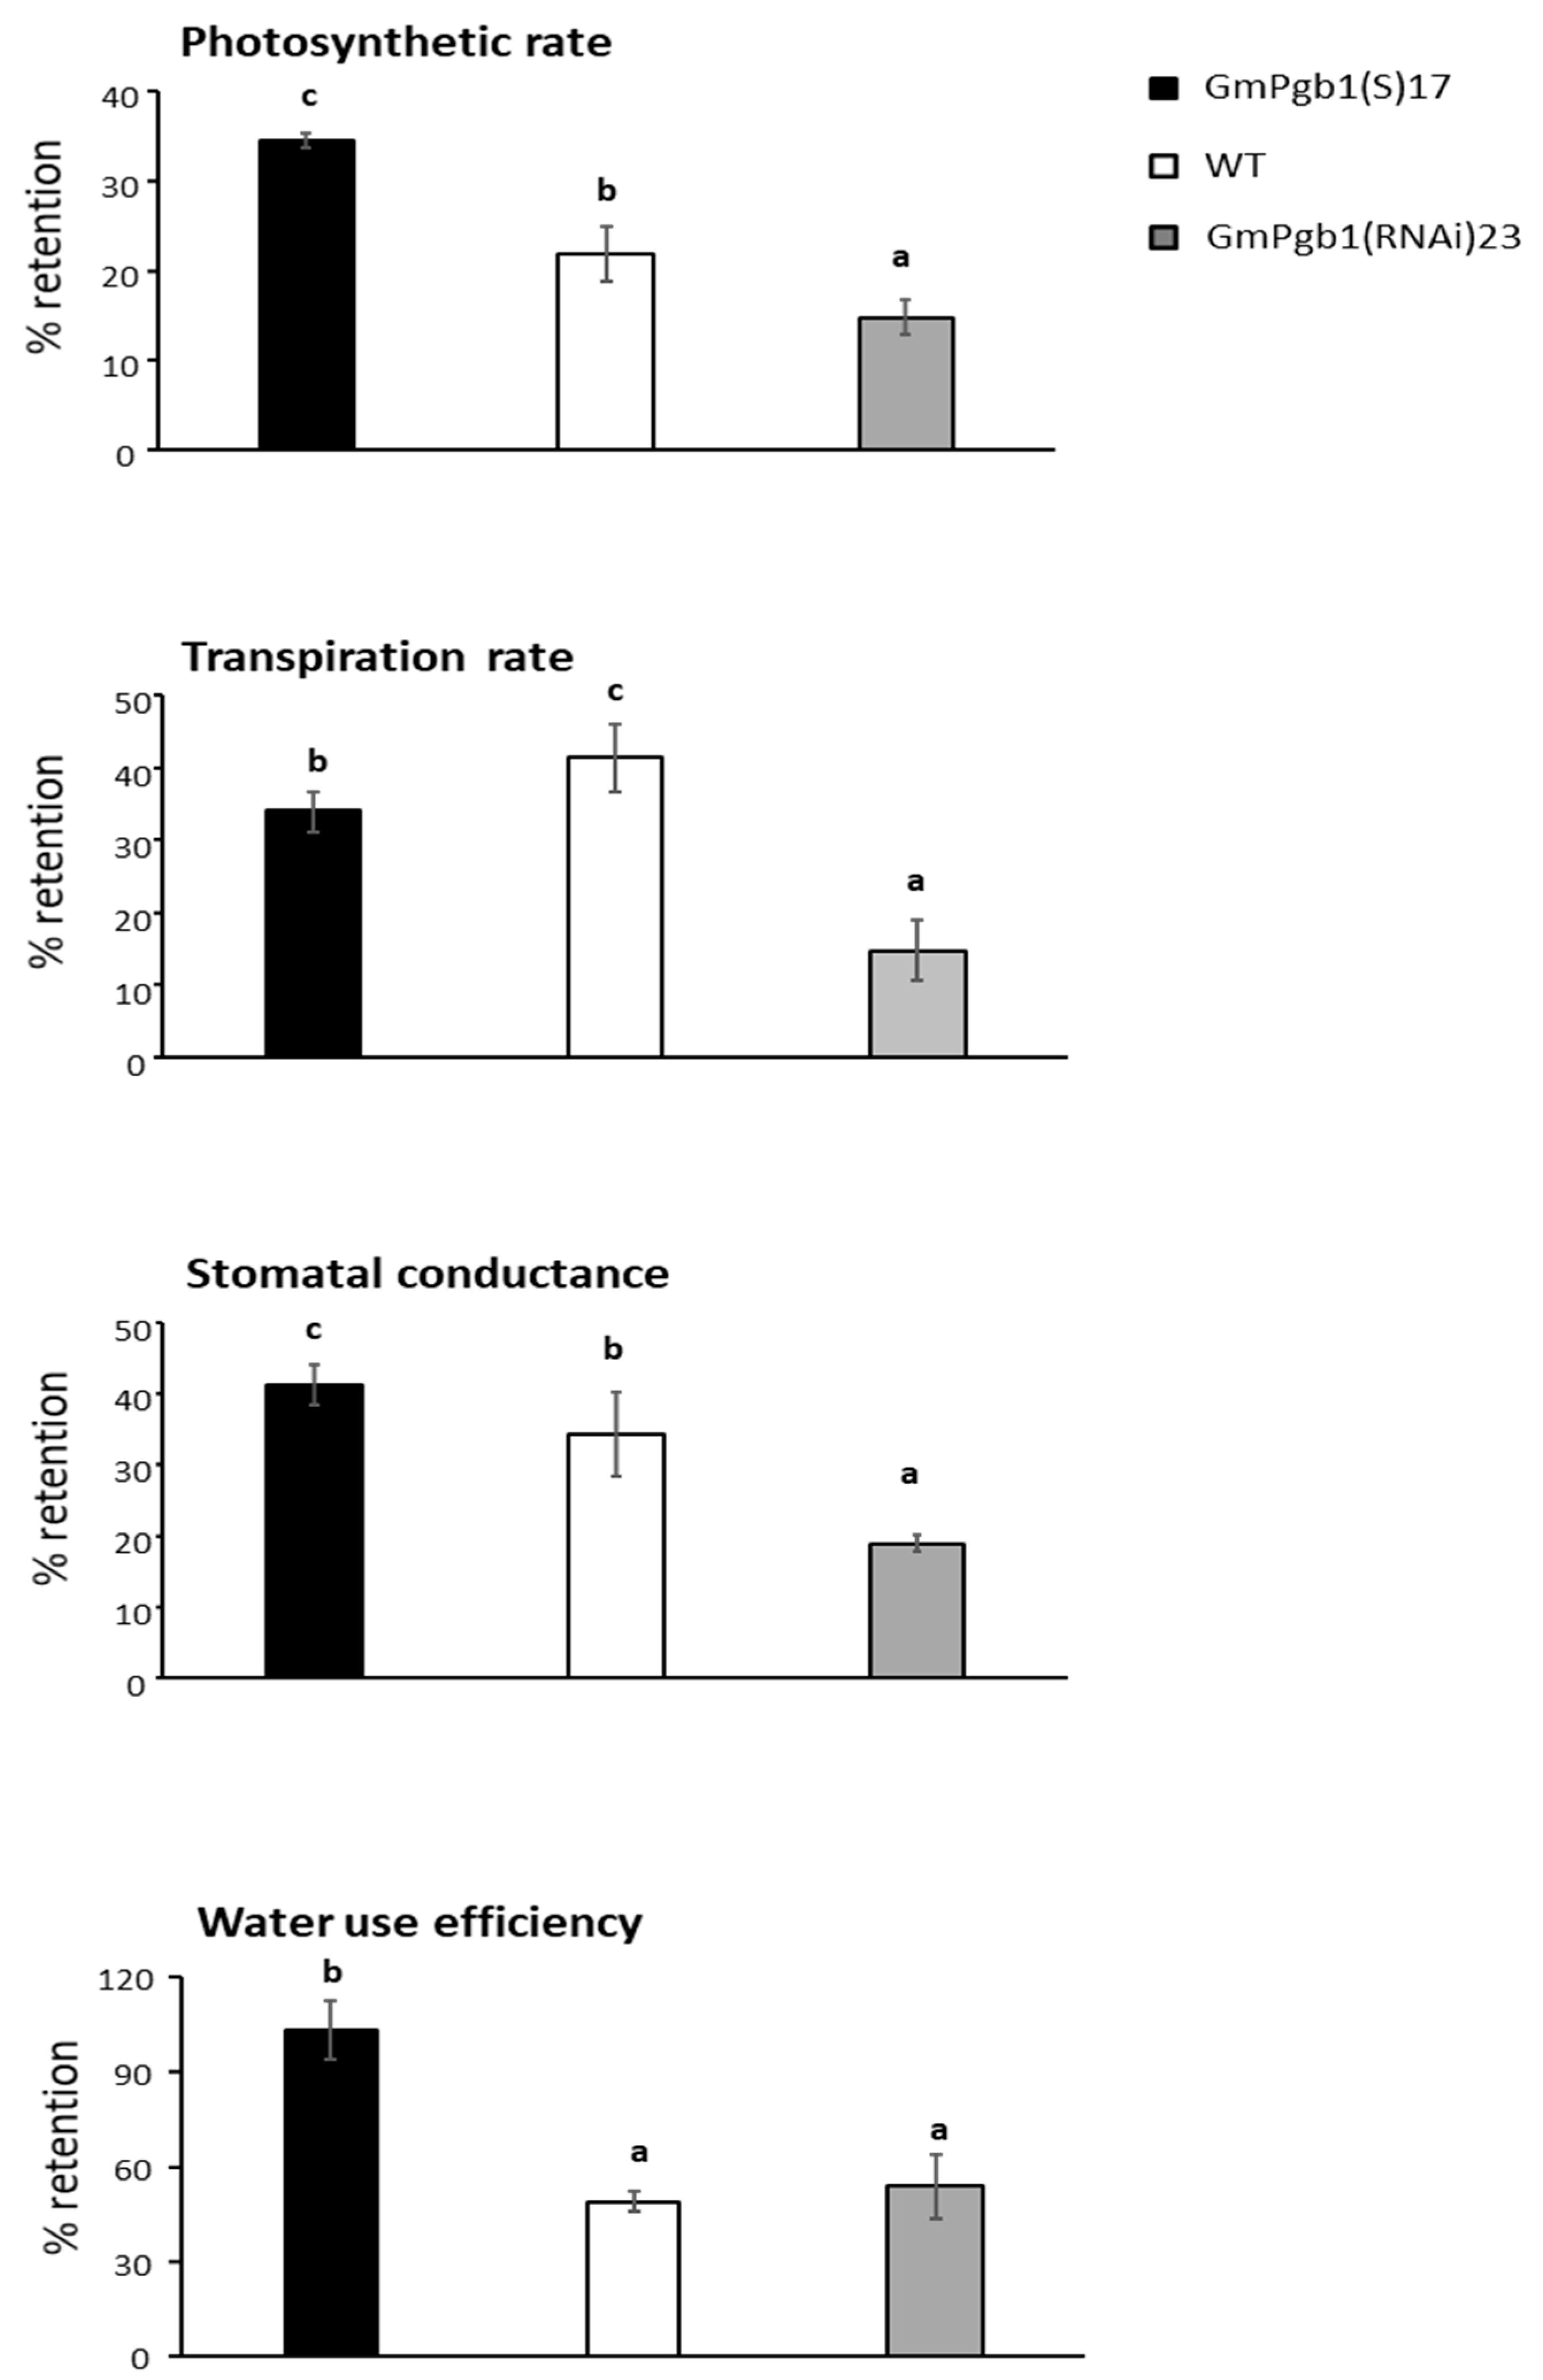
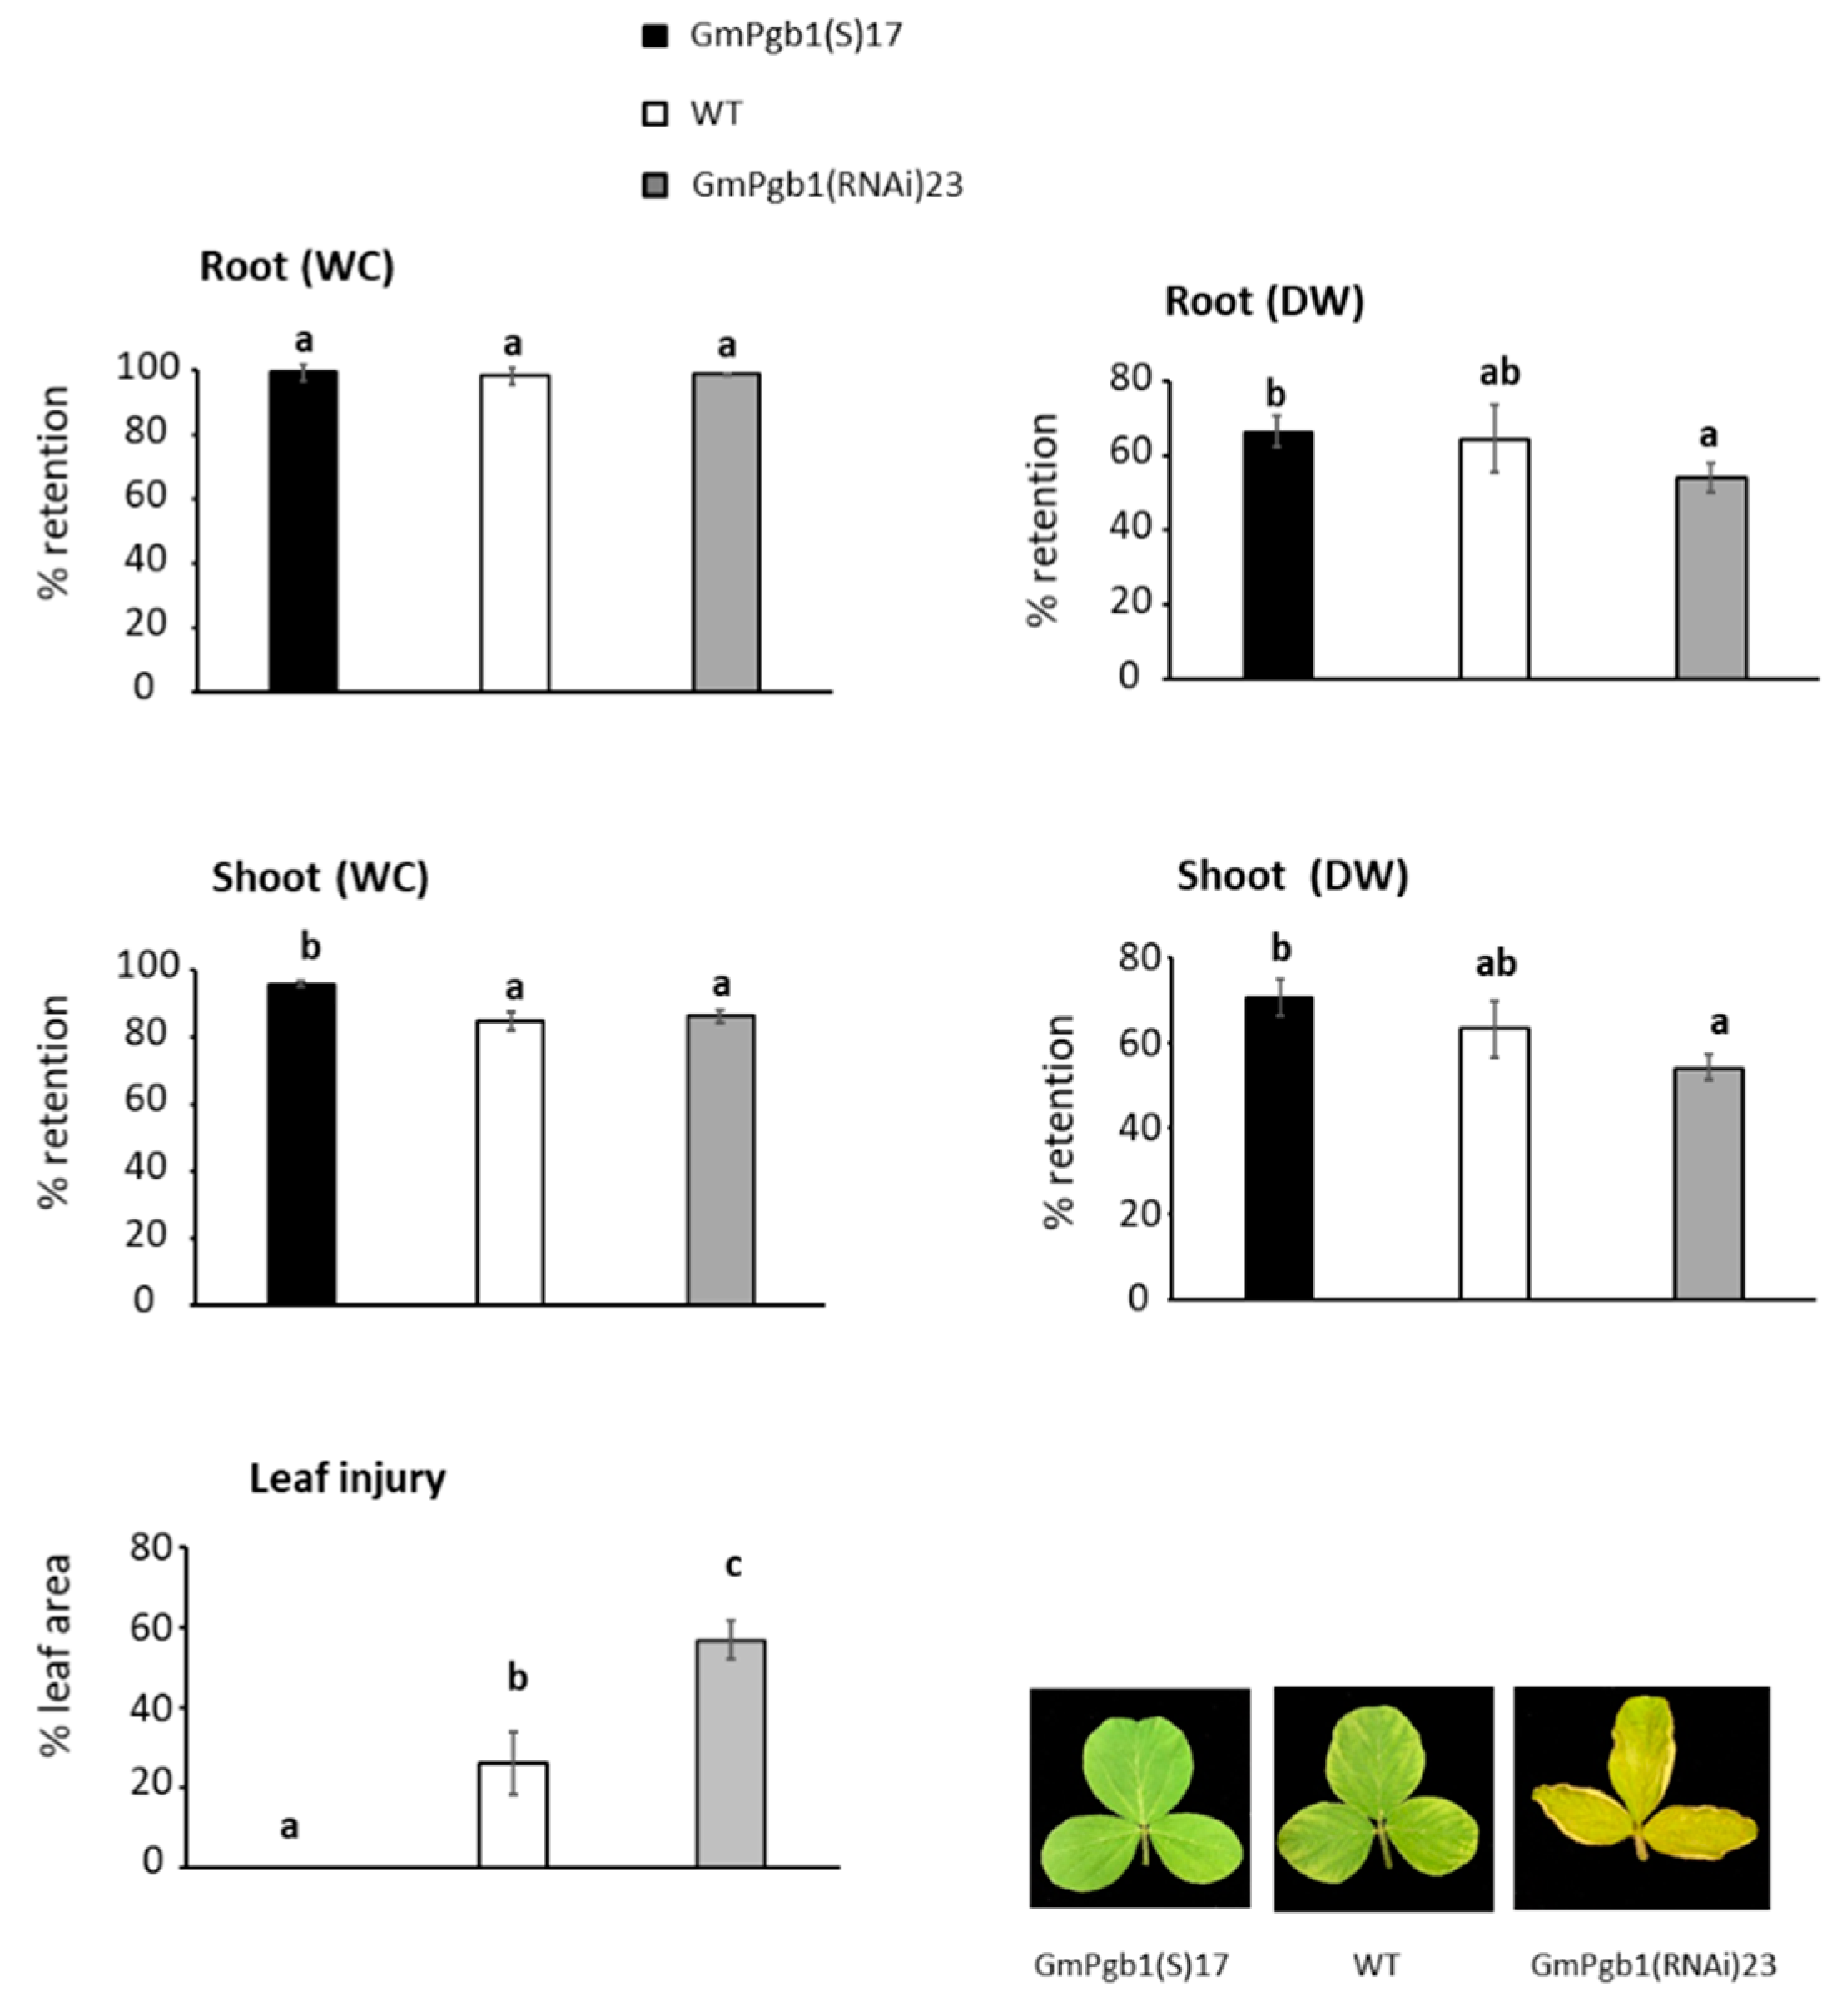
2.1. Overexpression of GmPgb1 Augments Tolerance to Salinity Stress

The transcript levels of GmPgb1 during Na2SO4 stress were measured in the WT line and in previously characterized lines [37] overexpressing (GmPgb1(S)17) or downregulating (GmPgb1(RNAi)23) GmPgb1. Salinity gradually augmented the GmPgb1 transcripts in WT roots and leaves, with a marked increment observed in the latter between 6 and 12 h (Figure 1). The increase in GmPgb1 in leaves trailed the increase in roots by approximately 6 h. The GmPgb1 overexpression resulted in an approximately six-fold increase in root transcripts and an approximately twelve-fold increase in leaf transcripts, likely reflecting the relatively low base levels of transcripts in leaves compared to roots of non-transformed plant materials [38]. The RNAi line did not completely repress the induction of GmPgb1 in roots whereas it did repress the leaf GmPgb1 expression.
Differences in photosynthetic parameters between the lines were clearly detectable after 24 h of Na2SO4 treatment. In leaves of WT plants, salinity stress depressed the photosynthetic rate, the transpiration rate, the stomatal conductance, and the water use efficiency by more than 50% (Figure 2). With the exclusion of transpiration, leaves overexpressing GmPgb1 exhibited a higher retention of gas exchange parameters. The GmPgb1(RNAi)23 line had the lowest retention of the photosynthetic rate, the transpiration, and the stomatal conductance relative to the WT (Figure 2). Salinity also induced the closure of the stomata (Supplemental Figure S1), as evidenced by the reduced stomatal conductance. This effect was mitigated in leaves of the GmPgb1(S)17 line. During stress, reduction in the photosynthetic rate is often concomitant to the degradation of thylakoid-associated protein complexes [39]. The transcript levels of the selected genes known to be sensitive to abiotic stress and involved in the formation of photosystem I (PsaA, PsaB, and LHCA), cytochrome B6F (cylB6F), and photosystem II (PsbA, PsbB, PsbC, and PsbD) complexes were measured at 24 h. Except for LHCA, the relative transcript levels of all the genes, comparable between genotypes under control conditions, decreased in leaves of the WT plants exposed to Na2SO4 (Supplemental Figure S2). This decrease was mitigated by the overexpression of GmPgb1. Relative to the WT, GmPgb1(RNAi)23 leaves exhibited lower levels of PsaA, PsbB, and PsbC (Supplemental Figure S2).
Morphological differences between the lines were visible after seven days of stress. Overexpression of GmPgb1 limited the Na2SO4 depression of the shoot water content (WC) and the root and shoot dry weight, which were more severe in the WT and GmPgb1(RNAi)23 lines (Figure 3). Leaf injury, not noticeable in leaves of the GmPgb1(S)17 line exposed to salinity for seven days, was apparent in the other two lines, and especially in leaves of the GmPgb1(RNAi)23 plants (Figure 3).

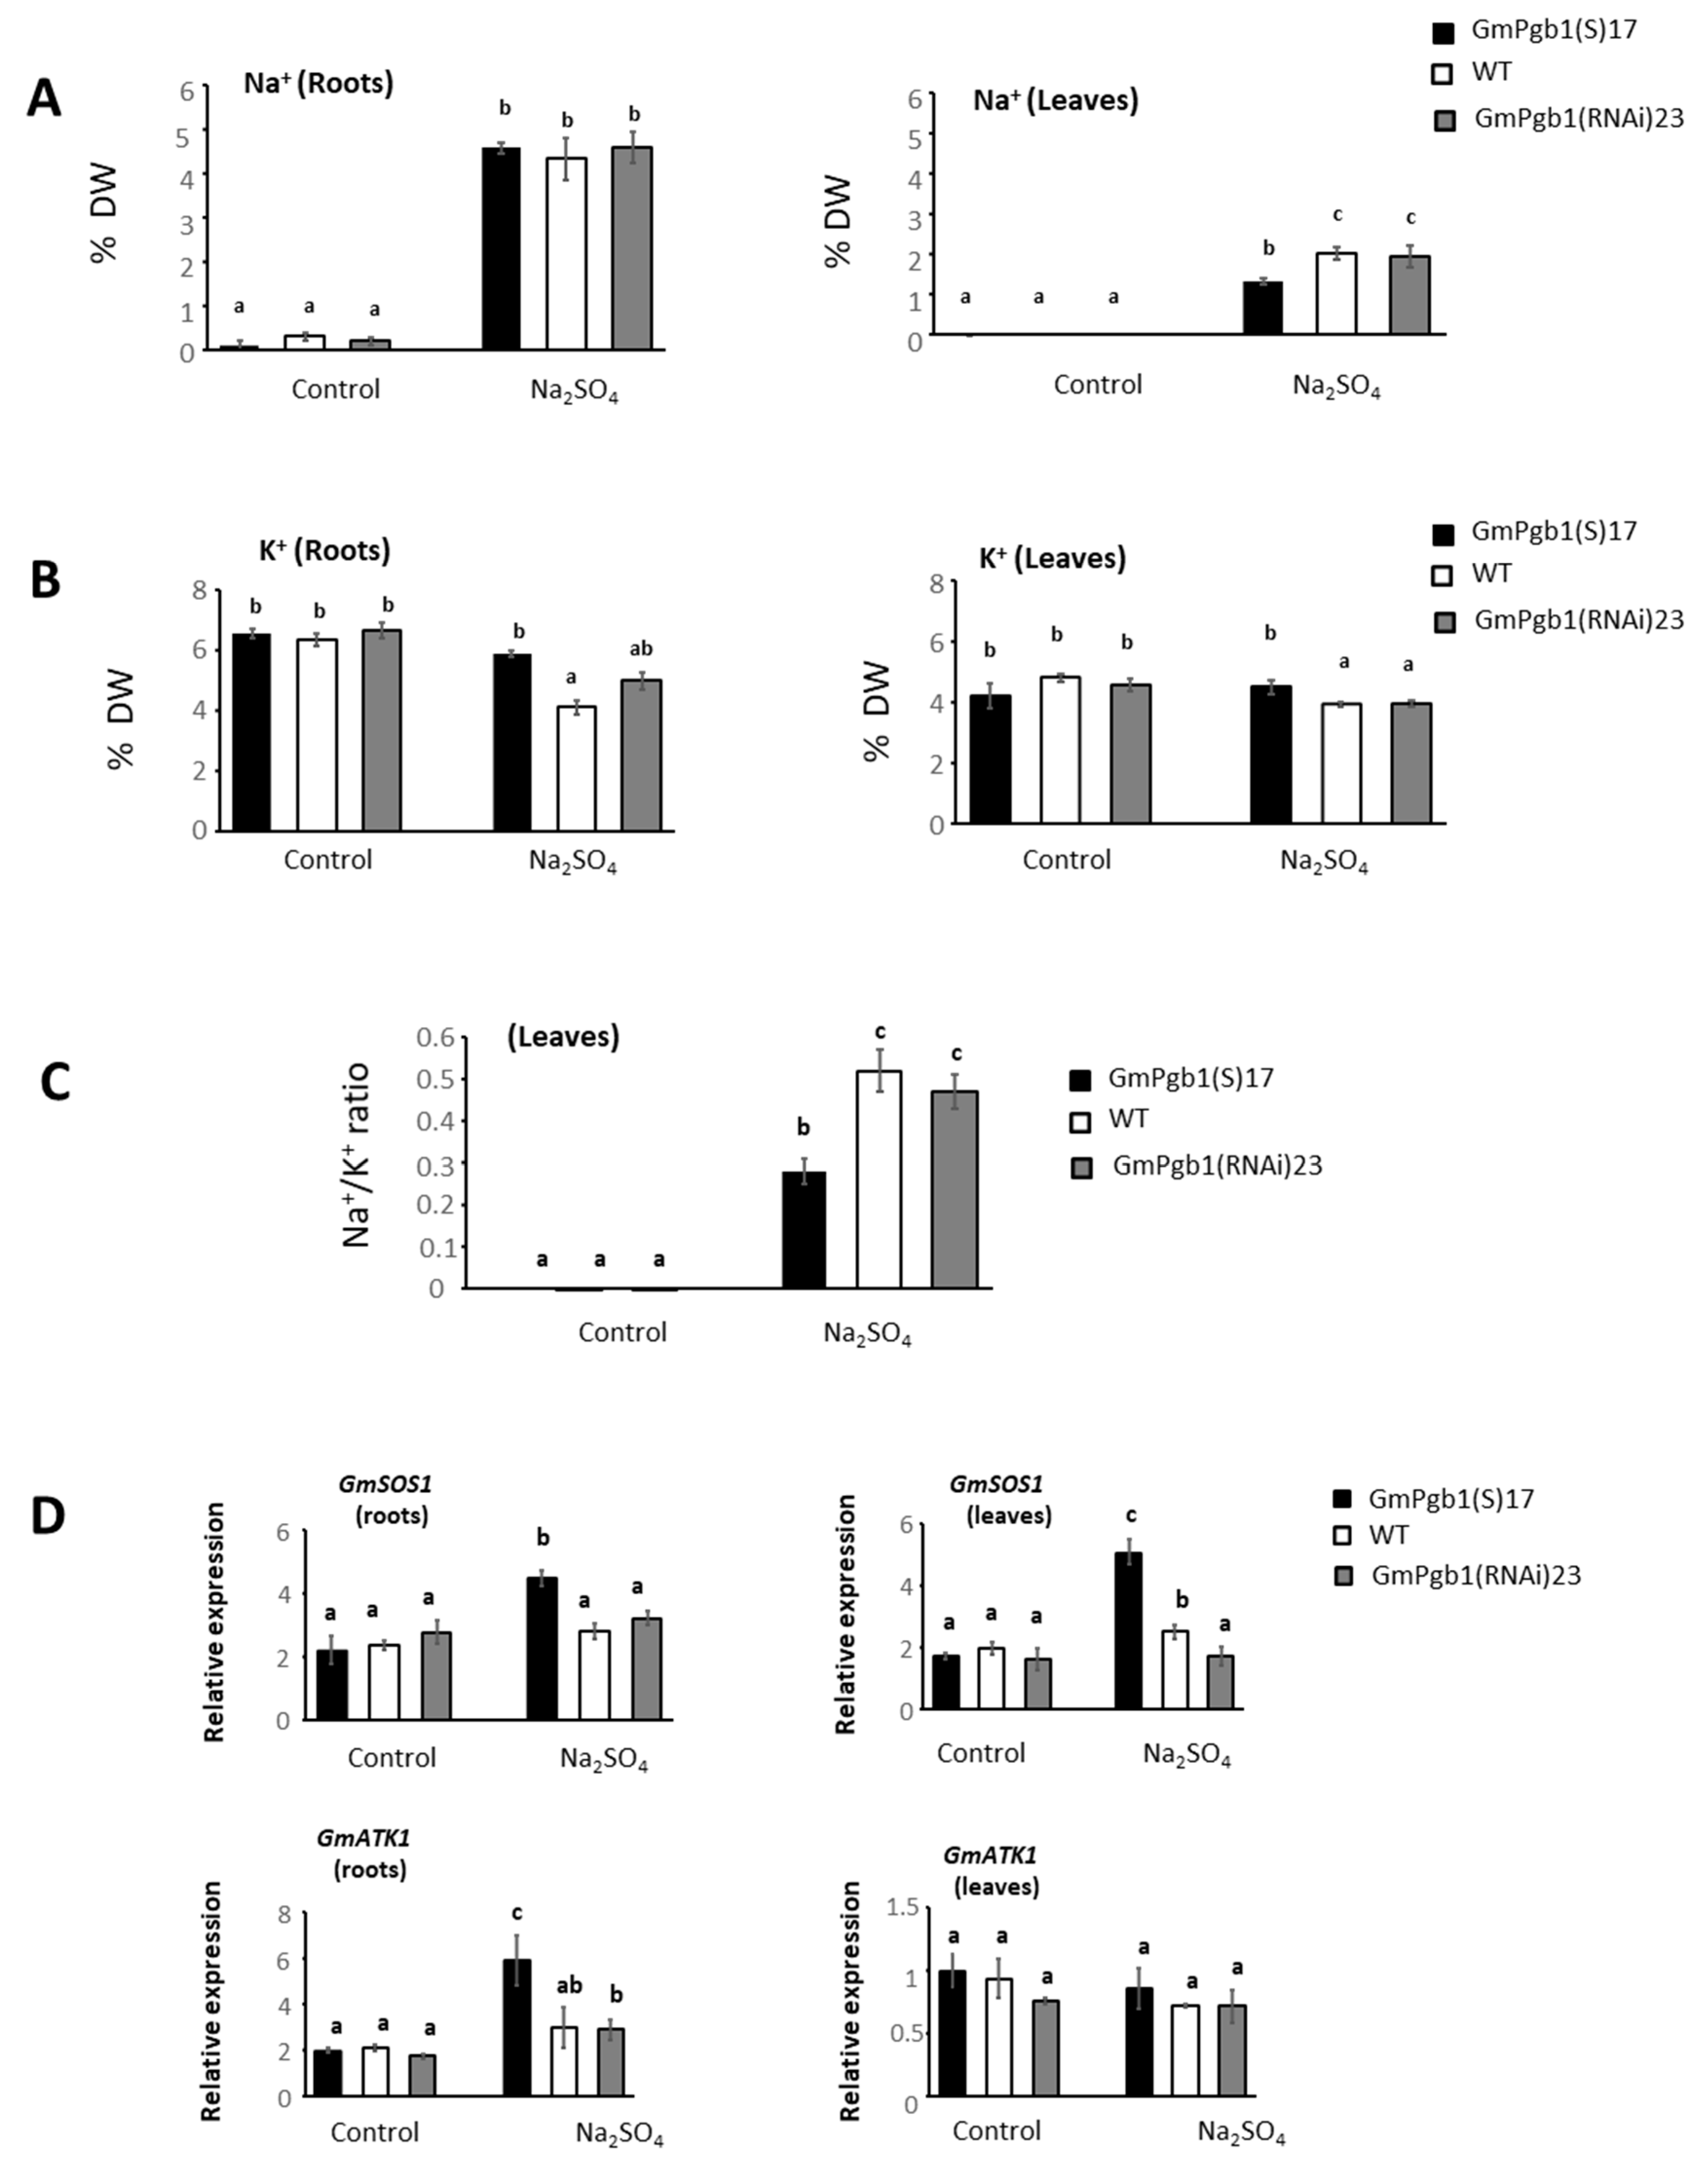
2.2. Na+ and K+ Accumulation during Salinity Stress Is Influenced by GmPgb1

Depression of the photosynthetic rate and leaf injury during salinity stress are often related to the toxicity of the Na+ [13,14] accumulating in leaves and disturbing the homeostasis of K+ needed in several photosynthetic functions [16]. Salt stress augmented root and leaf Na+ in all the genotypes, but the increment in leaves was reduced in plants overexpressing GmPgb1 (Figure 4A). The level of K+ was generally reduced by Na2SO4 in both organs, and the reduction was abolished when GmPgb1 was overexpressed (Figure 4B). Because of these changes, the foliar Na+/K+ ratio after 24 h of salt stress was lower in the leaves overexpressing GmPgb1 relative to those of WT and GmPgb1(RNAi)23 plants (Figure 4C)
To further understand the mechanisms for the differential accumulation of Na+ and K+, we measured the expression of two key genes involved in Na+ and K+ transport: the Na+ efflux transporter SALT-OVERLY SENSITIVE 1 (SOS1) limiting the Na+ intake in roots and its long-distance movement [16] and the inward-rectifying K+ channel AKT1 required for the maintenance of the Na+/K+ ratio [40]. The expression of SOS1, which remained unchanged in GmPgb1(RNAi)23 roots and leaves following imposition of Na2SO4 stress, increased in both organs of the plants overexpressing GmPgb1 (Figure 4D). A small significant increase also occurred in WT leaves. Salinity also elevated the expression of AKT1 in the roots of GmPgb1(S)17 plants.

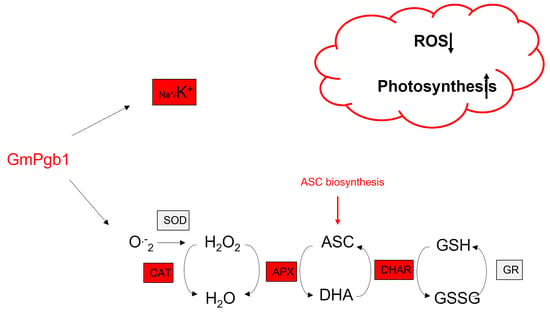
2.3. Na2SO4 Accumulation of Foliar H2O2 and Lipid Peroxidation Are Mitigated by the Overexpression of GmPgb1

A consequence of Na+ toxicity is the overproduction of ROS causing severe cellular damage including peroxidation of lipid membranes, which can be estimated by the level of MDA [41]. In both the WT and GmPgb1(RNAi)23 leaves, exposure to salinity for 24 h elevated foliar H2O2 and MDA (Figure 5A). Salinity increased both H2O2 and MDA, whereas in the stressed plants overexpressing GmPgb1, the increase in H2O2 was limited, and the level of MDA was not different from the control (Figure 5).
A similar pattern was observed for the expression of two respiratory burst oxidase homologs (RBOHB and D), components of the ROS generator NADPH oxidase enzyme [42] and indicators of ROS production in soybean [37]. The increase in foliar expression of both genes, more apparent after 6 h of treatment, was in fact attenuated by the overexpression of GmPgb1 (Figure 5B). No differences between the genotypes were observed for RBOHG.

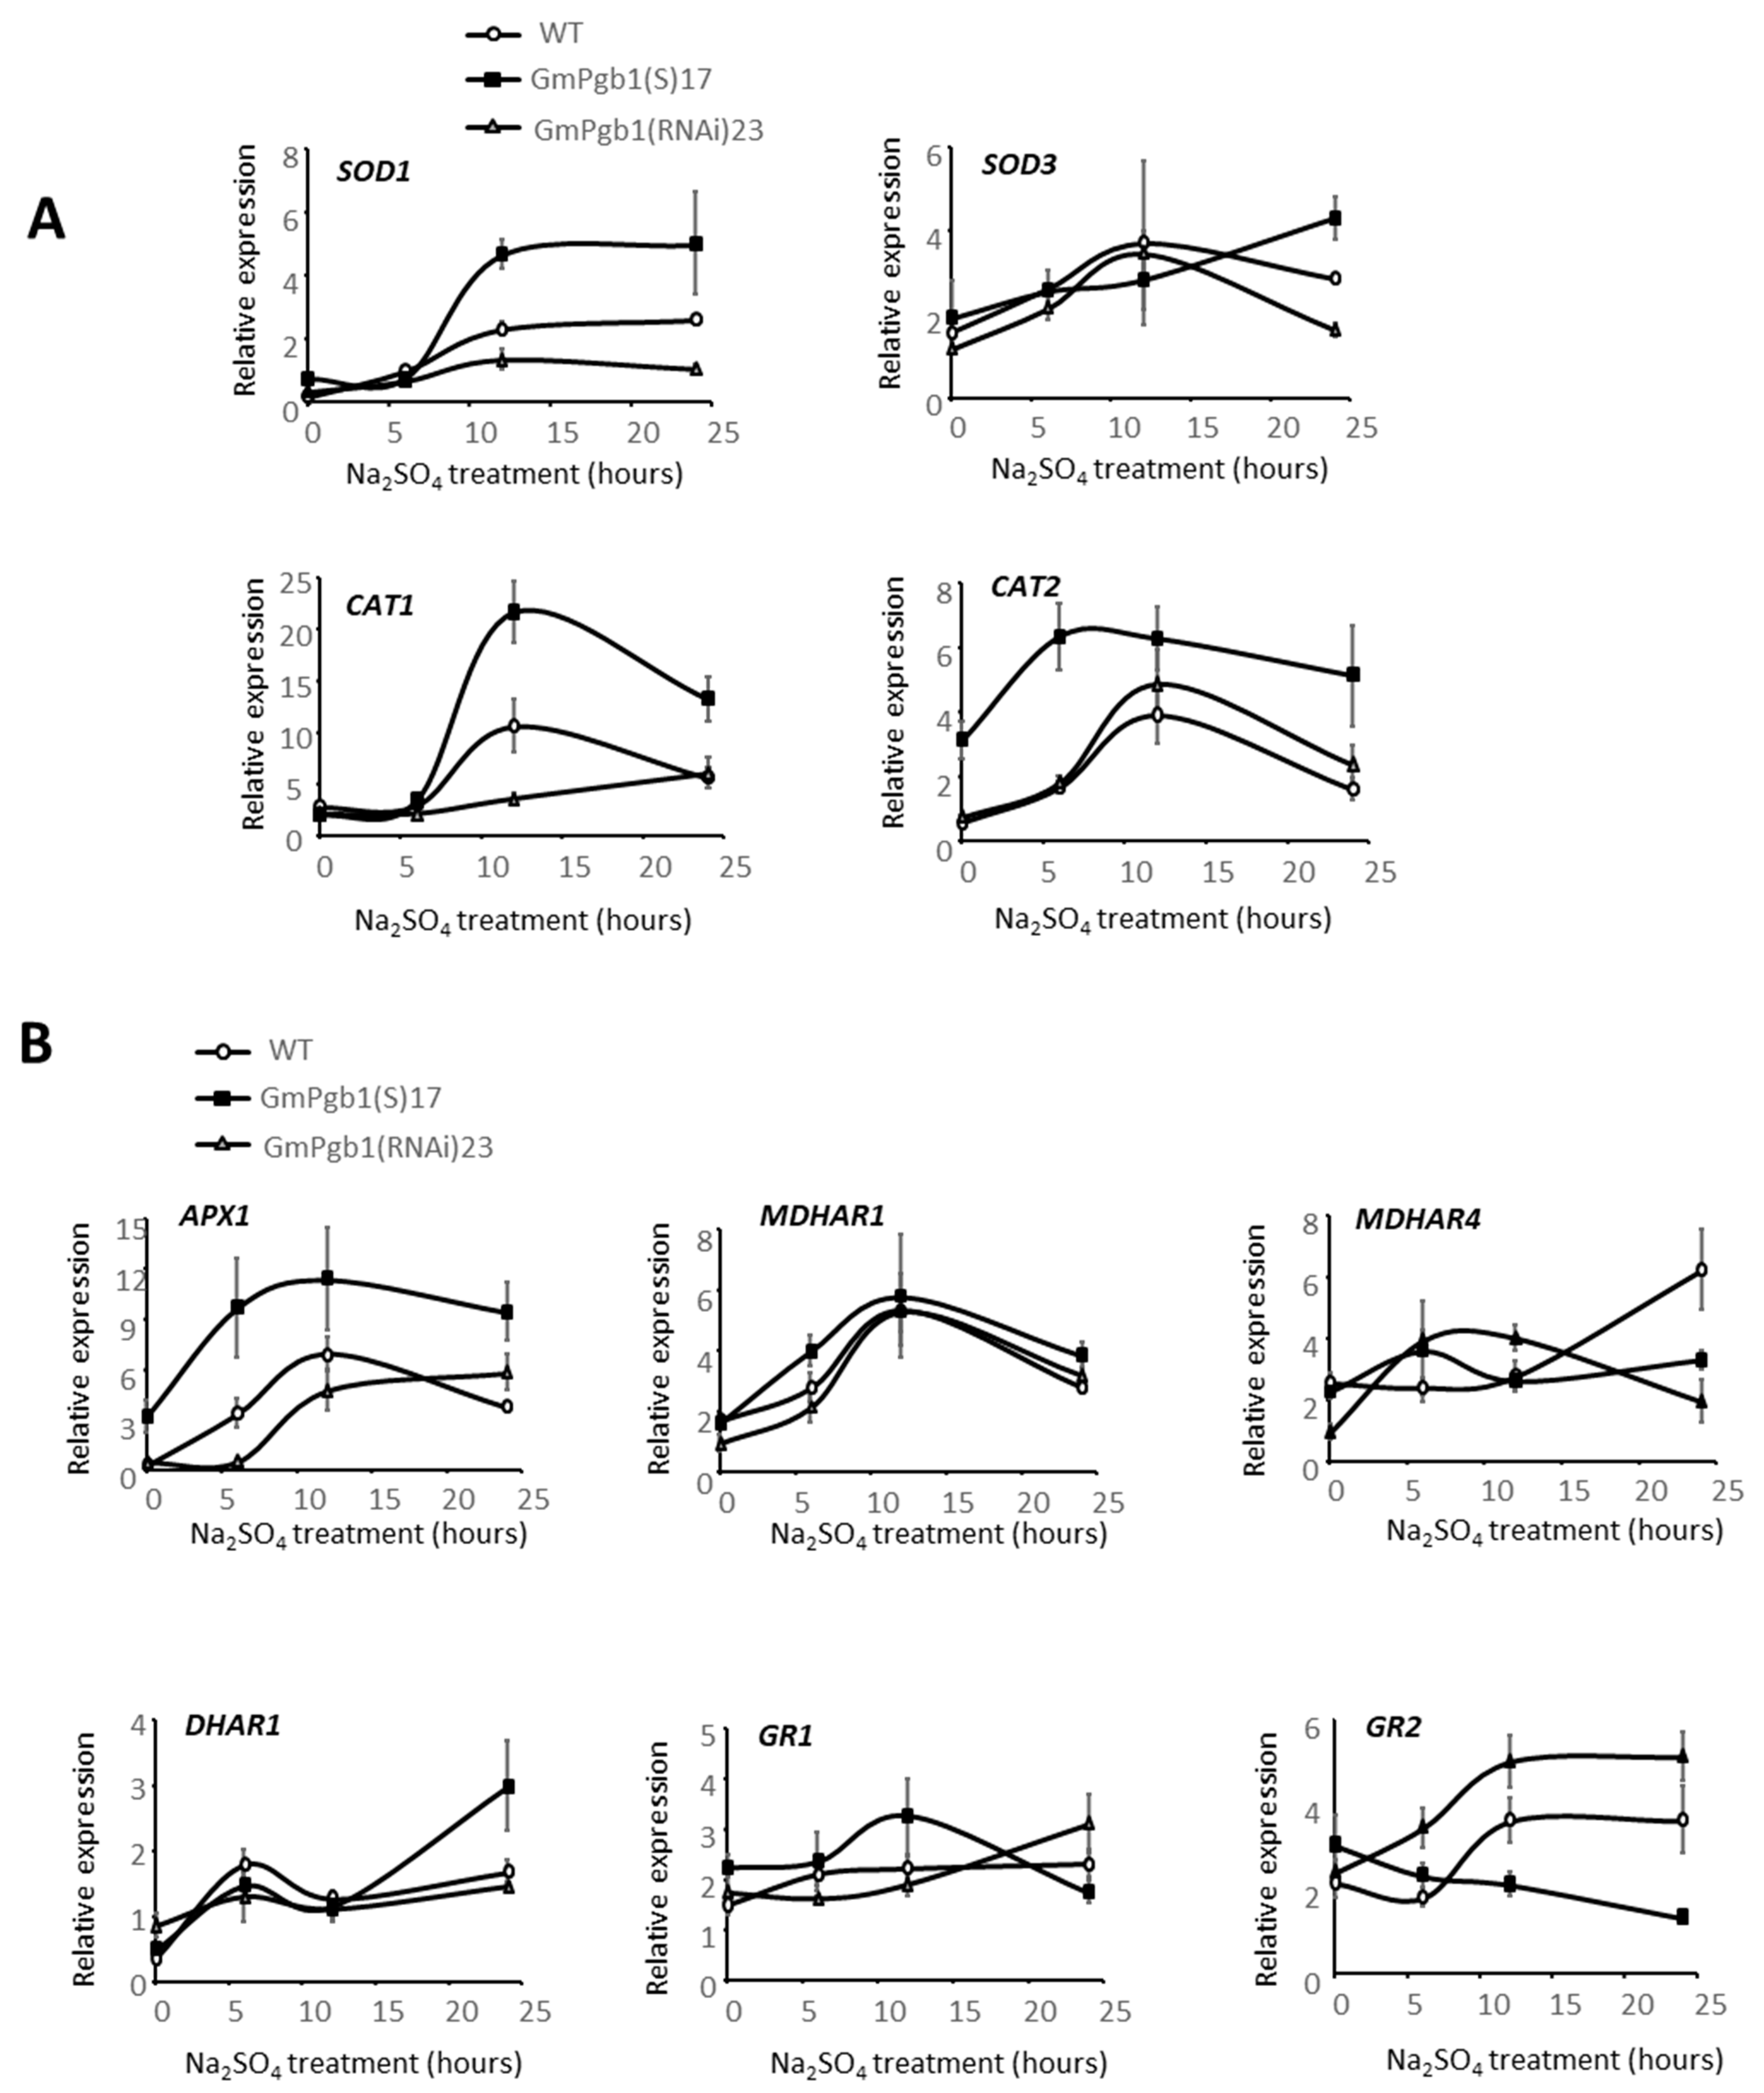
2.4. Antioxidant Responses in Leaves of Salt-Stressed Plants Are Induced by GmPgb1

Limitation of oxidative damage is a tolerance trait in several forms of abiotic stress, including salinity [43]. The cellular level of ROS is determined not only by their production, but also by the antioxidant system composed by an array of enzymes. These include superoxide dismutase (SOD), scavenging superoxide; catalases (CAT) and ascorbate peroxidase (APX) participating in the detoxification of H2O2; and enzymes required for the turnover of ascorbic acid, dehydroascorbate reductase (DHAR), monodehydroascorbate reductase (MDHAR), and glutathione reductase (GR).
Expression analyses of the genes encoding these enzymes and responsive to abiotic stress [37] were performed. The foliar expression of SOD1 and CAT1 increased after 6 h of Na2SO4 stress (Figure 6A). This increase was more pronounced in the GmPgb1(S)17 plants and lower in the the GmPgb1(RNAi)23 line relative to the WT. A similar profile was also observed for CAT2 despite an earlier (0–6 h) increase in expression. Salinity induced SOD3 in the three genotypes, and after 24 h, the expression of this gene was greatest in the GmPgb1(S)17 plants, intermediate in the WT plants, and lowest in those suppressing GmPgb1 (Figure 6A).
Transcript levels of the enzymes participating in glutathione and ascorbate metabolism were also measured. Salinity increased the foliar expression of APX1, especially in the GmPgb1(S)17 line (Figure 6B). No major differences between the lines were observed for MDHAR1 and 4 despite an increase in expression in the WT leaves after 12 h. The expression of DHAR1 increased between 0 and 6 h independently of the genotype; at 24 h, a higher expression level was observed in leaves, upregulating GmPgb1. Of the two GR genes, the expression of GR1 did not exhibit pronounced fluctuations during the Na2SO4 treatment, while a gradual suppression of GR2 was recorded in the GmPgb1(S)17 line. This contrasted with the WT and the GmPgb1(RNAi)23 line which showed an increase in GR2 transcripts after 6 h (Figure 6B).
To further interpret the changes in transcript levels, the activities of the antioxidant enzymes were measured in leaves of plants grown for 24 h under control or Na2SO4 conditions. The activities of many enzymes, similar under control conditions among the three genotypes, were induced by salt stress (Figure 7). Relative to the WT and GmPgb1(S)23 lines, the foliar activities of APX, DHAR, and CAT were higher in the GmPgb1(S)17 line under salinity stress. The three lines exhibited similar activity values for MDHAR and GR, while the activity of SOD was slightly reduced in the GmPgb1(RNAi)23 line when compared to the values of the other two lines exposed to stress (Figure 7).

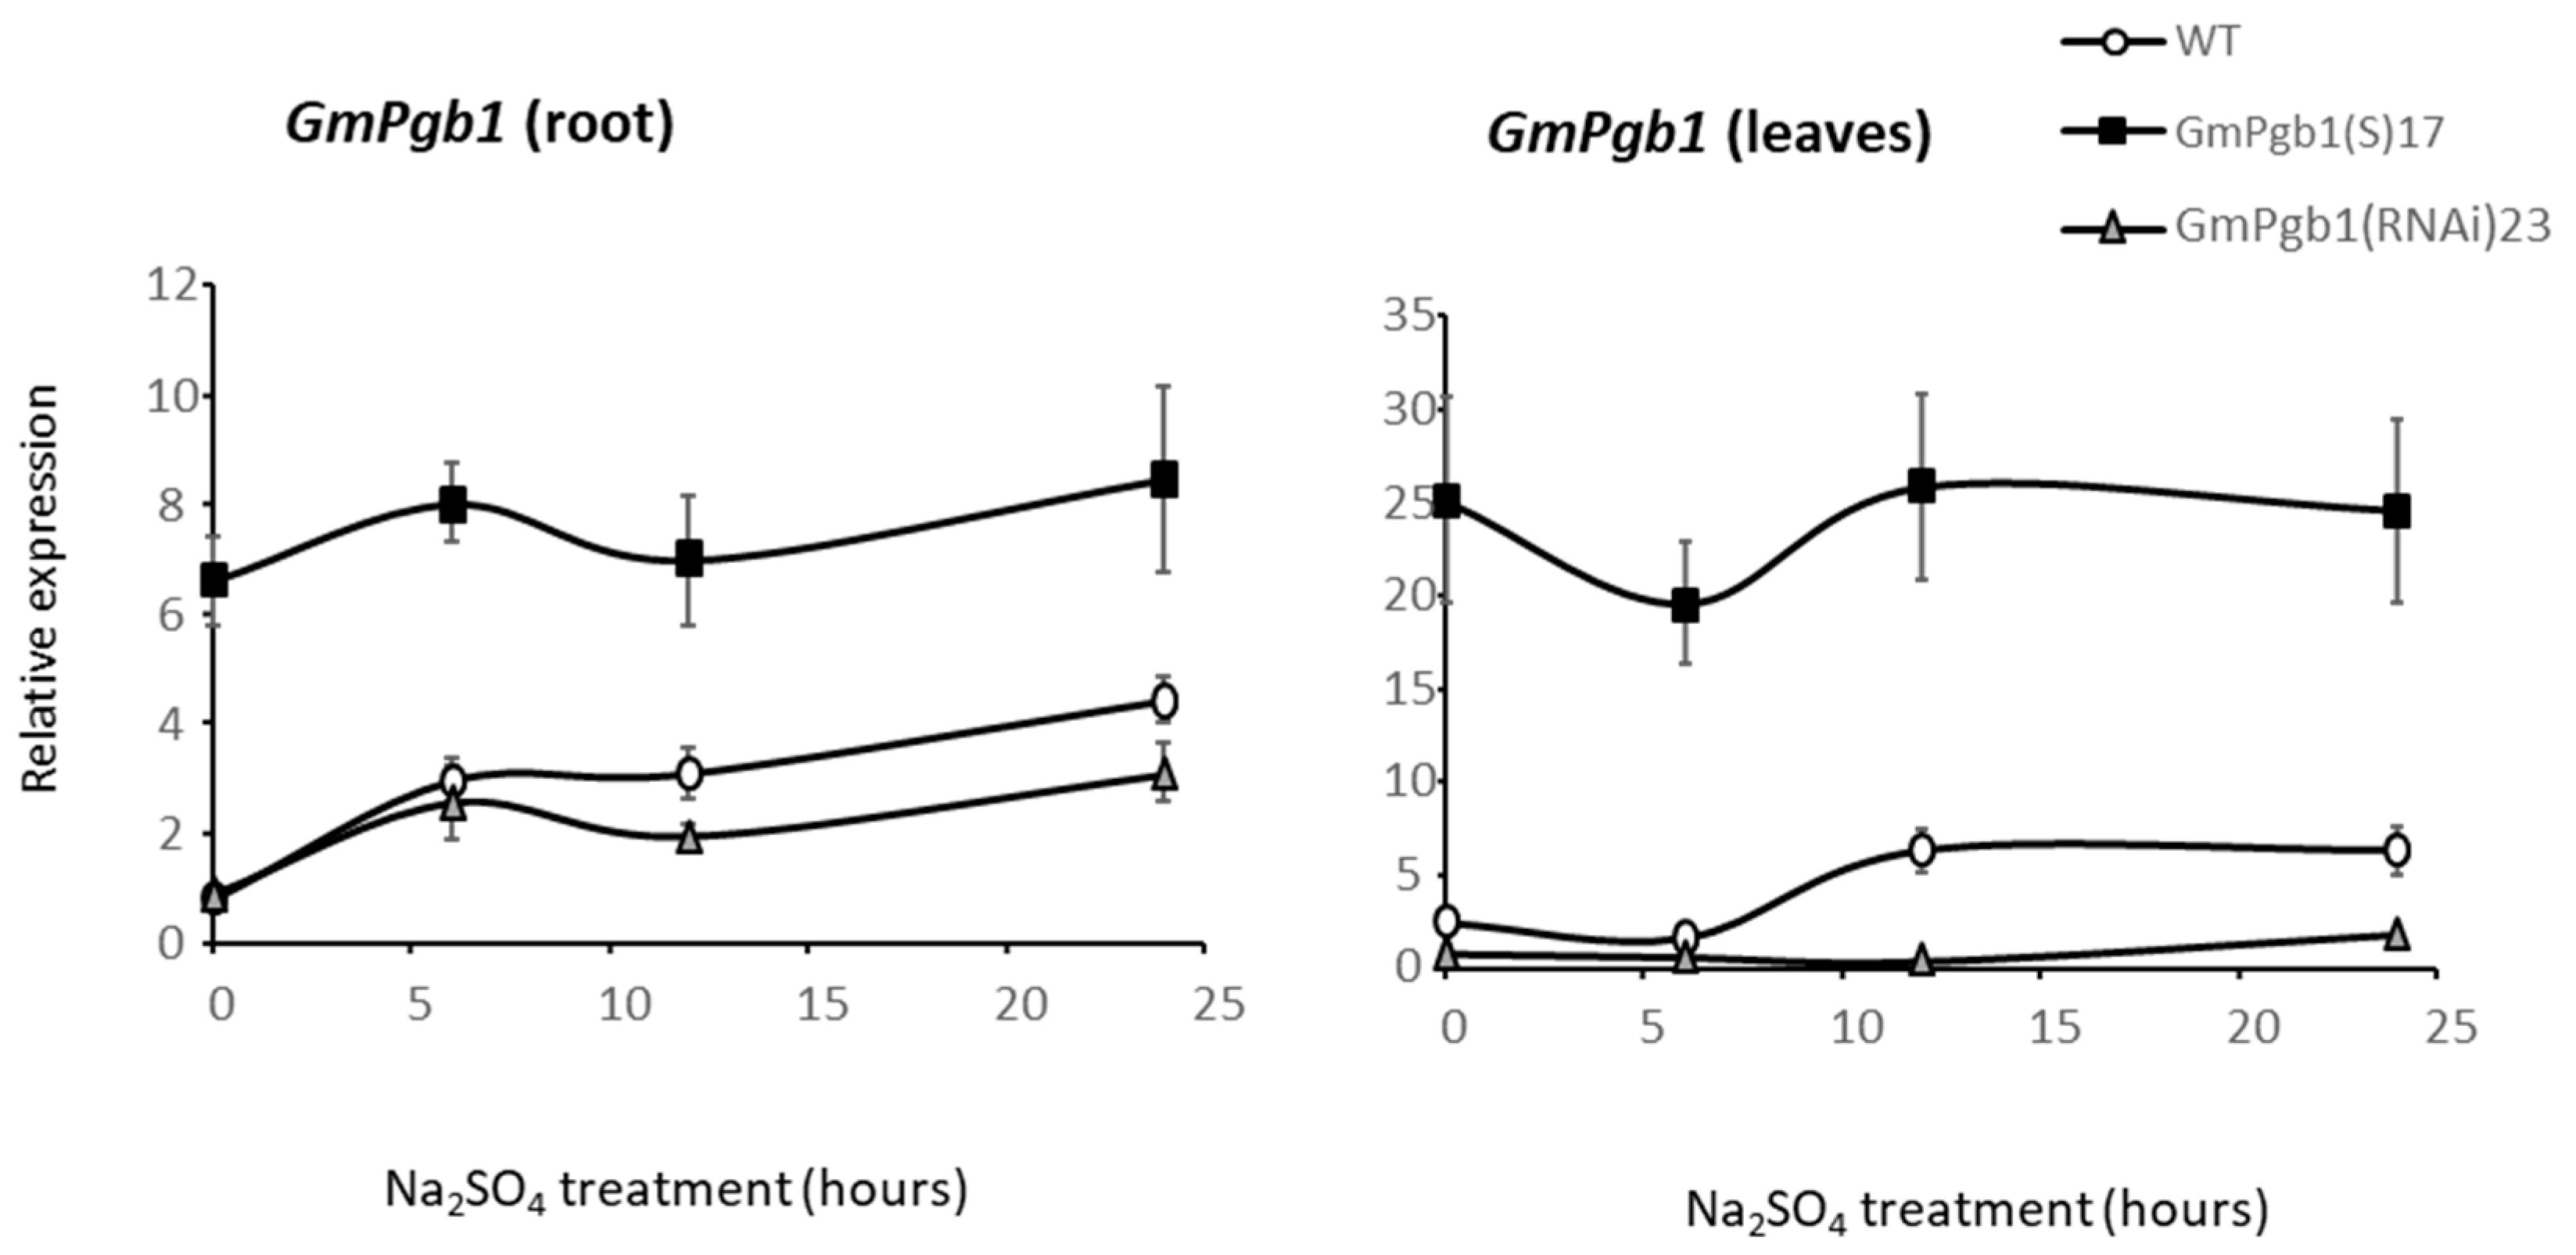
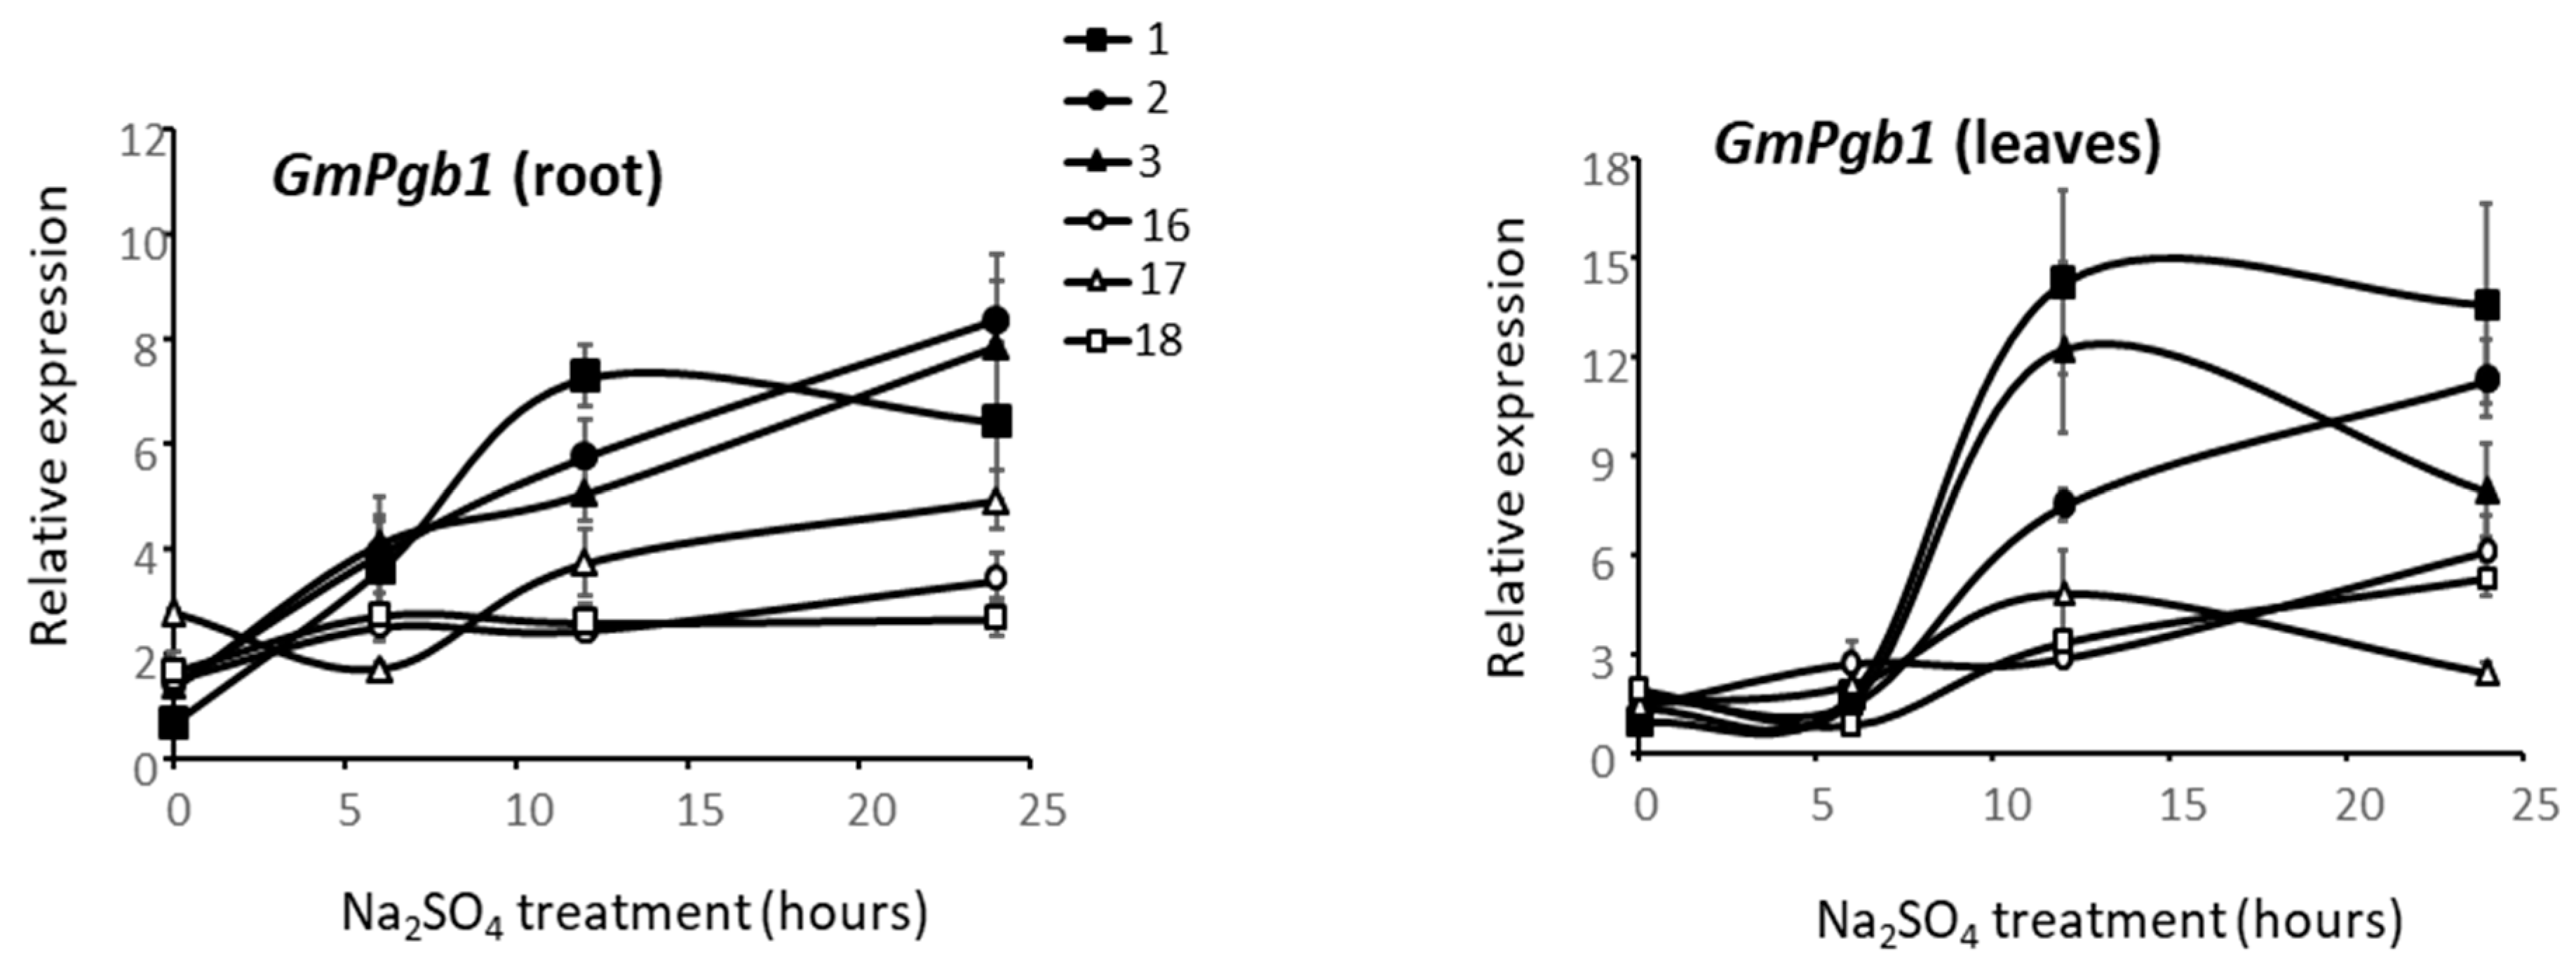
2.5. GmPgb1 Expression in Commercial Soybean Cultivars

The increased salinity tolerance in plants overexpressing GmPgb1 prompted an analysis of the natural germplasm to determine if a relationship exists between GmPgb1 expression and salt tolerance. Based on the combined analyses of several morphological parameters used on 18 commercial cultivars (Supplemental Figure S3), we measured the level of GmPgb1 in three cultivars (1–3) exhibiting the highest tolerance to Na2SO4 and three cultivars (16–18) exhibiting the highest susceptibility (Figure 8). The expression of GmPgb1 increased during the first 12 h of stress in roots and especially shoots of tolerant lines while it remained low in the susceptible cultivars (Figure 8).

3. Discussion

Overexpression of GmPgb1 alleviated salinity stress in soybean by mitigating the salt-induced damage and the reduction of several morphophysiological parameters. In both WT and GmPgb1-downregulating plants, exposure to Na2SO4 caused a reduction in biomass and a depression of the photosynthetic rate, the stomatal conductance, the transpiration, and the water use efficiency (Figure 2). These effects, typical of salt-treated soybean plants [5,6], may be the consequence of the combinatorial effects of salinity resulting from the osmotic stress reducing the plant’s hydraulic conductivity and, most importantly, ionic stress caused by the toxic accumulation of ions, especially of Na+ [6,7,22,44]. Noxious levels of Na+ depress photosynthesis [13] by disrupting the function of the photosystem II reaction center and the oxygen-evolving complex [3]. In soybean, this can be further aggravated by the concomitant reduction in foliar K+ (Figure 4) attributable to the Na+ interference with its translocation [17,45]. Many photosynthetic reactions, in fact, require K+ [16].
Salt-treated WT plants also experience oxidative stress, as evidenced by the increase in H2O2 and MDA, a marker of lipid peroxidation (Figure 5A), and these effects can be linked to excessive levels of Na+ [46,47]. Consistent with this observation is the transcriptional induction of RBOHs (Figure 5B), components of the NADPH oxidase multicomplex system [41] and markers of ROS production [37], and the activation of several ROS-detoxifying enzymes, including APX, CAT, and SOD (Figure 5A). Thus, the responses observed in Na2SO4 in the WT leaves are typical in many respects to those observed in many species [46], including soybean [5].
Overexpression of GmPgb1 ameliorates plant response to salinity through the retention of photosynthetic gas exchange parameters and mitigates foliar tissue damage (Figure 2 and Figure 3). These effects are associated to the ability of these plants to limit accumulation of Na+ (and retain a low Na+/K+ ratio) and mitigate oxidative stress. A plausible reason for the reduced Na+ levels in tissue overexpressing GmPgb1 is the increase in SOS1 (Figure 4D), a member of the SOS pathway contributing to salinity tolerance [48]. Strategically located in epidermal, cortical, and pericycle cells, SOS1 limits the Na+ intake in root cells, restricts the radial movement of the ion across cells layers, thereby reducing its long-distance transport through the xylem, and excludes Na+ in leaf cells [16]. The induction of GmSOS1 in both roots and leaves of the Na2SO4-treated GmPgb1(S)17 plants, consistent with the higher expression levels observed in species tolerant to salt stress [49] and the acquired tolerance of transgenic plants overexpressing SOS1 [20], suggests limited Na+ intake in root cells and transport to the aerial organs.
The increased expression of GmATK1 in the roots of the salt stress-exposed GmPgb1(S)17 plants (Figure 4D) is also an indication of increased tolerance [45,50]. As an inward-rectifying K+ channel, ATK1 is required for the maintenance of the Na+/K+ balance by ensuring sustained K+ intake, especially in high salt environments. The crucial function of this transporter during salinity stress was demonstrated by Wang et al. [45] documenting enhanced tolerance and retention of the Na+/K+ balance in Arabidopsis plants overexpressing the soybean GmATK1.
Besides restricting Na+ from leaves, overexpression of GmPgb1 alleviates salt damage by relieving oxidative stress, specifically reducing the level of ROS and ROS-induced damage. This protective role, documented under developmental and stress events [26,29,30], is linked to the function of the protein to scavenge NO [34], as also observed for GmPgb1 (Supplemental Figure S4). Here, we show that expression of GmPgb1 during salt stress attenuates the increase in H2O2 and MDA, possibly by limiting the Na2SO4 induction of RBOHB and RBOHD, markers of ROS production in soybean [37]. The mitigation of ROS production in GmPgb1-overexpressing leaves is a contributing factor for a decreased leaf injury and a higher retention of the photosynthetic rate. Additionally, overexpression of GmPgb1 also attenuates the Na2SO4 depression of the transcripts involved in the formation of photosystem I (PsaA and B), cytochrome B6F (cylB6F), and photosystem II (PsbB, PsbC, PsbD). Retention of these transcripts during conditions of stress has been associated to abiotic stress tolerance [37].
Reduced oxidative stress in leaves overexpressing GmPgb1 can be attributed to an improved antioxidant system. Relative to the WT, overexpression of GmPgb1 is associated to higher levels of the CAT1, 2 and APX1 transcripts, as well as the CAT and APX activity. This behavior might be accountable for the lower level of H2O2 measured in the GmPgb1(S)17 leaves during salt stress. Elevated activity of CAT and APX are desirable tolerance traits for salinity stress [22]. While the direct mechanisms through which GmPgb1 modulates the expression and activity of CAT and APX1 are unknown, regulation of the APX1 activity might be the result of post-translational modifications mediated by NO. Nitration of APX by peroxynitrate, formed in environments enriched in NO, inhibits the enzyme [51], an observation consistent with the higher APX activity (Figure 7) in GmPgb1 leaves which are depleted in NO (Supplemental Figure S4).
Sustained activity of APX and removal of H2O2 during conditions of stress is dependent upon the availability of the substrate ascorbate produced de novo and regenerated through the ascorbate–glutathione cycle [43]. Our work suggests that during salt stress, overexpression of GmPgb1 might result in higher levels of ascorbate required for the operation of APX. First, the expression of the three ascorbate biosynthetic genes GDP-L-galactose phosphorylase GmGPP and L-galactose-dehydrogenase (GmGDH1 and 2), good indicators of ascorbate production in soybean [37,52], is induced in leaves of Na2SO4-treated plants overexpressing GmPgb1 (Supplemental Figure S5). Second, the same leaves exhibit a higher activity of DHAR, which is required for ascorbate recycling through the glutathione-dependent dehydroascorbate reduction [23]. The relevance of this enzyme in replenishing the ascorbate pool during salinity stress was documented [53]. The slightly lower ascorbate level in the salt-stressed GmPgb1(S)17 leaves (Supplemental Figure S6) is difficult to interpret, but it might be a consequence of higher utilization by APX. While we suggest that removal of ROS by ascorbate is mediated by APX, the operation of APX-independent mechanisms, which also involve ascorbate [54], cannot be discounted. Activation of the antioxidant components and similar Na+/K+ metabolic adaptations to those described here were associated to the ability of thymol to increase salinity tolerance in tobacco plants [15]. In the same study, it was observed that thymol elevates the level of NO, an observation which is, however, not consistent with our study.
The relevance of high expression of GmPgb1 as a mechanism to cope with salinity stress is not limited to transgenic material. Our study shows that this gene is preferentially induced in commercial cultivars exhibiting tolerance to Na2SO4, relative to those susceptible to the same stress. This observation, consistent with a previous work linking induction of Pgbs to the ability of soybean plants to cope with hypoxic stress [37], could be exploited as a tool to screen plant material at early stages of development for salt stress tolerance.
In conclusion, this study demonstrates that overexpression of the soybean GmPgb1 enhances tolerance to salt stress. The Na2SO4 depression of gas exchange parameters, water use efficiency, leaf damage, and reduction in water content are attenuated by the overexpression of GmPgb1. These beneficial effects can be attributed to the ability of plants overexpressing GmPgb1 to limit the accumulation of Na+ in leaf tissue (thus maintaining a lower Na+/K+ ratio) and mitigate oxidative stress. This is achieved by reducing production of ROS as well as by activating antioxidant responses centered around the activities of CAT and APX.
Collectively, these data suggest GmPgb1 as an effective modulator of soybean response to salt stress.

4. Materials and Methods

4.1. Plant Material and Growth Conditions

Transformed soybean (Glycine max) plants with altered levels of the Phytoglobin1 gene GmPgb1, described by Mira et al. [37], were selected for this study. Soybean cultivars grown in Western Canada were provided by Dennis Lange (Manitoba Agriculture, Winnipeg, Canada). These cultivars were the same as the ones utilized previously [55].
Seed sterilization was carried out with chlorine gas for 20 h [56]. The sterilized seeds were germinated on moistened filter paper for about one week. Uniform seedlings characterized by unfolded unifoliate leaves (VC stage of development) were selected and grown further hydroponically in a solution containing half-strength Hoagland [57]. Acclimation to the hydroponic conditions was conducted for 7 days under a 16 h photoperiod of 22 °C (light) and 18 °C (dark), with 334 µmol m−2 s−1 light intensity. As soon as the plants developed their first trifoliate leaf (V1 stage of development) they were transferred to a half-strength Hoagland solution containing 100 mM Na2SO4. The level of Na2SO4 and the timing of the measurements were determined empirically to ensure consistent manifestation of symptoms. Plants in the control group were given identical treatments as the experimental plants, except for Na2SO4. The plants were harvested at different timepoints for morphophysiological parameter assessments, as indicated below. Unless otherwise specified, all the experiments carried out used at least five biological replicates, each with a minimum of five plants.

4.2. Determination of Morphophysiological Parameters

Fresh and oven-dry weights of shoot or root tissues were measured after 7 days of treatment. The extent of leaf injury, also measured at 7 days, was assessed using a visual scale adopted in a previous work [55], based on an index (0–100) reflecting the percentage of foliar damage.
Gas exchange parameters (photosynthetic rate, stomatal conductivity, water use efficiency, and transpiration rate) were measured on the first trifoliate leaves after 24 h of treatment using a gas exchange infrared gas analyzer (IRGA; LI-6400, LI-COR, Inc., Lincoln, NE, USA), as reported by Youssef et al. [55]. The measurements were conducted between 9 am and 3 pm. Gas exchange parameters were measured under photosynthetically active radiation of 400 μmol m−2 s−1, atmospheric CO2 of 400 μmol mol−1, relative humidity of 50%, and temperature of 22 °C. The measurements were performed on three biological replicates, each consisting of at least five plants.

4.3. Measurements of K+ and Na+

Leaf and root tissues (2 g) were harvested at 24 h under control or Na2SO4 treatment and oven-dried for 5 days. Analysis of K+ and Na+ was performed using Agvise (Agvise Laboratories Inc., Northwood, ND, USA; www.agvise.com, 29 March 2022). Extraction of both elements was performed using 1 M ammonium acetate (pH 7), and determination was carried out by means of inductively coupled plasma atomic emission spectroscopy (ICP-AES).

4.4. Stomata Measurements

Analysis of stomata was performed after 24 of stress [55]. Briefly, a thin layer of translucent nail polish was applied to a leaf’s abaxial side and left to dry for 5 min. A transparent tape was applied on the dry nail polish and carefully peeled off before being placed on a clean microscope slide for microscopic examination. Stomata were categorized into three groups based on their length-to-width ratio (L/W): fully open (L/W = 1–2), partially open (L/W = 2.1–2.5), or closed (L/W 2.6) (Supplemental Figure S1). The analyses were conducted using three biological replicates each, with at least 100 stomata.

4.5. Measurements of Transcript Levels

Transcript levels were measured on the first trifoliate leaves at 0, 6, 12, and 24 h of stress. Tissue was harvested and stored at −80 °C. Total RNA was extracted with a TRI Reagent solution (Invitrogen, Waltham, MA, USA) following the manufacturer’s instructions. The RNA samples were treated with DNase (Thermo Fisher Scientific, Waltham, MA, USA), and a High Capacity cDNA Reverse Transcription Kit (Applied Biosystems, Waltham, MA, USA) was used for cDNA synthesis. The relative levels of transcripts were measured by means of quantitative PCR using the primers listed in Supplemental Table S1 and analyzed with the 2−ΔΔCT method [58] using helicase (Gm04g07180.4) as the reference gene.

4.6. Antioxidant Enzyme Activity and Quantification of Ascorbic Acid and Glutathione

The enzyme activity of APX, DHAR, MDHAR, and GR were measured as reported by Zhang and Kirkham [59]. Trifoliate leaf tissue (100–150 mg fresh weight), collected at 24 h under control or Na2SO4 treatment, was immediately homogenized on ice with 50 mM phosphate buffer (pH 7.8) containing 0.2 mM EDTA and 1% (w/v) polyvinylpyrrolidone. The homogenate was then centrifuged at 18,000× g at 4 °C for 15 min. The supernatant was collected for the analysis of enzyme activities [59] using a Bio-Tek Synergy H4 Microplate Reader.
The APX activity was estimated by measuring the H2O2-dependent oxidation of ascorbic acid following the decrease in absorbance at 290 nm. The reaction mixture contained 0.5 mM ASC, 0.1 mM H2O2, 0.1 mM EDTA, and 50 mM sodium phosphate buffer (pH 7.0).
The DHAR activity was measured by following the GSH-dependent production of ASC at 265 nm. The reaction mixture contained 2.5 mM GSH, 0.1 mM EDTA, 0.2 mM dehydroascorbate (DHA), and 50 mM sodium phosphate buffer (pH 7.0).
The MDHAR activity was measured by observing the change in absorbance at 340 nm. The reaction mixture contained 0.1 mM NADH, 2.5 mM ASC, 50 mM sodium phosphate buffer (pH 7.6), and four units of ASC oxidase.
The GR activity was determined by observing the NADPH-dependent oxidation of GSSG following the decrease in absorbance at 340 nm. The reaction mixture contained 1 mM EDTA, 1 mM GSSG, 0.2 mM NADPH, and 0.1 M sodium phosphate buffer (pH 7.8).
For CAT and SOD, leaf tissue (100–150 mg fresh weight) was homogenized on ice-cold 50 mM sodium phosphate buffer (pH 7.0) containing 0.2 mM EDTA and 1% (w/v) polyvinylpyrrolidone. The homogenate was centrifuged at 15,000× g at 4 °C for 20 min. The supernatant was then collected for the enzyme activity analysis [59].
For the analysis of ascorbic acid (ASC) and dehydroascorbate (DHA), about 100–150 mg (fresh weight) of leaf tissue was first powdered in liquid nitrogen and then homogenized with 2 mL of ice-cold 5% metaphosphoric acid. The homogenate was centrifuged at 21,000× g at 4 °C for 15 min. The supernatant was collected and the absorbance (525 nm) was read [59].

4.7. Lipid Peroxidation and H2O2 Measurements

Lipid peroxidation was estimated by measuring the amount of malondialdehyde (MDA) [60]. The leaves (about 0.5 g) collected at 24 h under control or Na2SO4 treatment were homogenized in 10 mL of 0.1% (w/v) trichloroacetic acid (TCA), centrifuged at 15,000× g for 10 min, and 1 mL of the supernatant was added to 4 mL thiobarbituric acid (TBA) in 20% (w/v) TCA. The solution was heated at 95 °C for 30 min centrifuged at 10,000× g for 10 min and used to measure the absorbance at 532 nm. A standard curve was generated to determine the content of MDA in the tissue.
Hydrogen peroxide was measured in trifoliate leaves using the ferrous oxidation protocol with xylenol orange [61]. The level of H2O2 was determined using a standard curve.

4.8. Nitric Oxide (NO) Localization

The accumulation of intracellular NO in the leaf tissue was monitored using the NO-specific fluorescent probe DAF-FM DA (MilliporeSigma, Burlington, MA, USA), as described previously [62,63]. The leaves, collected at 24 h under control or Na2SO4 treatment, were incubated for 1 h at 37 °C with gentle agitation in the dark in a buffer (50 mM Tris and 50 mM KCl, pH 7.2) containing 1% (v/v) Triton X-100 and 50 μM DAF-FM DA. The leaves were rinsed twice in the same buffer (50 mM Tris and 50 mM KCl, pH 7.2). The fluorescent signal was captured with a GFP light cube in a EVOS M5000 Imaging System, with excitation and emission peaks at 470 and 510 nm. Image J was used to determine the DAF-FM DA fluorescent pixel intensity in leaf segments.

4.9. Statistical Analysis

The data were analysed by means of one-way analysis of variance (ANOVA) using the SPSS program (version 19.0). Treatment means were compared using Duncan’s test (α = 0.05) to differentiate the significance of the difference between various parameters.

Supplementary Materials

The following supporting information can be downloaded at: https://www.mdpi.com/article/10.3390/ijms23084072/s1.

Author Contributions

Conceptualization, R.D.H. and C.S.; investigation, M.S.Y. and M.M.M. and S.R.; writing—review and editing, C.S.; supervision, S.R. and C.S. All authors have read and agreed to the published version of the manuscript.

Funding

This work was supported by a grant from the Manitoba Pulse and Soybean Growers and the Canadian Agriculture Partnership, Manitoba, Canada.

Institutional Review Board Statement

Not applicable.

Informed Consent Statement

Not applicable.

Data Availability Statement

The data that support the findings of this study are available from the corresponding author upon reasonable request.

Conflicts of Interest

The authors declare no conflict of interest.

References

  1. Bartels, D.; Sunkar, R. Drought and salt tolerance in plants. CRC Crit. Rev. Plant Sci. 2005, 24, 23–58. [Google Scholar] [CrossRef]
  2. Parihar, P.; Singh, S.; Singh, R.; Singh, V.P.; Prasad, S.M. Effect of salinity stress on plants and its tolerance strategies, a review. Environ. Sci. Pollut. Res. 2015, 22, 4056–4075. [Google Scholar] [CrossRef] [PubMed]
  3. Yamaguchi, T.; Blumwald, E. Developing salt-tolerant crop plants, challenges and opportunities. Trends Plant Sci. 2005, 10, 615–620. [Google Scholar] [CrossRef] [PubMed]
  4. Chang, R.Z.; Chen, Y.W.; Shao, G.H.; Wan, C.W. Effect of salt stress on agronomic characteristics and chemical quality of seeds in soybean. Soybean Sci. 1994, 13, 101–105. [Google Scholar]
  5. Phang, T.H.; Shao, G.; Lam, H.M. Salt tolerance in soybean. J. Integr. Plant Biol. 2008, 50, 1196–1212. [Google Scholar] [CrossRef]
  6. Munns, R.; Tester, M. Mechanisms of salinity tolerance. Annu. Rev. Plant Biol. 2008, 59, 651–681. [Google Scholar] [CrossRef] [Green Version]
  7. Cabot, C.; Sibole, J.V.; Barceló, J.; Poschenrieder, C. Lessons from crop plants struggling with salinity. Plant Sci. 2014, 226, 2–13. [Google Scholar] [CrossRef]
  8. Bose, J.; Rodrigo-Moreno, A.; Shabala, S. ROS homeostasis in halophytes in the context of salinity stress tolerance. J. Exp. Bot. 2014, 65, 1241–1257. [Google Scholar] [CrossRef]
  9. Munns, R.; Termaat, A. Whole-plant responses to salinity. Funct. Plant Biol. 1986, 13, 143–160. [Google Scholar] [CrossRef]
  10. Rajendran, K.; Tester, M.; Roy, S.J. Quantifying the three main components of salinity tolerance in cereals. Plant Cell Environ. 2009, 32, 237–249. [Google Scholar] [CrossRef]
  11. Isayenkov, S.V.; Maathuis, F.J. Plant salinity stress, many unanswered questions remain. Front. Plant Sci. 2019, 10, 80. [Google Scholar] [CrossRef] [PubMed] [Green Version]
  12. Isayenkov, S.V. Physiological and molecular aspects of salt stress in plants. Cytol. Genet. 2012, 46, 302–318. [Google Scholar] [CrossRef] [Green Version]
  13. Mehta, P.; Jajoo, A.; Mathur, S.; Bharti, S. Chlorophyll a fluorescence study revealing effects of high salt stress on Photosystem II in wheat leaves. Plant Physiol. Biochem. 2010, 48, 16–20. [Google Scholar] [CrossRef] [PubMed]
  14. Kalaji, H.M.; Rastogi, A.; Živčák, M.; Brestic, M.; Daszkowska-Golec, A.; Sitko, K.; Alsharafa, K.Y.; Lotfi, R.; Stypiński, P.; Samborska, I.A.; et al. Prompt chlorophyll fluorescence as a tool for crop phenotyping, an example of barley landraces exposed to various abiotic stress factors. Photosynthetica 2018, 56, 953–961. [Google Scholar] [CrossRef] [Green Version]
  15. Xu, Z.; Zhou, G. Responses of leaf stomatal density to water status and its relationship with photosynthesis in a grass. J. Exp. Bot. 2008, 59, 3317–3325. [Google Scholar] [CrossRef] [PubMed] [Green Version]
  16. Assaha, D.V.; Ueda, A.; Saneoka, H.; Al-Yahyai, R.; Yaish, M.W. The role of Na+ and K+ transporters in salt stress adaptation in Glycophytes. Front. Physiol. 2017, 8, 509. [Google Scholar] [CrossRef]
  17. Demidchik, V.; Straltsova, D.; Medvedev, S.S.; Pozhvanov, G.A.; Sokolik, A.; Yurin, V. Stress-induced electrolyte leakage, the role of K+-permeable channels and involvement in programmed cell death and metabolic adjustment. J. Exp. Bot. 2014, 65, 1259–1270. [Google Scholar] [CrossRef] [PubMed]
  18. Shabala, S.; Pottosin, I. Regulation of potassium transport in plants under hostile conditions, implications for abiotic and biotic stress tolerance. Physiol. Plant. 2014, 151, 257–279. [Google Scholar] [CrossRef] [PubMed]
  19. Shi, H.; Ishitani, M.; Kim, C.; Zhu, J.K. The Arabidopsis thaliana salt tolerance gene SOS1 encodes a putative Na+/H+ antiporter. Proc. Natl. Acad. Sci. USA 2000, 97, 6896–6901. [Google Scholar] [CrossRef] [Green Version]
  20. Quintero, F.J.; Ohta, M.; Shi, H.; Zhu, J.-H.; Pardo, J.M. Reconstitution in yeast of the Arabidopss SOS signaling pathway for Na+ homeostasis. Proc. Natl. Acad. Sci. USA 2002, 99, 9061–9066. [Google Scholar] [CrossRef] [Green Version]
  21. Feki, K.; Quintero, F.J.; Khoudi, H.; Leidi, E.O.; Masmoudi, K.; Pardo, J.M.; Brini, F. A constitutively active form of a durum wheat Na+/H+ antiporter SOS1 confers high salt tolerance to transgenic Arabidopsis. Plant Cell Rep. 2014, 33, 277–288. [Google Scholar] [CrossRef] [PubMed] [Green Version]
  22. Zhao, X.; Wei, P.; Liu, Z.; Yu, B.; Shi, H. Soybean Na+/K+ antiporter GmSOS1 enhances antioxidant enzyme activity and reduces Na+ accumulation in Arabidopsis cells under stress. Acta Physiol. Plant. 2017, 39, 19–25. [Google Scholar] [CrossRef]
  23. Foyer, C.H.; Noctor, G. Stress-triggered redox signalling, what’s in pROSpect? Plant Cell Environ. 2016, 39, 951–964. [Google Scholar] [CrossRef]
  24. Hetherington, A.M.; Hunter, M.I.S.; Crawford, R.M. Contrasting effects of anoxia on rhizome lipids in Iris species. Phytochemistry 1982, 21, 1275–1278. [Google Scholar] [CrossRef]
  25. Crawford, R.M.M.; Walton, J.C.; Wollenweber-Ratzer, B. Similarities between post-ischaemic injury to animal tissues and post-anoxic injury in plants. Proc. Royal Soc. B 1994, 102, 325–332. [Google Scholar] [CrossRef]
  26. Huang, H.; Ullah, F.; Zhou, D.X.; Yi, M.; Zhao, Y. Mechanisms of ROS regulation of plant development and stress responses. Front. Plant Sci. 2019, 10, 800. [Google Scholar] [CrossRef] [PubMed]
  27. David, A.; Yadav, S.; Bhatla, S.C. Sodium chloride stress induces nitric oxide accumulation in root tips and oil body surface accompanying slower oleosin degradation in sunflower seedlings. Plant Physiol. 2010, 140, 342–354. [Google Scholar] [CrossRef]
  28. Mira, M.; Hill, R.D.; Stasolla, C. Regulation of programmed cell death by phytoglobins. J. Exp. Bot. 2016, 67, 5901–5908. [Google Scholar] [CrossRef]
  29. Mira, M.M.; Huang, S.; Kapoor, K.; Hammond, C.; Hill, R.D.; Stasolla, C. Expression of Arabidopsis class 1 phytoglobin (AtPgb1) delays death and degradation of the root apical meristem during severe PEG-induced water deficit. J. Exp. Bot. 2017, 68, 5653–5668. [Google Scholar] [CrossRef] [Green Version]
  30. Mira, M.M.; Hill, R.D.; Stasolla, C. Phytoglobins improve hypoxic root growth by alleviating apical meristem cell death. Plant Physiol. 2016, 172, 2044–2056. [Google Scholar] [CrossRef] [Green Version]
  31. Chen, J.; Xiong, D.Y.; Wang, W.H.; Hu, W.J.; Simon, M.; Xiao, Q.; Chen, J.; Xiong, D.Y.; Wang, W.H.; Hu, W.H.; et al. Nitric oxide mediates root K+/Na+ balance in a mangrove plant, Kandelia obovata, by enhancing the expression of AKT1-Type K+ channel and Na+/H+ antiporter under high salinity. PLoS ONE 2013, 8, e71543. [Google Scholar] [CrossRef] [PubMed]
  32. Xia, J.; Kong, D.; Xue, S.; Tian, W.; Li, N.; Bao, F.; Hu, Y.; Du, J.; Wang, Y.; Pan, X.; et al. Nitric oxide negatively regulates AKT1-mediated potassium uptake through modulating vitamin B6 homeostasis in Arabidopsis. Proc. Natl. Acad. Sci. USA 2014, 111, 16196–16201. [Google Scholar] [CrossRef] [PubMed] [Green Version]
  33. Nabi, R.B.S.; Tayade, R.; Hussain, A.; Kulkarni, K.P.; Imran, Q.M.; Mun, B.G.; Yun, B.W. Nitric oxide regulates plant responses to drought, salinity, and heavy metal stress. Environ. Exp. Bot. 2019, 161, 120–133. [Google Scholar] [CrossRef]
  34. Hill, R.D. Non-symbiotic haemoglobins—What’s happening beyond nitric oxide scavenging? AoB Plants 2012, 2012, pls004. [Google Scholar] [CrossRef] [PubMed] [Green Version]
  35. Silva-Cardenas, R.I.; Ricard, B.; Saglio, P.; Hill, R.D. Hemoglobin and hypoxic acclimation in maize root tips. Russ. J. Plant Physiol. 2003, 50, 821–826. [Google Scholar] [CrossRef]
  36. Youssef, M.S.; Mira, M.M.; Renault, S.; Hill, R.D.; Stasolla, C. Phytoglobin expression influences soil flooding response of corn plants. Ann. Bot. 2016, 118, 919–931. [Google Scholar] [CrossRef] [Green Version]
  37. Mira, M.M.; Huang, S.; Hill, R.D.; Stasolla, C. Tolerance to excess moisture in soybean is enhanced by over-expression of the Glycine max Phytoglobin (GmPgb1). Plant Physiol. Biochem. 2021, 159, 322–334. [Google Scholar] [CrossRef]
  38. Andersson, C.R.; Jensen, E.O.; Llewellyn, D.J.; Dennis, E.S.; Peacock, W.J. A new hemoglobin gene from soybean, a role for hemoglobin in all plants. Proc. Natl. Acad. Sci. USA 1996, 93, 5682–5687. [Google Scholar] [CrossRef] [Green Version]
  39. Sato, Y.; Morita, R.; Katsuma, S.; Nishimura, M.; Tanaka, A.; Kusaba, M. Two short-chain dehydrogenase/reductases, NON-YELLOW COLORING 1 and NYC1-LIKE, are required for chlorophyll b and light-harvesting complex II degradation during senescence in rice. Plant J. 2009, 57, 120–131. [Google Scholar] [CrossRef]
  40. Wang, X.; Zhao, J.; Fang, Q.; Chang, X.; Sun, M.; Li, W.; Li, Y. GmAKT1 is involved in K+ uptake and Na+/K+ homeostasis in Arabidopsis and soybean plants. Plant Sci. 2021, 304, 110736. [Google Scholar] [CrossRef]
  41. Kong, W.; Liu, F.; Zhang, C.; Zhang, J.; Feng, H. Non-destructive determination of Malondialdehyde (MDA) distribution in oilseed rape leaves by laboratory scale NIR hyperspectral imaging. Sci. Rep. 2016, 6, 35393. [Google Scholar] [CrossRef] [PubMed]
  42. Sagi, M.; Fluhr, R. Production of reactive oxygen species by plant NADPH oxidases. Plant Physiol. 2006, 141, 336–340. [Google Scholar] [CrossRef] [PubMed] [Green Version]
  43. Blokhina, O.; Fagerstedt, K.V. Reactive oxygen species and nitric oxide in plant mitochondria, origin and redundant regulatory systems. Physiol. Plant. 2010, 138, 447–462. [Google Scholar] [CrossRef] [PubMed]
  44. Abouelsaad, I.; Relault, S. Enhanced oxidative stress in jasmonic acid-deficient tomato mutant def-1 exposed to NaCl stress. J. Plant Physiol. 2018, 226, 136–144. [Google Scholar] [CrossRef]
  45. Wang, C.; Zhang, M.; Liu, L.; Li, S.; Wu, G.; Cai, Q. Puccinella tenuiflora mantains a low Na+ level under salinity by limiting unidirectional Na+ influx resulting in a high selectivity for K+ over Na+. Plant Cell Environ. 2009, 32, 486–496. [Google Scholar] [CrossRef]
  46. Parida, A.K.; Das, A.B. Salt tolerance and salinity effects on plants, a review. Ecotoxicol. Environ. Saf. 2005, 60, 324–349. [Google Scholar] [CrossRef]
  47. Miller, G.; Suzuki, N.; Ciftci-Yilmaz, S.; Mittler, R. Reactive oxygen species homeostasis and signalling during drought and salinity stresses. Plant Cell Environ. 2010, 33, 453–467. [Google Scholar] [CrossRef]
  48. Ma, Q.; Li, Y.X.; Yuan, H.J.; Hu, J.; Wei, L.; Bao, A.K.; Zheng, J.L.; Wang, S.M. ZxSOS1 is essential for limiting long-distance transport and special distribution of Na+ in Zygophyllum. Plant Soil 2014, 374, 661–671. [Google Scholar] [CrossRef]
  49. Oh, D.H.; Leidi, E.; Zhang, Q.; Hwang, S.M.; Li, Y.; Quintero, F.J.; Bohnert, H.J. Loss of halophytism by interference with SOS1 expression. Plant Physiol. 2009, 151, 210–222. [Google Scholar] [CrossRef] [Green Version]
  50. McCormick, S.D.; Sundell, K.; Björnsson, B.T.; Brown, C.L.; Hiroi, J. Influence of salinity on the localization of Na+/K+-ATPase, Na+/K+/2Cl cotransporter (NKCC) and CFTR anion channel in chloride cells of the Hawaiian goby (Stenogobius hawaiiensis). J. Exp. Biol. 2003, 206, 4575–4583. [Google Scholar] [CrossRef] [Green Version]
  51. Begara-Morales, J.C.; Sánchez-Calvo, B.; Chaki, M.; Valderrama, R.; Mata-Pérez, C.; López-Jaramillo, J.; Padilla, M.N.; Carreras, A.; Corpas, F.C.; Barroso, J.B. Dual regulation of cytosolic ascorbate peroxidase (APX) by tyrosine nitration and S-nitrosylation. J. Exp. Bot. 2014, 65, 527–538. [Google Scholar] [CrossRef] [PubMed] [Green Version]
  52. Seminario, A.; Song, L.; Zulet, A.; Nguyen, H.T.; González, E.M.; Larrainzar, E. Drought stress causes a reduction in the biosynthesis of ascorbic acid in soybean plants. Front. Plant Sci. 2017, 8, 1042. [Google Scholar] [CrossRef] [PubMed] [Green Version]
  53. Gomez, J.M.; Hernandez, J.A.; Jimenez, A.; Del Rio, L.A.; Sevilla, F. Differential response of antioxidative enzymes of chloroplasts and mitochondria to long-term NaCl stress of pea plants. Free Radic. Res. 1999, 31, 11–18. [Google Scholar] [CrossRef] [PubMed]
  54. Paciolla, C.; Fortunato, S.; Dipierro, N.; Paradiso, A.; De Leonardis, S.; Mastropasqua, L.; De Pinto, M.C. Vitamin C in plants, from functions to biofortification. Antioxidants 2019, 8, 519. [Google Scholar] [CrossRef] [Green Version]
  55. Youssef, M.S.; Renault, S.; Hill, R.D.; Stasolla, C. The soybean Phytoglobin1 (GmPgb1) is involved in water deficit responses through changes in ABA metabolism. J. Plant Physiol. 2021, 267, 153538. [Google Scholar] [CrossRef]
  56. Chen, L.; Cai, Y.; Liu, X.; Guo, C.; Sun, S.; Wu, C.; Hou, W. Soybean hairy roots produced in vitro by Agrobacterium rhizogenes-mediated transformation. Crop J. 2018, 6, 162–171. [Google Scholar] [CrossRef]
  57. Iqbal, N.; Hussain, S.; Raza, M.A.; Yang, C.Q.; Safdar, M.E.; Brestic, M.; Liu, J. Drought tolerance of soybean (Glycine max L. Merr.) by improved photosynthetic characteristics and an efficient antioxidant enzyme activities under a split-root system. Front. Physiol. 2019, 10, 786–792. [Google Scholar] [CrossRef] [Green Version]
  58. Livak, K.J.; Schmittgen, T.D. Analysis of relative gene expression data using real-time quantitative PCR and the 2−ΔΔCT method. Methods 2001, 25, 402–408. [Google Scholar] [CrossRef]
  59. Zhang, J.; Kirkham, M.B. Antioxidant responses to drought in sunflower and sorghum seedlings. New Phytol. 1996, 132, 361–373. [Google Scholar] [CrossRef]
  60. Heath, R.L.; Packer, L. Photoperoxidation in isolated chloroplasts, I. Kinetics and stoichiometry of fatty acid peroxidation. Arch. Biochem. Biophys. 1968, 125, 189–198. [Google Scholar] [CrossRef]
  61. Wolff, S.P. Ferrous ion oxidation in presence of ferric ion indicator xylenol orange for measurement of hydroperoxides. Meth. Enzymol. 1994, 233, 182–189. [Google Scholar]
  62. Li, X.; Zhang, L.; Ahammed, G.J.; Li, Z.X.; Wei, J.P.; Shen, C.; Yan, P.; Zhang, L.P.; Han, W.Y. Nitric oxide mediates brassinosteroid-induced flavonoid biosynthesis in Camellia sinensis L. J. Plant Physiol. 2017, 214, 145–151. [Google Scholar] [CrossRef] [PubMed]
  63. Yang, H.; Kim, H.J.; Chen, H.; Lu, Y.; Lu, X.Y.; Wang, C.C.; Zhou, B.Y. Reactive oxygen species and nitric oxide induce senescence of rudimentary leaves and the expression profiles of the related genes in Litchi chinensis. Hortic. Res. 2018, 5, 23. [Google Scholar] [CrossRef] [PubMed] [Green Version]
Figure 1. Expression level of GmPgb1 in roots and leaves of soybean plants exposed to Na2SO4 for 24 h. Measurements were taken in the WT line and lines overexpressing (GmPgb1(S)17) or downregulating (GmPgb1(RNAi)23) GmPgb1. Values are the means + SE of three biological replicates, each consisting of at least three plants.
Ijms 23 04072 g001
Figure 2. Retention, expressed as the percentage of control (Na2SO4), of the photosynthetic rate, the transpiration rate, the stomatal conductance, and the water use efficiency of Na2SO4-treated soybean plants overexpressing (GmPgb1(S)17) or downregulating (GmPgb1(RNAi)23) GmPgb1. Measurements were conducted after 24 h of treatment. Values are the means ± SE of at least three biological replicates each consisting of at least five plants. Letters indicate statistically significant differences (p < 0.05).
Ijms 23 04072 g002
Figure 3. Retention of the water content (WC) and dry weight and leaf injury of soybean plants exposed to Na2SO4 for seven days. Measurements were taken in the WT line and lines overexpressing (GmPgb1(S)17) or downregulating (GmPgb1(RNAi)23) GmPgb1. Values are the means ± SE of five biological replicates, each consisting of at least five plants. Letters indicate statistically significant differences (p < 0.05). Micrographs of leaves of waterlogged plants are also shown.
Ijms 23 04072 g003
Figure 4. Levels of Na+ (A), K+ (B), and Na+/K+ ratio (C) in WT plants and plants overexpressing (GmPgb1(S)17) or downregulating (GmPgb1(RNAi)23) GmPgb1. Values are the means ± SE of three biological replicates, each consisting of at least five plants. Letters indicate statistically significant differences (p < 0.05). (D) Relative transcript levels of GmSOS1 and GmAKT1 in the same plants.
Ijms 23 04072 g004
Figure 5. ROS and ROS-induced damage in leaves of soybean plants exposed to Na2SO4. (A) Level of H2O2 and malondialdehyde (MDA) in leaves of WT plants and plants overexpressing (GmPgb1(S)17) or downregulating (GmPgb1(RNAi)23) GmPgb1. Values are the means ± SE of three biological replicates, each consisting of at least three plants. Letters indicate statistically significant differences (p < 0.05). (B) Relative expression levels of respiratory burst oxidase homologs (RBOHB, D and G) in leaves of plants indicated in (A). Values are means ± SE of three biological replicates, each consisting of at least three plants.
Ijms 23 04072 g005
Figure 6. Relative transcript levels of antioxidant enzymes in leaves of soybean plants exposed to Na2SO4. Measurements were taken in the WT line and the lines overexpressing (GmPgb1(S)17) or downregulating (GmPgb1(RNAi)23) GmPgb1. Values are the means ± SE of three biological replicates, each consisting of at least three plants. (A) Superoxide dismutase (SOD1, 3) and catalase (CAT 1, 2). (B) Ascorbate peroxidase 1 (APX1), monodehydroascorbate reductase (MDHAR1, 4), dehydroascorbate reductase (DHAR1), and glutathione reductase (GR1, 2).
Ijms 23 04072 g006
Figure 7. Enzymatic activity of ascorbate peroxidase (APX), monodehydroascorbate reductase (MDHAR), dehydroascorbate reductase (DHAR), glutathione reductase (GR), catalase (CAT), and superoxide dismutase (SOD) in soybean plants exposed to Na2SO4. Measurements were taken in the WT line and the lines overexpressing (GmPgb1(S)17) or downregulating (GmPgb1(RNAi)23) GmPgb1. Values are the means ± SE of three biological replicates, each consisting of at least three plants. Letters indicate statistically significant differences (p < 0.05).
Ijms 23 04072 g007
Figure 8. Expression level of GmPgb1 in roots and leaves of commercial soybean cultivars exposed to Na2SO4. Cultivars were denoted as tolerant (1, 2, 3) or susceptible (16, 17, 18) to Na2SO4 stress. Values are the means ± SE of three biological replicates, each consisting of at least three plants.
Ijms 23 04072 g008
Publisher’s Note: MDPI stays neutral with regard to jurisdictional claims in published maps and institutional affiliations.

