Abstract
Resistin and soluble suppression of tumorigenicity 2 (sST2) are useful predictors in patients with coronary artery disease (CAD). Their serum levels are significantly attributed to variations in RETN and IL1RL1 loci. We investigated candidate variants in the RETN locus for resistin levels and those in the IL1RL1 locus for sST2 levels and evaluated the prognostication of these two biomarkers and the corresponding variants for long-term outcomes in the patients with CAD. We included 4652, 557, and 512 Chinese participants from the Taiwan Biobank (TWB), cardiovascular health examination (CH), and CAD cohorts, respectively. Candidate variants in RETN and IL1RL1 were investigated using whole-genome sequence (WGS) and genome-wide association study (GWAS) data in the TWB cohort. The weighted genetic risk scores (WGRS) of RETN and IL1RL1 with resistin and sST2 levels were calculated. Kaplan–Meier curves were used to analyze the prognostication of resistin and sST2 levels, WGRS of RETN and IL1RL1, and their combinations. Three RETN variants (rs3219175, rs370006313, and rs3745368) and two IL1RL1 variants (rs10183388 and rs4142132) were independently associated with resistin and sST2 levels as per the WGS and GWAS data in the TWB cohort and were further validated in the CH and CAD cohorts. In combination, these variants explained 53.7% and 28.0% of the variation in resistin and sST2 levels, respectively. In the CAD cohort, higher resistin and sST2 levels predicted higher rates of all-cause mortality and major adverse cardiac events (MACEs) during long-term follow-up, but WGRS of RETN and IL1RL1 variants had no impact on these outcomes. A synergistic effect of certain combinations of biomarkers with RETN and IL1RL1 variants was found on the prognostication of long-term outcomes: Patients with high resistin levels/low RETN WGRS and those with high sST2 levels/low IL1RL1 WGRS had significantly higher all-cause mortality and MACEs rates, and those with both these combinations had the poorest outcomes. Both higher resistin and sST2 levels, but not RETN and IL1RL1 variants, predict poor long-term outcomes in patients with CAD. Furthermore, combining resistin and sST2 levels with the WGRS of RETN and IL1RL1 genotyping exerts a synergistic effect on the prognostication of CAD outcomes. Future studies including a large sample size of participants with different ethnic populations are needed to verify this finding.
1. Introduction
Despite advancements in guideline-directed medical therapy, cardiovascular diseases remain the leading cause of disease burden and mortality worldwide. The global prevalence of cardiovascular disease nearly doubled from 271 million in 1990 to 523 million in 2019, and the number of cardiovascular deaths steadily increased from 12.1 million in 1990 to 18.6 million in 2019, half of which were due to ischemic heart disease [1]. To provide new insights into cardiovascular disease pathophysiology and to improve patient prognosis, investigators in the past two decades have focused on the association of numerous adipokines/cytokines with cardiovascular disease. Among these, resistin and suppression of tumorigenicity 2 (ST2) have attracted increasing interest in the past 10 years.
Resistin, belonging to a family of cysteine-rich proteins known as resistin-like molecules, was originally shown to be synthesized only by adipocytes and was demonstrated to induce insulin resistance in mice [2]. In humans, however, this protein appears to be expressed mainly by monocyte-derived macrophages [3]. As a proinflammatory adipokine in humans, resistin markedly upregulates the expression of inflammatory cytokines and cellular adhesive molecules [4,5]. Resistin appears to mediate the pathogenesis of atherosclerosis by promoting endothelial dysfunction, vascular smooth muscle cell proliferation, arterial inflammation, and foam cell formation [6,7]. It is predictive of atherosclerosis and poor clinical outcomes in patients with coronary artery disease (CAD), ischemic stroke, and congestive heart failure [7,8].
Approximately 70% of the observed variation in circulating resistin levels may be attributable to genetic factors [9], and several candidate genetic loci for resistin levels have been identified in different ethnic populations [9,10,11,12]. Genetic polymorphisms around the RETN locus are also related to resistin levels and various metabolic phenotypes, with discrepant results [11,12,13,14,15,16].
The ST2 receptor, a member of the interleukin (IL)-1 receptor family encoded by the IL-1 receptor-like 1 (IL1RL1) gene, is expressed as a membrane-bound receptor variant form (ST2L) and a truncated soluble form (sST2) [17]. IL-33, a biomechanically induced protein predominantly synthesized by cardiac fibroblasts, is the functional ligand of ST2L [18,19]. The IL-33/ST2 signaling pathway is upregulated in cardiomyocytes and fibroblasts in response to mechanical stimulation or injury and is cardioprotective in terms of reducing myocardial fibrosis, preventing cardiomyocyte hypertrophy, reducing apoptosis, and improving myocardial function [19,20]. By contrast, sST2 binds to IL-33 and acts as a “decoy” receptor for IL-33 to inhibit IL-33/ST2L signaling [19]. An elevated sST2 level is an independent predictor of subsequent mortality in patients with heart failure, acute myocardial infarction, and stable CAD [21,22,23,24,25].
IL1RL1 variations can affect sST2 levels. In the genome-wide association study (GWAS) of the Framingham offspring cohort, up to 45% of the variation in sST2 levels not explained by clinical variables was attributed to genetic factors [26]. The most significant single nucleotide polymorphism (SNP) is rs950880, accounting for 12% of the individual variability in circulating sST2 levels. SNPs in the IL1RL1 gene have also been linked to the severity of several immune and inflammatory diseases [27]. However, the effects of IL1RL1 on predicting the outcome of cardiovascular disease remain unclear.
Our recent study indicated that individuals with the rs950880 AA genotype tended to have lower sST2 levels [28]; this genotype was an independent predictor of all-cause mortality in patients with CAD and lower-extremity arterial disease, and patients with high sST2 levels and the rs950880 AA genotype had the lowest survival rate. However, whether other biomarker levels can predict long-term outcomes in patients with CAD when combined with level-determining genotypes remains unknown. The Taiwan Biobank (TWB) conducted a large-scale population-based cohort study on 30–70-year-old volunteers with no history of cancer [29]. The genetic determinants of resistin and sST2 levels were derived from a regional association plot analysis using whole-genome sequence (WGS) data in a subgroup of 859 participants from the TWB cohort and from GWAS in 5000 participants from the TWB cohort. The weighted genetic risk scores (WGRS) of RETN and IL1RL1 with resistin and sST2 levels were calculated using the data of independent level-determining genotypes. We hypothesized that WGRS of RETN and IL1RL1 combined with both biomarker levels may better predict the long-term outcomes of patients with CAD.
2. Results
2.1. WGS Revealed Candidate SNPs in RETN and IL1RL1 Gene Loci
Given the previously reported RETN gene as the candidate locus for resistin levels, we first performed a regional association plot study with conditional analysis using data from 859 participants from the TWB cohort and the significance of resistin levels with 509 SNPs at positions between 7.715 and 7.755 Mb on chromosome 19p13.2 around the RETN gene region was assessed. Our data revealed that 17 SNPs exceeded the genome-wide significance threshold (p < 5 × 10⁻⁸), with rs3219175 being the lead SNP (p = 4.24 × 10−72) (Supplementary Figure S1A). To clarify whether the association of other RETN SNPs was independent of the lead SNP, we performed a stepwise conditional analysis. With adjustment for rs3219175, rs370006313 in the regional plot at the RETN locus became more significant with resistin levels (p = 6.56 × 10−68, Supplementary Figure S1B). Furthermore, with adjustment for both rs3219175 and rs370006313, rs3745368 remained significant (p = 1.24 × 10⁻²⁷, Supplementary Figure S1C). With adjustment for all the three SNPs, none of the SNPs in the regional plot near the RETN locus exhibited significance at p < 0.01 (Supplementary Figure S1D), indicating that in this chromosomal region, variation in resistin concentrations was mainly explained by at least three signals.
We further evaluated the candidate gene variants for sST2 levels in the IL1RL1 gene region using a regional association plot study with conditional analysis. In brief, 307 SNPs at positions between 102.915 and 102.985 Mb on chromosome 2q12.1 around the IL1RL1 gene region were analyzed, and 242 SNPs exceeded the genome-wide significance threshold (p < 5 × 10⁻⁸), with rs6543115 being the lead SNP (p = 2.35 × 10−85) (Supplementary Figure S2A). With adjustment for rs6543115, rs1420091 in the regional plot at the IL1RL1 locus became more significant with sST2 levels (p = 3.57 × 10⁻¹⁵, Supplementary Figure S2B). With adjustment for the two aforementioned SNPs, none of the SNPs initially showed genome-wide significance in the regional plot near the IL1RL1 locus exhibited significance at p < 0.01 (Supplementary Figure S2C).
2.2. GWAS and Replication Genotyping Results for Resistin and sST2 Levels
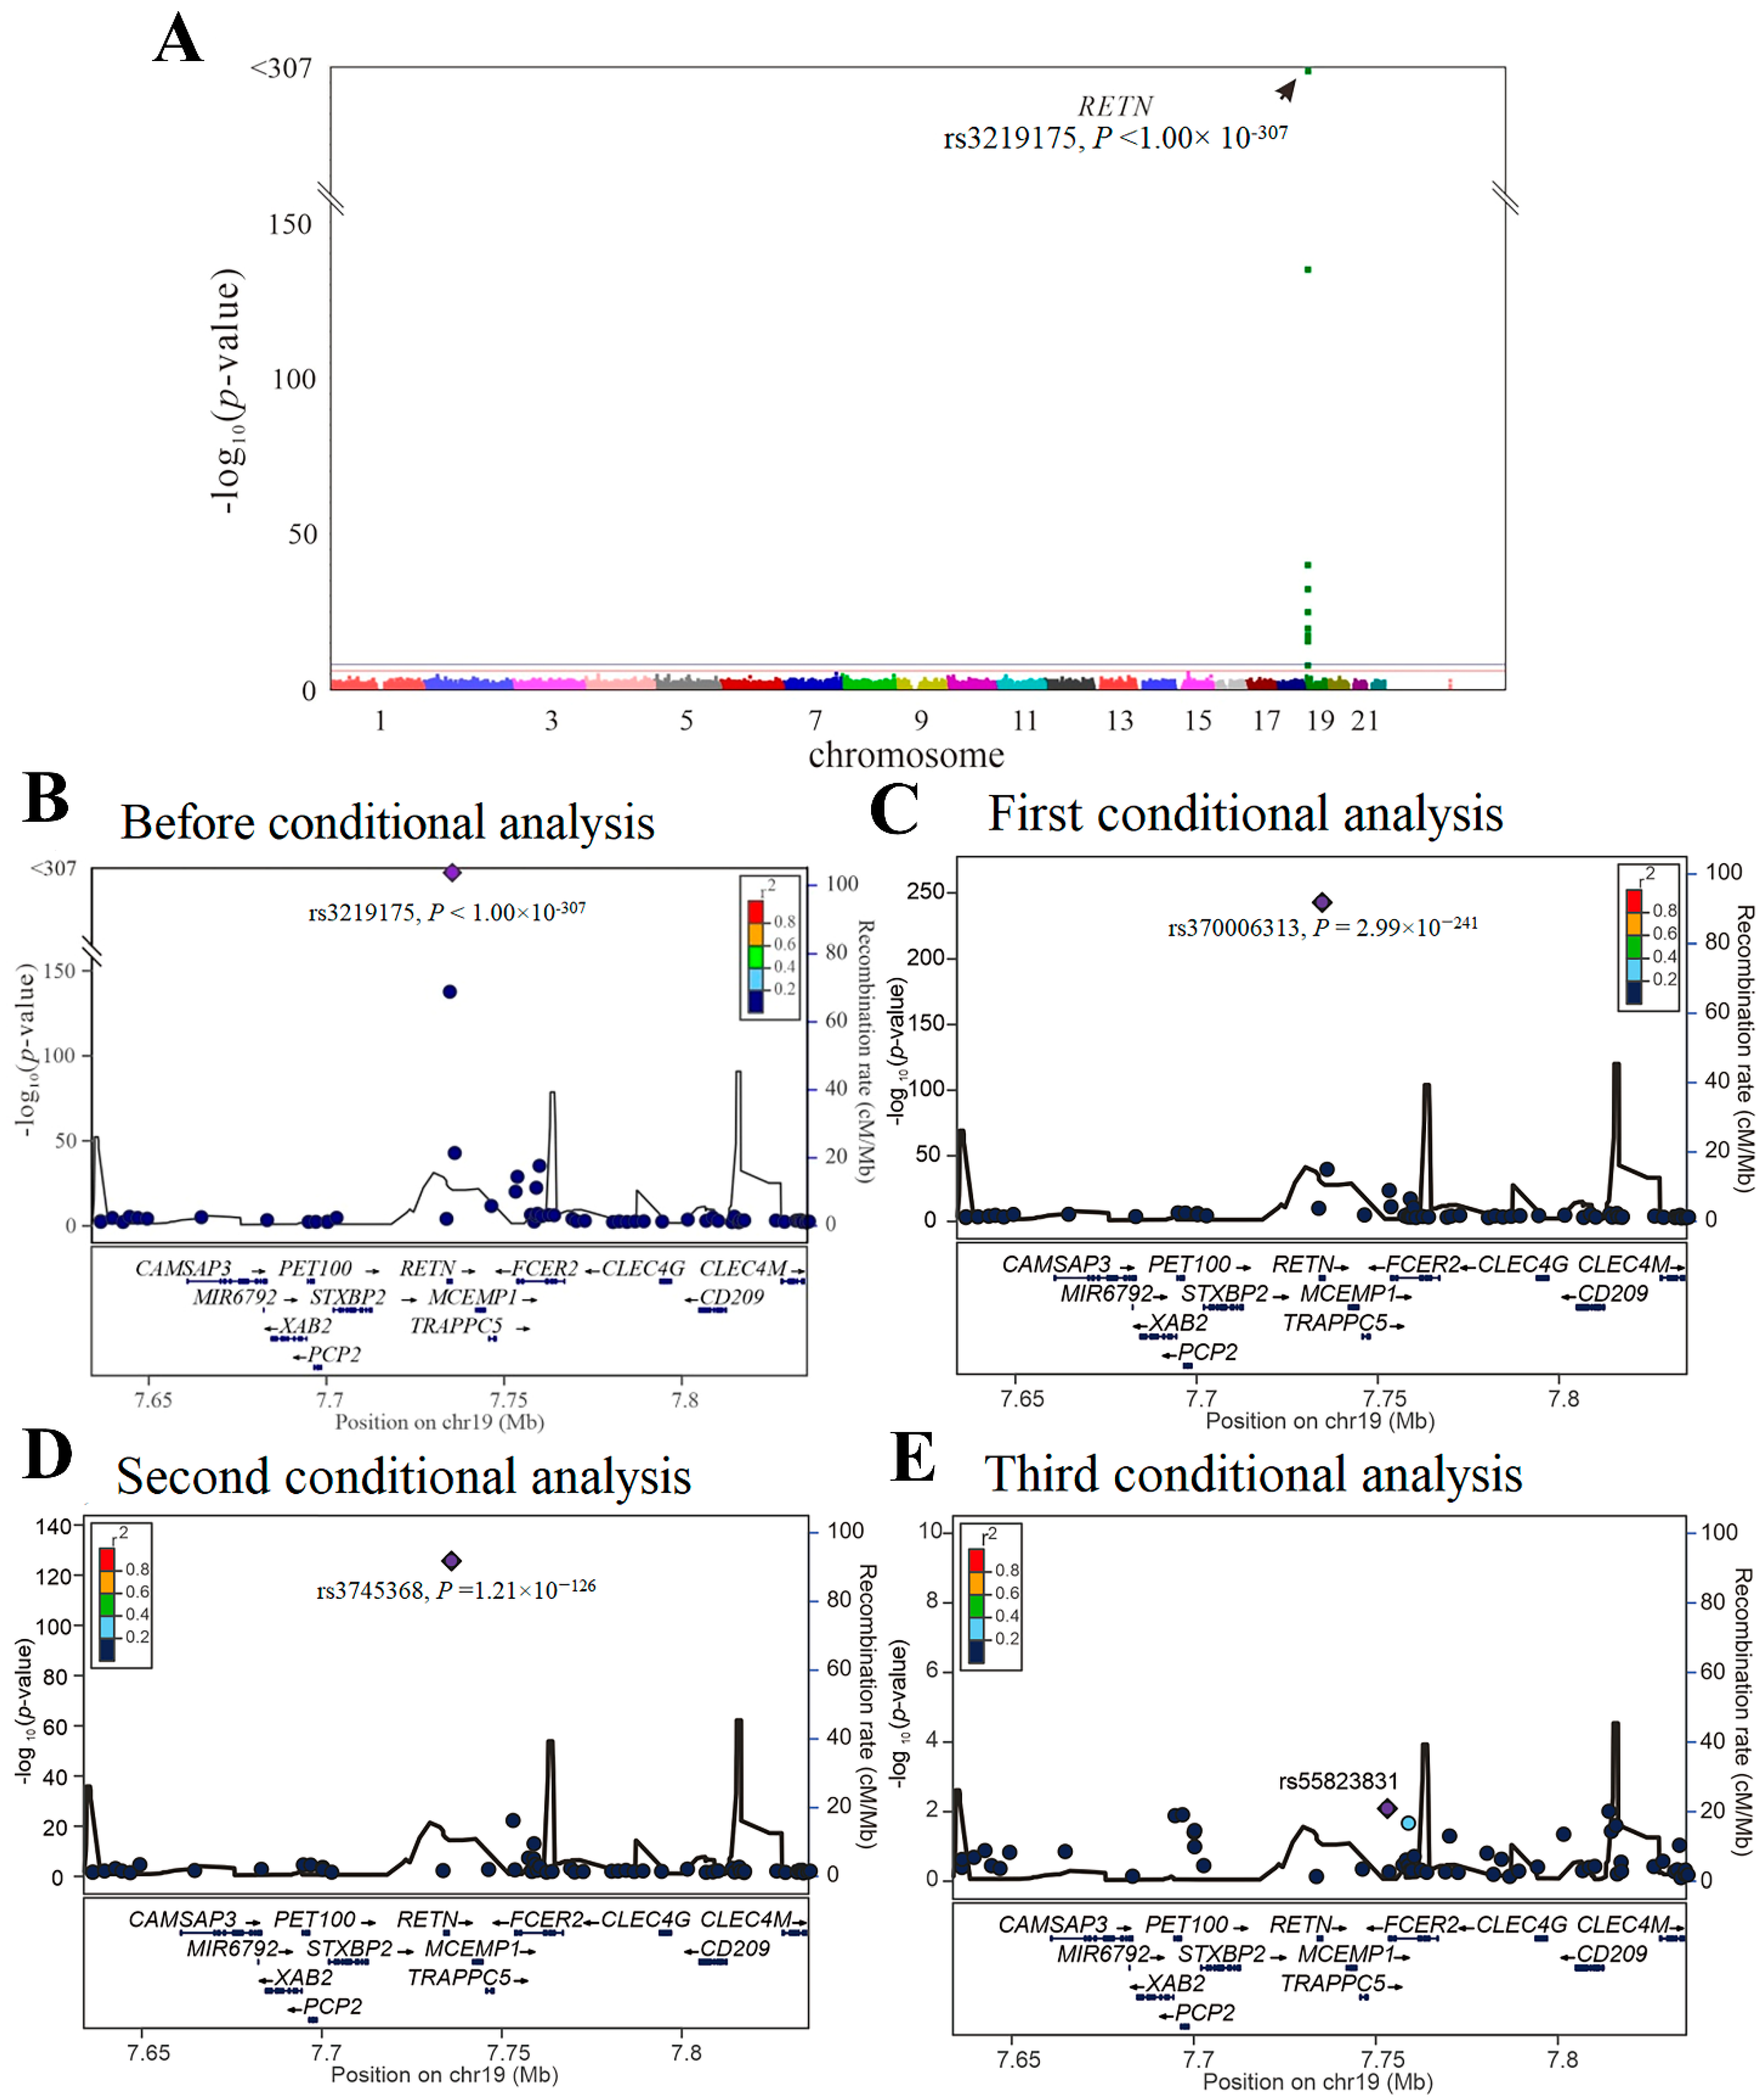
We then performed GWAS using the data of 4652 participants from the TWB cohort on a TWB genotype array for resistin levels. Because of the absence of the three lead aforementioned RETN SNPs (i.e., rs3219175, rs370006313, and rs3745368) in the TWB genotype array, we performed genotyping of the three RETN SNPs using TaqMan SNP Genotyping Assays. GWAS with conditional analysis indicated that the genome-wide significance threshold was exceeded only on chromosome 19p13.2, where RETN is located, and serial conditional analysis revealed the lead SNPs to be rs3219175, rs370006313, and rs3745368 (p < 1.00 × 10−307, p = 2.99 × 10−241, and p = 1.21 × 10−126, respectively) (Figure 1).
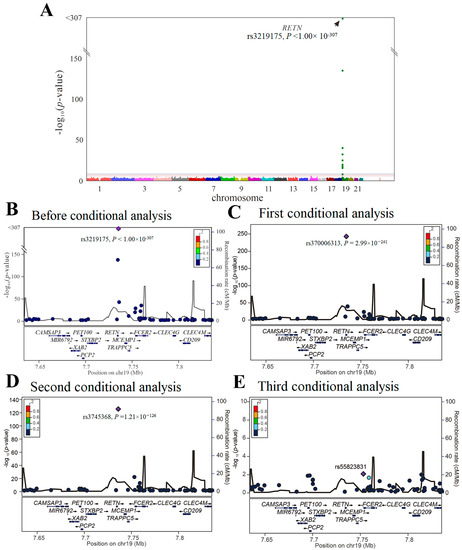
Figure 1.
Conditional analysis of RETN candidate SNPs using GWAS data in the TWB cohort. (A) Manhattan plots for resistin levels from the genome-wide association study of 4652 Taiwan Biobank participants depict the only one peak above genome-wide significance on chromosome 19p13.2, where the RETN gene is located (arrow). (B) Before conditional analysis, regional association plots for resistin level surrounding the RETN locus show rs3219175 as the lead SNP. (C) After the first conditional analysis adjusting the rs3219175 genotypes, rs370006313 in the regional plot at the RETN locus becomes a significant association with resistin levels. (D) After the second conditional analysis adjusting for both rs3219175 and rs370006313 genotypes, rs3745368 is significantly associated with resistin levels. (E) After the third conditional analysis adjusting for the aforementioned SNPs, no more single SNP is found to be genome-wide significantly associated with resistin levels.
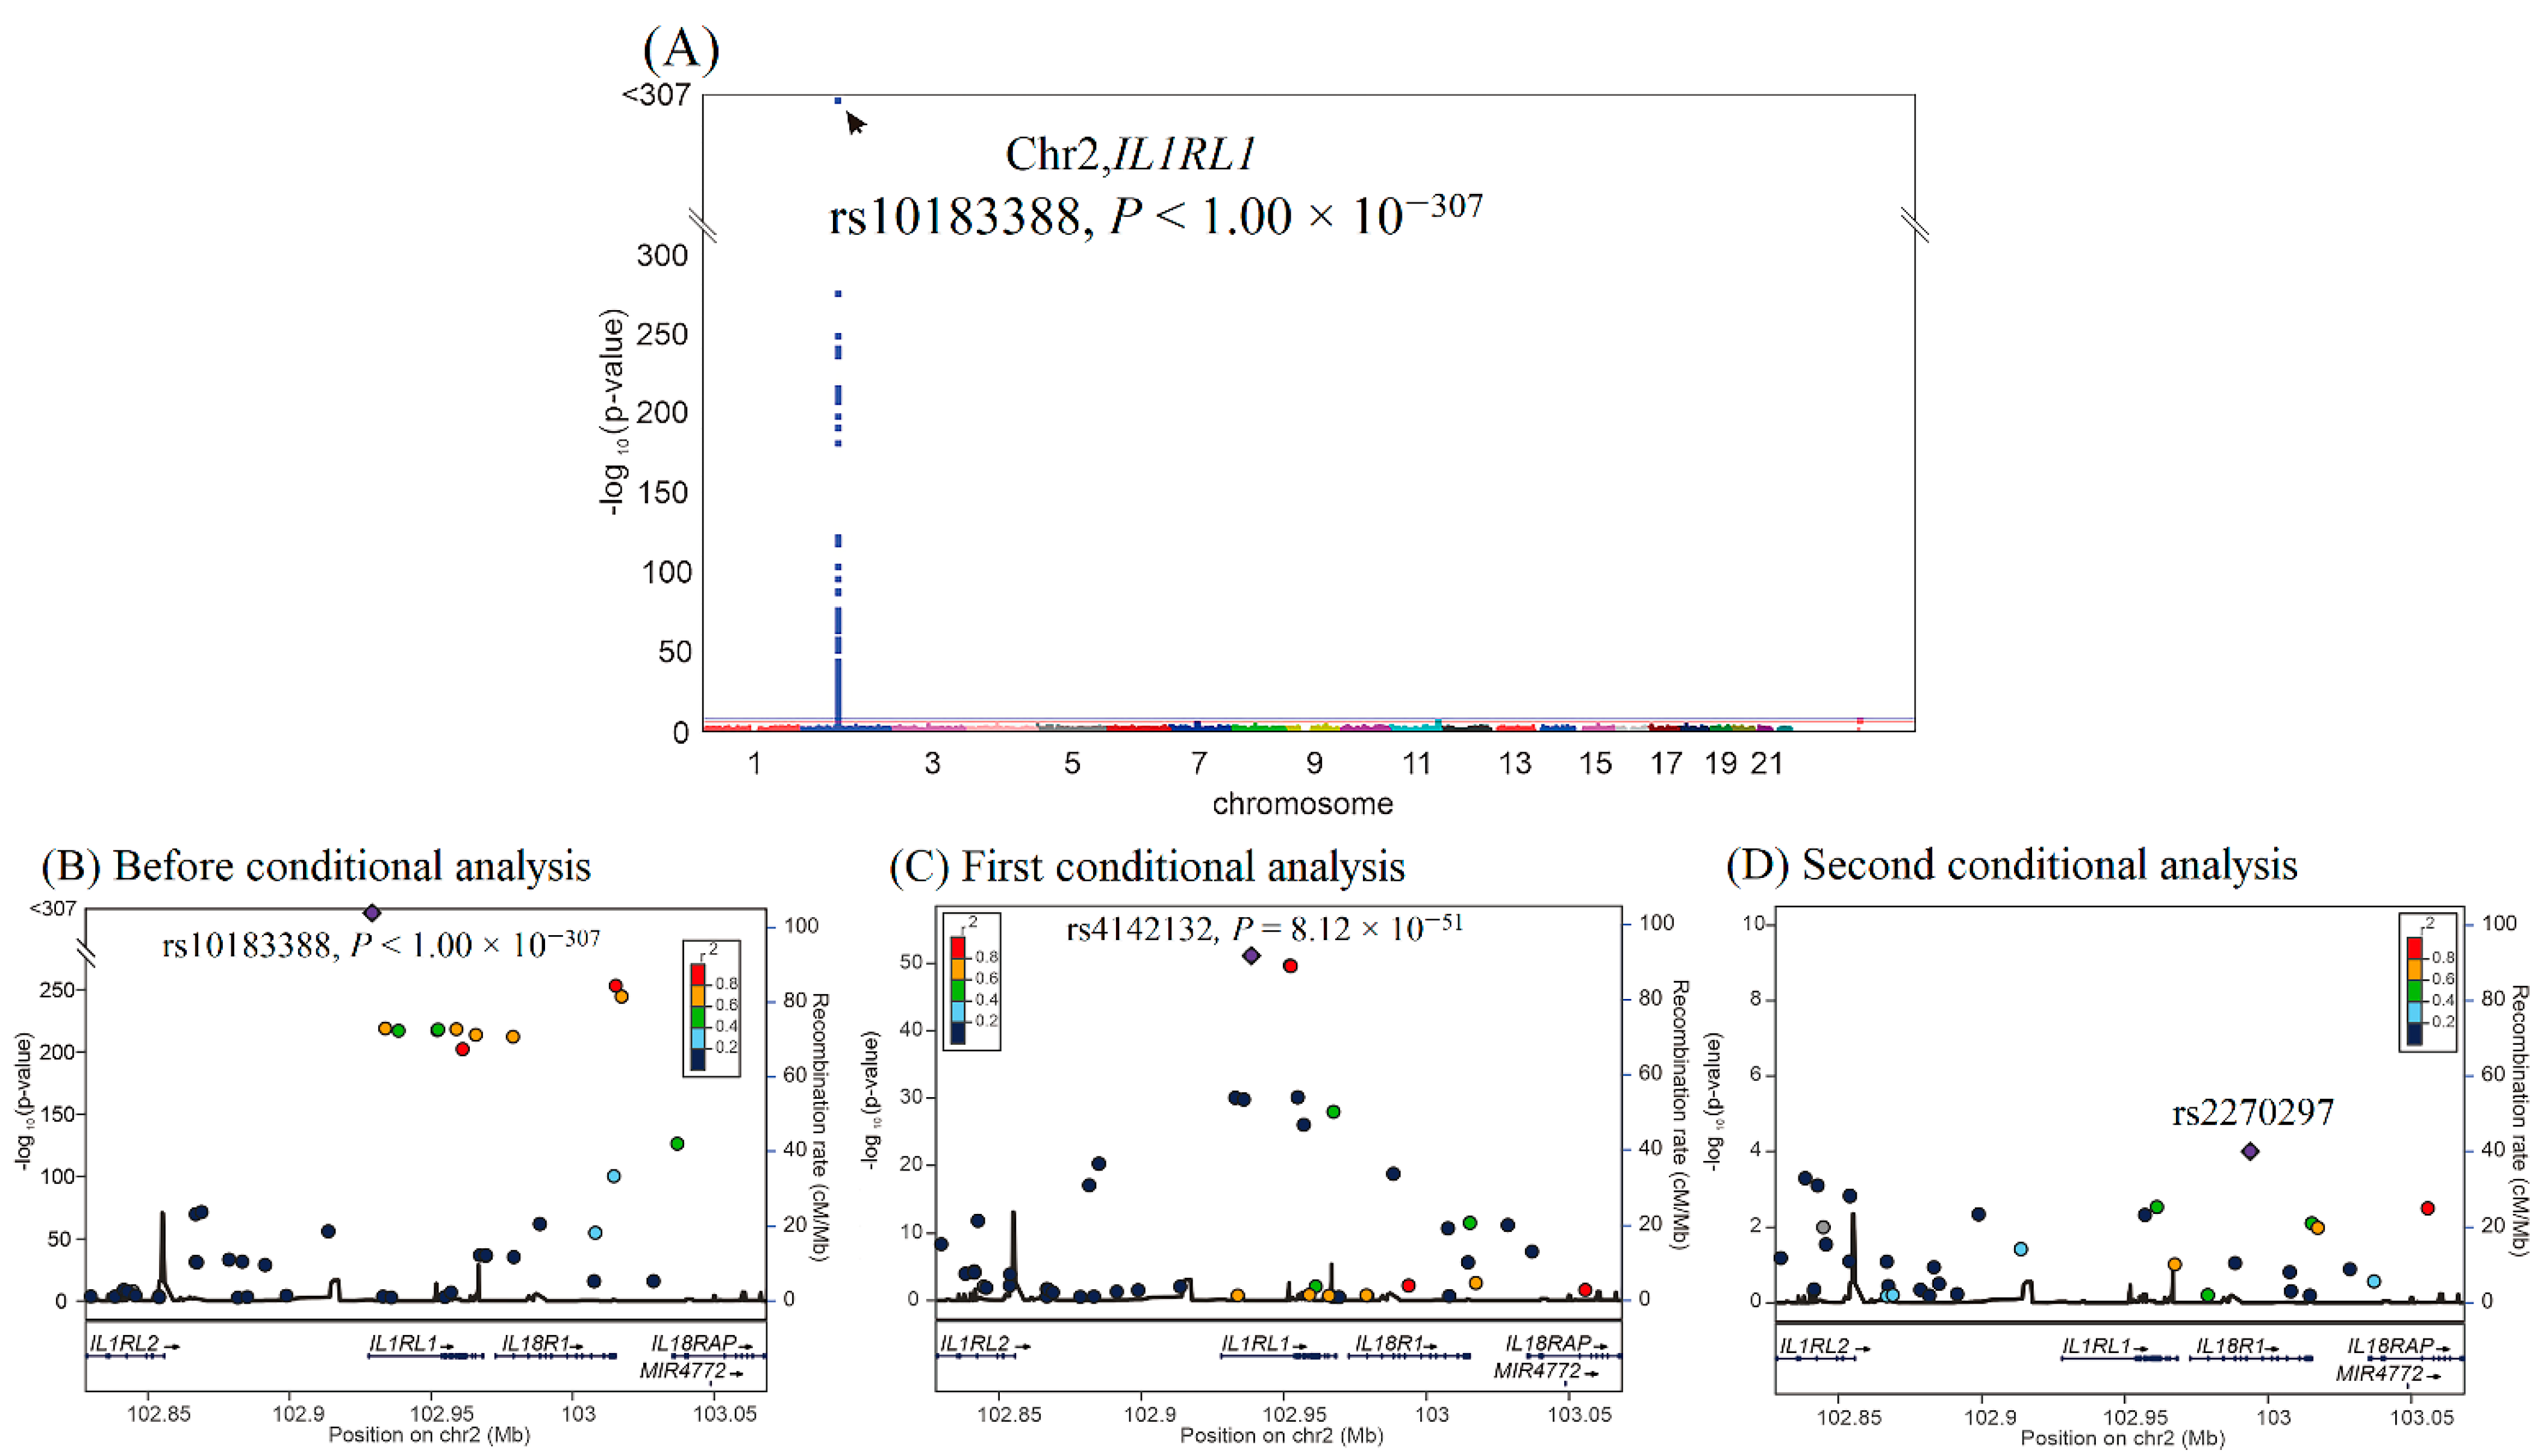
We then performed GWAS using the data of 4652 participants from the TWB cohort on a TWB genotype array for sST2 levels. GWAS with conditional analysis indicated that the genome-wide significance threshold was exceeded only on chromosome 2q12.1, where IL1RL1 is located, and serial conditional analysis revealed that the lead SNPs were rs10183388 and rs4142132 (p < 1.00 × 10−307 and p = 8.12 × 10−51, respectively) (Figure 2). Further analysis revealed that rs10183388 and rs4142132 were in nearly complete linkage disequilibrium with the IL1RL1 lead SNPs rs6543115 and rs1420091, respectively, in the WGS study (r2 = 0.98 and 0.96, respectively) (Supplementary Figure S3). The three lead RETN SNPs explained 53.7% of the variation in resistin levels, and the two lead IL1RL1 SNPs explained 28.0% of the variation in sST2 levels (Supplementary Table S1). The SNP table of RETN and IL1RL1 is provided in Supplementary Table S2.
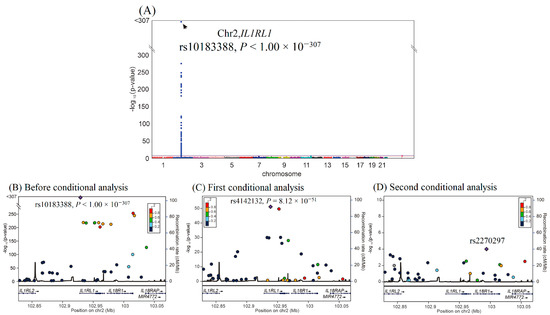
Figure 2.
Conditional analysis of IL1RL1 candidate SNPs using GWAS data in the TWB cohort. (A) Manhattan plots for sST2 levels from the genome-wide association study of 4652 Taiwan Biobank participants depict the only one peak above genome-wide significance on chromosome 2q12.1, where the IL1RL1 gene is located (arrow). (B) Before conditional analysis, regional association plots for sST2 levels around the IL1RL1 locus show rs10183388 as the lead SNP. (C) After the first conditional analysis adjusting for rs10183388 genotype, rs4142131 in the regional plot at the IL1RL1 locus becomes a significant association with sST2 levels. (D) After the second conditional analysis adjusting for both rs10183388 and rs4142131, no more single SNP is found to be associated with sST2 levels significantly.
For the validation study, we analyzed the three lead RETN SNPs for resistin levels and two lead IL1RL1 SNPs for sST2 levels in the cardiovascular health examination cohort (CH cohort). As shown in Table 1, the three RETN SNPs were significantly associated with resistin levels (rs3219175, rs370006313, and rs3745368 genotypes, p = 6.77 × 10−41, p = 1.36 × 10⁻¹², and p = 2.70 × 10⁻⁵, respectively), and the two IL1RL1 SNPs were significantly associated with sST2 levels (rs10183388 and rs4142132 genotypes, p = 9.11 × 10⁻¹⁶ and p = 2.73 × 10⁻⁸, respectively).

Table 1.
Associations of RETN SNPs with resistin levels and IL1RL1 SNPs with sST2 levels in the study populations.
We evaluated the association of the RETN and IL1RL1 SNPs with resistin and sST2 levels in the patients with CAD (Table 1), and the results revealed significant associations, except for rs370006313 genotypes for resistin levels (rs3219175, rs370006313, and rs3745368 genotypes for resistin levels, p = 4.89 × 10⁻¹⁵, p = 0.055, and p = 0.001, respectively, and rs10183388 and rs4142132 genotypes for sST2 levels, p = 4.49 × 10⁻⁸ and p = 8.00 × 10⁻⁶, respectively).
2.3. Baseline Characteristics of TWB, CH, and CAD Cohorts
The baseline characteristics of the participants in the TWB, CH, and CAD cohorts are provided in Table 2. The participants in the CAD cohort were older, with male predominance, and they tended to have a higher prevalence of smoking, obesity, hypertension, diabetes mellitus, and dyslipidemia. Compared with the TWB and CH cohorts, the CAD cohort had higher fasting glucose, triglyceride, aspartate aminotransferase (AST), and uric acid levels; higher leukocyte counts; lower total cholesterol, high-density lipoprotein (HDL)-cholesterol, and low-density lipoprotein (LDL)-cholesterol levels; and lower hematocrit, platelet counts, and estimated glomerular filtration rate (eGFR). The patients with CAD also had higher resistin levels but lower sST2 levels.
Table 2.
Baseline characteristics between TWB, CH, and CAD groups.
2.4. Correlations of Resistin and sST2 Levels with Clinical, Metabolic, Biochemical, Hematological Parameters, and WGRS of SNPs in All Cohorts
The correlations of resistin and sST2 levels with clinical, metabolic, biochemical, and hematological parameters and WGRS of SNPs are summarized in Supplementary Tables S3–S5. Resistin levels were strongly correlated with RETN WGRS in all three cohorts. Resistin levels were also significantly correlated with the lipid profile, eGFR, leukocyte count, and platelet count in the TWB cohort and with eGFR, leukocyte count, and hematocrit in the CAD cohort. Similarly, sST2 levels were strongly correlated with IL1RL1 WGRS in all three cohorts. sST2 levels were significantly correlated with fasting glucose, lipid profile, AST, uric acid, eGFR, and leukocyte count in the TWB cohort and with eGFR and leukocyte count in the CAD cohort.
2.5. Association of Resistin Levels and RETN SNPs with Long-Term Outcomes for the Patients with CAD
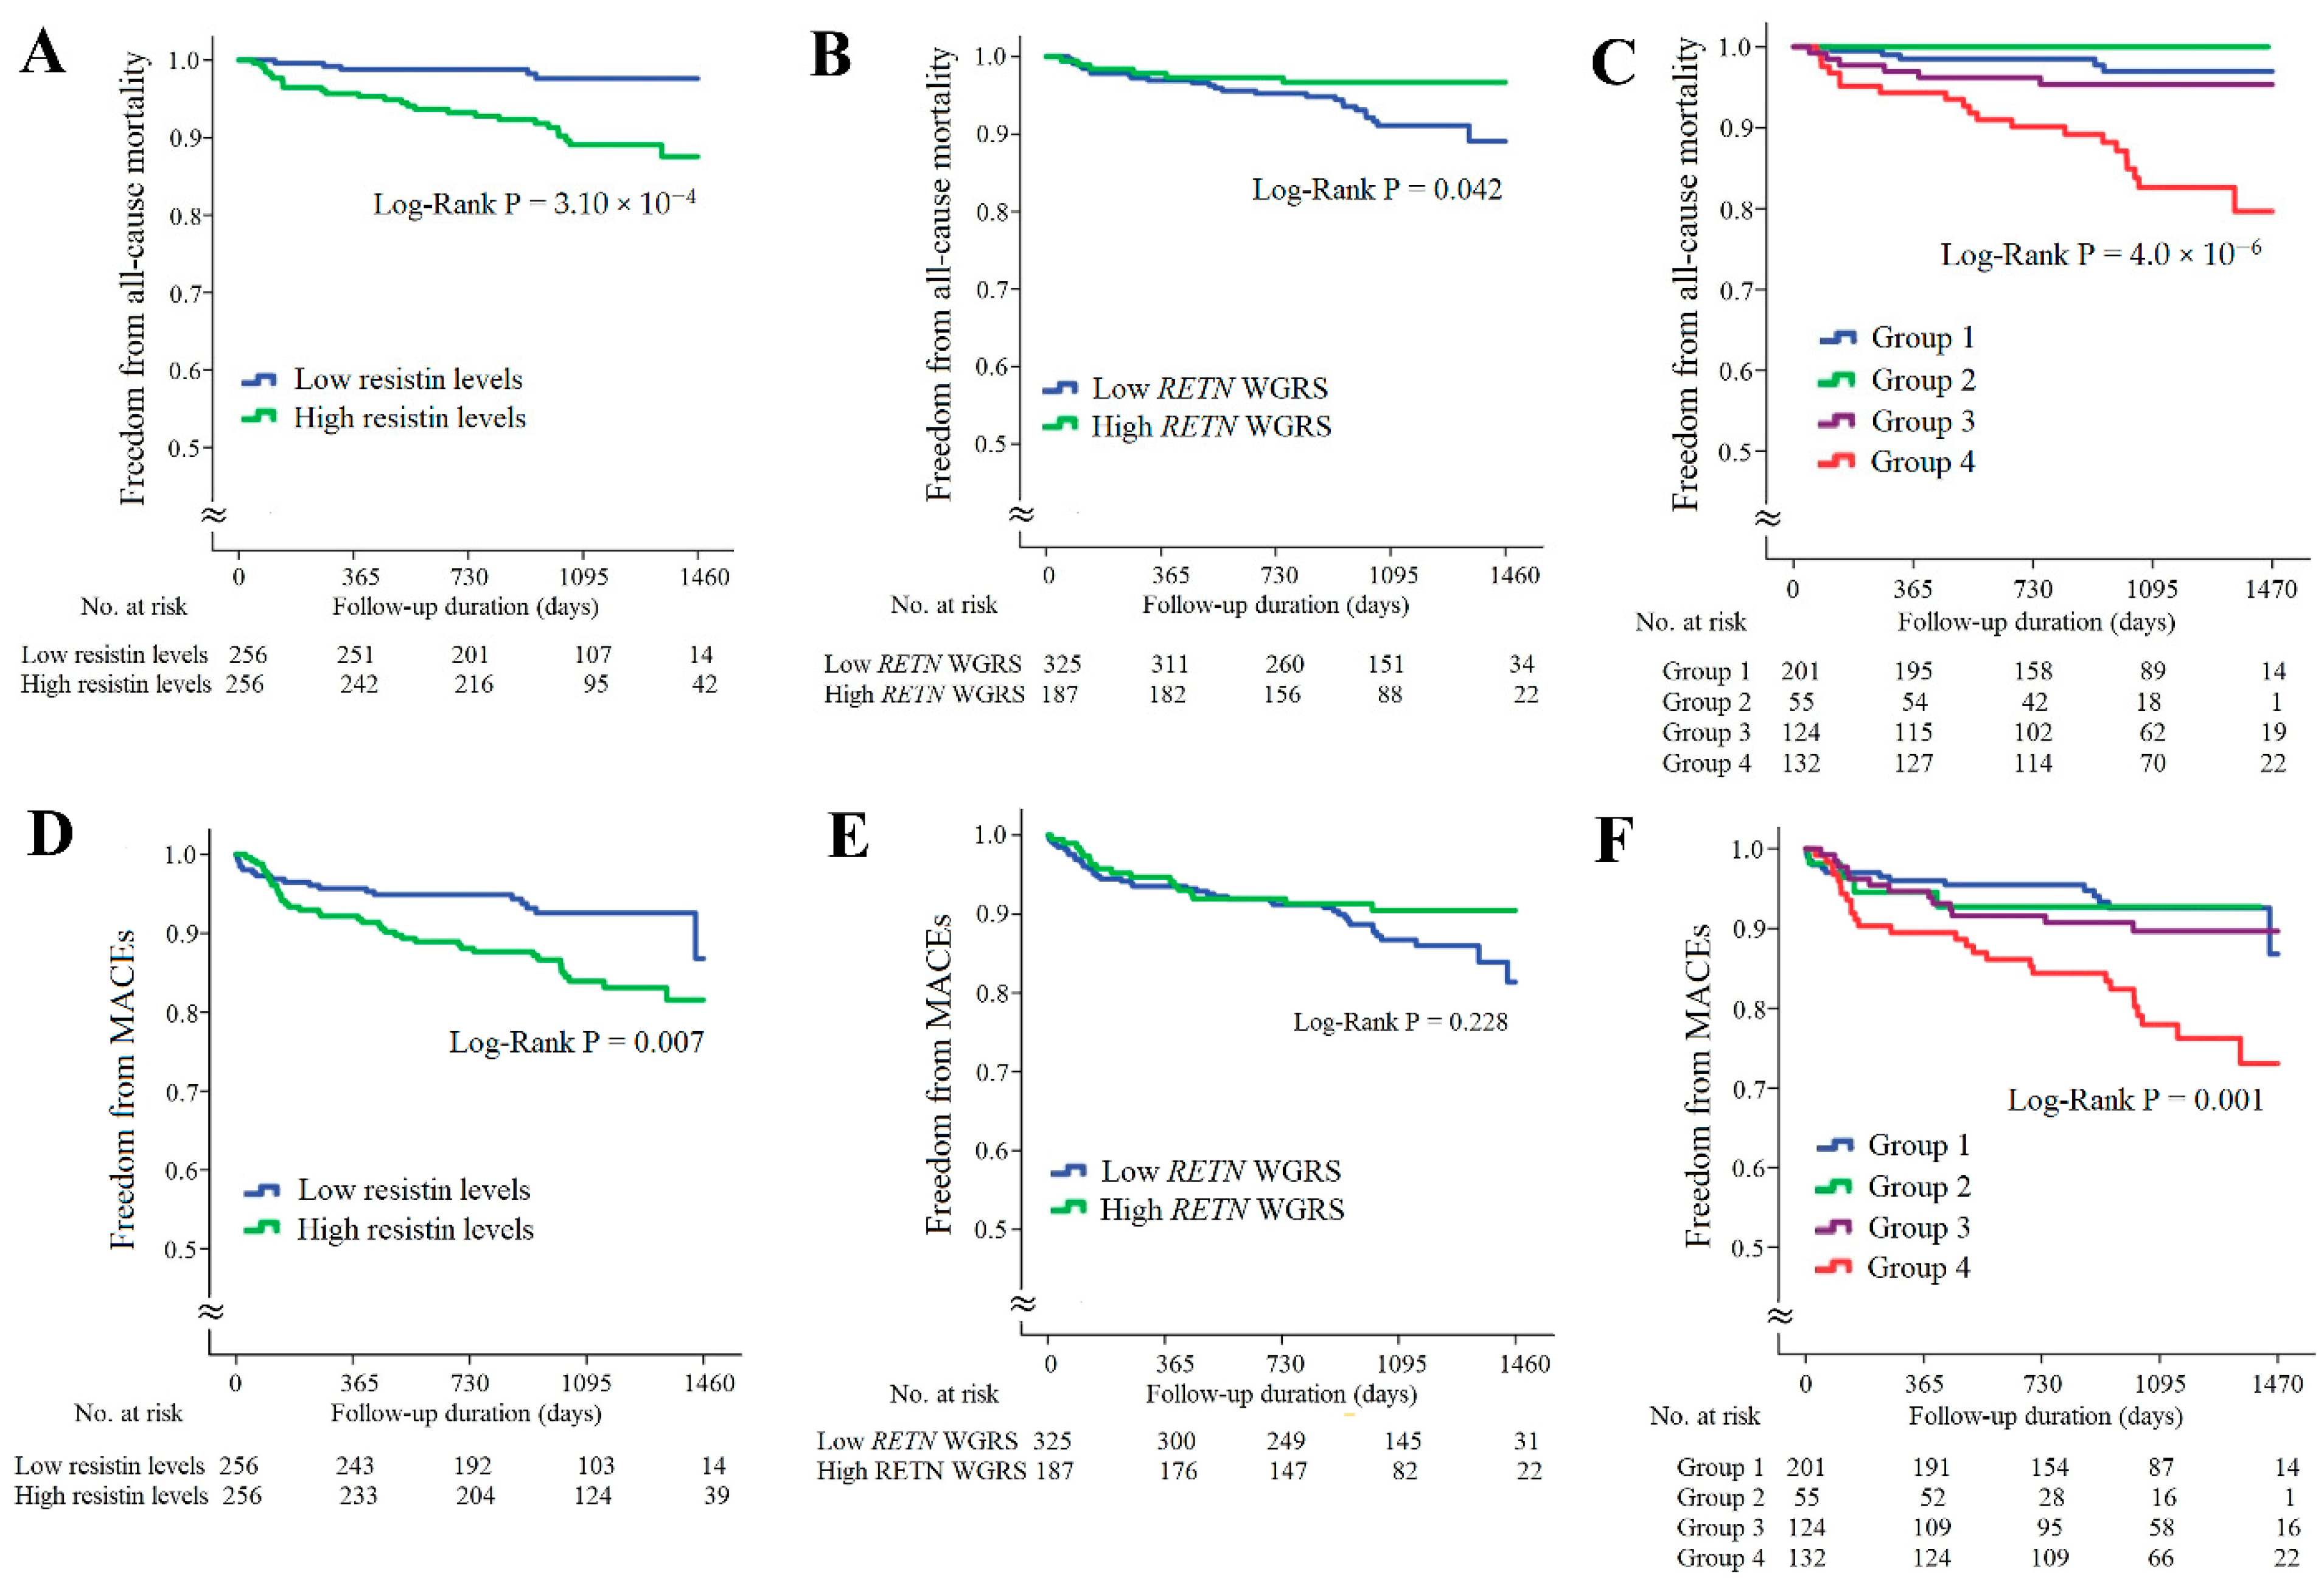
In the CAD cohort, the follow-up duration was 1017 ± 324 days; 32 patients died and 58 patients developed major adverse cardiac events (MACEs). Kaplan–Meier survival analysis indicated that the patients with higher resistin levels had significantly higher rates of all-cause mortality and MACEs (Figure 3A,D, p = 3.10 × 10⁻⁴ and p = 0.007, respectively). The patients with lower RETN WGSR also had a higher rate of all-cause mortality, but RETN WGRS did not predict the MACEs rate (Figure 3B,E, p = 0.042 and p = 0.228, respectively). When the patients with CAD were further divided into four subgroups according to the resistin levels and RETN WGRS, the combination of high resistin levels and low RETN WGRS was a strong predictor of all-cause mortality and MACEs (Figure 3C,F, p = 4.0 × 10⁻⁶ and p = 0.001, respectively). The results of Cox regression analysis of all-cause mortality and MACEs between the groups stratified by the resistin levels and RETN WGRS are presented in Supplementary Table S6.
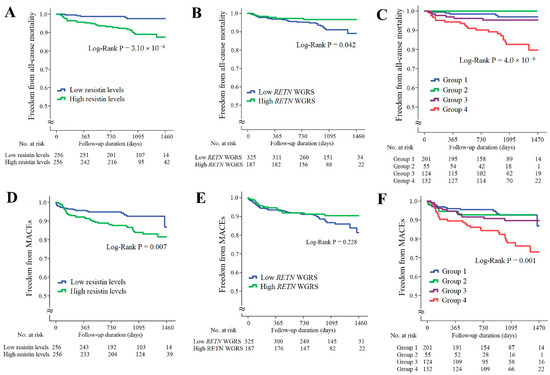
Figure 3.
Kaplan–Meier curve analysis of resistin levels and RETN WGRS with long-term outcome in the patients with CAD. (A–C) Freedom from all-cause mortality in patients stratified by resistin levels, RETN WGRS, and combination of resistin levels and RETN WGRS. (D–F) Freedom from MACEs in patients stratified by resistin levels, RETN WGRS, and combination of resistin levels and RETN WGRS. WGRS, weighted genetic risk scores; MACEs, major adverse cardiac events. Group 1: low resistin levels/low RETN WGRS; Group 2: low resistin levels/high RETN WGRS; Group 3: high resistin levels/high RETN WGRS; Group 4: high resistin levels/low RETN WGRS.
2.6. Associations of sST2 Levels and IL1RL1 SNPs with Long-Term Outcome for the Patients with CAD
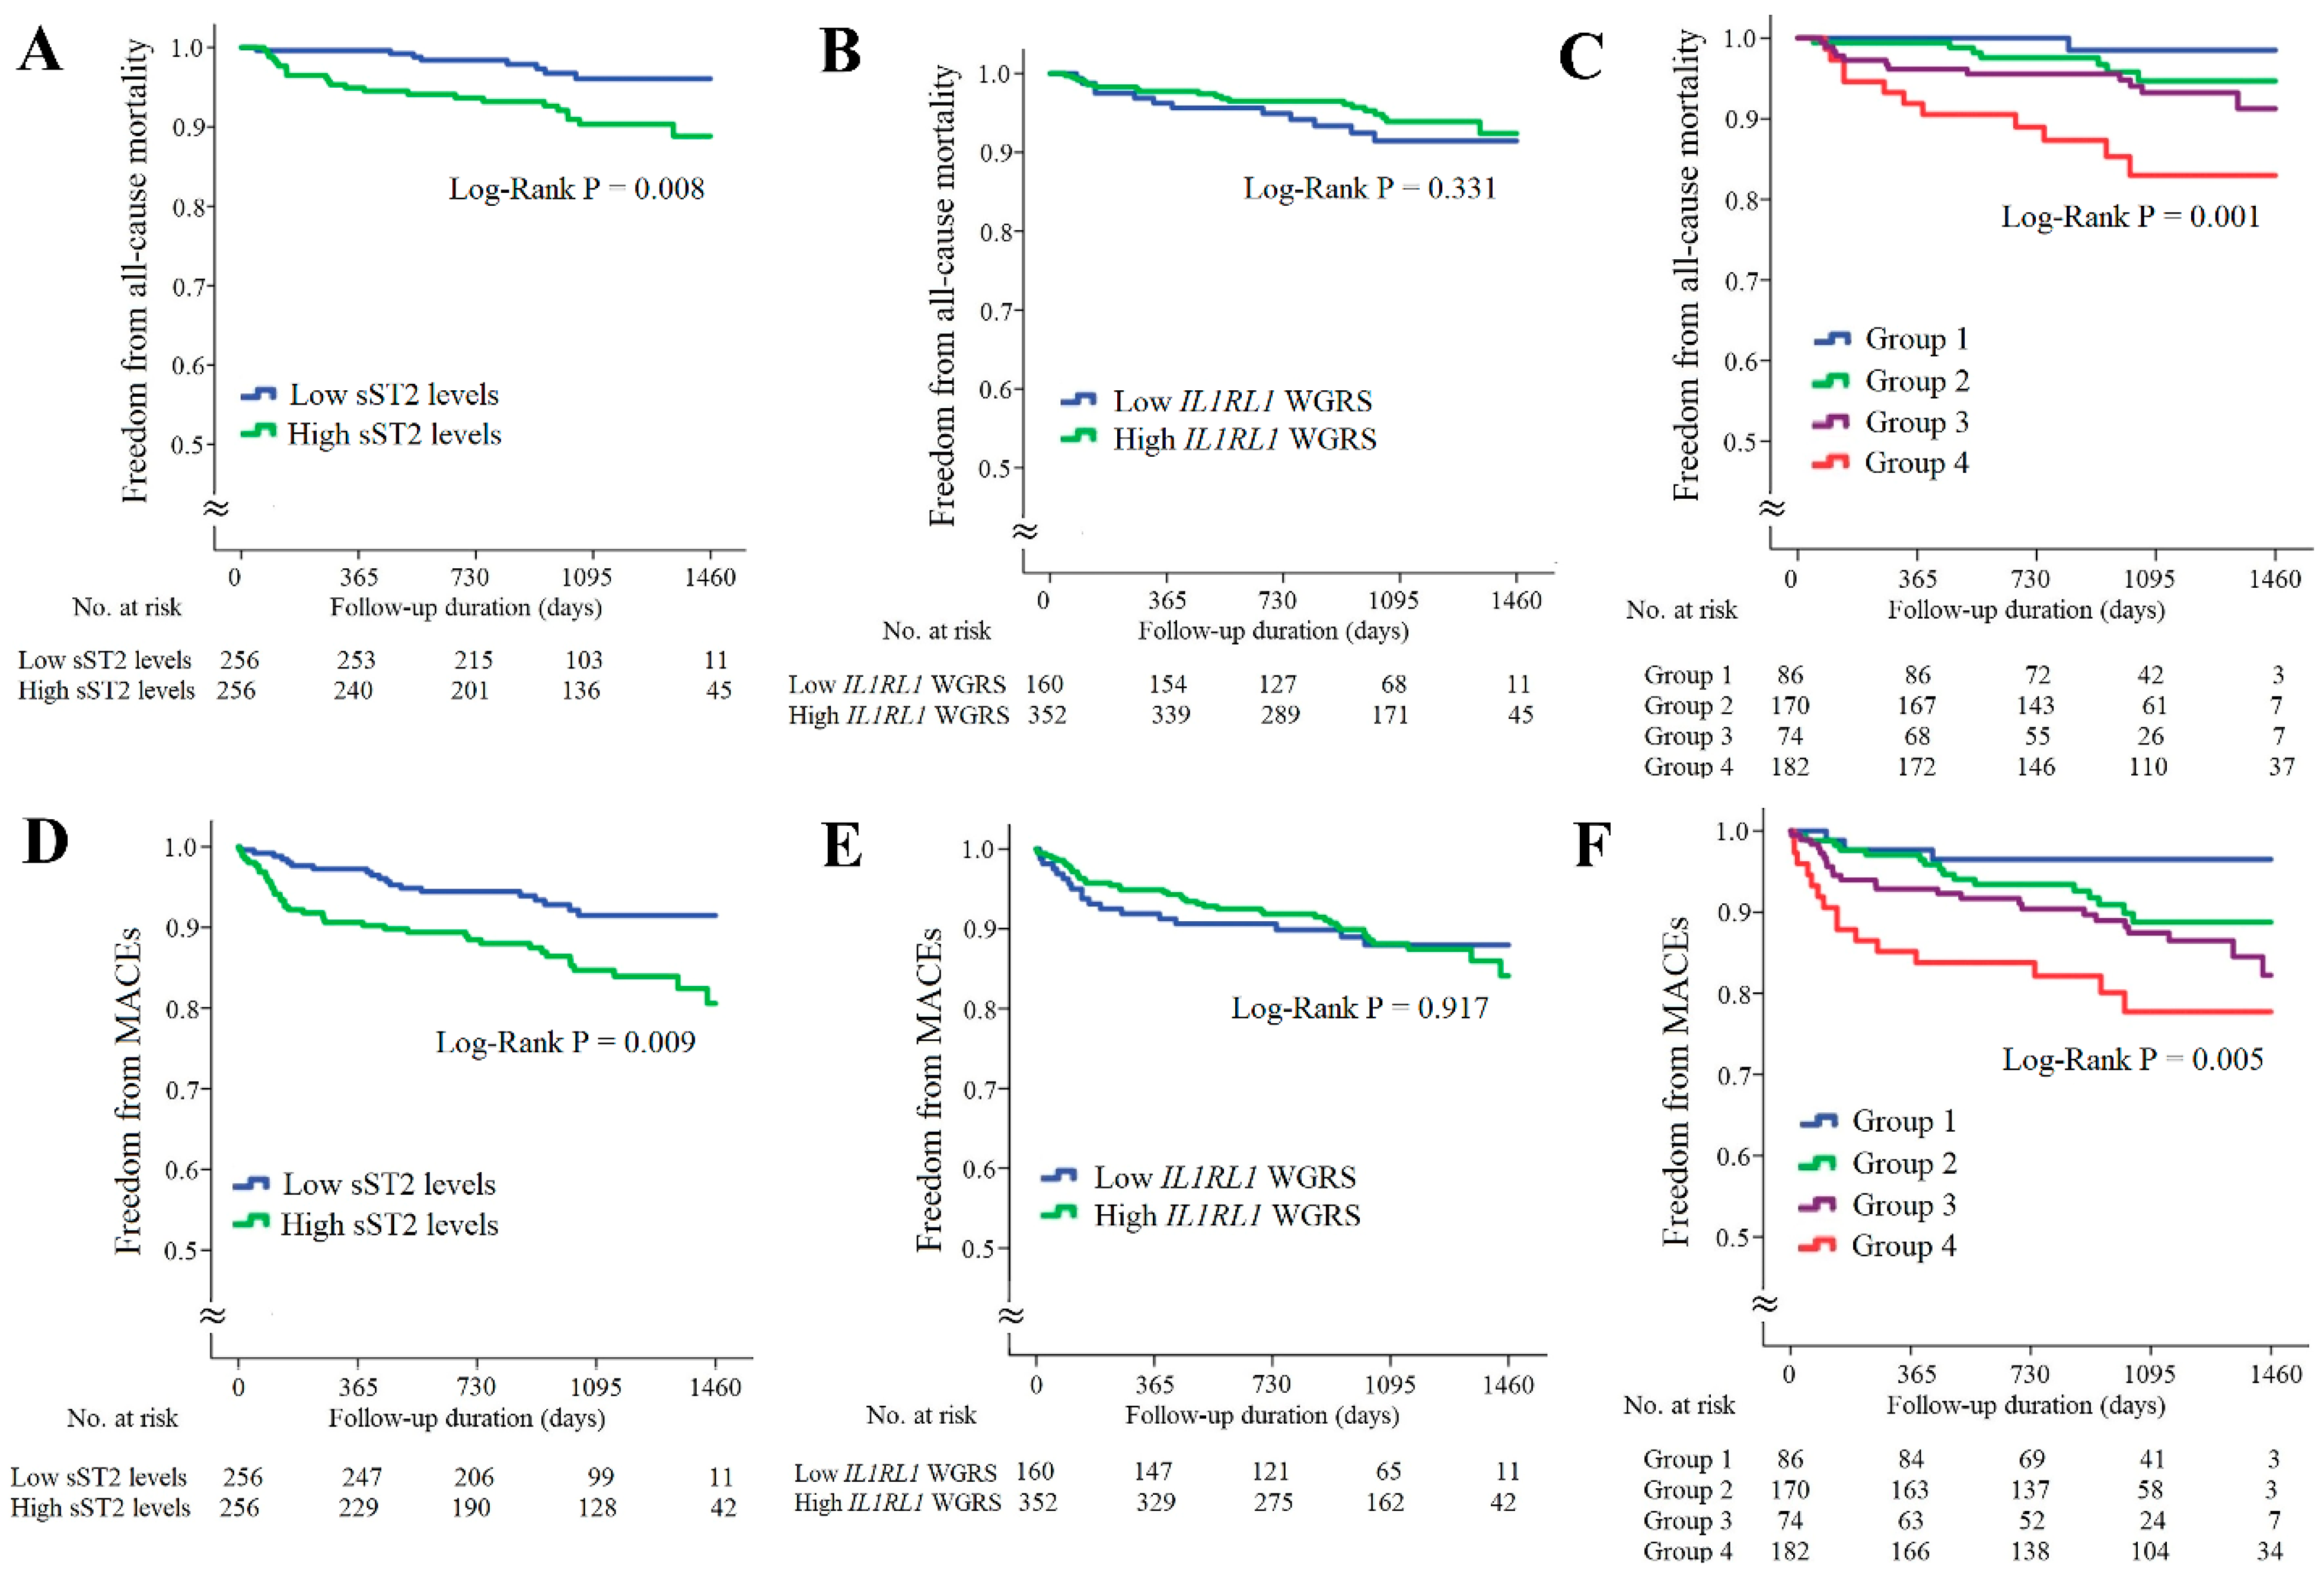
The associations of sST2 levels and IL1RL1 SNPs with long-term outcomes for the patients with CAD are provided in Figure 4. The patients with higher sST2 levels had significantly higher rates of all-cause mortality and MACEs (Figure 4A,D, p = 0.008 and 0.009, respectively). However, the IL1RL1 WGRS did not predict all-cause mortality and MACEs (Figure 4B,E, p = 0.331 and 0.971, respectively). When these patients were further divided into four subgroups according to the sST2 levels and IL1RL1 WGRS, the combination of high sST2 levels and low IL1RL1 WGRS was a strong predictor of all-cause mortality and MACEs (Figure 4C,F, p = 0.001 and 0.005, respectively). The results of Cox regression analysis of all-cause mortality and MACEs between the groups stratified by the sST2 levels and IL1RL1 WGRS are provided in Supplementary Table S7.
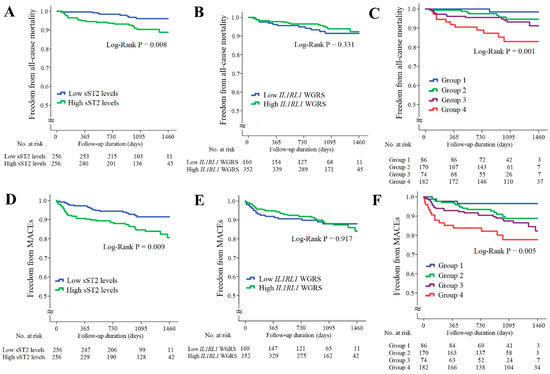
Figure 4.
Kaplan–Meier curve analysis of sST2 levels and IL1RL1 WGRS with long-term outcomes in the patients with CAD. (A–C) Freedom from all-cause mortality in patients stratified by sST2 levels, IL1RL1 WGRS, and combination of sST2 levels and IL1RL1 WGRS. (D–F) Freedom from MACEs in patients stratified by sST2 levels, IL1RL1 WGRS, and combination of sST2 levels and IL1RL1 WGRS. WGRS, weighted genetic risk scores; MACEs, major adverse cardiac events. Group 1: low sST2 levels/low IL1RL1 WGRS; Group 2: low sST2 levels/high IL1RL1 WGRS; Group 3: high sST2 levels/high IL1RL1 WGRS; Group 4: high sST2 levels/low IL1RL1 WGRS.
2.7. Synergistic Effects of WGRS with Resistin and sST2 on Predicting Long-Term Outcomes of the Patients with CAD
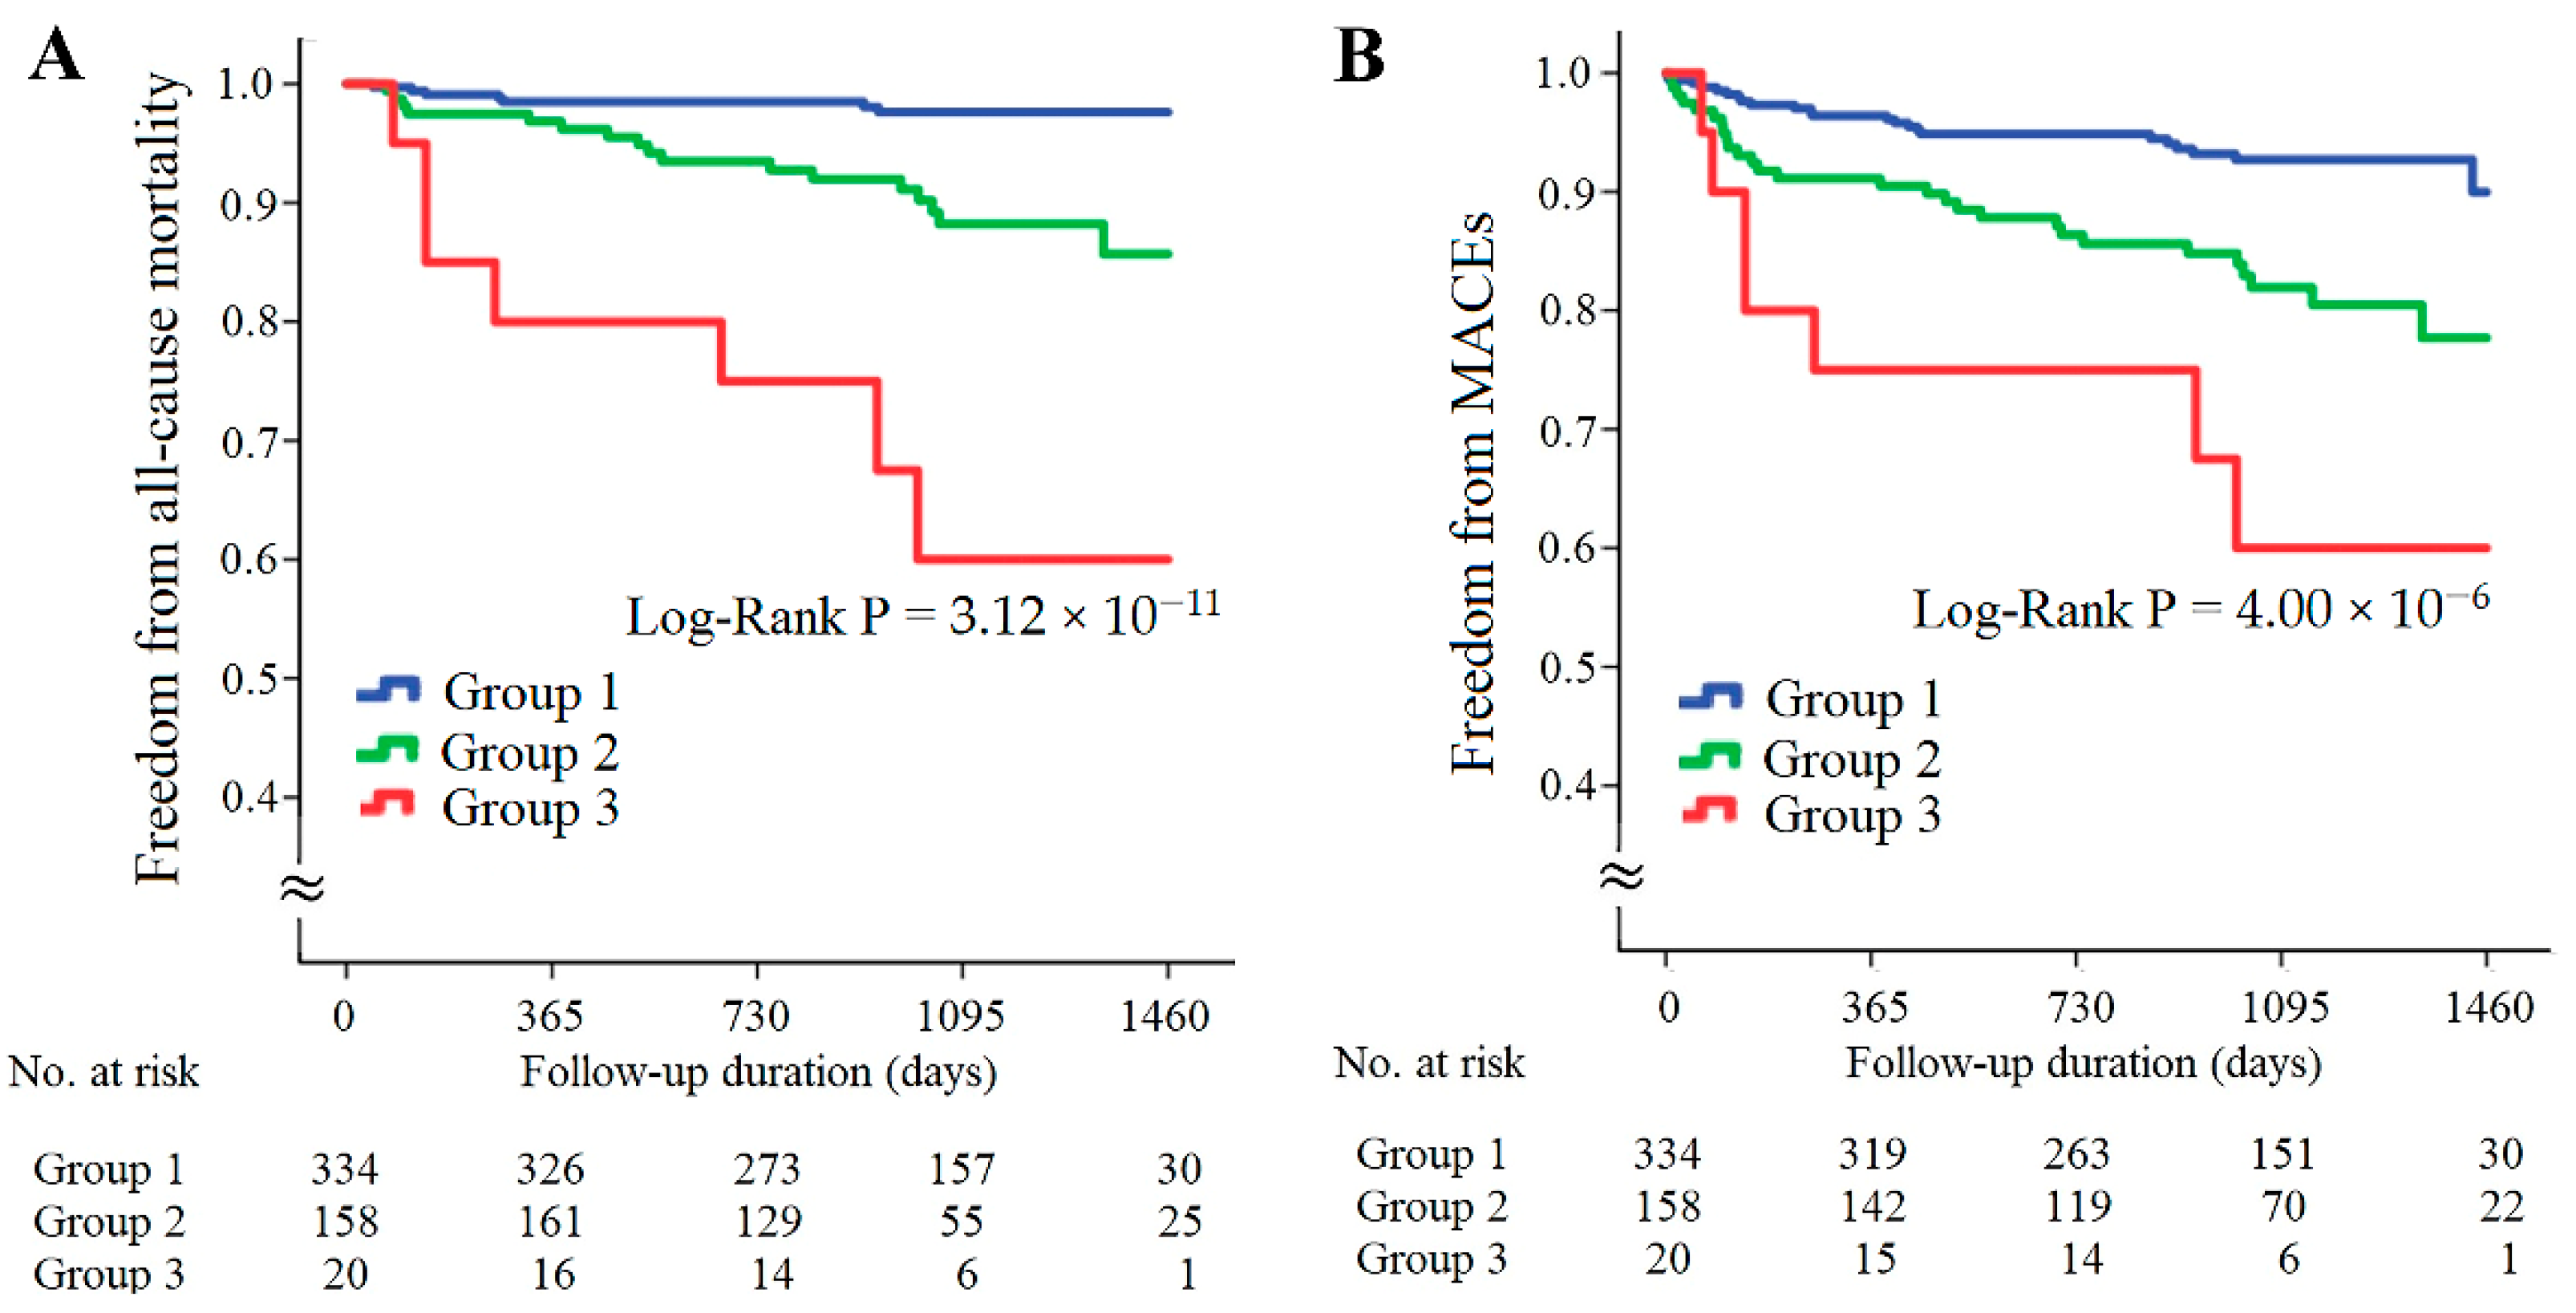
The patients with CAD were further divided into three subgroups according to the presence of high resistin levels/low RETN WGRS or high sST2 levels/low IL1RL1 WGRS (Figure 5). The patients with either high resistin levels/low RETN WGRS or high sST2 levels/low IL1RL1 WGRS had significantly higher rates of all-cause mortality and MACEs, and the patients with both high resistin levels/low RETN WGRS and high sST2 levels/low IL1RL1 WGRS had the worst outcomes (Figure 5A,B, p = 3.12 × 10⁻¹¹ for all-cause mortality and p = 4.00 × 10⁻⁶ for MACEs). The results of Cox regression analysis of all-cause mortality and MACEs between the groups stratified by the presence of high resistin levels/low RETN WGRS and high sST2 levels/low IL1RL1 WGRS are provided in Table 3. The patients with either high resistin levels/low RETN WGRS or high sST2 levels/low IL1RL1 WGRS and the patients with both high resistin levels/low RETN WGRS and high sST2 levels/low IL1RL1 WGRS had significantly higher rates of all-cause mortality and MACEs after adjustment for baseline characteristics and diseases such as hypertension, diabetes mellitus, or hyperlipidemia. However, predictive power was attenuated after further adjustment for uric acid level, eGFR, and inflammatory markers, including C-reactive protein (CRP), chemerin, and growth differentiation factor (GDF)-15 levels. Furthermore, significantly higher levels of inflammatory biomarkers and lower eGFR were observed in the patients with high resistin levels/low RETN WGRS or high sST2 levels/low IL1RL1 WGRS (Supplementary Table S8).
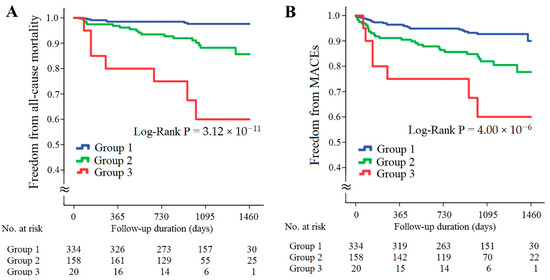
Figure 5.
Kaplan–Meier curve analysis of combining resistin and sST2 levels with corresponding WGRS in predicting freedom from all-cause mortality (A) and freedom from MACEs (B) in the patients with CAD. WGRS, weighted genetic risk scores; MACEs, major adverse cardiac events. Group 1: patients without high resistin levels/low RETN WGRS and high sST2 levels/low IL1RL1 WGRS; Group 2: patients with either high resistin levels/low RETN WGRS or high sST2 levels/low IL1RL1 WGRS; Group 3, patients with both high resistin levels/low RETN WGRS and high sST2 levels/low IL1RL1 WGRS.
Table 3.
Cox regression analysis of all-cause mortality and MACEs rate between the groups stratified by the presence of high resistin level/low RETN WGRS and high sST2 levels/low IL1RL1 WGRS.
3. Discussion
In this study, we performed two GWAS analyses for 4652 participants in the TWB cohort as well as regional association plot analyses for a subgroup of 859 participants with WGS data, aiming to elucidate the genetic basis of resistin and sST2 levels in the Chinese population. Three RETN variants (rs3219175, rs370006313, and rs3745368) and two IL1RL1 variants (rs10183388 and rs4142132) were found to be independently associated with resistin and sST2 levels. In combination, these variants explained 53.7% and 28.0% of the variation in resistin and sST2 levels, respectively. These results were confirmed in validation studies in the CH and CAD cohorts. To the best of our knowledge, the three RETN variants were the strongest genetic determinants of resistin levels compared with the results of other GWAS analyses in ethnic population studies [13,14,15,30]. We further evaluated the effect of the combination of biomarker levels and genetic variants on predicting long-term outcomes in the patients with CAD. Both higher resistin and sST2 levels predicted higher rates of all-cause mortality and MACEs in the patients with CAD during long-term follow-up, but not WGRS of RETN and IL1RL1 variants, except a borderline significance of low RENT WGRS on all-cause mortality. Notably, we observed a synergistic effect of the combination of biomarkers with WGRS of RETN and IL1RL1 on the prediction of the long-term outcomes in the patients with CAD. The patients with high resistin levels/low RETN WGRS and the patients with high sST2 levels/low IL1RL1 WGRS had significantly higher rates of all-cause mortality and MACEs. Furthermore, the patients with both high resistin levels/low RETN WGRS and high sST2 levels/low IL1RL1 WGRS had the poorest outcomes over long-term follow-up.
3.1. Novel Variants Associated with Resistin Levels
GWAS of the data of 4652 participants in the TWB cohort revealed the RETN gene region as the only locus associated with resistin levels, with rs3219175 as the lead SNP (p < 1.00 × 10−307). This result confirmed the data from East Asian [11,12,16,30] and African populations [14] but was different from those reported in Caucasian populations, in which TYW3/CRYZ and NDST4 loci, but not RETN variants, showed a genome-wide significant association with circulating resistin levels [10]. We used the GWAS data to analyze the RETN gene locus and found three RETN SNPs, namely rs3219175, rs370006313, and rs3745368, to be independently associated with resistin levels, which contributed to 53.7% of the variation in resistin levels in the TWB cohort. The data were replicated in the CH cohort (41.1% of variations). Notably, minor allele frequencies (MAFs) of two SNPs, rs3219175 and rs3745368, were significantly lower in the Caucasian population than that in East Asian and African populations [11,12,13,14,15]. By contrast, the MAF of the rs370006313 variant was 0.9% in our cohorts. According to the pubmed.gov website, the MAF of rs370006313 was 0% for 1006 European participants and 1322 African participants from the 1000-Genome project. Furthermore, the RETN –420C > G (rs1862513) genotypes, initially considered candidate SNPs for resistin levels [9,11,12,16], were not found to be independent determinants of resistin levels in our study population.
These results indicate ethnic heterogeneity not only at the level of gene loci but also at the level of each gene variant. rs370006313 is a novel SNP that is localized within the minimal promoter of human RETN, and it has not been previously reported to be associated with resistin levels. Although rs370006313 is a rare variant in the Taiwanese population, the resistin level increased by 4.7 times in the heterozygous state; thus, this SNP contributed to a 13.8% variation in resistin level in the relatively healthy population. Further research is warranted to elucidate the functional significance of this variant.
3.2. Genetic Determinants of sST2 Levels in Taiwan
In the GWAS analysis, our data revealed that chromosome 2q12.1, where the IL1RL1 gene is located, was the only gene locus associated with sST2 levels. Further GWAS analysis revealed that the two lead IL1RL1 SNPs, rs10183388 and rs4142131, were independently associated with sST2 levels and contributed to 28% of the variation; thus, these SNPs are strong genetic determinants of sST2 levels in the Chinese population. Consistently, the Framingham offspring cohort study reported that all candidate SNPs associated with the sST2 concentration were on chromosome 2q12.1 and that the 11 “independent” genome-wide significant SNPs across the IL1RL1 locus accounted for 36% of the heritability of sST2 levels, with rs950880 as the lead SNP [26]. In the TWB cohort, GWAS analysis also revealed a significant association of rs950880 with sST2 levels (p = 1.73 × 10−216). Notably, this association disappeared after serial conditional analysis with rs10183388 and rs4142131, suggesting ethnic heterogeneity in IL1RL1 variants.
3.3. Association of Resistin Levels with Cardiometabolic Phenotypes and Long-Term Outcomes in the Patients with CAD
As a proinflammatory adipokine, resistin is associated with several cardiometabolic phenotypes, including obesity, diabetes, and hyperlipidemia [31,32]. Elevated resistin levels are also associated with impaired renal function and several inflammatory biomarkers [33,34]. Resistin may also contribute to cholesterol and triglyceride accumulation in macrophages, arterial inflammation, endothelial dysfunction, and angiogenesis [31], leading to accelerated atherogenesis and CAD. In line with these findings, our study also found a strong association of resistin levels with BMI, diabetes mellitus, dyslipidemia, impaired renal function, and elevated leukocyte counts in the TWB cohort. Furthermore, elevated resistin levels were a strong predictor of poor long-term outcomes in the patients with CAD, and the participants with higher resistin levels had significantly higher rates of all-cause mortality and MACEs.
3.4. Association of sST2 Levels with Cardiometabolic Phenotypes and Long-Term Outcome in the Patients with CAD
sST2, a protein secreted by cultured myocytes subjected to mechanical strain, is a well-known biomarker of severe heart failure and a strong predictor of mortality [21,22]. IL-33, the ligand of sST2, is also induced and released by stretched myocytes. In patients presenting to the emergency department with myocardial infarction with ST elevation and dyspnea, sST2 levels are strongly predictive of heart failure and mortality [23]. In patients with stable CAD, increased sST2 levels also predict long-term MACEs and all-cause mortality [24,25]. Recently, sST2 levels have also been found to be a novel biomarker and clinical predictor of metabolic syndrome. In patients without CAD or heart failure, Zong et al. reported that increased sST2 levels were significantly associated with a higher prevalence of hypertension, diabetes mellitus, hypertriglyceridemia, and lower HDL cholesterol levels [35]. Consistently, in the present study, elevated sST2 levels were associated with a higher prevalence of diabetes mellitus, higher BMI, total cholesterol, and lower HDL cholesterol levels in the TWB cohort. Furthermore, elevated sST2 levels were significantly associated with higher AST, uric acid, leukocyte counts, and lower eGFR. For the patients with CAD, elevated sST2 levels predicted poor long-term clinical outcomes. The patients with higher sST2 levels had higher rates of all-cause mortality and MACEs during the follow-up period.
3.5. RENT and IL1RL1 Variants on Long-Term Outcomes in the Patients with CAD
The results of the association between RENT variants and CAD risk were inconsistent in previous studies. The association of RETN –420C > G with the risk of CAD was not significant in the Caucasian population [36,37]. By contrast, Tang et al. evaluated the association of RETN –420C > G with the presence of CAD and reported a 62% increased risk of CAD in participants with variant genotypes (CG and GG) [38]. Together, these findings suggest the ethnic heterogeneity of RETN variants with the risk of CAD. Importantly, none of these studies evaluated the prognostication ability of RETN variants for CAD outcomes. In the present study, the patients with CAD with low RETN WGRS had an increased all-cause mortality rate during the 4-year follow-up, but low RETN WGRS did not predict a high MACEs rate.
The evidence of the association between IL1RL1 variants and the risk of CAD remains limited. In a case-control association analysis of 4521 individuals with CAD and 4809 controls in the Chinese Han population, Tu et al. reported a strong association of the IL1RL1 SNP rs11685424 with the risk of CAD and disease severity [39]. Our previous study reported that among patients with CAD and lower-extremity arterial disease, those with the IL1RL1 SNP rs950880 AA genotype tended to have lower sST2 levels and a lower survival rate [28]. The present study further evaluated the effect of IL1RL1 variants on the prediction of long-term outcomes in the patients with CAD using the WGS and GWAS data from the TWB cohort. However, the WGRS of the two IL1RL1 lead SNPs did not predict the outcomes of the patients with CAD, including all-cause mortality and MACEs.
3.6. Synergistic Effects of Genetic Variants and Resistin and sST2 Levels on Predicting Long-Term Outcomes in the Patients with CAD
When we combined the biomarkers with the WGRS of RETN and IL1RL1, we observed a synergistic effect on predicting long-term outcomes in the patients with CAD. The patients with high resistin levels/low RETN WGRS had the highest all-cause mortality and MACEs rates during the follow-up period (6.2 times for all-cause mortality and 3.1 times for MACEs compared with patients with low resistin levels/low RETN WGRS, Figure 3 and Supplementary Table S6). In agreement with this finding, the patients with high sST2 levels/low IL1RL1 WGRS also had the poorest prognosis during the follow-up period (14.1 times for all-cause mortality and 6.0 times for MACEs compared with the patients with low sST2 level/low IL1RL1 WGRS, Figure 4 and Supplementary Table S7).
We further analyzed the synergistic effects of combining resistin levels with RETN WGRS and sST2 levels with IL1RL1 WGRS in the prognostication of long-term outcomes in the patients with CAD. The patients with high resistin levels/low RETN WGRS or high sST2 levels/low IL1RL1 WGRS had 5.0 times higher all-cause mortality and 2.6 times higher MACEs rates than those without these presentations (Table 3). Furthermore, the patients with both high resistin levels/low RETN WGRS and high sST2 levels/low IL1RL1 WGRS had the poorest outcomes (19.6 times for all-cause mortality and 5.9 times for the MACEs). These results were further adjusted for traditional cardiovascular risk factors, including age, sex, BMI, smoking status, diabetes mellitus, hypertension, and dyslipidemia, and adjusted for known predictors of poorer cardiovascular outcomes, such as uric acid levels [40], eGFR [41], and inflammatory biomarkers. These findings remained unchanged after adjustment for traditional cardiovascular risk factors but were attenuated after further adjustment of uric acid levels, eGFR, and inflammatory markers such as CRP, chemerin, and GDF-15 levels. Furthermore, significantly higher levels of CRP, chemerin, and GDF-15 and lower eGFR were observed in the patients with high resistin levels/low RETN WGRS and/or high sST2 levels/low IL1RL1 WGRS (Supplementary Table S8). These findings indicate that inflammation and impaired renal function may explain the poorer outcomes in the patients with high biomarker levels and low WGRS for the corresponding genetic variants.
3.7. Study Limitations
Although we had enrolled a large sample size with available WGS and GWAS data in the TWB cohort, the sample sizes in the validation group (CH cohort) and study group (CAD cohort) were relatively small. However, the candidate SNPs in the RETN and IL1RL1 genes were consistent in the three groups, providing strong evidence of the lead SNPs for RETN and IL1RL1 in the Chinese population. Second, the event rates of all-cause mortality and MACEs were low in the CAD cohort. Nevertheless, we found a significant prediction power of resistin and sST2 levels for outcomes in patients with CAD, as well as a synergistic effect when the resistin and sST2 levels were combined with the WGRS of RETN and IL1RL1. Future studies should include a large sample size of patients with CAD to verify this finding. Finally, because we only included individuals of Han Chinese ethnicity, our results cannot be extended to other ethnic groups.
4. Materials and Methods
4.1. Study Populations
4.1.1. TWB Cohort
The study cohort for the GWAS comprised 5000 participants from the TWB cohort, and WGS data were available for 859 of them. The data were collected from recruitment centers across Taiwan between 2008 and 2015. The inclusion criteria were participants without a history of cancer, stroke, CAD, or systemic disease. All participants self-reported having Han Chinese ethnicity. After participants were excluded based on the exclusion criteria, 4652 participants remained and were included in the GWAS (Supplementary Figure S4). Supplementary Table S9 shows the definitions of hypertension, diabetes mellitus, hyperlipidemia, and current smoking status. The Research Ethics Committee of Taipei Tzu Chi Hospital (approval number: 05-X04-007), Buddhist Tzu Chi Medical Foundation, and Ethics and Governance Council of the Taiwan Biobank (approval number: TWBR10507-02 and TWBR10611-03) approved our study. Written informed consent was obtained from all participants before participation.
4.1.2. CH Cohort
The validation group was recruited during routine cardiovascular health examinations from October 2003 to September 2005 at Chang Gung Memorial Hospital and comprised 617 Han Chinese participants (327 men with a mean age of 45.2 ± 10.5 years and 290 women with a mean age of 46.8 ± 10.1 years), who responded to a questionnaire on their medical history and lifestyle characteristics. A total of 60 participants were excluded from the current study, and 557 participants were enrolled in the analysis (Supplementary Figure S4). All of the participants provided written informed consent, and the study was approved by the Ethics Committee of Chang Gung Memorial Hospital and the Ethics Committee of Taipei Tzu Chi Hospital, Buddhist Tzu Chi Medical Foundation.
4.1.3. CAD Cohort
In the CAD cohort, 565 patients who received coronary angiography, had at least 50% stenosis of one major coronary artery, and had available blood samples for DNA and biomarker analyses were recruited between July 2010 and September 2013 from National Taiwan University Hospital. Among these, 53 patients were excluded from the current study, and 512 patients were included in the analysis (Supplementary Figure S4). All clinical data were obtained from the patients’ medical records. The primary enpoint was all-cause mortality. The secondary endpoint was MACEs, including the composite endpoints of all-cause mortality, hospitalization for heart failure, nonfatal myocardial infarction, or nonfatal stroke. Seven patients who were lost to follow-up after enrollment were contacted by telephone before the end of the study. Three of these patients had died, and the cause of death was provided by the relatives. All of the participants provided written informed consent, and the study was approved by the Research Ethics Committee of National Taiwan University Hospital.
4.2. Laboratory Examination
We examined the following clinical phenotypes: body height, body weight, body mass index (BMI), and systolic, mean, and diastolic blood pressure. In addition, we collected the following biochemical data: lipid profile, including total cholesterol, HDL cholesterol, LDL cholesterol, and triglyceride levels; fasting plasma glucose; and liver and renal functional test-related parameters such as serum creatinine, eGFR, uric acid, and AST. Hematological parameters included white and red blood cell counts, platelet counts, and hematocrit. Circulating levels of resistin, sST2, and inflammatory markers such as chemerin and GDF-15 were measured using commercially available enzyme-linked immunosorbent assay kits (R&D, Minneapolis, MN, USA). Circulating plasma levels of CRP were measured using the particle-enhanced turbidimetric immunoassay technique (Siemens Healthcare Diagnostics, Camberley, UK). The increase in turbidity that accompanies aggregation is proportional to the CRP concentration. Overall, the intra- and interassay coefficients of variation were 1.2–9.5% (Supplementary Table S10).
4.3. Genomic DNA Extraction and Genotyping
DNA of the participants was isolated from blood samples using a QIAamp DNA blood kit following the manufacturer’s instructions (Qiagen, Valencia, CA, USA). SNP genotyping was conducted using custom TWB chips and was run on the Axiom Genome-Wide Array Plate System (Affymetrix, Santa Clara, CA, USA). Genotyping for RETN rs3219175, rs370006313, and rs3745368 genotypes in the participants from the TWB cohort, the participants from the CH cohort, and the patients with CAD as well as for IL1RL1 rs10183388 and rs4142132 genotypes were performed using TaqMan SNP Genotyping Assays (Applied Biosystems, Foster City, CA, USA). For quality control purposes, approximately 10% of the samples were re-genotyped blindly, and identical results were obtained.
4.4. TWB Whole-Genome Sequencing: RETN and IL1RL1 Gene Region
The WGS data of 859 participants from the TWB cohort were evaluated using an ultra-fast whole-genome secondary analysis on Illumina sequencing platforms [42] (Illumina HiSeq 2500/4000). The resulting reads were aligned to the hg19 reference genome with iSAAC 01.13.10.21. iSAAC Variant Caller 2.0.17 was used to perform SNP and insertion-deletion variant discovery and genotyping [42]. An in-house protocol written in shell script was performed to combine 880 vcf files. A union table of all detected variants in 880 vcf files was used for further analysis. Two gene loci linked to resistin and sST2 levels, according to the GWAS results, were included in the analysis, namely 20 Kb around the RETN and IL1RL1 gene regions. The association between SNPs and resistin and sST2 levels was then analyzed using the GWAS method.
4.5. GWAS Analysis
The Axiom Genome-Wide CHB 1 Array Plate (Affymetrix) designed by the Taiwan Biomarker Study Group is a TWB genotype array used for GWAS analysis. In this genotyping platform, SNPs with minor allele frequencies of ≥5% in a set of 1950 samples were selected from Taiwan Han Chinese populations previously genotyped at the National Center of Genome Medicine of the Academia Sinica, Taipei, Taiwan [43]. Each genomic DNA was genotyped on the Axiom TWB genome-wide array comprising 642,832 SNPs with assistance from the National Center of Genome Medicine of Academia Sinica. All the samples in the analysis had a call rate of ≥97%. For SNP quality control, SNP call rate < 97%, minor allele frequency <0.01, and violation of Hardy–Weinberg equilibrium (p < 10−6) were criteria for exclusion from subsequent analyses. In total, 4652 participants and 614,821 SNPs were included in the GWAS analysis after quality control.
4.6. Statistical Analysis
Before analysis, resistin and sST2 levels were logarithmically transformed to adhere to a normality assumption. A generalized linear model was used to analyze resistin and sST2 levels in relation to the investigated genotypes and confounders. We assumed the genetic effect to be additive after adjustment for age, sex, BMI, and current smoking status. The software package PLINK was used to conduct genome-wide scans, and p < 5 × 10⁻⁸ was considered genome-wide significant. For GWAS, a conditional analysis was conducted to assess the residual association with all remaining SNPs after adjustment for the most strongly associated SNP at a locus by adding the SNP as a covariate into the regression model.
The baseline characteristics of all participants were evaluated using analysis of variance. Continuous variables are expressed as mean ± standard deviation or median and interquartile ranges when the distribution is strongly skewed. Differences in categorical data distribution were examined using a chi-square test or a chi-square test for trends. The Bonferroni method was used for post-hoc analysis after ANOVA. The genetic risk score was calculated using the weighted method, which assumed each SNP to be independently associated with resistin or sST2 levels (i.e., no interaction between each SNP) [44]. We assumed an additive effect of risk alleles for each SNP and applied linear weighting of 0, 1, or 2 to genotypes containing a corresponding number of risk alleles. WGRS were calculated by multiplying the estimated beta-coefficient of each SNP by the number of corresponding risk alleles (0, 1, or 2). Pearson’s correlation coefficients were used to examine the relationship of resistin and sST2 levels with clinical and biochemical factors in addition to WGRS. Each variable with a significant association with resistin and sST2 was entered into the multivariate linear regression model with the stepwise method to identify the independent correlates of resistin and sST2.
The rates of freedom from primary and secondary endpoints in the patients with CAD, stratified by the levels and resistin and sST2 and the WGRS of RETN and IL1RL1 genotyping, were assessed using Kaplan–Meier curves and compared using the long-rank test. The outcomes were further analyzed by combining WGRS according to RETN and IL1RL1 genotyping with both biomarker levels. Cox regression analysis was used to determine the hazard ratio of primary and secondary endpoints in each group. IBM SPSS Statistics version 24.0 (IBM Corp., Armonk, NY, USA) was used to perform all calculations, with two-sided p < 0.05 set as the statistically significant level.
5. Conclusions
In the GWAS of the TWB cohort, we found that three RETN lead SNPs (rs3219175, rs370006313, and rs3745368) were strongly associated with resistin levels and that two IL1RL1 lead SNPs (rs10183388 and rs4142132) were significantly associated with sST2 levels in the Chinese population. These results were validated in the CH cohort and CAD cohort. Serum resistin and sST2 levels were significantly associated with cardiometabolic risk factors in the TWB and CAD cohorts and were strong predictors of poor clinical outcomes in patients with CAD. Furthermore, a synergistic effect was noted when combining resistin and sST2 levels with the WGRS of RETN and IL1RL1 in the prognostication of CAD outcomes. Patients with high resistin levels/low RETN WGRS and high sST2 levels/low IL1RL1 WGRS had the poorest outcome during long-term follow-up. This study provides insights into the effects of biomarkers and corresponding genetic variants on the prognosis of long-term clinical outcomes in patients with CAD.
Supplementary Materials
The following supporting information can be downloaded at: https://www.mdpi.com/article/10.3390/ijms23084292/s1.
Author Contributions
Conceptualization, Y.-L.K. and H.-H.C.; methodology, Y.-L.K., H.-H.C., M.-S.T. and S.W.; formal analysis, H.-H.C., Y.-L.K., M.-S.T. and S.W.; resources, L.-A.H., J.-M.J.J. and F.-T.C.; data curation, L.-A.H., J.-M.J.J. and F.-T.C.; writing—original draft preparation, H.-H.C.; writing—review and editing, Y.-L.K.; visualization, Y.-L.K.; project administration, Y.-L.K.; supervision, Y.-L.K.; funding acquisition, H.-H.C. and Y.-L.K. All authors have read and agreed to the published version of the manuscript.
Funding
This study was supported by grants from Buddhist Tzu Chi Medical Foundation Academic Advancement (TCMF-EP 111-02, TCMF-A 107-01-15), grants from the Ministry of Science and Technology (MOST 108-2314-B-303-026-MY3) and Taipei Tzu Chi Hospital, Buddhist Tzu Chi Medical Foundation (TCRD-TPE-MOST-109-05) to Y.-L.K., and Taipei Tzu Chi Hospital, Buddhist Tzu Chi Medical Foundation (TCRD-TPE-109-RT-1) to H.-H.C.
Institutional Review Board Statement
The study was conducted in accordance with the Declaration of Helsinki. The Research Ethics Committee of Taipei Tzu Chi Hospital (approval number: 05-X04-007), Buddhist Tzu Chi Medical Foundation, had approved the present study. The TWB study cohort had been approved by the Ethics and Governance Council of the Taiwan Biobank (approval number: TWBR10507-02 and TWBR10611-03). The Cardiovascular Healthy examination cohort had been approved by the Ethics Committee of Chang Gung Memorial Hospital, and the CAD study cohort was approved by the Research Ethics Committee of National Taiwan University Hospital. Written informed consent was obtained from all participants before participation.
Informed Consent Statement
Informed consent was obtained from all subjects involved in the study.
Data Availability Statement
The data presented in this study are available on request from the corresponding author.
Acknowledgments
We greatly appreciate technical support from the Core Laboratory of the Taipei Tzu Chi Hospital, Buddhist Tzu Chi Medical Foundation, and expert statistical analysis assistance from Tsung-Han Hsieh.
Conflicts of Interest
The authors declare no conflict of interest.
References
- Roth, G.A.; Mensah, G.A.; Johnson, C.O.; Addolorato, G.; Ammirati, E.; Baddour, L.M.; Barengo, N.C.; Beaton, A.Z.; Benjamin, E.J.; Benziger, C.P.; et al. Global Burden of Cardiovascular Diseases and Risk Factors, 1990–2019: Update From the GBD 2019 Study. J. Am. Coll. Cardiol. 2020, 76, 2982–3021. [Google Scholar] [CrossRef]
- Steppan, C.M.; Bailey, S.T.; Bhat, S.; Brown, E.J.; Banerjee, R.R.; Wright, C.M.; Patel, H.R.; Ahima, R.S.; Lazar, M.A. The hormone resistin links obesity to diabetes. Nature 2001, 409, 307–312. [Google Scholar] [CrossRef] [PubMed]
- Patel, L.; Buckels, A.C.; Kinghorn, I.J.; Murdock, P.R.; Holbrook, J.D.; Plumpton, C.; Macphee, C.H.; Smith, S.A. Resistin is expressed in human macrophages and directly regulated by PPAR gamma activators. Biochem. Biophys. Res. Commun. 2003, 300, 472–476. [Google Scholar] [CrossRef]
- Bokarewa, M.; Nagaev, I.; Dahlberg, L.; Smith, U.; Tarkowski, A. Resistin, an adipokine with potent proinflammatory properties. J. Immunol. 2005, 174, 5789–5795. [Google Scholar] [CrossRef]
- Silswal, N.; Singh, A.K.; Aruna, B.; Mukhopadhyay, S.; Ghosh, S.; Ehtesham, N.Z. Human resistin stimulates the pro-inflammatory cytokines TNF-alpha and IL-12 in macrophages by NF-kappaB-dependent pathway. Biochem. Biophys. Res. Commun. 2005, 334, 1092–1101. [Google Scholar] [CrossRef] [PubMed]
- Cho, Y.; Lee, S.E.; Lee, H.C.; Hur, J.; Lee, S.; Youn, S.W.; Lee, J.; Lee, H.J.; Lee, T.K.; Park, J.; et al. Adipokine resistin is a key player to modulate monocytes, endothelial cells, and smooth muscle cells, leading to progression of atherosclerosis in rabbit carotid artery. J. Am. Coll. Cardiol. 2011, 57, 99–109. [Google Scholar] [CrossRef] [PubMed] [Green Version]
- Park, H.K.; Ahima, R.S. Resistin in rodents and humans. Diabetes Metab. J. 2013, 37, 404–414. [Google Scholar] [CrossRef] [PubMed] [Green Version]
- Schwartz, D.R.; Lazar, M.A. Human resistin: Found in translation from mouse to man. Trends Endocrinol. Metab. 2011, 22, 259–265. [Google Scholar] [CrossRef] [Green Version]
- Menzaghi, C.; Coco, A.; Salvemini, L.; Thompson, R.; De Cosmo, S.; Doria, A.; Trischitta, V. Heritability of serum resistin and its genetic correlation with insulin resistance-related features in nondiabetic Caucasians. J. Clin. Endocrinol. Metab. 2006, 91, 2792–2795. [Google Scholar] [CrossRef]
- Qi, Q.; Menzaghi, C.; Smith, S.; Liang, L.; de Rekeneire, N.; Garcia, M.E.; Lohman, K.K.; Miljkovic, I.; Strotmeyer, E.S.; Cummings, S.R.; et al. Genome-wide association analysis identifies TYW3/CRYZ and NDST4 loci associated with circulating resistin levels. Hum. Mol. Genet. 2012, 21, 4774–4780. [Google Scholar] [CrossRef] [Green Version]
- Onuma, H.; Tabara, Y.; Kawamura, R.; Tanaka, T.; Ohashi, J.; Nishida, W.; Takata, Y.; Ochi, M.; Yamada, K.; Kawamoto, R.; et al. A at single nucleotide polymorphism-358 is required for G at -420 to confer the highest plasma resistin in the general Japanese population. PLoS ONE 2010, 5, e9718. [Google Scholar] [CrossRef]
- Osawa, H.; Yamada, K.; Onuma, H.; Murakami, A.; Ochi, M.; Kawata, H.; Nishimiya, T.; Niiya, T.; Shimizu, I.; Nishida, W.; et al. The G/G genotype of a resistin single-nucleotide polymorphism at -420 increases type 2 diabetes mellitus susceptibility by inducing promoter activity through specific binding of Sp1/3. Am. J. Hum. Genet. 2004, 75, 678–686. [Google Scholar] [CrossRef] [Green Version]
- Hivert, M.F.; Manning, A.K.; McAteer, J.B.; Dupuis, J.; Fox, C.S.; Cupples, L.A.; Meigs, J.B.; Florez, J.C. Association of variants in RETN with plasma resistin levels and diabetes-related traits in the Framingham Offspring Study. Diabetes 2009, 58, 750–756. [Google Scholar] [CrossRef] [PubMed] [Green Version]
- Meeks, K.A.C.; Doumatey, A.P.; Bentley, A.R.; Gouveia, M.H.; Chen, G.; Zhou, J.; Lei, L.; Adeyemo, A.A.; Rotimi, C.N. Genetics of Circulating Resistin Level, a Biomarker for Cardiovascular Diseases, Is Informed by Mendelian Randomization and the Unique Characteristics of African Genomes. Circ. Genom. Precis. Med. 2020, 13, 488–503. [Google Scholar] [CrossRef] [PubMed]
- Asano, H.; Izawa, H.; Nagata, K.; Nakatochi, M.; Kobayashi, M.; Hirashiki, A.; Shintani, S.; Nishizawa, T.; Tanimura, D.; Naruse, K.; et al. Plasma resistin concentration determined by common variants in the resistin gene and associated with metabolic traits in an aged Japanese population. Diabetologia 2010, 53, 234–246. [Google Scholar] [CrossRef]
- Cho, Y.M.; Youn, B.S.; Chung, S.S.; Kim, K.W.; Lee, H.K.; Yu, K.Y.; Park, H.J.; Shin, H.D.; Park, K.S. Common genetic polymorphisms in the promoter of resistin gene are major determinants of plasma resistin concentrations in humans. Diabetologia 2004, 47, 559–565. [Google Scholar] [CrossRef] [Green Version]
- Iwahana, H.; Yanagisawa, K.; Ito-Kosaka, A.; Kuroiwa, K.; Tago, K.; Komatsu, N.; Katashima, R.; Itakura, M.; Tominaga, S. Different promoter usage and multiple transcription initiation sites of the interleukin-1 receptor-related human ST2 gene in UT-7 and TM12 cells. Eur. J. Biochem. 1999, 264, 397–406. [Google Scholar] [CrossRef]
- Schmitz, J.; Owyang, A.; Oldham, E.; Song, Y.; Murphy, E.; McClanahan, T.K.; Zurawski, G.; Moshrefi, M.; Qin, J.; Li, X.; et al. IL-33, an interleukin-1-like cytokine that signals via the IL-1 receptor-related protein ST2 and induces T helper type 2-associated cytokines. Immunity 2005, 23, 479–490. [Google Scholar] [CrossRef] [Green Version]
- Sanada, S.; Hakuno, D.; Higgins, L.J.; Schreiter, E.R.; McKenzie, A.N.; Lee, R.T. IL-33 and ST2 comprise a critical biomechanically induced and cardioprotective signaling system. J. Clin. Investig. 2007, 117, 1538–1549. [Google Scholar] [CrossRef] [PubMed] [Green Version]
- Seki, K.; Sanada, S.; Kudinova, A.Y.; Steinhauser, M.L.; Handa, V.; Gannon, J.; Lee, R.T. Interleukin-33 prevents apoptosis and improves survival after experimental myocardial infarction through ST2 signaling. Circ. Heart Fail. 2009, 2, 684–691. [Google Scholar] [CrossRef] [PubMed] [Green Version]
- Weinberg, E.O.; Shimpo, M.; Hurwitz, S.; Tominaga, S.; Rouleau, J.L.; Lee, R.T. Identification of serum soluble ST2 receptor as a novel heart failure biomarker. Circulation 2003, 107, 721–726. [Google Scholar] [CrossRef] [PubMed] [Green Version]
- Januzzi, J.L., Jr.; Peacock, W.F.; Maisel, A.S.; Chae, C.U.; Jesse, R.L.; Baggish, A.L.; O’Donoghue, M.; Sakhuja, R.; Chen, A.A.; van Kimmenade, R.R.; et al. Measurement of the interleukin family member ST2 in patients with acute dyspnea: Results from the PRIDE (Pro-Brain Natriuretic Peptide Investigation of Dyspnea in the Emergency Department) study. J. Am. Coll. Cardiol. 2007, 50, 607–613. [Google Scholar] [CrossRef] [Green Version]
- Shimpo, M.; Morrow, D.A.; Weinberg, E.O.; Sabatine, M.S.; Murphy, S.A.; Antman, E.M.; Lee, R.T. Serum levels of the interleukin-1 receptor family member ST2 predict mortality and clinical outcome in acute myocardial infarction. Circulation 2004, 109, 2186–2190. [Google Scholar] [CrossRef] [PubMed] [Green Version]
- Dieplinger, B.; Egger, M.; Haltmayer, M.; Kleber, M.E.; Scharnagl, H.; Silbernagel, G.; de Boer, R.A.; Maerz, W.; Mueller, T. Increased soluble ST2 predicts long-term mortality in patients with stable coronary artery disease: Results from the Ludwigshafen risk and cardiovascular health study. Clin. Chem. 2014, 60, 530–540. [Google Scholar] [CrossRef] [PubMed]
- Li, M.; Duan, L.; Cai, Y.; Hao, B.; Chen, J.; Li, H.; Liu, H. Prognostic value of soluble suppression of tumorigenesis-2 (sST2) for cardiovascular events in coronary artery disease patients with and without diabetes mellitus. Cardiovasc. Diabetol. 2021, 20, 49. [Google Scholar] [CrossRef] [PubMed]
- Ho, J.E.; Chen, W.Y.; Chen, M.H.; Larson, M.G.; McCabe, E.L.; Cheng, S.; Ghorbani, A.; Coglianese, E.; Emilsson, V.; Johnson, A.D.; et al. Common genetic variation at the IL1RL1 locus regulates IL-33/ST2 signaling. J. Clin. Investig. 2013, 123, 4208–4218. [Google Scholar] [CrossRef] [Green Version]
- Akhabir, L.; Sandford, A. Genetics of interleukin 1 receptor-like 1 in immune and inflammatory diseases. Curr. Genomics. 2010, 11, 591–606. [Google Scholar] [CrossRef] [PubMed] [Green Version]
- Lin, J.F.; Wu, S.; Juang, J.J.; Chiang, F.T.; Hsu, L.A.; Teng, M.S.; Cheng, S.T.; Huang, H.L.; Sun, Y.C.; Liu, P.Y.; et al. IL1RL1 single nucleotide polymorphism predicts sST2 level and mortality in coronary and peripheral artery disease. Atherosclerosis 2017, 257, 71–77. [Google Scholar] [CrossRef] [PubMed]
- Fan, C.T.; Lin, J.C.; Lee, C.H. Taiwan Biobank: A project aiming to aid Taiwan’s transition into a biomedical island. Pharmacogenomics 2008, 9, 235–246. [Google Scholar] [CrossRef]
- Chung, C.M.; Lin, T.H.; Chen, J.W.; Leu, H.B.; Yin, W.H.; Ho, H.Y.; Sheu, S.H.; Tsai, W.C.; Chen, J.H.; Lin, S.J.; et al. Common quantitative trait locus downstream of RETN gene identified by genome-wide association study is associated with risk of type 2 diabetes mellitus in Han Chinese: A Mendelian randomization effect. Diabetes Metab. Res. Rev. 2014, 30, 232–240. [Google Scholar] [CrossRef] [PubMed]
- Filkova, M.; Haluzik, M.; Gay, S.; Senolt, L. The role of resistin as a regulator of inflammation: Implications for various human pathologies. Clin. Immunol. 2009, 133, 157–170. [Google Scholar] [CrossRef] [PubMed] [Green Version]
- Figarska, S.M.; Gustafsson, S.; Sundstrom, J.; Arnlov, J.; Malarstig, A.; Elmstahl, S.; Fall, T.; Lind, L.; Ingelsson, E. Associations of Circulating Protein Levels With Lipid Fractions in the General Population. Arter. Thromb. Vasc. Biol. 2018, 38, 2505–2518. [Google Scholar] [CrossRef] [PubMed] [Green Version]
- Axelsson, J.; Bergsten, A.; Qureshi, A.R.; Heimburger, O.; Barany, P.; Lonnqvist, F.; Lindholm, B.; Nordfors, L.; Alvestrand, A.; Stenvinkel, P. Elevated resistin levels in chronic kidney disease are associated with decreased glomerular filtration rate and inflammation, but not with insulin resistance. Kidney Int. 2006, 69, 596–604. [Google Scholar] [CrossRef] [PubMed] [Green Version]
- Reilly, M.P.; Lehrke, M.; Wolfe, M.L.; Rohatgi, A.; Lazar, M.A.; Rader, D.J. Resistin is an inflammatory marker of atherosclerosis in humans. Circulation 2005, 111, 932–939. [Google Scholar] [CrossRef] [Green Version]
- Zong, X.; Fan, Q.; Zhang, H.; Yang, Q.; Xie, H.; Chen, Q.; Zhang, R.; Tao, R. Soluble ST2 levels for predicting the presence and severity of metabolic syndrome. Endocr. Connect. 2021, 10, 336–344. [Google Scholar] [CrossRef]
- Hoffmann, M.M.; Pilz, S.; Weihrauch, G.; Seelhorst, U.; Wellnitz, B.; Winkelmann, B.R.; Boehm, B.O.; Marz, W. Effect of the resistin -420C > G polymorphism on cardiovascular disease and mortality. Clin. Endocrinol. 2008, 69, 344–345. [Google Scholar] [CrossRef]
- Norata, G.D.; Ongari, M.; Garlaschelli, K.; Tibolla, G.; Grigore, L.; Raselli, S.; Vettoretti, S.; Baragetti, I.; Noto, D.; Cefalu, A.B.; et al. Effect of the -420C/G variant of the resistin gene promoter on metabolic syndrome, obesity, myocardial infarction and kidney dysfunction. J. Intern. Med. 2007, 262, 104–112. [Google Scholar] [CrossRef]
- Tang, N.P.; Wang, L.S.; Yang, L.; Zhou, B.; Gu, H.J.; Sun, Q.M.; Cong, R.H.; Zhu, H.J.; Wang, B. A polymorphism in the resistin gene promoter and the risk of coronary artery disease in a Chinese population. Clin. Endocrinol. 2008, 68, 82–87. [Google Scholar] [CrossRef]
- Tu, X.; Nie, S.; Liao, Y.; Zhang, H.; Fan, Q.; Xu, C.; Bai, Y.; Wang, F.; Ren, X.; Tang, T.; et al. The IL-33-ST2L pathway is associated with coronary artery disease in a Chinese Han population. Am. J. Hum. Genet. 2013, 93, 652–660. [Google Scholar] [CrossRef] [Green Version]
- Maloberti, A.; Biolcati, M.; Ruzzenenti, G.; Giani, V.; Leidi, F.; Monticelli, M.; Algeri, M.; Scarpellini, S.; Nava, S.; Soriano, F.; et al. The Role of Uric Acid in Acute and Chronic Coronary Syndromes. J. Clin. Med. 2021, 10, 4750. [Google Scholar] [CrossRef]
- Chronic Kidney Disease Prognosis Consortium; Matsushita, K.; van der Velde, M.; Astor, B.C.; Woodward, M.; Levey, A.S.; de Jong, P.E.; Coresh, J.; Gansevoort, R.T. Association of estimated glomerular filtration rate and albuminuria with all-cause and cardiovascular mortality in general population cohorts: A collaborative meta-analysis. Lancet 2010, 375, 2073–2081. [Google Scholar]
- Raczy, C.; Petrovski, R.; Saunders, C.T.; Chorny, I.; Kruglyak, S.; Margulies, E.H.; Chuang, H.Y.; Kallberg, M.; Kumar, S.A.; Liao, A.; et al. Isaac: Ultra-fast whole-genome secondary analysis on Illumina sequencing platforms. Bioinformatics 2013, 29, 2041–2043. [Google Scholar] [CrossRef] [PubMed] [Green Version]
- Chen, C.H.; Yang, J.H.; Chiang, C.W.K.; Hsiung, C.N.; Wu, P.E.; Chang, L.C.; Chu, H.W.; Chang, J.; Song, I.W.; Yang, S.L.; et al. Population structure of Han Chinese in the modern Taiwanese population based on 10,000 participants in the Taiwan Biobank project. Hum. Mol. Genet. 2016, 25, 5321–5331. [Google Scholar] [CrossRef] [PubMed] [Green Version]
- Wu, S.; Teng, M.S.; Er, L.K.; Hsiao, W.Y.; Hsu, L.A.; Yeh, C.H.; Lin, J.F.; Lin, Y.Y.; Su, C.W.; Ko, Y.L. Association between NF-kappaB Pathway Gene Variants and sICAM1 Levels in Taiwanese. PLoS ONE 2017, 12, e0169516. [Google Scholar]
Publisher’s Note: MDPI stays neutral with regard to jurisdictional claims in published maps and institutional affiliations. |
© 2022 by the authors. Licensee MDPI, Basel, Switzerland. This article is an open access article distributed under the terms and conditions of the Creative Commons Attribution (CC BY) license (https://creativecommons.org/licenses/by/4.0/).