Article

Expression Patterns of Sugar Transporter Genes in the Allocation of Assimilates and Abiotic Stress in Lily

1
Beijing Key Laboratory of Ornamental Plants Germplasm Innovation & Molecular Breeding, China National Engineering Research Center for Floriculture, College of Landscape Architecture, Beijing Forestry University, Beijing 100083, China
2
Beijing Flower Engineering Technology Research Center, Plant Institute, Management Department of Beijing Botanical Garden, Beijing 100094, China
*
Author to whom correspondence should be addressed.
These authors contributed equally to this work.
Int. J. Mol. Sci. 2022, 23(8), 4319; https://doi.org/10.3390/ijms23084319
Submission received: 24 January 2022 / Revised: 9 April 2022 / Accepted: 12 April 2022 / Published: 13 April 2022
(This article belongs to the Special Issue Sugar Transport in Plants)

Abstract

:
During the growth cycle of lilies, assimilates undergo a process of accumulation, consumption and reaccumulation in bulbs and are transported and allocated between aboveground and underground organs and tissues. The sink–source relationship changes with the allocation of assimilates, affecting the vegetative growth and morphological establishment of lilies. In this study, the carbohydrate contents in different tissues of five critical stages during lily development were measured to observe the assimilates allocation. The results showed bulbs acted as the main source to provide energy before the budding stage (S3); after the flowering stage (S4), bulbs began to accumulate assimilates as a sink organ again. During the period when the plant height was 30cm with leaf-spread (S2), leaves mainly accumulated assimilates from bulbs through the symplastic pathway, while when leaves were fully expanded, it transformed to export carbohydrates. At the S4 stage, flowers became a new active sink with assimilates influx. To further understand the allocation of assimilates, 16 genes related to sugar transport and metabolism (ST genes) were identified and categorized into different subfamilies based on the phylogenetic analysis, and their protein physicochemical properties were also predicted. Tissue-specific analysis showed that most of the genes were highly expressed in stems and petals, and it was mainly the MST (monosaccharide transporter) genes that were obviously expressed in petals during the S4 stage, suggesting that they may be associated with the accumulation of carbohydrates in flowers and thus affect flower development process. LoSWEET14 (the Sugar will eventually be exported transporters) was significantly correlated with starch in scales and with soluble sugar in leaves. Sugar transporters LoHXT6 and LoSUT1 were significantly correlated with soluble sugar and sucrose in leaves, suggesting that these genes may play key roles in the accumulation and transportation of assimilates in lilies. In addition, we analyzed the expression patterns of ST genes under different abiotic stresses, and the results showed that all genes were significantly upregulated. This study lays a solid foundation for further research on molecular mechanism of sink–source change and response to abiotic stresses in lilies.

1. Introduction

Lilies (Lilium spp.) are perennial bulbous plants of Liliaceae, with high ornamental and economic value [1]. The growth cycle of lily is unique. During early growth and development, the bulbs serve as the main source organ where starch is the main component of carbohydrates in lilies to provide nutrients for the growth of underground organs and morphogenesis of aboveground organs [2]. As starch is hydrolyzed into soluble sugar, sucrose becomes the main form of soluble sugar that is transported to source organs such as leaves and flowers for both vegetative and reproductive development [3]. While after leaf growth and flower bud formation, with the enhancement of photosynthesis, assimilates produced by aerial parts of plants are transported downward through stems to bulbs and the bulbs gradually transform into sink organs to accumulate assimilates in preparation for the next season [4,5]. Therefore, both the growth and development of the underground organs and the morphogenesis of the aboveground organs are closely related to the allocation of assimilates in lilies, especially starch and sucrose, which play a coordinating and balancing role among various forms of carbohydrate [6].
In higher plants, assimilates produced by photosynthesis are mainly transported long distances in the phloem in the form of sucrose [7]. There are two pathways for sucrose loading and unloading in the phloem: the symplastic pathway is mediated directly by plasmodesmata, and the apoplastic pathway needs the participation of sugar transporters (ST) [8]. After transportation from leaves to fruits, roots and other organ cells, sucrose will be converted into fructose, glucose or Uridine diphosphade glucose (UDP-glucose) by extracellular invertase. Then, glucose and fructose are transformed into glucose-6-phosphate (G6P) and fructose-6-phosphate (F6P) through phosphorylation processes by hexokinase (HK) and fructokinase (FRNK) enzymes, respectively, in order to play roles in live activities, while unmetabolized sucrose is transported into vacuoles via ST [9,10].
The sugar transporters identified in plants can be divided into three types: monosaccharide/polyol transporters (MSTs), sucrose transporters (SUTs or SUCs) and SWEETs (Sugars Will Eventually be Exported Transporter) [11,12]. The MST group is a relatively large gene family, and 53 MST genes were identified in Arabidopsis thaliana genome, which can be divided into seven clades: STP (Sugar Transport Protein) clade, for which its members played a variety of roles in pollen development and root development [13]; VGT (Vacuolar Glucose Transporter) clade; TMT (Tonoplast Monosaccharide Transporter) clade, PGLUT (Plastidic Glucose Transporter) clade; PLT (Polyol Transporter) clade; INT (Inositol Transporter) clade; and ERD6-like (Early Responsive to Dehydration) clade [14,15,16]. Compared with MST, the distribution range of SUT gene family is smaller. Nine SUT genes were identified in the Arabidopsis thaliana genome, which can be divided into three groups [14,17]. Both MST and SUT belong to major facilitator superfamily (MFS) with 12 transmembrane domains (TMDs) [18]. SWEET, a newly identified sugar transporter, which is different from MST and SUT, contains only seven TMDs and can transport sugars in both directions without energy dependency [19,20]. Currently, the role of ST genes in growth and development has been studied in different plants. Sixty-three ST genes were searched in grape genome [21], and fifty-two ST genes were observed in tomatoes [22]. Thirty sugar transporter and metabolism related genes were identified to play crucial role in development of fruits in peach and apricot [23,24]. SUT genes numbering 5, 36 SWEET genes in Petunia axillaris and 15 SWEET genes in Punica granatum were found to associated with the flower development [18,25].
In addition to providing the necessary energy for plant growth and development, sugars can also act as signals to regulate plant response to drought, low temperature and other stresses [9,26,27]. ST genes can also respond to many forms of abiotic stress. The expressions of AtSTP13 and INT-like gene of Medicago sativa were induced by salt stress [28,29], MdSUT2 could improve the salt and drought resistance in transgenic apple [30]. However, there are a few studies reported to identify the function of ST genes in lilies.
The allocation of assimilates in lily is a very complex physiological process affecting sink–source transformation between aboveground and underground organs, which is essential for bulb quality and flower process. Genes related to sugar transport and metabolism may be involved in this process, while little research has been reported about the correlation. Therefore, in this study, carbohydrate contents in different organs at different development stages were determined, and phylogenetic and structural analyses were performed in ST genes. Moreover, we conducted a correlation analysis between the expression levels of ST genes and carbohydrate content. Finally, the expression patterns of ST genes under abiotic stress were analyzed. These results will provide us new insights for further research on the function of sugar transporter genes in allocation and accumulation of assimilates and abiotic stress resistance in lilies.

2. Results

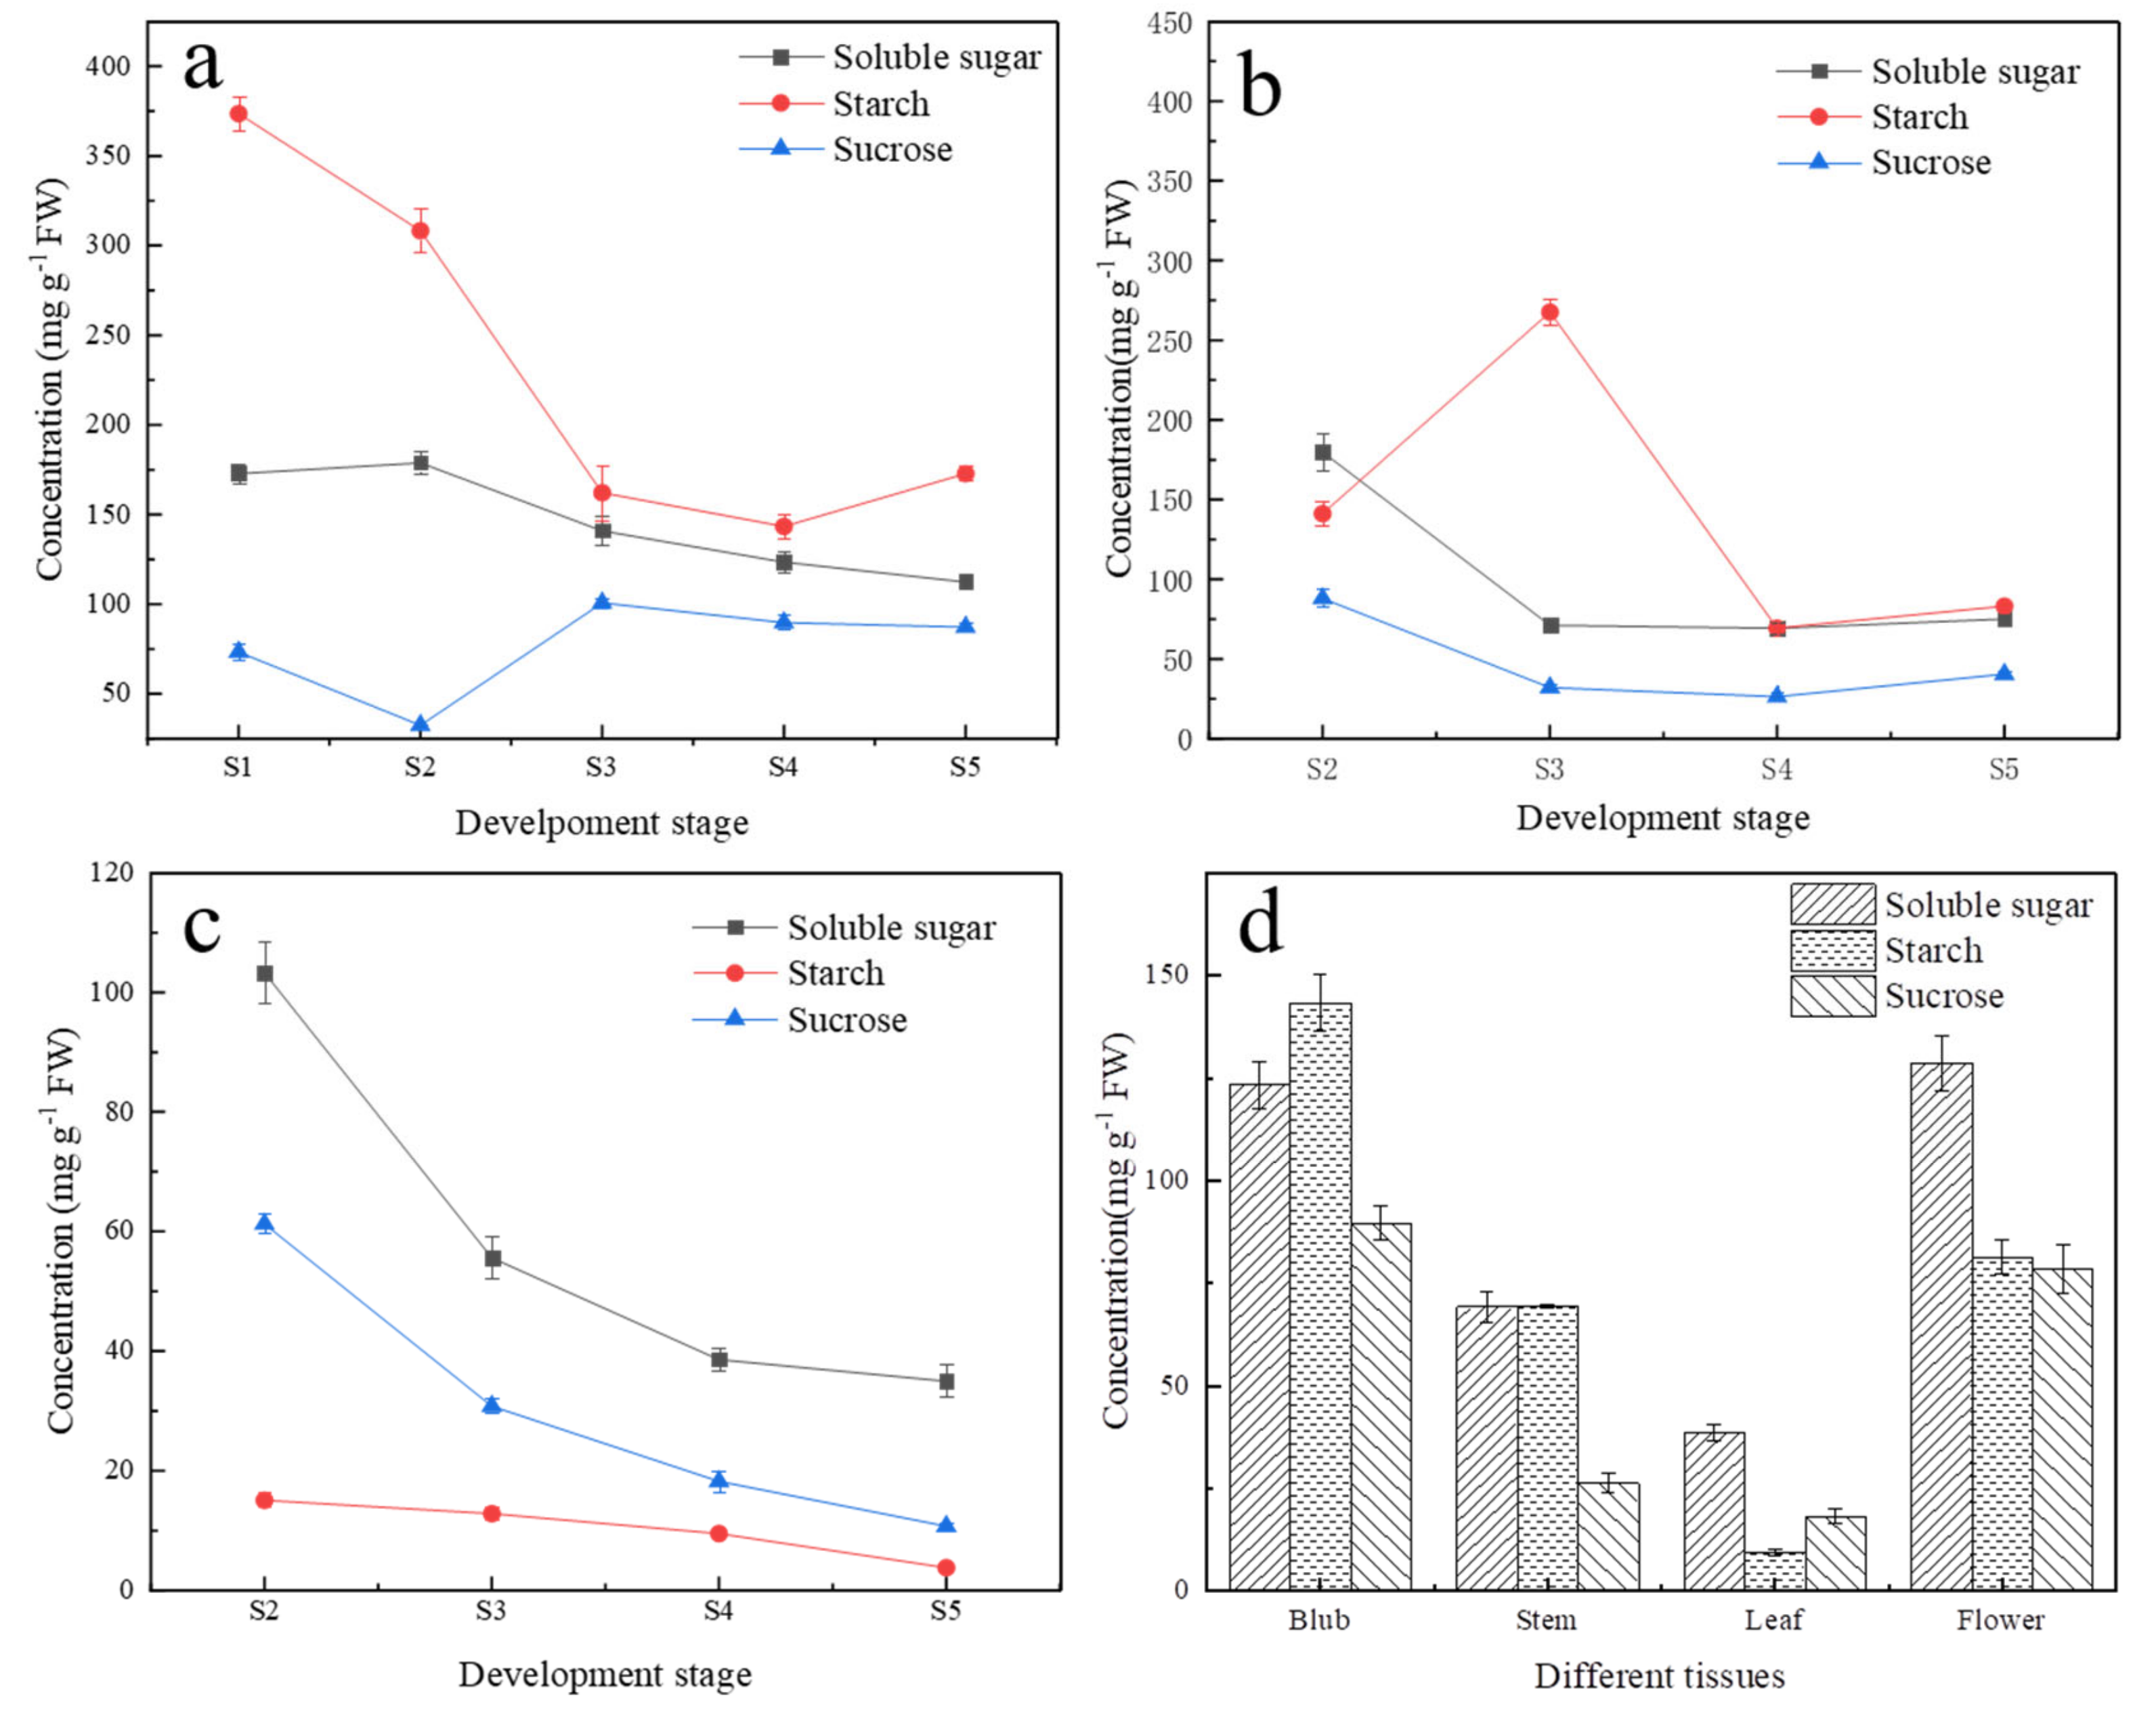
2.1. Variation of Carbohydrate Content during Lily Development in Different Tissues

The carbohydrate content of different organs in five important stages during lily development was measured, including bulb setting stage (S1), plant height of 30 cm with leaf-spread stage (S2), budding stage (S3), flowering stage (S4) and final flowering stage (S5) (Figure 1). In the scales, the starch content was the highest in S1 stage, and then it continued to decrease from S2 to S4 stage and increased slightly from S4 to S5 stage. The soluble sugar content increased slightly from S1 to S2 stage and then continued to decrease. The sucrose content decreased rapidly at S2 stage and then reached its highest at S3 stage, remaining stable afterward (Figure 1a). In stems, the concentration of starch increased rapidly at S3 stage, which was much higher than that in other periods, and it decreased sharply at S4 stage and then increased slightly at S5 stage. The concentration of sucrose and soluble sugar showed a similar trend, which decreased from S2 to S4 stage and slightly increased at S5 stage (Figure 1b). In leaves, the content of all starch, soluble sugar and sucrose decreased continuously from S2 to S5 stage, and soluble sugar and sucrose decreased rapidly at S3 stage (Figure 1c). These results indicated that from S1 to S3 stage, the bulbs mainly provided energy for plant growth as the source; from the S3 to S4 stage, the carbohydrate content in the aboveground and underground organs was in relatively balance, and the function of bulbs as the source organ was weakened. After S4 stage, the bulbs transformed into the source, reaccumulating assimilates in preparation for the next season. Furthermore, carbohydrate distributions in different organs at flowering stage (S4) were also determined (Figure 1d). In scales, the starch content was the highest, while in leaves and petals, the soluble sugar content was higher than starch, and there was no significant difference in stems. It was also found that, except in scales, most carbohydrates accumulated in the petals during flowering, indicating that the flower became the new sink tissues to input assimilates during this period. In addition, the content variations of sucrose and soluble sugar were basically the same in all tissues and organs, and sucrose content accounted for more than half of soluble sugar under most stages.

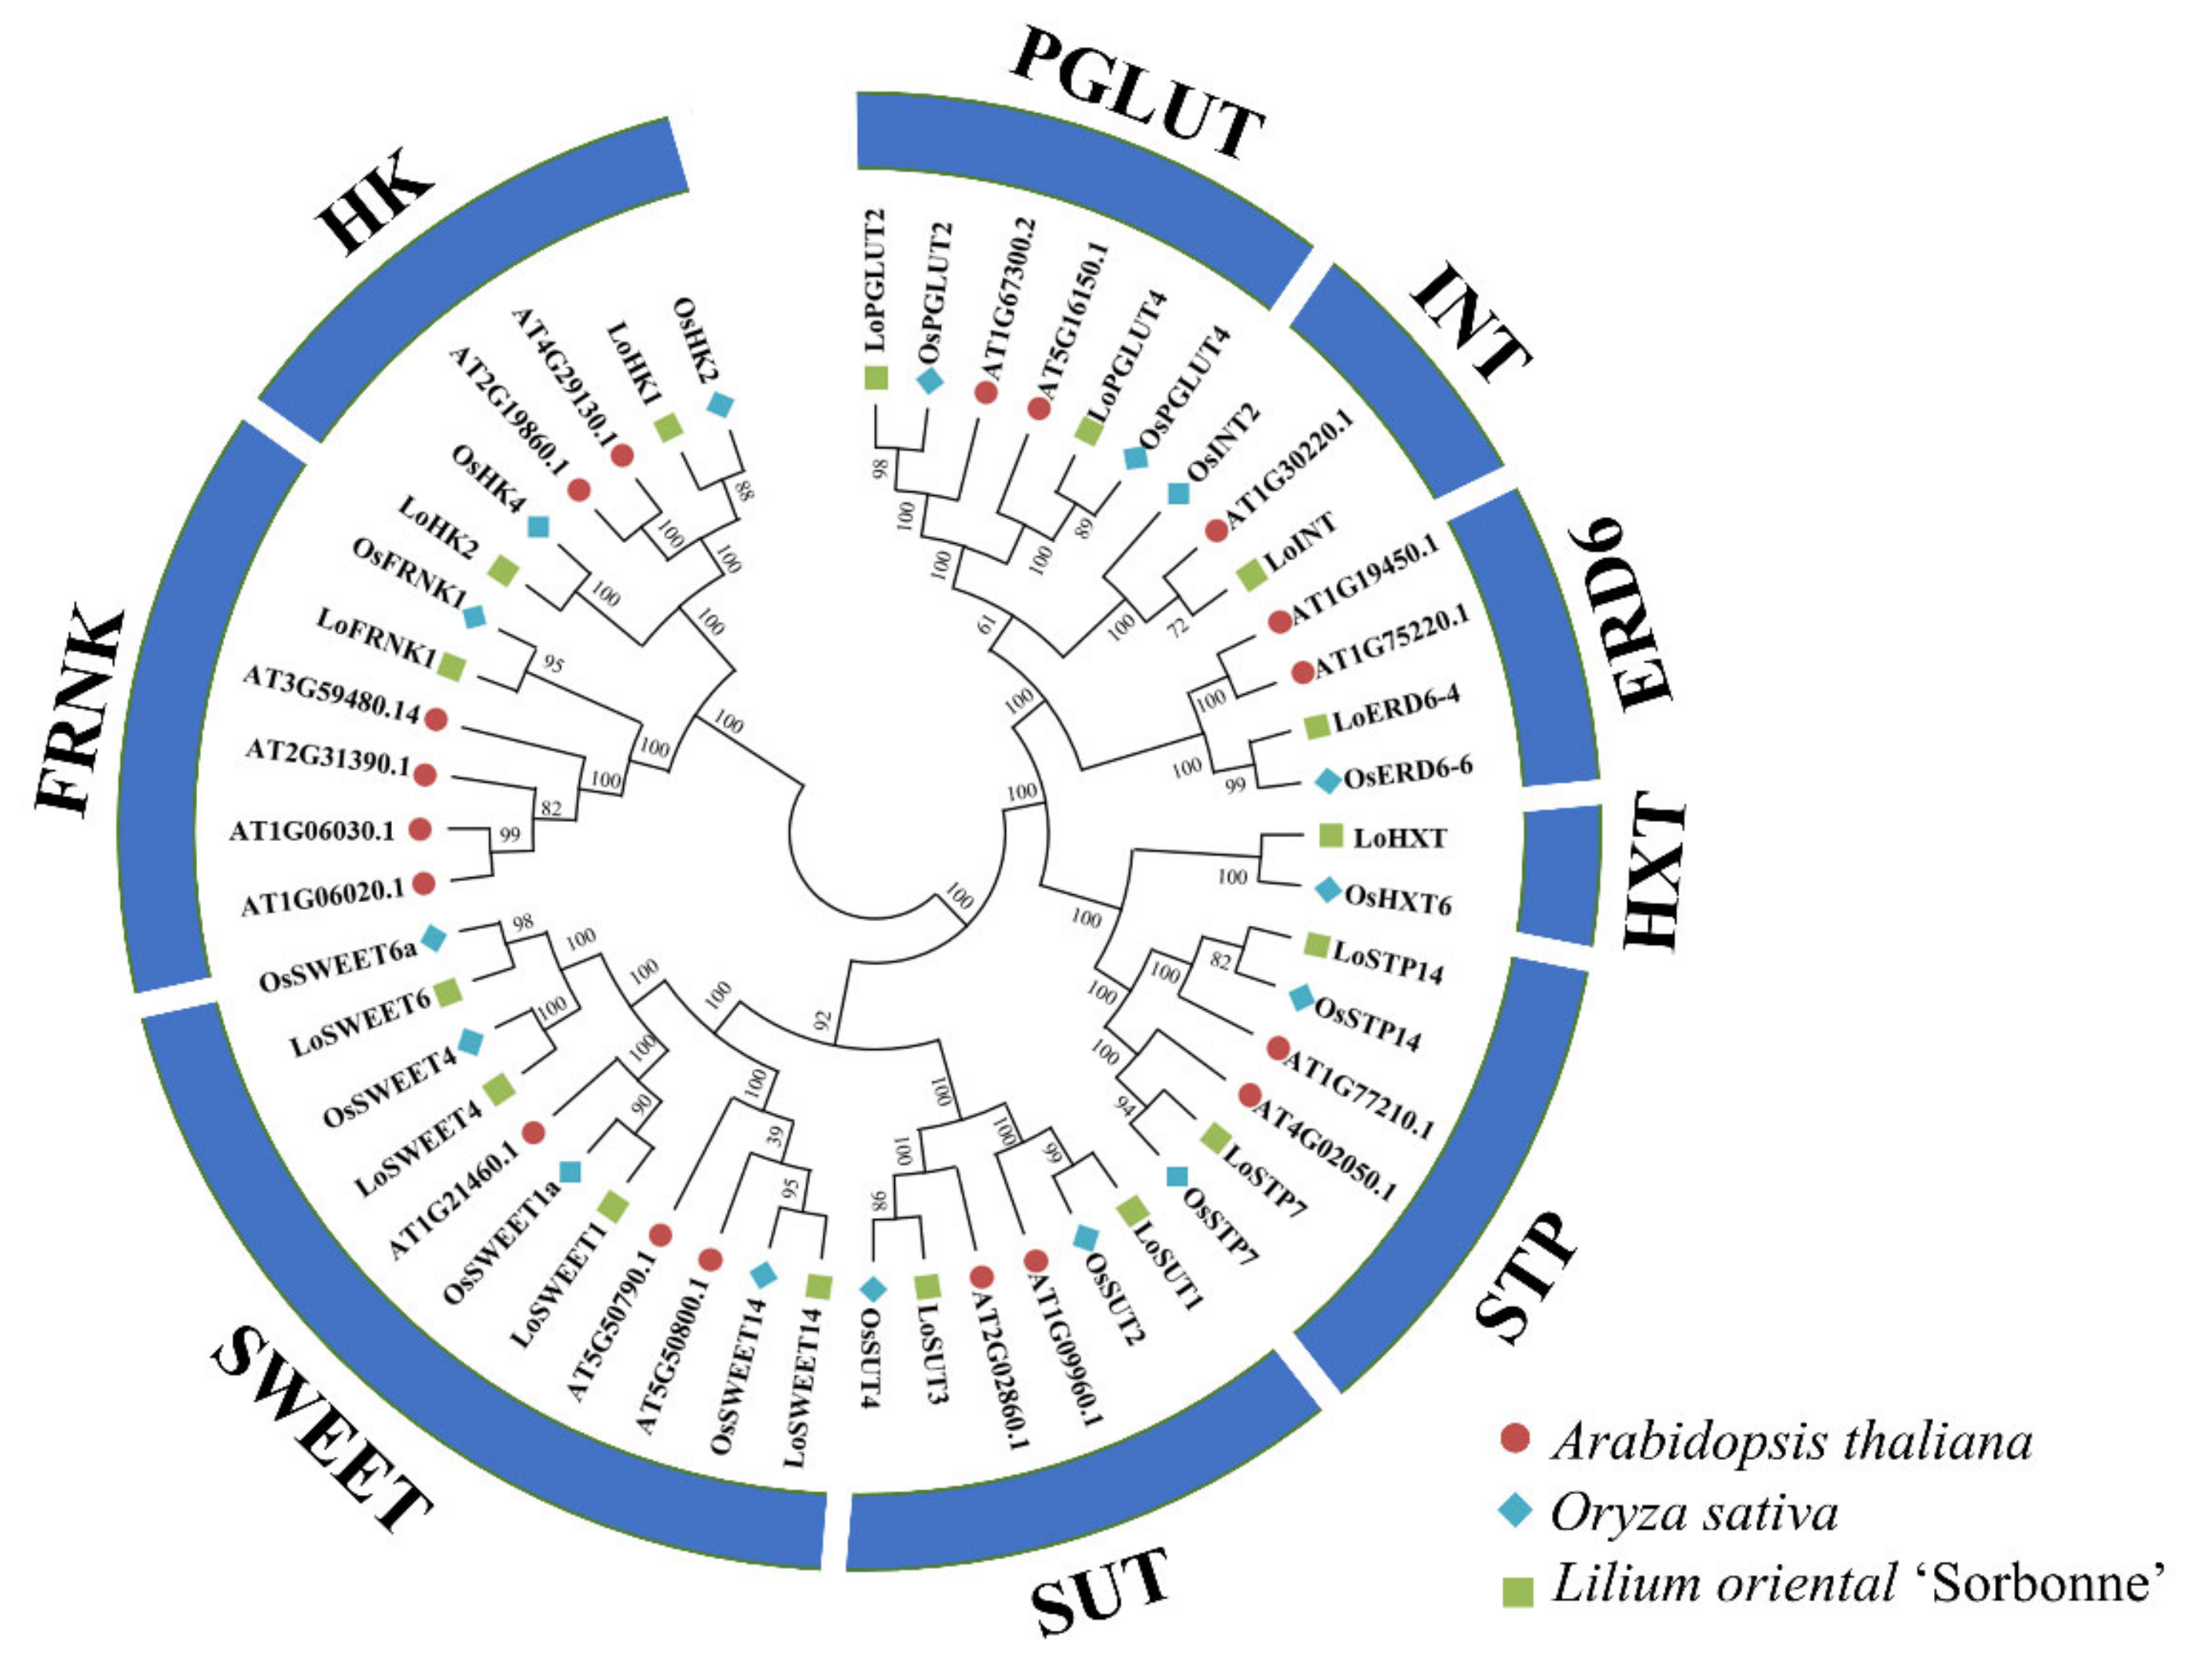
2.2. Identification and Phylogenetic Analysis of Key Sugar Transporter and Metabolism Related Genes during Allocation of Assimates

Based on the protein sequences of Arabidopsis thaliana using BLASTp search, 16 genes related to sugar transporter and metabolism were finally identified. A phylogenetic tree consisting of Arabidopsis and rice (Oryza sativa) ST genes was constructed, which indicated that genes in lilies showed higher similarity with rice, which also belongs to monocotyledons. There are five proteins that belong to the MST family, including a ERD6 gene, an INT gene, a HXT gene, two PGLUT genes and two STP genes; two members belong to the SUT family; four members to the SWEET family; and two forms of kinases including two HK proteins and one FRNK protein (Figure 2). The physicochemical properties of these proteins are shown in Table 1. The coding domain sequences (CDS) of these genes ranged from 633 bp to 1773 bp, and the encoding protein length ranged from 206 bp to 590 bp. The predicted theoretical isoelectric point (pI) ranged from 5.21 to 9.41, and the molecular weight ranged from 22.82 kDa to 63.32 kDa, of which the CDS lengths of SWEETs were less than 1000, and the weights of these proteins were the lightest. Ten proteins were predicted to be stable with instability index < 40, and there were significant differences in stability among proteins of the same gene family. With the exception of HK and FRNK, other sequences were transport proteins with transmembrane domains (TMDs) and predicted in plasma membrane localization, of which LoSWEET1 were predicted to have five TMDs and LoSWEETS4/6/14 had seven TMDs. LoSTP14, LoPGLUT2 and LoPGLUT4 were predicted to have 10 TMDs, while other MST proteins had 12 TMDs. LoHK1 and LoHK2 were predicted to localized in the chloroplast and LoFRNK1 in the cytoplasm.

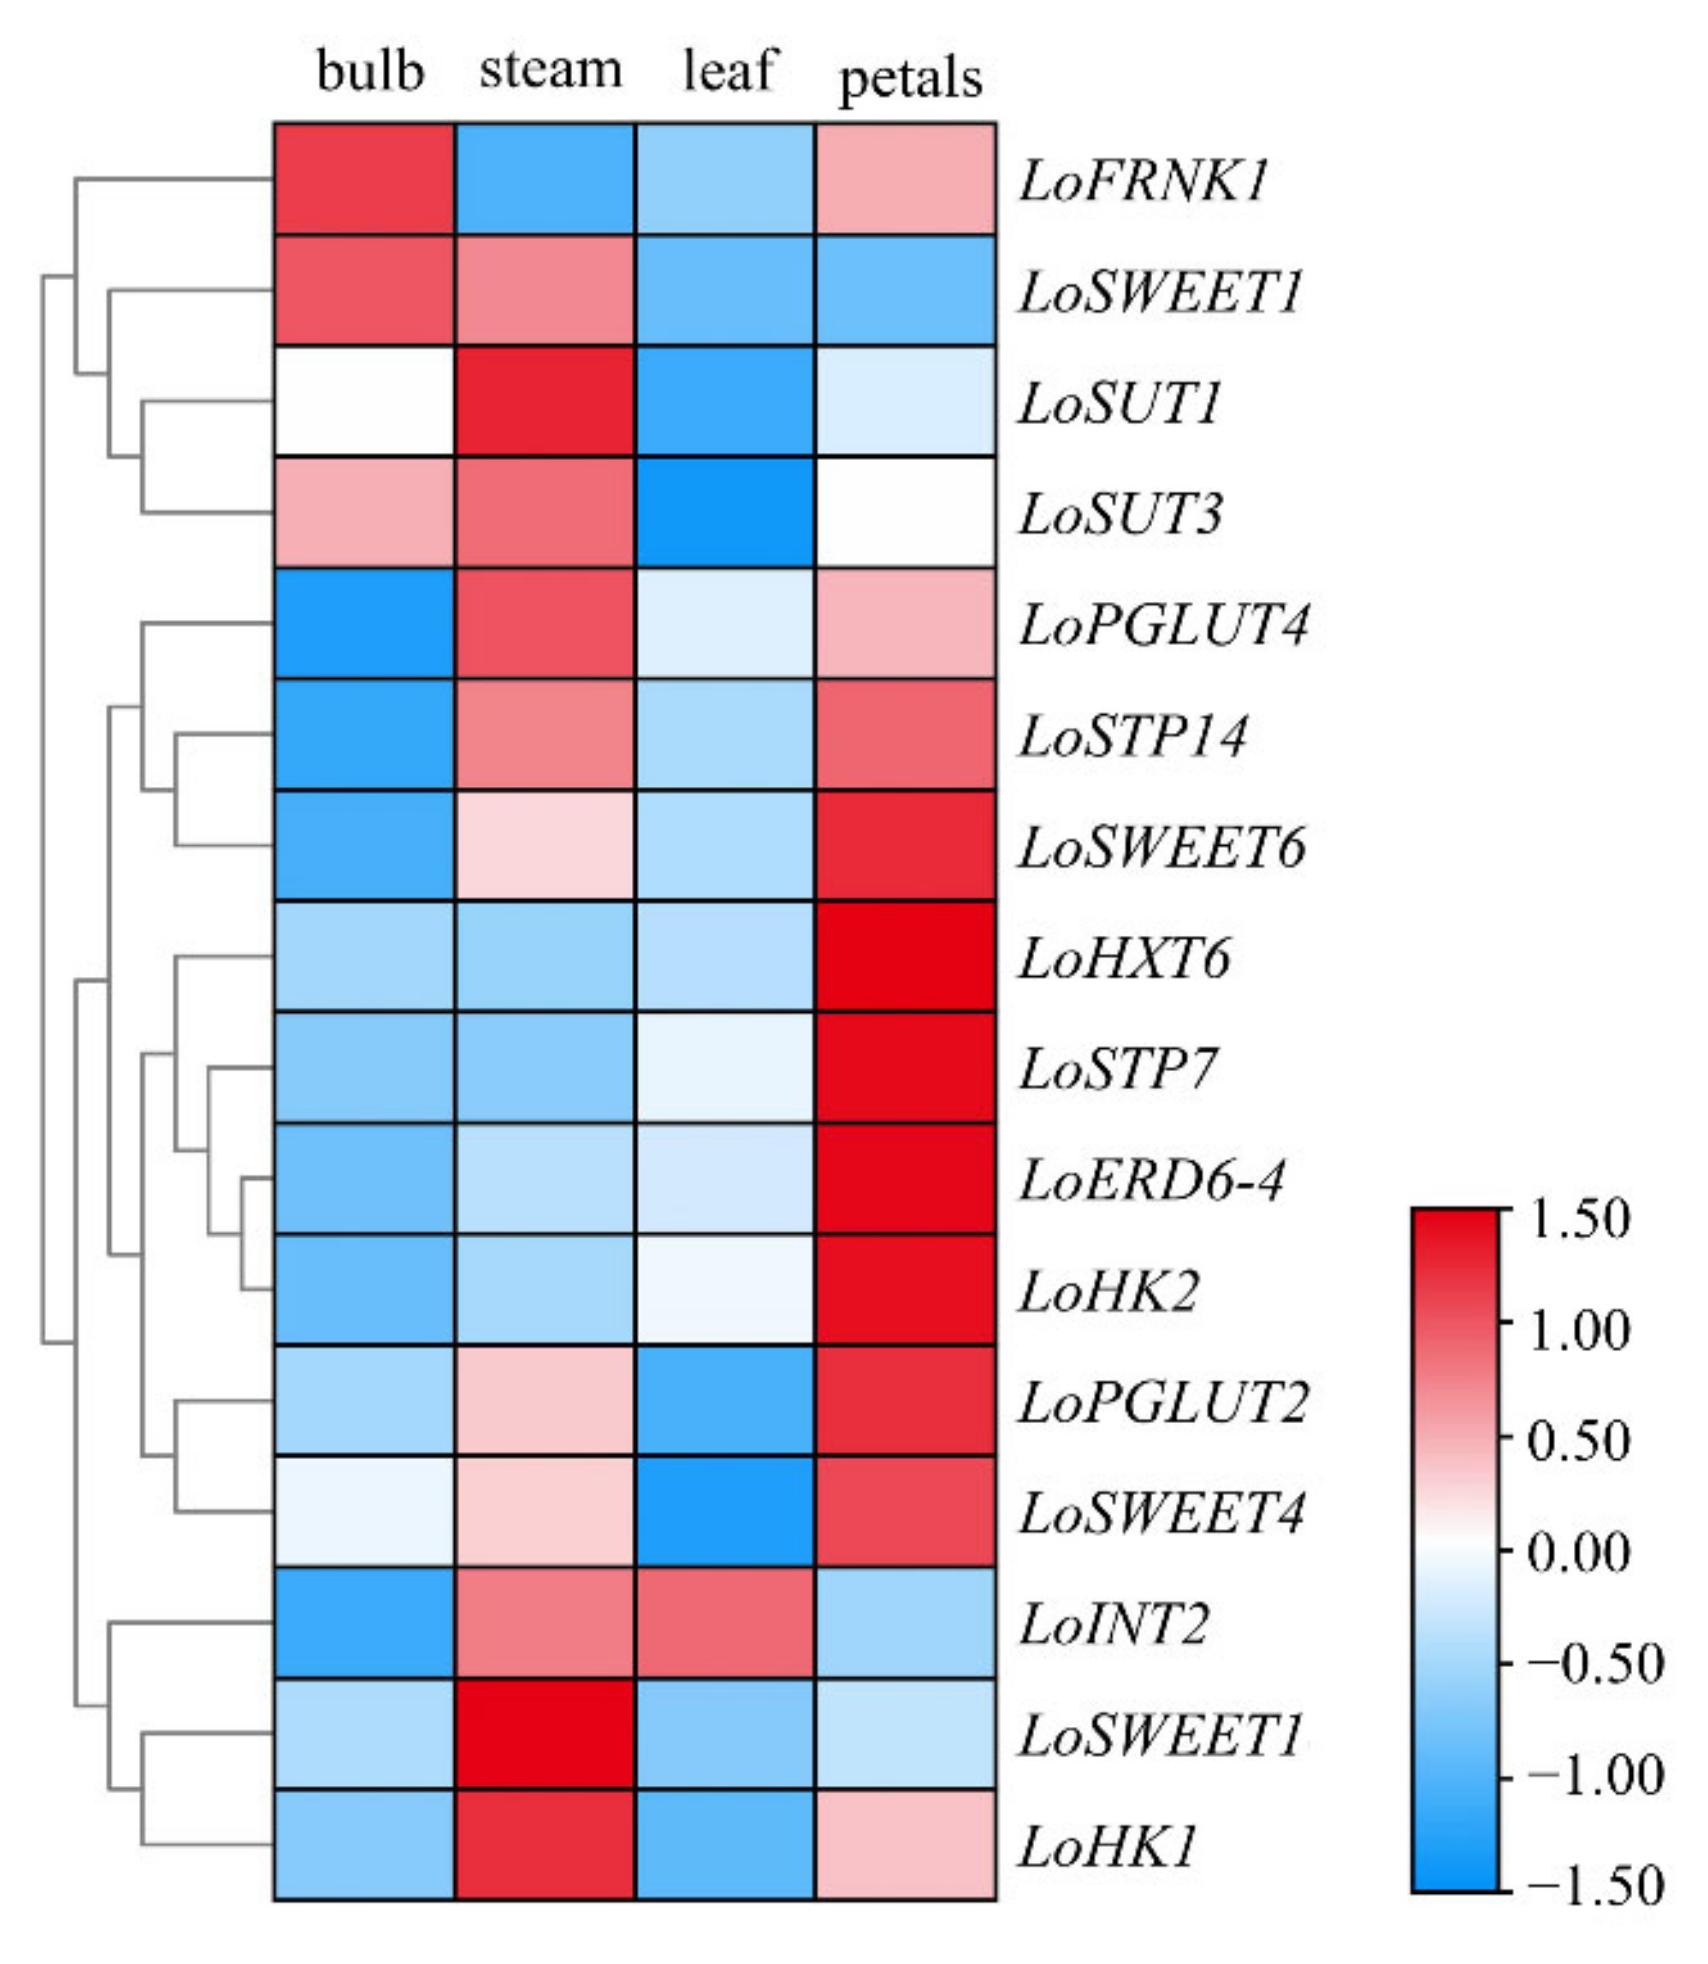
2.3. Tissue-Specific Expression Pattern of ST Genes

To investigate the transcriptional levels of ST genes in different tissues and organs, the scales, stems, leaves and petals of lily at the S4 stage were collected to analyze the expression patterns of these genes by qRT-PCR (Figure 3). Tissue-specific expression analysis showed that all ST genes were highly expressed in stems or flowers. Among these genes, LoSWEET14 was highly expressed only in the stems; LoHXT6, LoERD6-4 and LoHK2 were only highly expressed in the petals; and other genes were detected in more than one tissues. Only three genes including LoFRNK1, LoSWEET1 and LoSUT3 showed relatively high expressions in scales, and only LoINT2 was expressed higher in leaves than in other tissues. LoHK1, LoPGLUT4, LoSTP14 and LoSWEET6 were highly expressed in both stems and petals. LoSWEET4 was highly expressed in petals, followed by stems, but almost not expressed in leaves. LoSTP7 was highly expressed in petals, followed by leaves, but almost not expressed in scales and stems. Notably, in petals, all monosaccharide transporter proteins (MSTs) except LoINT2 were significantly expressed, and LoFRNK1, LoHK1 and LoHK2 genes were also highly expressed. It is speculated that sucrose may be broken down into monosaccharides such as glucose and fructose to participate in cellular life activities or transported to the vesicles for storage via MSTs.

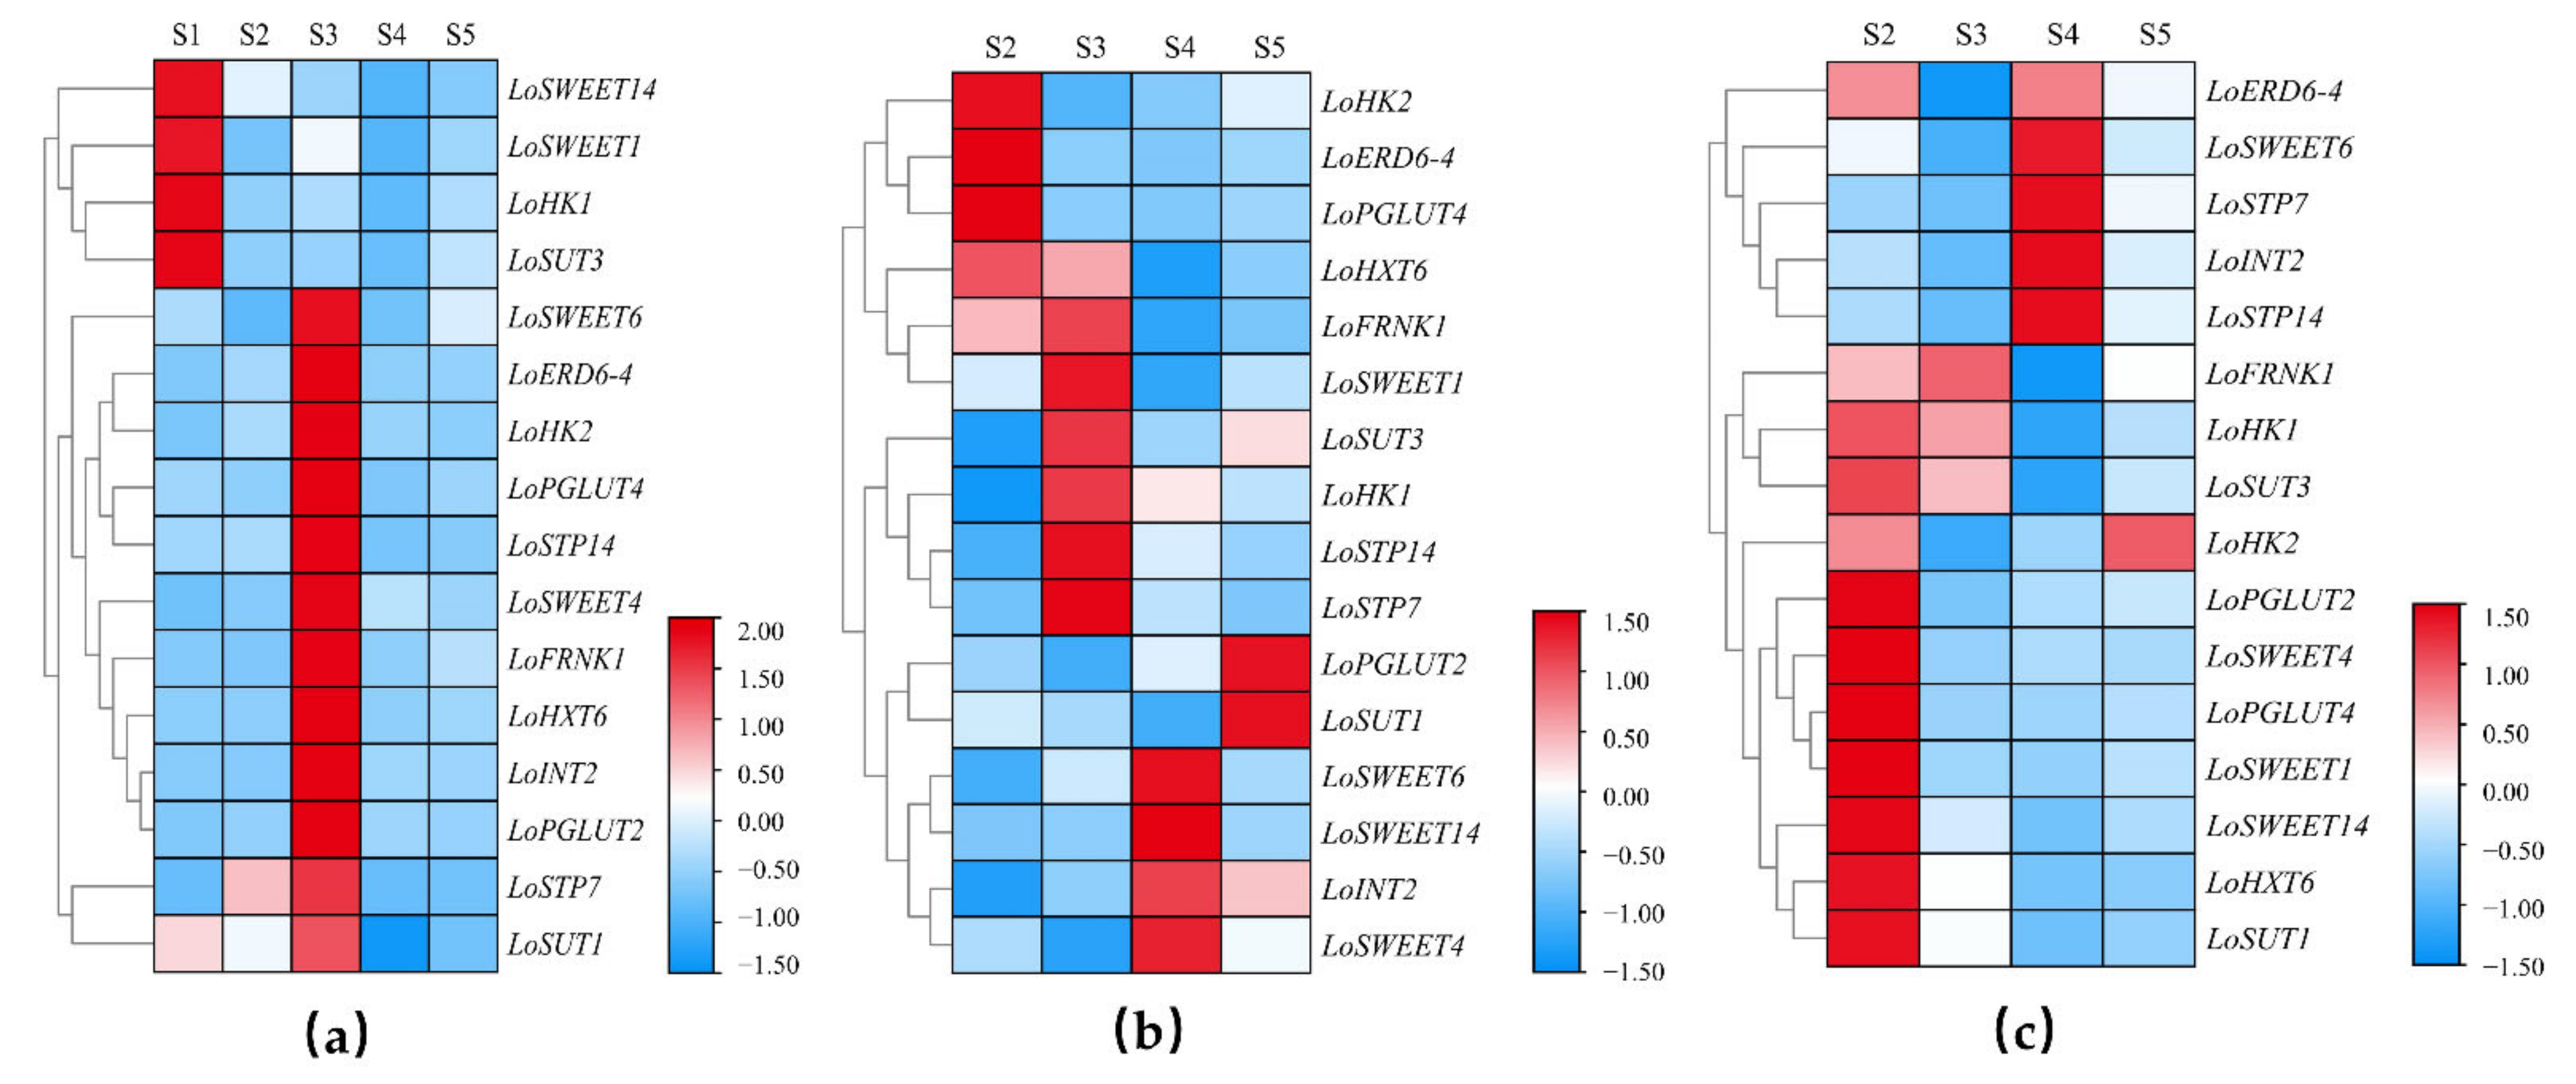
2.4. Spatial and Temporal Differential Expression Patterns of ST Genes during the Allocation of Assimilates

To further understand the carbohydrate transport and allocation in development and growth in lilies of underground and aboveground organs, the expression levels of ST genes at five stages in scales, stems and leaves were determined and clustered with heatmaps (Figure 4). In scales, most genes were significantly expressed just in a single period. LoSWEET1/14, LoHK1 and LoSUT3 were highly expressed at S1 stage (Figure 4a). Although carbohydrate transport between aboveground and underground organs had not occurred at this period, starch–sucrose metabolic process still existed to provide energy for maintaining the basic life activities of bulbs, which required the participation of ST genes. From S2 stage, bulbs served as the source organ to provide energy for leaf growth, and the contents of starch and sucrose in bulbs began to decline. During this period, the expression levels of ST genes did not change significantly except LoSTP7, suggesting that sucrose was mainly loaded in the phloem near the source organs (bulbs) via the symplastic pathway, which did not require the mediation of ST. However, in S3 stage, it was also found that the starch content in the scales decreased sharply and a large amount of assimilates flowed out of bulbs, while sucrose content increased significantly (Figure 1a). The expression levels of ST genes increased significantly except Losweet1/14, LoHK1 and LoSUT3, indicating that, at S3 stage, sucrose loaded in the phloem near the source organs (bulbs) had changed toward the apoplastic pathway, which required the transmembrane transport of ST proteins. The expression levels of ST genes in stems, which are necessary channels for the flow of assimilates between aboveground and underground organs, also fluctuated significantly (Figure 4b). The expression levels of LoHK2, LoERD6-4, LoPGLUT4 and LoHXT6 were the highest at S2 stage, while LoFRNK1, LoSWEET1, LoSTPs, LoHK1 and LoSUT3 had higher expression levels at S3 stage. LoSUT1 and LoPGLUT2 did not change significantly in the early stage but increased suddenly at S5 stage. The expression levels of LoINT2 and LoSWEET4/6/14 at S4 stage were significantly higher than those in other stages. The temporal differential expression displayed that the ST genes played different roles in the long-distance transport of sucrose in the phloem. In leaves (Figure 4c), most ST genes were significantly expressed at S2 stage (except LoSTPs, LoINT2 and LoSWEET6) when carbohydrates in bulbs flowed into the not fully mature leaves, indicating that these genes were involved in the accumulation of carbohydrates in leaves as a sink organ. Subsequently, as the leaves gradually matured and photosynthesis was enhanced, the leaves began to serve as source organs to provide energy for lily flowering. LoSTPs, LoINT2 and LoSWEET6, which were not actively expressed at S2 stage, increased significantly in terms of expression at S4 stage, revealing their possible involvement in regulating the output of assimilates from leaves to other organs.
Based on the results of tissue-specific and spatio-temporal differential expressions of ST genes, we proposed a hypothetical molecular regulatory model for assimilating partitioning and transportation in lilies during flowering (Figure 5). The assimilates produced by leaves through photosynthesis flow in large quantities into the petals and also flow downward into bulbs, which are at this point in a dynamic equilibrium of the sink–source relationship. The assimilates are transported in the form of sucrose in phloem and unloaded through the sucrose transporter SUT and SWEET. A portion of sucrose is then transported directly to the cytoplasm via SWEET, while another portion is hydrolyzed to monosaccharides and enters the cytoplasm via MST to participate in vital activities or is stored in the vacuole.

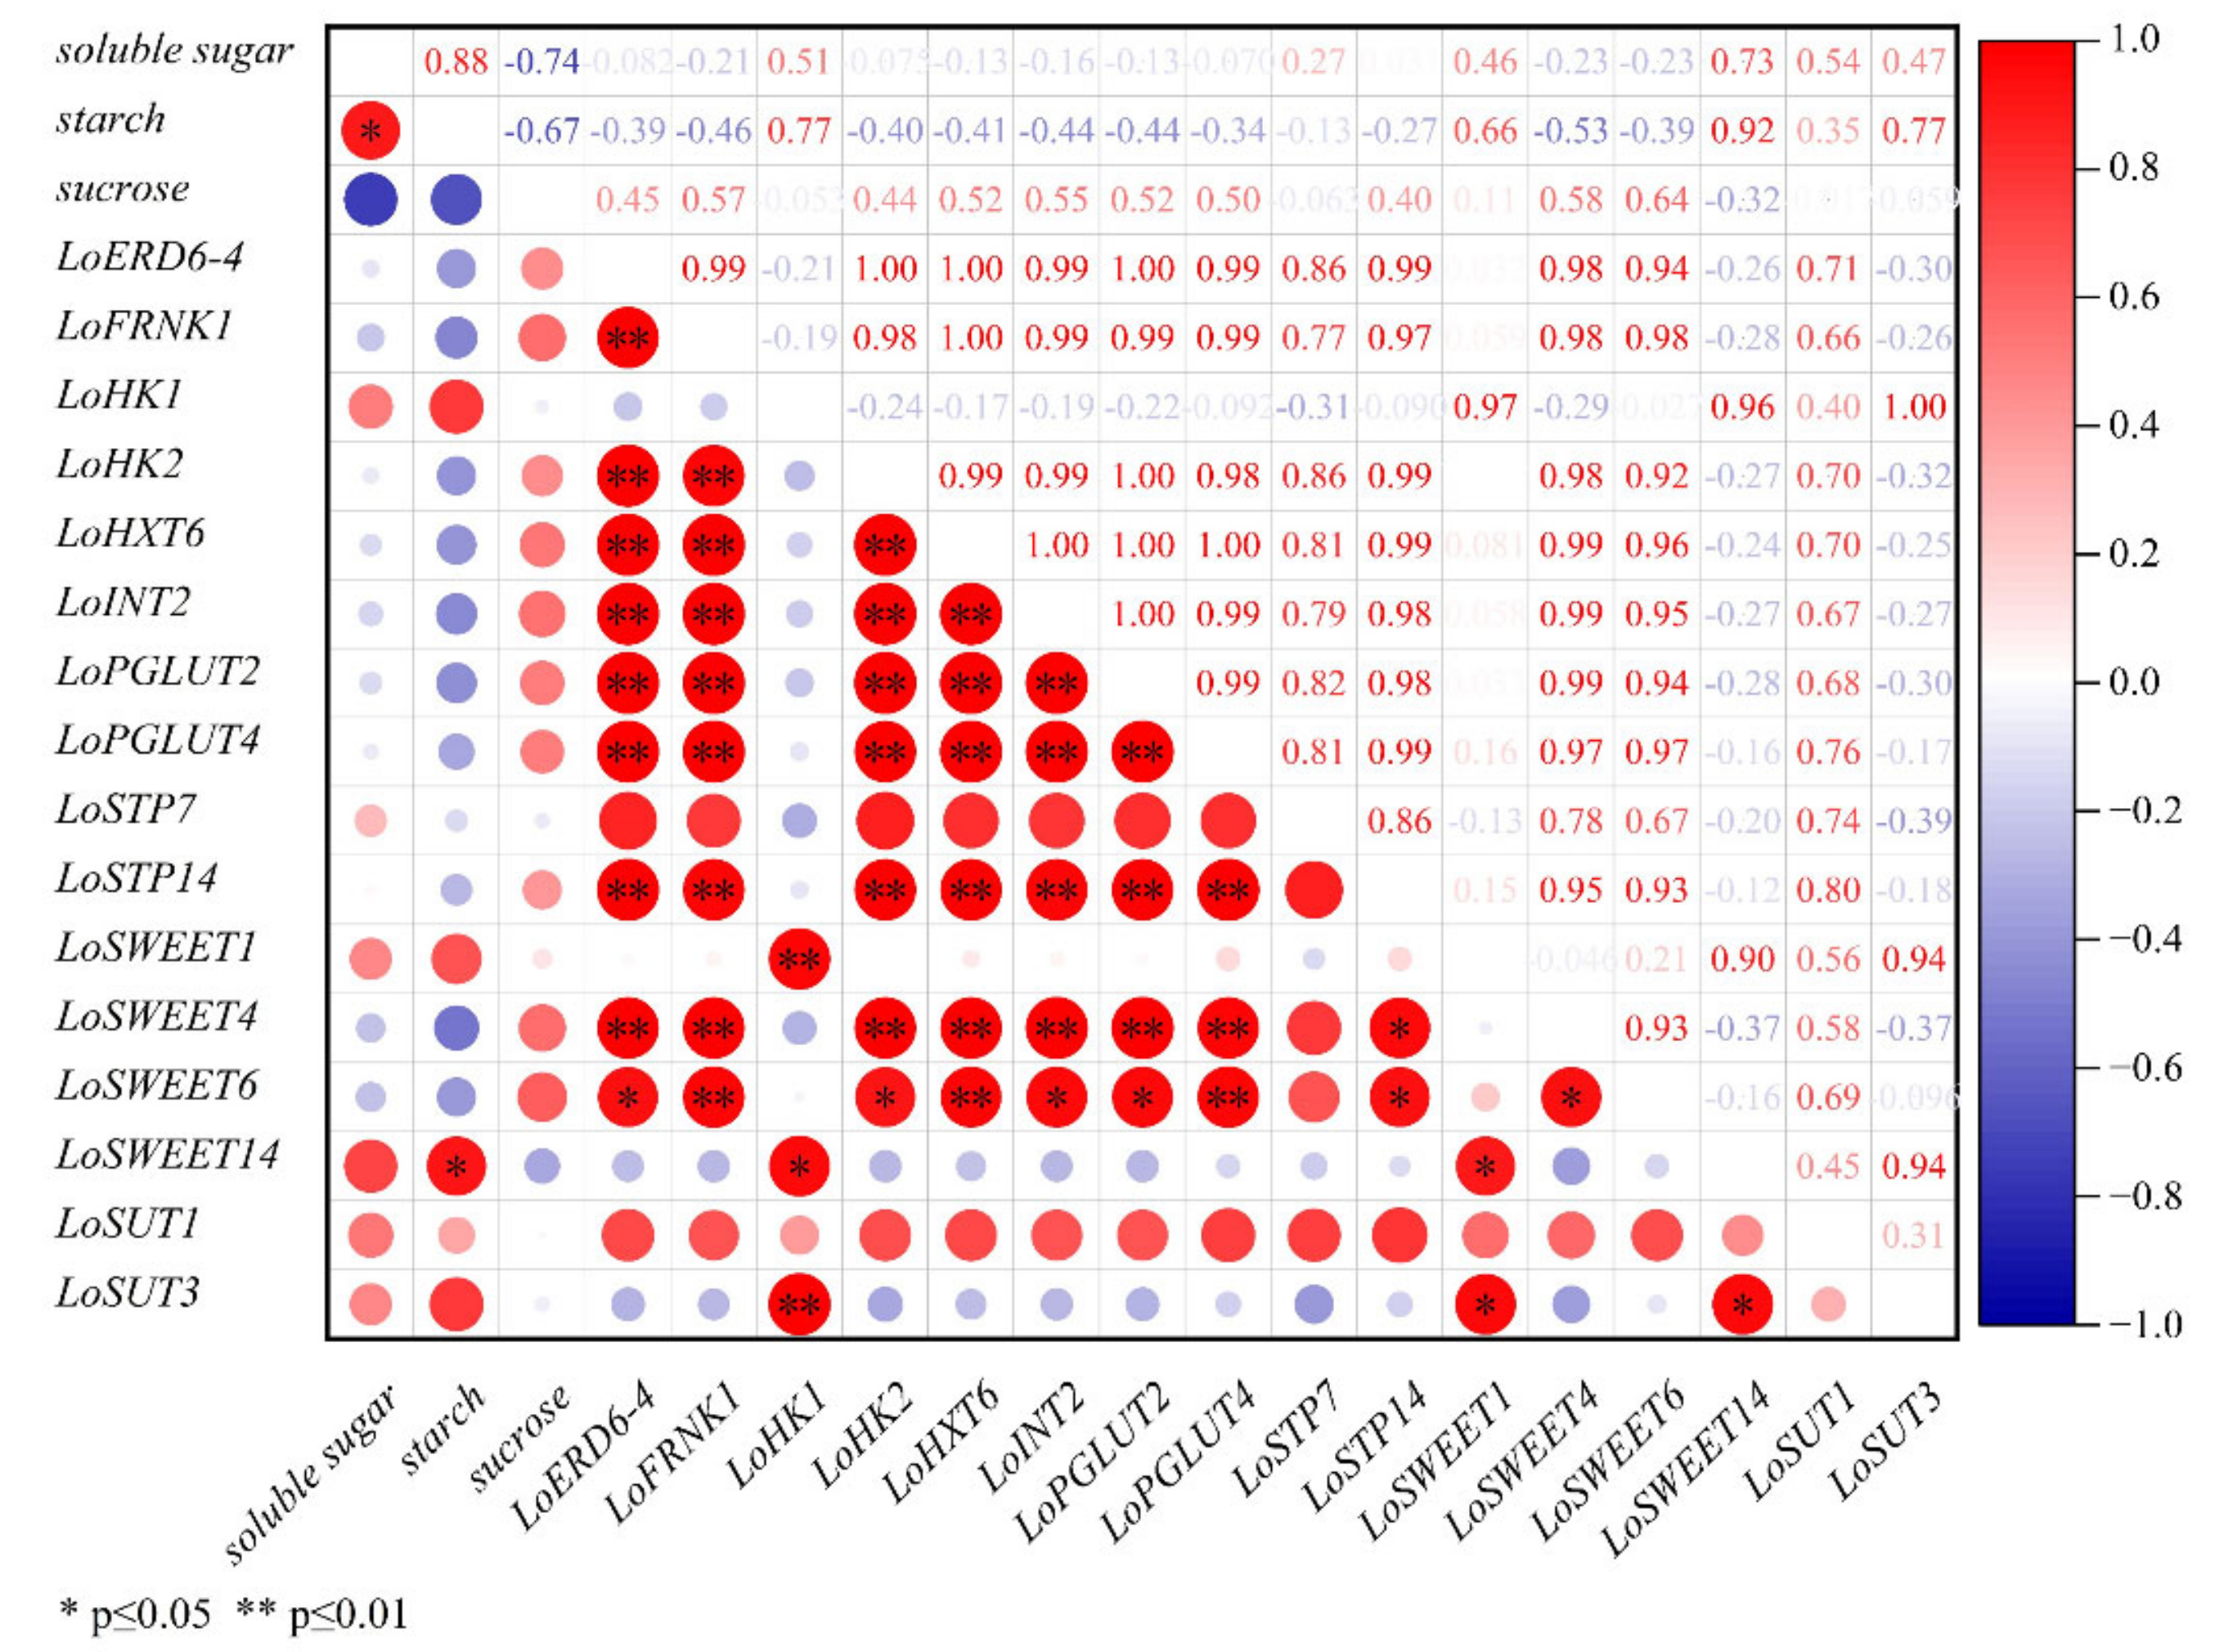
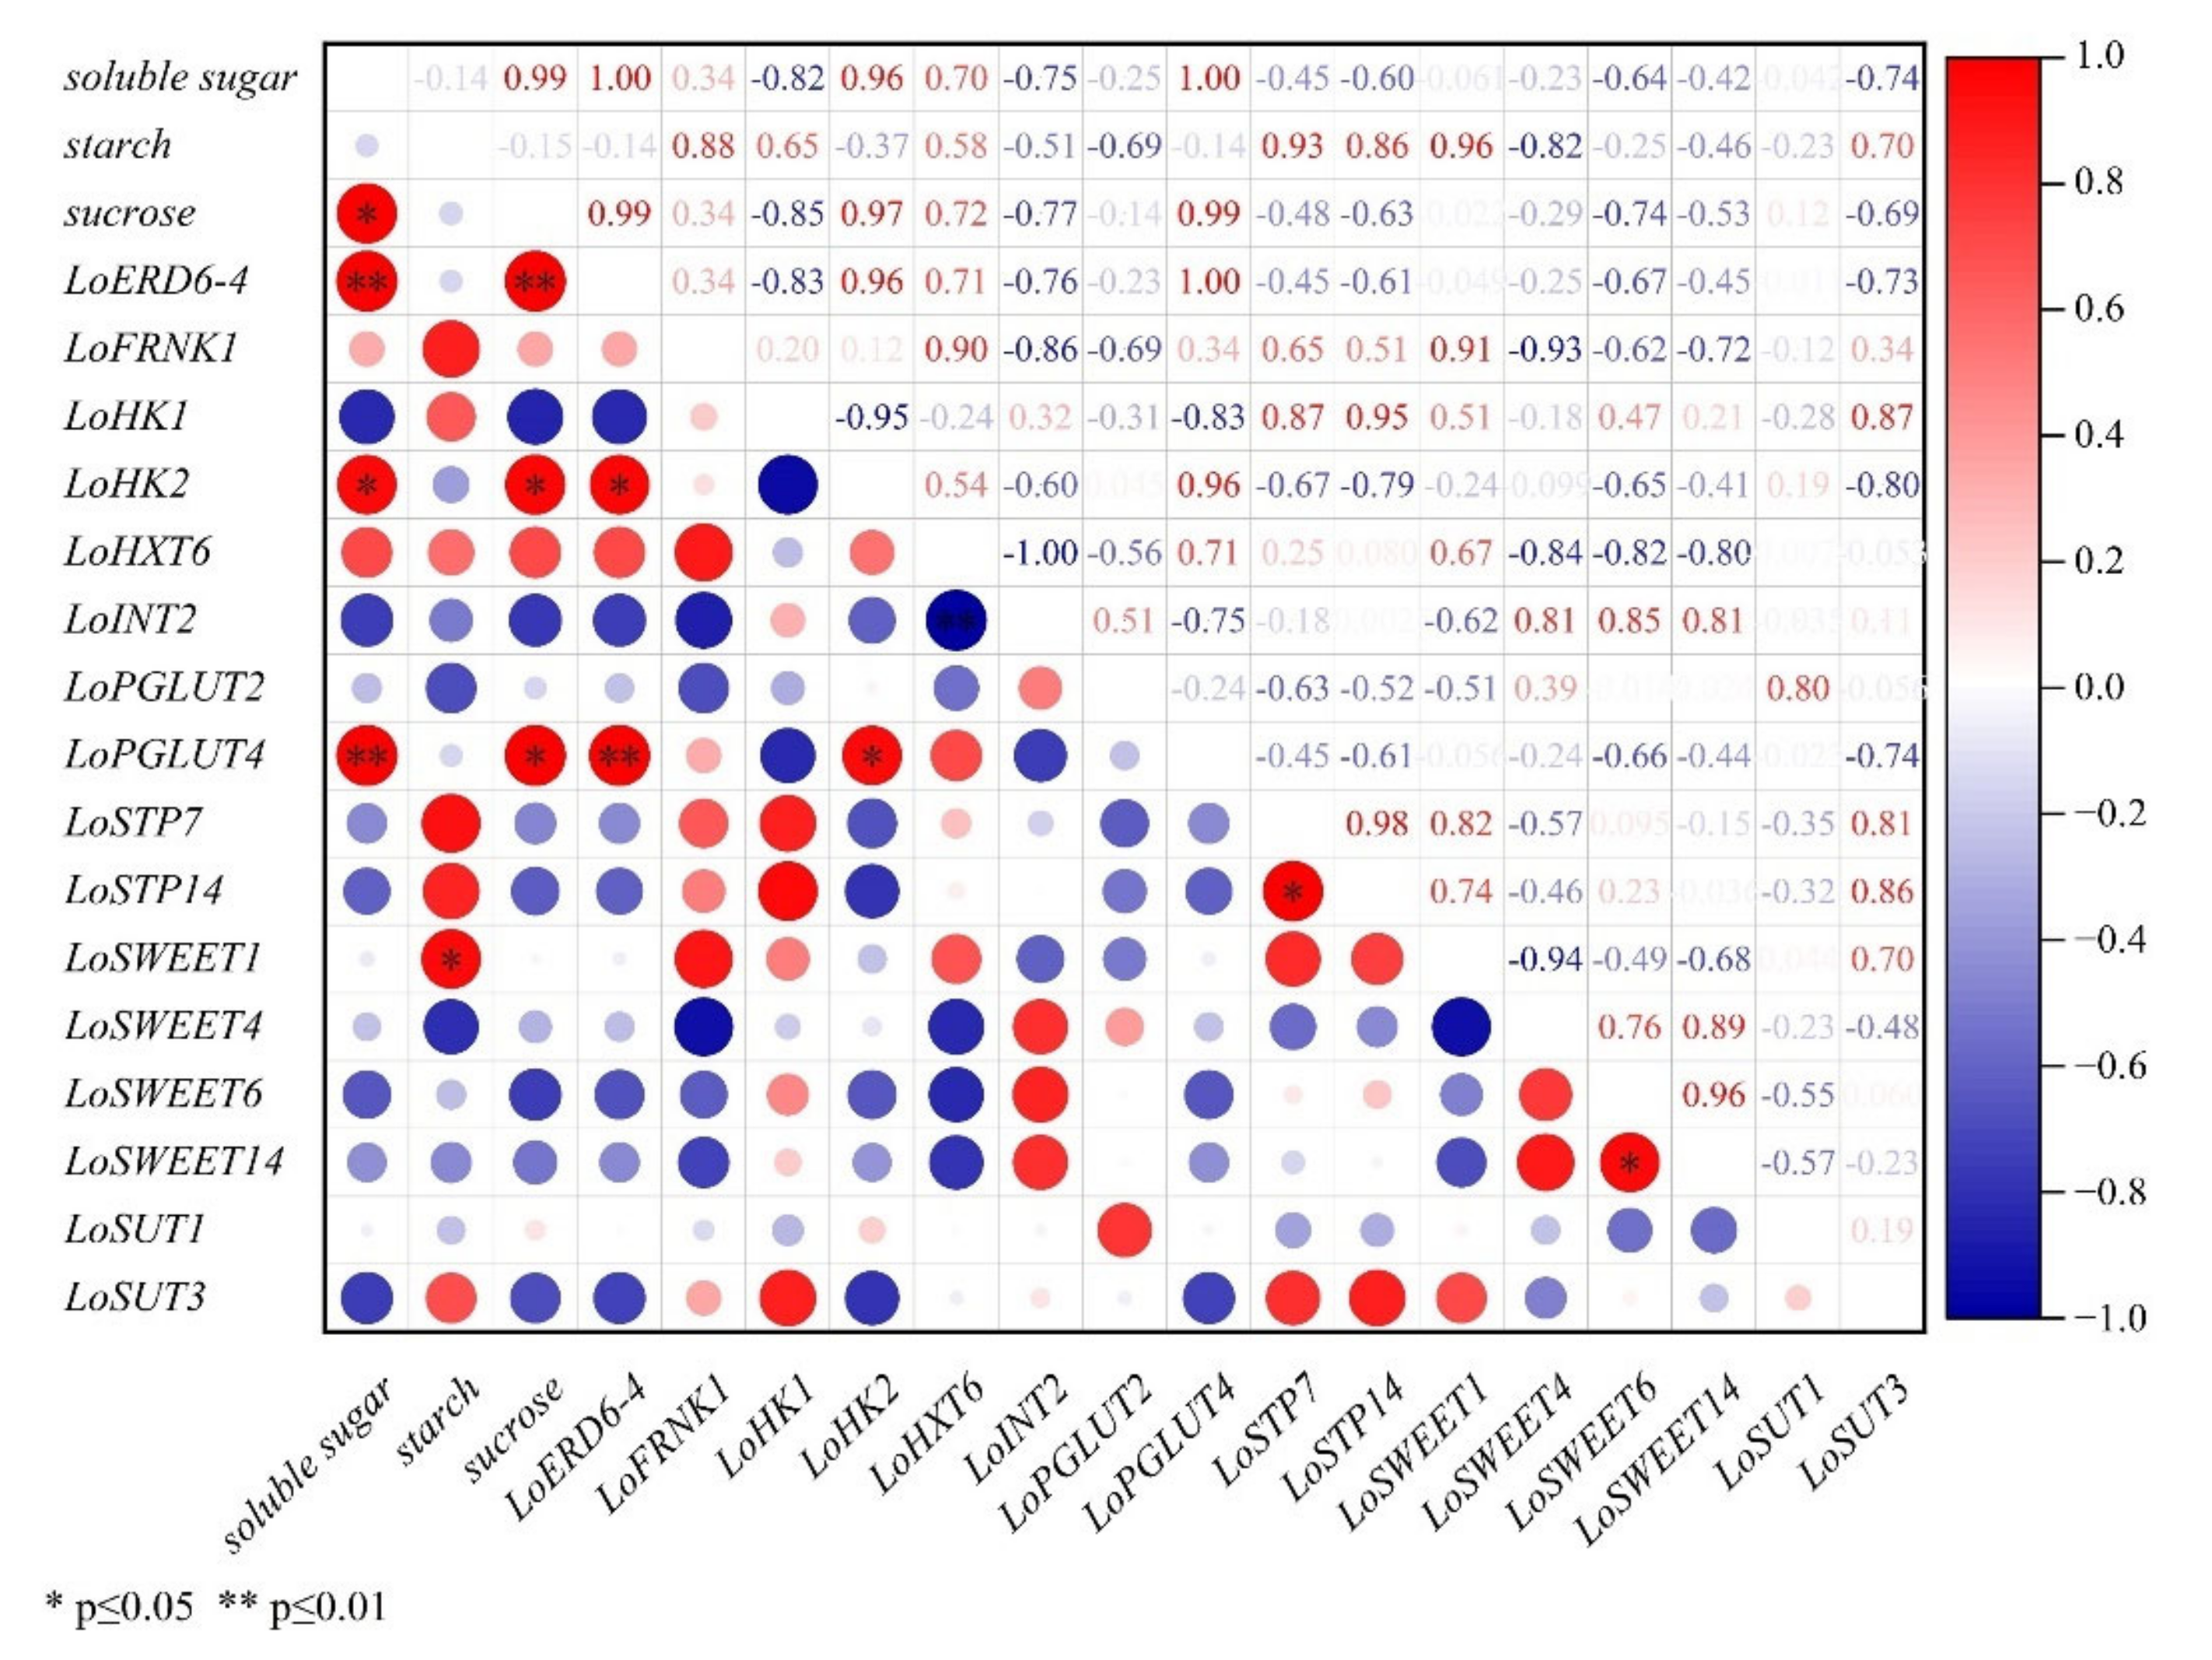
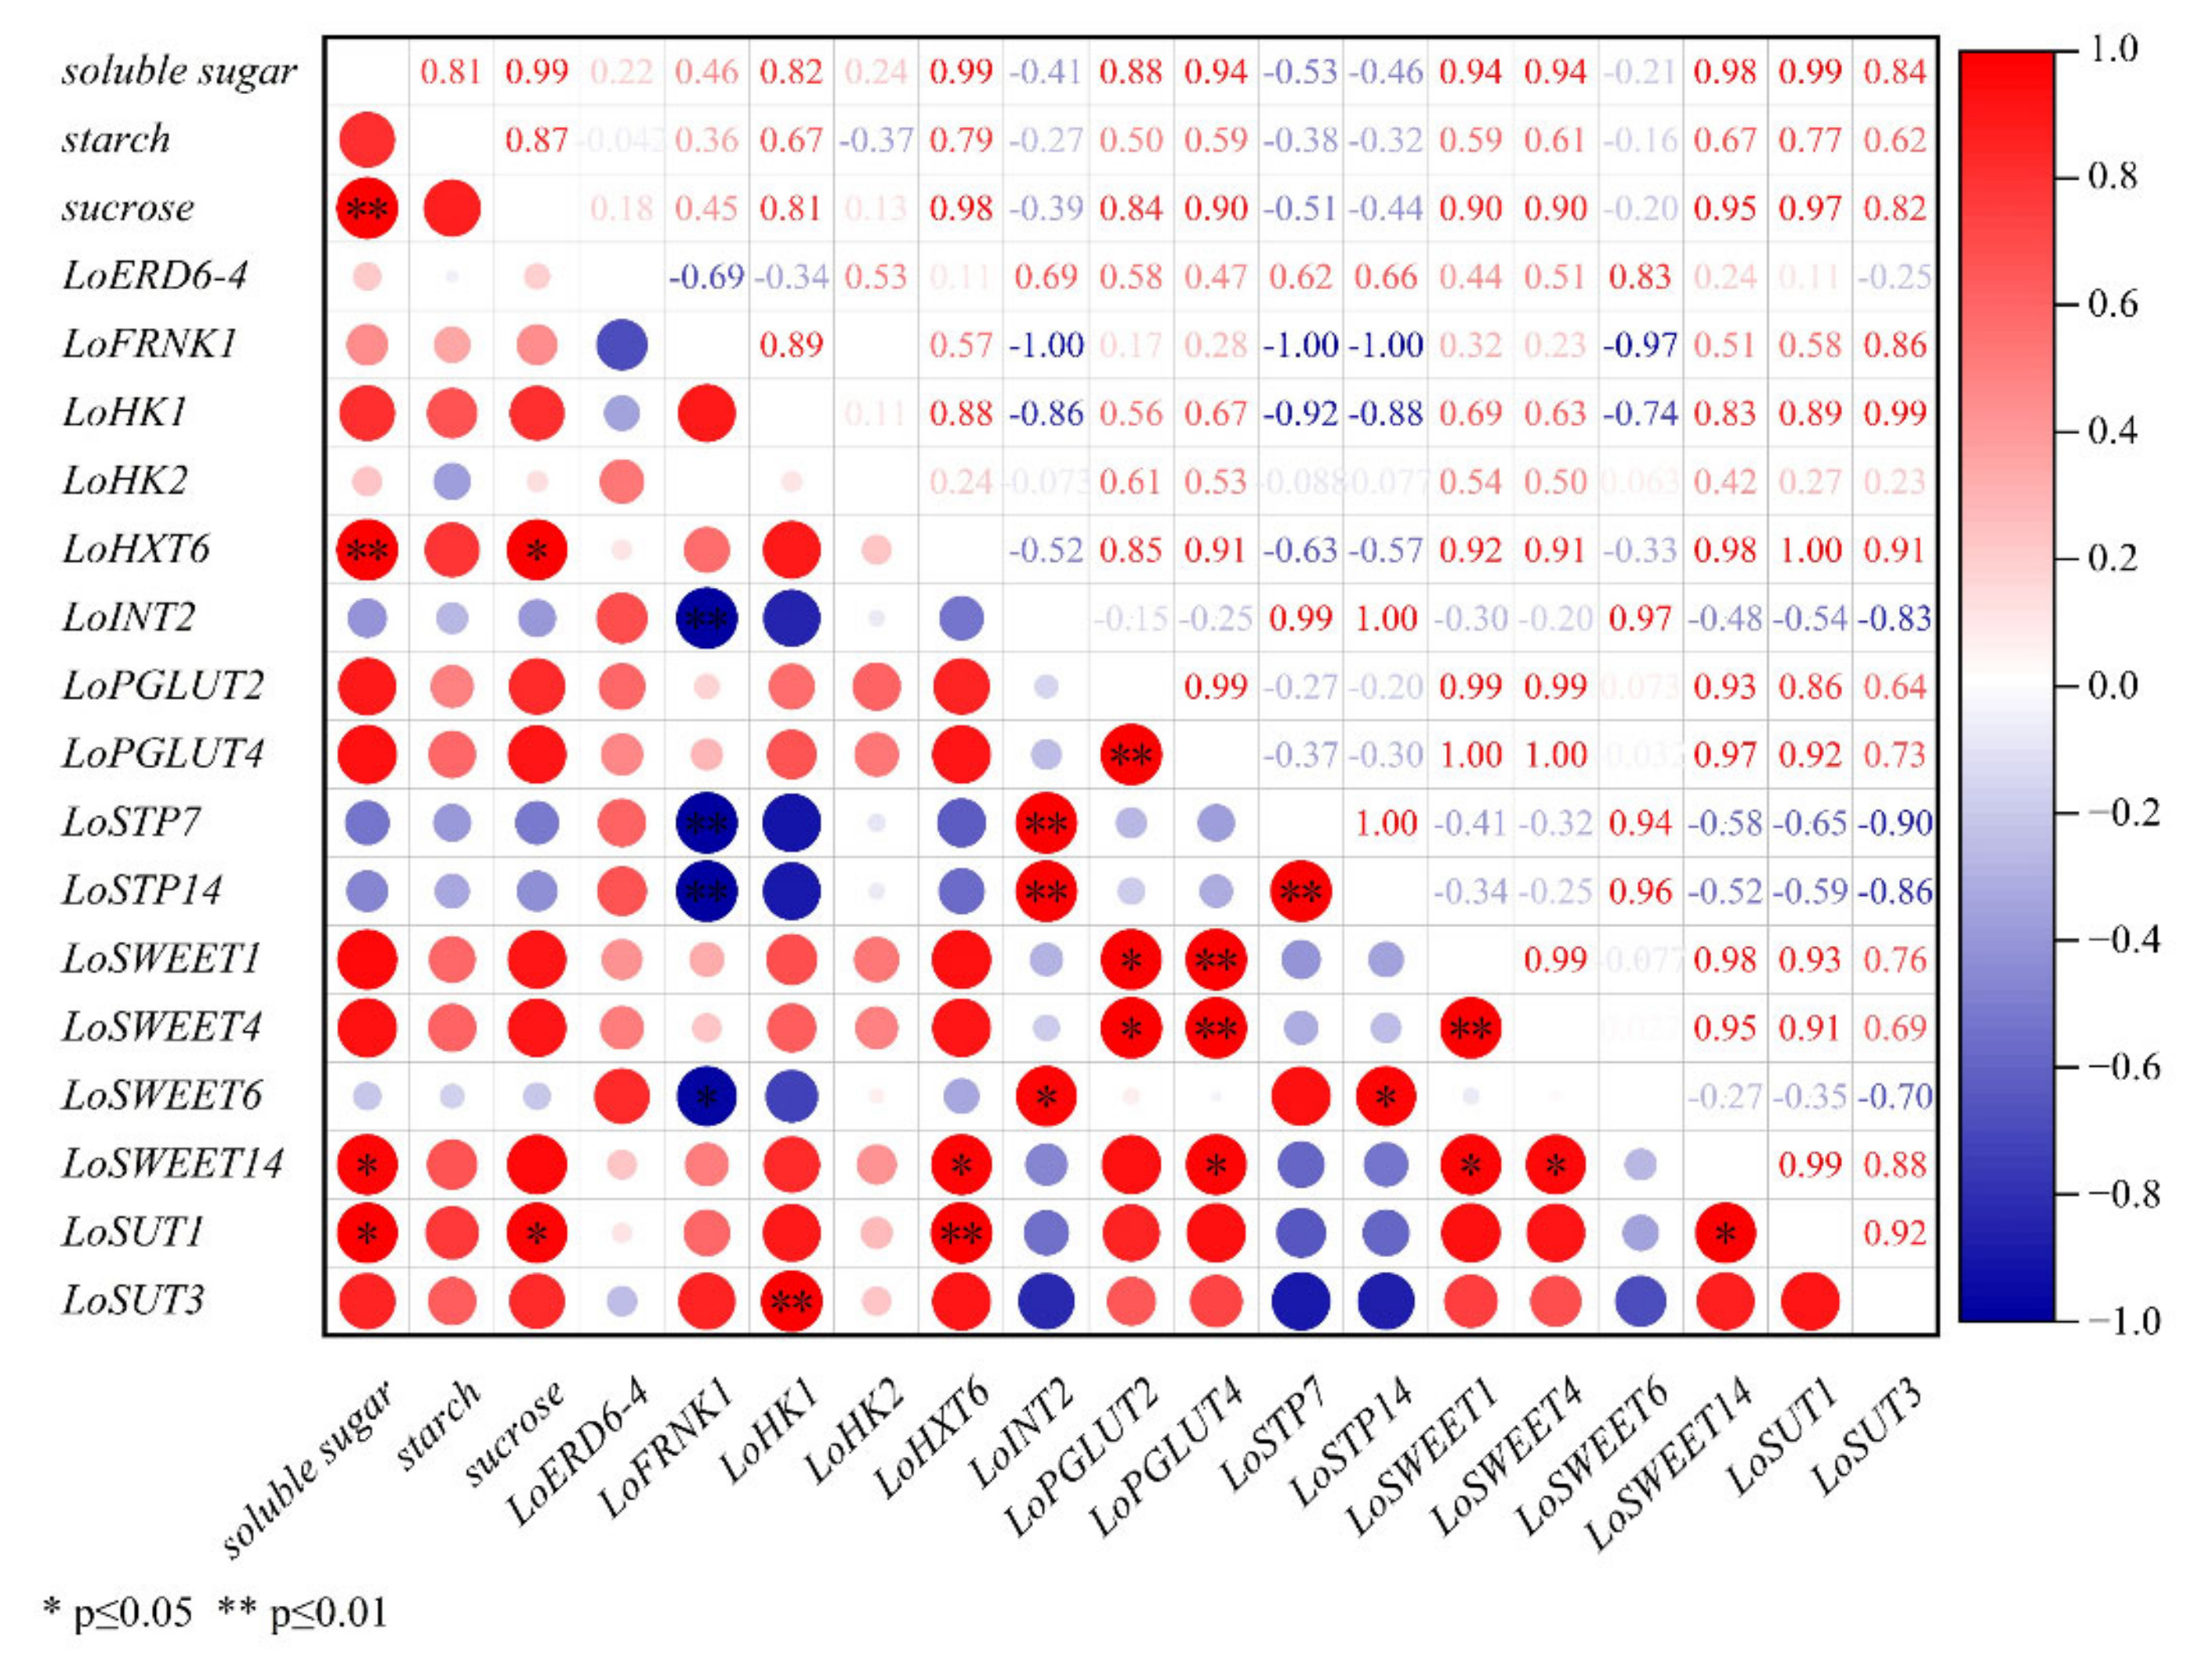
2.5. Correlation Analysis between Expression Levels of ST Genes and Carbohydrate Contents

To obtain a new insight into the relationship between ST genes and carbohydrate metabolism, the Pearson’s correlation coefficients in different organs were calculated. In bulbs (Figure 6), the expression levels LoSWEET14 had significant correlation with starch. There were also significant correlations between the expression levels of sugar transport genes, except for LoSTP7 and LoSUT1. LoSWEET1/14, LoSUT3 and LoHK1 showed significant correlations with each other, while LoHK2, LoSWEET4/6, LoFRNK1 and other MSTs showed significant correlations with each other. These findings indicated that they served as both the sink and source during growth and development in lilies, and bulbs played key roles in the accumulation and transformation of photosynthate, which required coordination between multiple genes related to carbohydrate metabolism.
In stems (Figure 7), the expression levels of LoERD6-4, LoHK2, LoPGLUT4 showed significant correlations with the concentration of soluble sugar and sucrose. LoSWEET1 showed highly significant correlation with starch concentration. In addition, the expression levels of LoHXK2, LoPGLUT4 and LoERD6-4 were significantly correlated. The transcript levels of LoSWEET6 and LoSWEET14 were significantly correlated, and LoSTP7 and LoSTP14 were also significantly correlated, indicating that these genes may be involved in carbohydrate transport in the phloem.
In leaves (Figure 8), expression levels of LoHXT6 and LoSUT1 showed significant correlation with the concentration of soluble sugar and sucrose. The transcript level of LoSWEET14 showed significant correlation with soluble sugar. The expression levels of LoHXT6, LoSWEET14 and LoSUT1 were significantly correlated. There was also significant correlation in the transcript levels of LoSWEET1, LoSWEET4 and LoPGLUT2/4. Moreover, the expression level of LoSUT3 showed a highly significant correlation with HK1. Notably, LoFRNK1 had significantly negative correlation with LoSWEET6 and highly significant negatively correlation with LoINT2 and LoSTP7/14.
According to the correlation analysis between the spatio-temporal expression of ST genes and carbohydrate content, it was shown that LoSWEET14, which was significantly correlated with the accumulation of assimilates in both bulbs and leaves and was also highly expressed in stems, was a key gene involved in the regulation of assimilate allocation and the sink–source relationship of bulbs and leaves. LoHXT6 and LoSUT1 also played important roles in the accumulation and transport of assimilates in leaves. In addition, the expression levels of LoSUT3 and LoHK1 were highly correlated in both bulbs and leaves, suggesting that they may interact with each other during lily growth and development, which deserves further research.

2.6. Eexpression Patterns of ST Genes in Response to Abiotic Stress

The expression patterns of ST genes under low temperature, drought, salt stress and ABA stress were also analyzed. Compared with the control group (0 h), all ST genes showed an upward trend within 24 h after treatment under different stresses. LoSWEET6, LoERD6-4, LoSTP7, LoPGLUT4, LoINT2 and LoHK2 responded quickly to low temperature, and their expression levels increased rapidly at 2 h while LoSWEET4, LoSUT3, LoHK1, LoFRNK1, LoSTP14, LoHXT6 and LoPGLUT2 showed significant upregulation after 12 h clod treatment (Figure 9a). Under ABA treatment, LoSWEET1 showed a tendency to accumulate mRNA content with the increase in treatment time. LoHKs and LoSUT3 exhibited a significant increase at 12 h. LoSWEET14 had a relatively high expression level from 4–24 h after treatment. The expression levels of most genes were significantly upregulated from 2 h to 6 h after treatment (Figure 9b). Under drought stress simulated by mannitol treatments, most ST genes showed significant upregulation during 6–12 h, with the exception of LoFRNK1, which upregulated significantly at 2 h after treatment and did not decrease until 12 h (Figure 9c). During the salt stress treatment, the gene expression levels of the majority fluctuated wildly. LoHXT6, LoINT2 and LoHK2 increased significantly at 2 h, then decreased and increased again at 12 h–24 h. The expression levels of LoERD6-4, LoSWEET1/6/14, LoPGLUTs, LoSTP14, LoHK1 and LoSUT3 upregulated at 4 h, decreased at 6 h and then significantly upregulated again at 12 h. LoSTP7 increased gradually with treatment times (Figure 9d).

3. Discussion

The relationship between carbohydrate metabolism in sink–source organs with plant growth and development has always been a hot research topic [10,31]. During the growth and development of lily, both the reproductive growth of bulbs underground and vegetative growth of flower aboveground are closely related to carbohydrate metabolism [5,6]. In previous studies, the growth and development stages of lily were divided based on the accumulation and consumption of carbohydrates in the bulb, which indicated the role of bulbs in sink–source organ conversion. From bulb setting stage (S1) to budding stage (S3), starch contents in bulb decreased sharply, while soluble sugar and sucrose content did not increase significantly, indicating that the starch was consumed in large quantities after being hydrolyzed. During the leaf-spread stage (S2), the sucrose content decreased significantly in bulbs (Figure 1a), while soluble sugar and starch contents in stems and leaves were the highest (Figure 1b,c). These findings were similar with previous studies that showed that starch stored in bulbs is the main energy source for leaf growth and flower bud development during early stages in which bulbs shouldered the responsibility as a source organ and starch were hydrolyzed into soluble sugar and transported upward to different tissues through the stems. From S3 to S4 stage, with the exception of starch content in stems, the contents of other carbohydrates in different organs did not change obviously. During this period, leaf development was in full swing and could produce more energy through photosynthesis so that carbohydrate consumption and the accumulation of aboveground and underground tissues were in a relatively dynamic balance. During S5 stage, with flowers withered, the carbohydrate content in leaves continued to decrease, while showing an upward trend in stems, and the starch content in bulbs also increased, which indicated that carbohydrates in the aboveground tissues began to transfer to bulbs underground, preparing for growth of the next life cycle. The changes of carbohydrate in different stages in our research were consistent with a previous study on the division of the growth stages of lilies [2,4]. However, studies before were only concentrated on carbohydrate changes in bulbs, while carbohydrate changes of both tissues aboveground and underground were analyzed in our research, which further confirmed previous studies.
In addition, during the entire process of carbohydrate metabolism and transport, the change of sucrose content was consistent with that of soluble sugar, and sucrose content accounted for the majority of soluble sugar, which illustrated that sucrose is the main form carbohydrate transport in lily [32]. It is also worth noting that the soluble sugar content in petals at S4 was the highest among all tissues and organs, and the starch and sucrose contents were also in a high level (Figure 1d). At this time, petals became a new sink tissue, which may be the reason why the starch in the stem increased suddenly in S3 stage and then decreased sharply in S4 stage (Figure 1b), which has not been mentioned before. During floral development in higher plants, with floral initiation or vegetative-to-reproductive transition, a large amount of sugar from photosynthesis was required to flow into floral buds, which became an active sink [33,34].
In this study, 16 key genes related to sugar transport and metabolism were identified, and they belonged to nine different gene families including HK, FRNK, INT, HXT, SUT, STP, SWEET, PGLUT and ERD6. All of them were sugar transport, except for HK and FRNK [35,36,37,38,39]. Phylogenetic analysis displayed that most of them had higher homology with rice (Figure 2). Thirteen ST genes were predicted to have transmembrane domains (TMDs), among which five to seven TMDs were found in the SWEET gene family, and ten to twelve TMDs were found in SUTs and MSTs (Table 1). The SWEETs were predicted to contain seven TMDs and harbored two MtN3 domains in different plant species [16,19], while LoSWEET1 had only five TMDs. Similar cases were also found in other plants. In watermelon genome, only five TMDs of ClaSWEET12 were found [40], and the same was observed with OsSWEET7a and OsSWEET7b in rice [41], and a particular SWEET protein of grape contained 14 TMDs [42]. These SWEET proteins with different TMDs may be caused by domain repetition during evolution, representing the diversity of SWEET protein transmembrane structures [43]. Similarly, the classic structure of MST proteins contains 12 TMDs [22,44], while LoPGLUT2, LoPGLUT4 and LoSTP14 were predicted to have only 10 TMDs (Table 1).
The tissue-specific expression analysis of ST genes revealed that most of them were highly expressed in stems and petals (especially in petals) (Figure 3), suggesting that these genes may play an important role in carbohydrate transport as well as reproductive development. As mentioned above, during the flowering progress of higher plants, a great amount of sugars flow into the flowers, resulting in a new and active sink organ [33,34]. Sucrose, which is the main form of sugars transported phloem, was broken down to glucose and fructose or stored in cells once imported into flowers [18]. Fructose and glucose can be phosphorylated into glucose-6-phosphate (G6P) and fructose 6-phosphate (F6P) by FRNK and HXK genes, respectively, and then provide energy for life development [9,10,45]. In this study, we also found that in addition to sugar transporter genes, the transcription levels of LoFRNK1 and LoHK2 in petals were relatively high. Studies have been carried out on the relationship between ST genes and flower development in some species such as Arabidopsis, cucumber and petunia, and it was found that the transformation and metabolism of sugar are influenced by morphological changes and can also regulate flower development in return [18,46,47,48]. However, due to the complexity of flower development and sugar transport, there are few studies on other ornamental plants. In addition, in stems, the change trend of sucrose and soluble sugar was almost the same and the content of sucrose accounted for more than half of soluble sugar content, with all the sucrose transporters (LoSUT1/3) and LoSWEETs genes showing high expression levels in stems, further indicating that sucrose was the main form sugars transported in phloem [32,49].
Moreover, correlations between expressions of ST genes and changes of carbohydrate content during growth and development in lily were performed to identity the most important genes in carbohydrate transporters. In the scales, the expression levels of LoSWEET14 were significantly correlated with the change of starch content (Figure 6). In the stems, the expression levels of LoSWEET14 were also significantly correlated with soluble sugar content (Figure 7), and the expression levels of LoHXT6, LoSUT1 showed significant correlations with the concentration of soluble sugar and sucrose, indicating that these genes may play key roles in the accumulation and allocation of carbohydrates to adjust the sink–source relationship. It was also worth noting that Figure 6, Figure 7 and Figure 8 showed there were some correlations among different sugar transporter genes, of which the expression levels of LoSUT3 and LoHK1 were highly correlated in both bulbs and leaves, suggesting that they may interact with each other during lily growth and development, which needs to be further researched by using molecular methods.
Otherwise, the function of sugar transporters in response to forms of abiotic stresses has been demonstrated in many plant species [28,50,51]. In addition to responding to abiotic stresses, ST genes are also closely associated with plant hormones. In rice, OsSWEET3a was not only a glucose transporter but also participated in plant growth through a gibberellin-mediated response [52]. The promoters of OsSWEET13 and OsSWEET15 contained ABA responsive elements [53], and the overexpression of MdSUT2 could improve the tolerance of apple and Arabidopsis to ABA stress [30]. In our research study, under low temperatures, salt and drought stress, the transcription levels of MSTs, SWEETs, FRNK and HKs in lilies were significantly changed (Figure 9). Similarly, under the treatment of plant hormone ABA, 16 genes related to sugar metabolism and transport were also significantly upregulated within 24 h of treatment. Based on these results, it is reasonable to speculate that in addition to being involved in sugar transport and distribution, sugar transporter and metabolism-related genes may also play important roles in the regulation network of plant hormones and abiotic stress.

4. Materials and Methods

4.1. Plant Cultivation and Treatments

The bulbs of oriental lily ‘Sorbonne’ were cleaned, disinfected, dried and stored at 4 °C for 4 weeks before planting. Then box planting was carried out in Beijing Forestry University greenhouse (116.3° E/40.0° N) under the conditions of 70% relative humidity, 25 °C/18 °C day/night temperature and 14 h light and 10 h dark photoperiod. For the determination of carbohydrate content, the samples were obtained at 0 day, 30 days, 48 days, 110 days and 140 days after planting, which were key stages for assimilate transportation in lily, including bulbs setting stage (S1), plant height of 30 cm with leaf-spread stage (S2), budding stage (S3), flowering stage (S4) and final flowering stage (S5), corresponding to the development stage 1–6 described before [4]. The scales of 5 stages, stem and leaves of S2–S5 stages and the petals of S4 stage were sampled. For low temperature stress, the seedlings 8 weeks after planting were cold treated at 4 °C for 24 h. For salt stress, osmotic stress and ABA stress, seedlings were irrigated with 200 mM NaCl, 200 mM mannitol and 150 µM ABA at 8 weeks after planting, respectively. The leaves of seedlings were collected at 0 h (control), 2 h, 4 h, 6 h, 12 h and 24 h immediately. All samples were quick frozen with liquid nitrogen and stored at −80 °C for further analysis, and three biological replicates were performed for each treatment.

4.2. Determination of Carbohydrate Content

The contents of carbohydrate including starch, sucrose and soluble sugar were determined by an improved sulfuric acid-anthrone colorimetric method [54]. Each experiment was performed in three replicates, and data were represented as mean ± SD.

4.3. Identification and Phylogenetic Analysis of ST Genes

All FASTAS sequences related to sugar transport in Lilium were identified from the previous transcriptomic data of our laboratory [55,56]. Sequences with full lengths of Open Reading Frame (ORF) were translated into amino acid sequences and compared with diverse plant species by using BLASTp search on the NCBI database (https://blast.ncbi.nlm.nih.gov/Blast.cgi, accessed on 10 January 2022). Only protein sequences with E-value < 1E-3 were preserved for further alignment with ST proteins of Arabidopsis thaliana and rice on TRAI (https://www.arabidopsis.org/, accessed on 10 January 2022) and RGAP (http://rice.plantbiology.msu.edu/, accessed on 10 January 2022) databases, respectively. Then, a phylogenetic tree was constructed with MEGA11.0 software according to the NJ method based on protein sequences of lily, Arabidopsis and rice. Phobius (https://phobius.sbc.su.se/, accessed on 10 January 2022) and TMHMM2.0 (https://services.healthtech.dtu.dk/service.php?TMHMM-2.0, accessed on 10 January 2022) were utilized to obtain the number of transmembrane domains (TMDs). The ProtParam tools (https://web.expasy.org/protparam/, accessed on 10 January 2022) were utilized to predict molecular weight (MW), theoretical isoelectric point (pI) and the instability index of ST proteins. The subcellular localization prediction of each gene was predicated by Plant-mPLoc (http://www.csbio.sjtu.edu.cn/bioinf/plant-multi/, accessed on 10 January 2022) and WoLF PSORT (http://www.genscript.com/psort/wolf_psort.html, accessed on 10 January 2022) [57,58].

4.4. RNA Etraction and Quantitative Real-Time PCR

The total RNAs of scales, stems, leaves and petals in different stages and stress treatments were extracted using an EASYspin Plus plant RNA rapid extraction kit (Aidlab Biotech, Beijing, China). RNA degradation and contamination were monitored on 1% agarose gels. First-strand cDNA synthesis was performed using a Prime Script II 1st strand cDNA Synthesis Kit (Takara, Shiga, Japan). qRT-PCR was performed using a Bio-Rad/CFX Connect™ Real-Time PCR Detection System (Bio-Rad, San Diego, CA, USA) with SYBR® qPCR mix (Takara, Shiga, Japan). Three independent biological replicates were used to perform gene expression analyses of all the genes. The relative expression levels were calculated by the 2△△Ct method, with TIP1 as a reference gene [59]. The primers used for qRT-PCR were designed with Primer Premier 5.0 and are shown in Supplementary Table S1. The expression heatmap of all identified ST genes was log2 transformed and normalized, and it was constructed by TBtools.

4.5. Statistical Analysis

The values of three biological replications were calculated by Mean ± SE. The correlations between expression of ST genes and carbohydrate content were measured using Pearson’s correlation coefficient and calculated by using SPSS software. A two-tail test was used to determine the significance level (p < 0.05, p < 0.01). The correlation plot was constructed using Origin 2021.

5. Conclusions

In the present study, the obvious variations of carbohydrate in aboveground and underground organs during the development of lily were observed. Carbohydrates in bulbs underwent the process of accumulation, consumption and reaccumulation so that the role of the bulb transformed between sink and source. The main task of the early underdeveloped leaves was to accumulate assimilates, while when the leaves were fully mature, with the enhancement of photosynthesis, the function of the leaves shifted to source organs, exporting organic matter for plant growth and bloom. During the flowering stage, a large amount of assimilates flowed into the flowers, and the flowers became a new transient sink organ. The expressions of genes related to sugar metabolism and transport changed while assimilates flowed among different tissues and organs. The correlation analysis between carbohydrate content and the expression levels of ST genes revealed that LoSWEET14 was significantly correlated with starch in bulbs and soluble sugar in leaves, and they were significantly highly expressed in stems, indicating that LoSWEET14 may play an important role in the accumulation of assimilates in lily bulbs and leaves and in the long-distance transport of sucrose in the phloem. In leaves, LoHXT6 and LoSUT1 were also significantly associated with soluble sugars, which may influence the process of sink–source relationships in leaves. Furthermore, the expression levels of these ST genes increased significantly under various abiotic stress conditions. In conclusion, these results lay a foundation for further research on the role of ST genes in regulating the accumulation of assimilates and distribution, altering sink–source relationships and improving resistance to abiotic stress in lilies.

Supplementary Materials

The following supporting information can be downloaded at: https://www.mdpi.com/article/10.3390/ijms23084319/s1.

Author Contributions

Z.Z. and T.L. conceptualized and designed the experiment; Z.Z., T.L., X.J. and Y.C. performed the laboratory experiments and statistical analysis; Z.Z. and T.L. wrote the original draft, and X.J. revised the manuscript; Y.L. funding acquisition and supervision. All authors have read and agreed to the published version of the manuscript.

Funding

This work was supported by the China National Natural Science Foundation (grant number 31872138, 31672190, 31071815 and 31272204).

Institutional Review Board Statement

Not applicable.

Conflicts of Interest

The authors declare no conflict of interest. The funders had no role in the design of the study; in the collection, analyses, or interpretation of data; in the writing of the manuscript; or in the decision to publish the results.

Abbreviations

The BLASTBasic local alignment search tool
NCBINational Center for Biotechnology Information
qRT-PCRReal-time quantitative reverse transcription polymerase chain reaction
ABAAbscisic acid
TMDsTransmembrane domains MFS major facilitator

References

  1. Liu, X.; Yang, G. Adventitious shoot regeneration of oriental lily (Lilium orientalis) and genetic stability evaluation based on ISSR marker variation. In Vitro Cell. Dev. Biol. Plant 2012, 48, 172–179. [Google Scholar] [CrossRef]
  2. Langens-Gerrits, M.M.; Miller, W.B.M.; Croes, A.F.; de Klerk, G.-J. Effect of low temperature on dormancy breaking and growth after planting in lily bulblets regenerated in vitro. Plant Growth Regul. 2003, 40, 267–275. [Google Scholar] [CrossRef]
  3. Chang, L.; Xiao, Y.M.; She, L.F.; Xia, Y.P. Analysis of gene expression and enzyme activities related to starch metabolism in Lycoris sprengeri bulbs of different sizes. Sci. Hortic. 2013, 161, 118–124. [Google Scholar] [CrossRef]
  4. Wu, S.-S.; Wu, J.-D.; Jiao, X.-H.; Zhang, Q.-X.; Lv, Y.-M. The Dynamics of Changes in Starch and Lipid Droplets and Sub-Cellular Localization of β-Amylase During the Growth of Lily Bulbs. J. Integr. Agric. 2012, 11, 585–592. [Google Scholar] [CrossRef]
  5. Zheng, R.R.; Wu, Y.; Xia, Y.P. Chlorocholine chloride and paclobutrazol treatments promote carbohydrate accumulation in bulbs of Lilium Oriental hybrids ‘Sorbonne’. J. Zhejiang Univ. Sci. B 2012, 13, 136–144. [Google Scholar] [CrossRef] [Green Version]
  6. Wu, Y.; Ren, Z.; Gao, C.; Sun, M.; Li, S.; Min, R.; Wu, J.; Li, D.; Wang, X.; Wei, Y.; et al. Change in Sucrose Cleavage Pattern and Rapid Starch Accumulation Govern Lily Shoot-to-Bulblet Transition in vitro. Front. Plant Sci. 2020, 11, 564713. [Google Scholar] [CrossRef]
  7. Liu, D.D.; Chao, W.M.; Turgeon, R. Transport of sucrose, not hexose, in the phloem. J. Exp. Bot. 2012, 63, 4315–4320. [Google Scholar] [CrossRef] [Green Version]
  8. LE, W.; Lemoine, R.; Sauer, N. Sugar transporters in higher plants—A diversity of roles and complex regulation. Trends Plant Sci. 2000, 5, 283–290. [Google Scholar]
  9. Rolland, F.; Baena-Gonzalez, E.; Sheen, J. Sugar sensing and signaling in plants: Conserved and novel mechanisms. Annu. Rev. Plant Biol. 2006, 57, 675–709. [Google Scholar] [CrossRef] [Green Version]
  10. Li, X.; Wang, C.; Cheng, J.; Zhang, J.; da Silva, J.A.; Liu, X.; Duan, X.; Li, T.; Sun, H. Transcriptome analysis of carbohydrate metabolism during bulblet formation and development in Lilium davidii var. unicolor. BMC Plant Biol. 2014, 14, 358. [Google Scholar] [CrossRef] [Green Version]
  11. Julius, B.T.; Leach, K.A.; Tran, T.M.; Mertz, R.A.; Braun, D.M. Sugar Transporters in Plants: New Insights and Discoveries. Plant Cell Physiol. 2017, 58, 1442–1460. [Google Scholar] [CrossRef] [Green Version]
  12. Li, J.M.; Zheng, D.M.; Li, L.T.; Qiao, X.; Wei, S.W.; Bai, B.; Zhang, S.L.; Wu, J. Genome-Wide Function, Evolutionary Characterization and Expression Analysis of Sugar Transporter Family Genes in Pear (Pyrus bretschneideri Rehd). Plant Cell Physiol. 2015, 56, 1721–1737. [Google Scholar] [CrossRef] [Green Version]
  13. Buttner, M. The Arabidopsis sugar transporter (AtSTP) family: An update. Plant Biol. 2010, 12 (Suppl. S1), 35–41. [Google Scholar] [CrossRef]
  14. Buttner, M. The monosaccharide transporter(-like) gene family in Arabidopsis. FEBS Lett. 2007, 581, 2318–2324. [Google Scholar] [CrossRef] [Green Version]
  15. Gong, X.; Liu, M.; Zhang, L.; Ruan, Y.; Ding, R.; Ji, Y.; Zhang, N.; Zhang, S.; Farmer, J.; Wang, C. Arabidopsis AtSUC2 and AtSUC4, encoding sucrose transporters, are required for abiotic stress tolerance in an ABA-dependent pathway. Physiol. Plant 2015, 153, 119–136. [Google Scholar] [CrossRef]
  16. Feng, L.; Frommer, W.B. Structure and function of SemiSWEET and SWEET sugar transporters. Trends Biochem. Sci. 2015, 40, 480–486. [Google Scholar] [CrossRef] [Green Version]
  17. Reinders, A.; Sivitz, A.B.; Ward, J.M. Evolution of plant sucrose uptake transporters. Front. Plant Sci. 2012, 3, 22. [Google Scholar] [CrossRef] [Green Version]
  18. Iftikhar, J.; Lyu, M.; Liu, Z.; Mehmood, N.; Munir, N.; Ahmed, M.A.A.; Batool, W.; Aslam, M.M.; Yuan, Y.; Wu, B. Sugar and Hormone Dynamics and the Expression Profiles of SUT/SUC and SWEET Sweet Sugar Transporters during Flower Development in Petunia axillaris. Plants 2020, 9, 1770. [Google Scholar] [CrossRef]
  19. Chen, L.Q.; Hou, B.H.; Lalonde, S.; Takanaga, H.; Hartung, M.L.; Qu, X.Q.; Guo, W.J.; Kim, J.G.; Underwood, W.; Chaudhuri, B.; et al. Sugar transporters for intercellular exchange and nutrition of pathogens. Nature 2010, 468, 527–532. [Google Scholar] [CrossRef] [Green Version]
  20. Chen, L.Q. SWEET sugar transporters for phloem transport and pathogen nutrition. New Phytol. 2014, 201, 1150–1155. [Google Scholar] [CrossRef]
  21. Afoufa-Bastien, D.; Medici, A.; Jeauffre, J.; Coutos-Thévenot, P.; Lemoine, R.; Atanassova, R.; Laloi1, M. The Vitis vinifera sugar transporter gene family: Phylogenetic overview and macroarray expression profiling. BMC Plant Biol. 2010, 10, 245. [Google Scholar] [CrossRef] [Green Version]
  22. Reuscher, S.; Akiyama, M.; Yasuda, T.; Makino, H.; Aoki, K.; Shibata, D.; Shiratake, K. The sugar transporter inventory of tomato: Genome-wide identification and expression analysis. Plant Cell Physiol. 2014, 55, 1123–1141. [Google Scholar] [CrossRef] [Green Version]
  23. Aslam, M.M.; Deng, L.; Wang, X.; Wang, Y.; Pan, L.; Liu, H.; Niu, L.; Lu, Z.; Cui, G.; Zeng, W.; et al. Expression patterns of genes involved in sugar metabolism and accumulation during peach fruit development and ripening. Sci. Hortic. 2019, 257, 108633. [Google Scholar] [CrossRef]
  24. Iqbal, S.; Ni, X.; Bilal, M.S.; Shi, T.; Khalil-Ur-Rehman, M.; Zhenpeng, P.; Jie, G.; Usman, M.; Gao, Z. Identification and expression profiling of sugar transporter genes during sugar accumulation at different stages of fruit development in apricot. Gene 2020, 742, 144584. [Google Scholar] [CrossRef]
  25. Kumawat, S.; Sharma, Y.; Vats, S.; Sudhakaran, S.; Sharma, S.; Mandlik, R.; Raturi, G.; Kumar, V.; Rana, N.; Kumar, A.; et al. Understanding the role of SWEET genes in fruit development and abiotic stress in pomegranate (Punica granatum L.). Mol. Biol. Rep. 2021, 49, 1329–1339. [Google Scholar] [CrossRef]
  26. Chen, L.Q.; Cheung, L.S.; Feng, L.; Tanner, W.; Frommer, W.B. Transport of sugars. Annu. Rev. Biochem. 2015, 84, 865–894. [Google Scholar] [CrossRef]
  27. Ruan, Y.L. Sucrose metabolism: Gateway to diverse carbon use and sugar signaling. Annu. Rev. Plant Biol. 2014, 65, 33–67. [Google Scholar] [CrossRef]
  28. Yamada, K.; Osakabe, Y.; Mizoi, J.; Nakashima, K.; Fujita, Y.; Shinozaki, K.; Yamaguchi-Shinozaki, K. Functional analysis of an Arabidopsis thaliana abiotic stress-inducible facilitated diffusion transporter for monosaccharides. J. Biol. Chem. 2010, 285, 1138–1146. [Google Scholar] [CrossRef] [Green Version]
  29. Sambe, M.A.; He, X.; Tu, Q.; Guo, Z. A cold-induced myo-inositol transporter-like gene confers tolerance to multiple abiotic stresses in transgenic tobacco plants. Physiol. Plant 2015, 153, 355–364. [Google Scholar] [CrossRef]
  30. Ma, Q.J.; Sun, M.H.; Liu, Y.J.; Lu, J.; Hu, D.G.; Hao, Y.J. Molecular cloning and functional characterization of the apple sucrose transporter gene MdSUT2. Plant Physiol. Biochem. 2016, 109, 442–451. [Google Scholar] [CrossRef]
  31. Fernie, A.R.; Bachem, C.W.B.; Helariutta, Y.; Neuhaus, H.E.; Prat, S.; Ruan, Y.L.; Stitt, M.; Sweetlove, L.J.; Tegeder, M.; Wahl, V.; et al. Synchronization of developmental, molecular and metabolic aspects of source-sink interactions. Nat. Plants 2020, 6, 55–66. [Google Scholar] [CrossRef] [PubMed]
  32. Hong-mei, S.; Tian-lai, L.; Yun-fei, L. Physiology Mechanism of Metabolisms in the Middle Scales of Lilium davidii var. unicolor Bulbs Stored at Low Temperature for Dormancy-Release. Agric. Sci. China 2005, 7, 521–527. [Google Scholar]
  33. Eveland, A.L.; Jackson, D.P. Sugars, signalling, and plant development. J. Exp. Bot. 2012, 63, 3367–3377. [Google Scholar] [CrossRef] [PubMed] [Green Version]
  34. Matsoukas, I.G. Interplay between sugar and hormone signaling pathways modulate floral signal transduction. Front. Genet. 2014, 5, 218. [Google Scholar] [CrossRef] [Green Version]
  35. Hu, Z.; Tang, Z.; Zhang, Y.; Niu, L.; Yang, F.; Zhang, D.; Hu, Y. Rice SUT and SWEET Transporters. Int. J. Mol. Sci. 2021, 22, 11198. [Google Scholar] [CrossRef]
  36. Johnson, D.A.; Thomas, M.A. The monosaccharide transporter gene family in Arabidopsis and rice: A history of duplications, adaptive evolution, and functional divergence. Mol. Biol. Evol. 2007, 24, 2412–2423. [Google Scholar] [CrossRef]
  37. Karve, A.; Rauh, B.L.; Xia, X.; Kandasamy, M.; Meagher, R.B.; Sheen, J.; Moore, B.D. Expression and evolutionary features of the hexokinase gene family in Arabidopsis. Planta 2008, 228, 411–425. [Google Scholar] [CrossRef] [Green Version]
  38. He, L.; Zhang, S.; Qiu, Z.; Zhao, J.; Nie, W.; Lin, H.; Zhu, Z.; Zeng, D.; Qian, Q.; Zhu, L. Fructokinase-Like Protein 1 interacts with TRXz to regulate chloroplast development in rice. J. Integr. Plant Biol. 2018, 60, 94–111. [Google Scholar] [CrossRef] [Green Version]
  39. Riggs, J.W.; Cavales, P.C.; Chapiro, S.M.; Callis, J. Identification and biochemical characterization of the fructokinase gene family in Arabidopsis thaliana. BMC Plant Biol. 2017, 17, 83. [Google Scholar] [CrossRef] [Green Version]
  40. Xuan, C.; Lan, G.; Si, F.; Zeng, Z.; Wang, C.; Yadav, V.; Wei, C.; Zhang, X. Systematic Genome-Wide Study and Expression Analysis of SWEET Gene Family: Sugar Transporter Family Contributes to Biotic and Abiotic Stimuli in Watermelon. Int. J. Mol. Sci. 2021, 22, 8407. [Google Scholar] [CrossRef]
  41. Yuan, M.; Wang, S. Rice MtN3/saliva/SWEET family genes and their homologs in cellular organisms. Mol. Plant 2013, 6, 665–674. [Google Scholar] [CrossRef] [Green Version]
  42. Patil, G.; Valliyodan, B.; Deshmukh, R.; Prince, S.; Nicander, B.; Zhao, M.; Sonah, H.; Song, L.; Lin, L.; Chaudhary, J.; et al. Soybean (Glycine max) SWEET gene family: Insights through comparative genomics, transcriptome profiling and whole genome re-sequence analysis. BMC Genom. 2015, 16, 520. [Google Scholar] [CrossRef] [Green Version]
  43. Jia, B.; Zhu, X.F.; Pu, Z.J.; Duan, Y.X.; Hao, L.J.; Zhang, J.; Chen, L.Q.; Jeon, C.O.; Xuan, Y.H. Integrative View of the Diversity and Evolution of SWEET and SemiSWEET Sugar Transporters. Front. Plant Sci. 2017, 8, 2178. [Google Scholar] [CrossRef] [Green Version]
  44. Reddy, V.S.; Shlykov, M.A.; Castillo, R.; Sun, E.I.; Saier, M.H., Jr. The Major Facilitator Superfamily (MFS) Revisited. FEBS J. 2012, 279, 2022–2035. [Google Scholar] [CrossRef]
  45. Borghi, M.; Fernie, A.R. Floral Metabolism of Sugars and Amino Acids: Implications for Pollinators’ Preferences and Seed and Fruit Set. Plant Physiol. 2017, 175, 1510–1524. [Google Scholar] [CrossRef] [Green Version]
  46. Sun, L.; Sui, X.; Lucas, W.J.; Li, Y.; Feng, S.; Ma, S.; Fan, J.; Gao, L.; Zhang, Z. Down-regulation of the Sucrose Transporter CsSUT1 Causes Male Sterility by Altering Carbohydrate Supply. Plant Physiol. 2019, 180, 986–997. [Google Scholar] [CrossRef] [Green Version]
  47. Lin, I.W.; Sosso, D.; Chen, L.Q.; Gase, K.; Kim, S.G.; Kessler, D.; Klinkenberg, P.M.; Gorder, M.K.; Hou, B.H.; Qu, X.Q.; et al. Nectar secretion requires sucrose phosphate synthases and the sugar transporter SWEET9. Nature 2014, 508, 546–549. [Google Scholar] [CrossRef]
  48. Nativ, N.; Hacham, Y.; Hershenhorn, J.; Dor, E.; Amir, R. Metabolic Investigation of Phelipanche aegyptiaca Reveals Significant Changes during Developmental Stages and in Its Different Organs. Front. Plant Sci. 2017, 8, 491. [Google Scholar] [CrossRef] [Green Version]
  49. Doidy, J.; Vidal, U.; Lemoine, R. Sugar transporters in Fabaceae, featuring SUT MST and SWEET families of the model plant Medicago truncatula and the agricultural crop Pisum sativum. PLoS ONE 2019, 14, e0223173. [Google Scholar] [CrossRef] [Green Version]
  50. Qin, J.-X.; Jiang, Y.-J.; Lu, Y.-Z.; Zhao, P.; Wu, B.-J.; Li, H.-X.; Wang, Y.; Xu, S.-B.; Sun, Q.-X.; Liu, Z.-S. Genome-wide identification and transcriptome profiling reveal great expansion of SWEET gene family and their wide-spread responses to abiotic stress in wheat (Triticum aestivum L.). J. Integr. Agric. 2020, 19, 1704–1720. [Google Scholar] [CrossRef]
  51. Miao, H.; Sun, P.; Liu, Q.; Miao, Y.; Liu, J.; Zhang, K.; Hu, W.; Zhang, J.; Wang, J.; Wang, Z.; et al. Genome-wide analyses of SWEET family proteins reveal involvement in fruit development and abiotic/biotic stress responses in banana. Sci. Rep. 2017, 7, 3536. [Google Scholar] [CrossRef] [Green Version]
  52. Morii, M.; Sugihara, A.; Takehara, S.; Kanno, Y.; Kawai, K.; Hobo, T.; Hattori, M.; Yoshimura, H.; Seo, M.; Ueguchi-Tanaka, M. The Dual Function of OsSWEET3a as a Gibberellin and Glucose Transporter Is Important for Young Shoot Development in Rice. Plant Cell Physiol. 2020, 61, 1935–1945. [Google Scholar] [CrossRef]
  53. Mathan, J.; Singh, A.; Ranjan, A. Sucrose transport in response to drought and salt stress involves ABA-mediated induction of OsSWEET13 and OsSWEET15 in rice. Physiol. Plant 2021, 171, 620–637. [Google Scholar] [CrossRef]
  54. Wu, Y.; Sun, M.; Zhang, J.; Zhang, L.; Ren, Z.; Min, R.; Wang, X.; Xia, Y. Differential Effects of Paclobutrazol on the Bulblet Growth of Oriental Lily Cultured In Vitro: Growth Behavior, Carbohydrate Metabolism, and Antioxidant Capacity. J. Plant Growth Regul. 2018, 38, 359–372. [Google Scholar] [CrossRef]
  55. Lu, X.H.; Huang, J.; Wang, J.M.; Lu, Y.M. RNA-Seq analysis reveals genetic bases of the flowering process in oriental hybrid lily cv. Sorbonne. Russ. J. Plant Physiol. 2014, 48, 523–544. [Google Scholar]
  56. Wang, J.; Wang, Q.; Yang, Y.; Liu, X.; Gu, J.; Li, W.; Ma, S.; Lu, Y. De Novo assembly and characterization of stress transcriptome and regulatory networks under temperature, salt and hormone stresses in Lilium lancifolium. Mol. Biol. Rep. 2014, 41, 8231–8245. [Google Scholar] [CrossRef]
  57. Gu, J.; Zeng, Z.; Wang, Y.; Lyu, Y. Transcriptome Analysis of Carbohydrate Metabolism Genes and Molecular Regulation of Sucrose Transport Gene LoSUT on the Flowering Process of Developing Oriental Hybrid Lily ‘Sorbonne’ Bulb. Int. J. Mol. Sci. 2020, 21, 3092. [Google Scholar] [CrossRef]
  58. Zhang, Y.; Zeng, Z.; Yong, Y.; Lyu, Y. Hormonal Regulatory Patterns of LaKNOXs and LaBEL1 Transcription Factors Reveal Their Potential Role in Stem Bulblet Formation in LA Hybrid Lily. Int. J. Mol. Sci. 2021, 22, 13502. [Google Scholar] [CrossRef]
  59. Yong, Y.B.; Li, W.Q.; Wang, J.M.; Zhang, Y.; Lu, Y.M. Identification of gene co-expression networks involved in cold resistance of Lilium lancifolium. Biol. Plant. 2018, 62, 287–298. [Google Scholar] [CrossRef]
Figure 1. Soluble sugar, starch and sucrose contents (mg/g) in different tissues at different development stages in lilies. Each value indicates Mean ± SE (standard error). (a) Carbohydrate contents in bulbs. (b) Carbohydrate contents in stems. (c) Carbohydrate contents in leaves. (d) Carbohydrate contents in different tissues at S4 stage.
Ijms 23 04319 g001
Figure 2. The phylogenetic relationship of ST genes in Arabidopsis (red), rice (blue) and lily (green).
Ijms 23 04319 g002
Figure 3. Tissue-specific expression of ST genes in lily. The color scale is displayed on the right side, and the color from red to blue indicates the pression level from high to low.
Ijms 23 04319 g003
Figure 4. Expression heatmap of ST genes during sugar transport in lily in different tissues. (a) Expression heatmap in bulb. (b) Expression heatmap in stem. (c) Expression heatmap in leaf.
Ijms 23 04319 g004
Figure 5. A hypothetical model on the molecular regulation of the allocation and transport of assimilates in lily during flowering.
Ijms 23 04319 g005
Figure 6. Correlation plot between sugar content and expression levels of ST genes during the assimilates transport in bulbs. The figures in the upper triangular indicates correlation values, which determines the size of the circle in corresponding position in the lower triangular. Blue indicates positive correlations while red indicates negative and the color scale is on the right side. * Significant at 0.05 probability level. ** Highly significant at 0.01 probability level.
Ijms 23 04319 g006
Figure 7. Correlation plot between sugar content and expression levels of ST genes during the assimilates transport in stems.
Ijms 23 04319 g007
Figure 8. Correlation plot between sugar content and expression levels of ST genes during assimilates transport in leaves.
Ijms 23 04319 g008
Figure 9. Expression heatmap of ST genes after cold (a), ABA (b), mannitol (c) and NaCl (d) treatments in leaf.
Ijms 23 04319 g009
Table 1. Characterization of sugar transporter and metabolism genes in lily.
Gene IDNameCDS (bp)Protein Length (aa)TMDspIInstability IndexMolecular Weight (kDa)Subcellular Localization
Isoform0001530LoERD6-41488495129.1540.07/N53.38PM
Isoform0001773LoSUT11495497129.233.71/S53.17PM
Isoform0002195LoHK2148249305.7641.1/N53.05Chlo
Isoform0003167LoHK1150350006.3433.93/S54.05Chlo
Isoform0003989LoHXT61497498129.1638.99/S54.2PM
Isoform0008566LoSWEET1483727878.4924.01/S31.37PM
Isoform0008671LoFRNK199933205.2127.58/S35.82Cy
Isoform0012368LoSWEET477725879.2638.49/S28.64PM
Isoform0012812LoSWEET670523478.940.91/N25.97PM
Isoform0015959LoSWEET163320659.4134.47/S22.82PM
Isoform0031035LoINT21728575128.9140.22/N62.75PM
Isoform0031287LoSTP71524507129.3736.62/S55.24PM
Isoform0031586LoPGLUT41605534109.3135.66/S56.31PM
Isoform0031646LoSUT31773590126.8634.39/S63.32PM
Isoform0031860LoSTP141533510108.0441.18/N55.96PM
Isoform0031918LoPGLUT21521506108.2941.12/N54.43PM
CDS: the coding domain sequences; TMDs: transmembrane domains; pI: theoretical isoelectric point; N/S: unstable protein with instability index higher than 40/stable protein with instability index lower than 40; PM: plasma membrane; Chlo: chloroplast; Cy: cytoplasmic.
Publisher’s Note: MDPI stays neutral with regard to jurisdictional claims in published maps and institutional affiliations.

