
Direct T-2 Toxicity on Human Skin—Fibroblast Hs68 Cell Line—In Vitro Study

 , , and
Abstract
:1. Introduction
2. Results
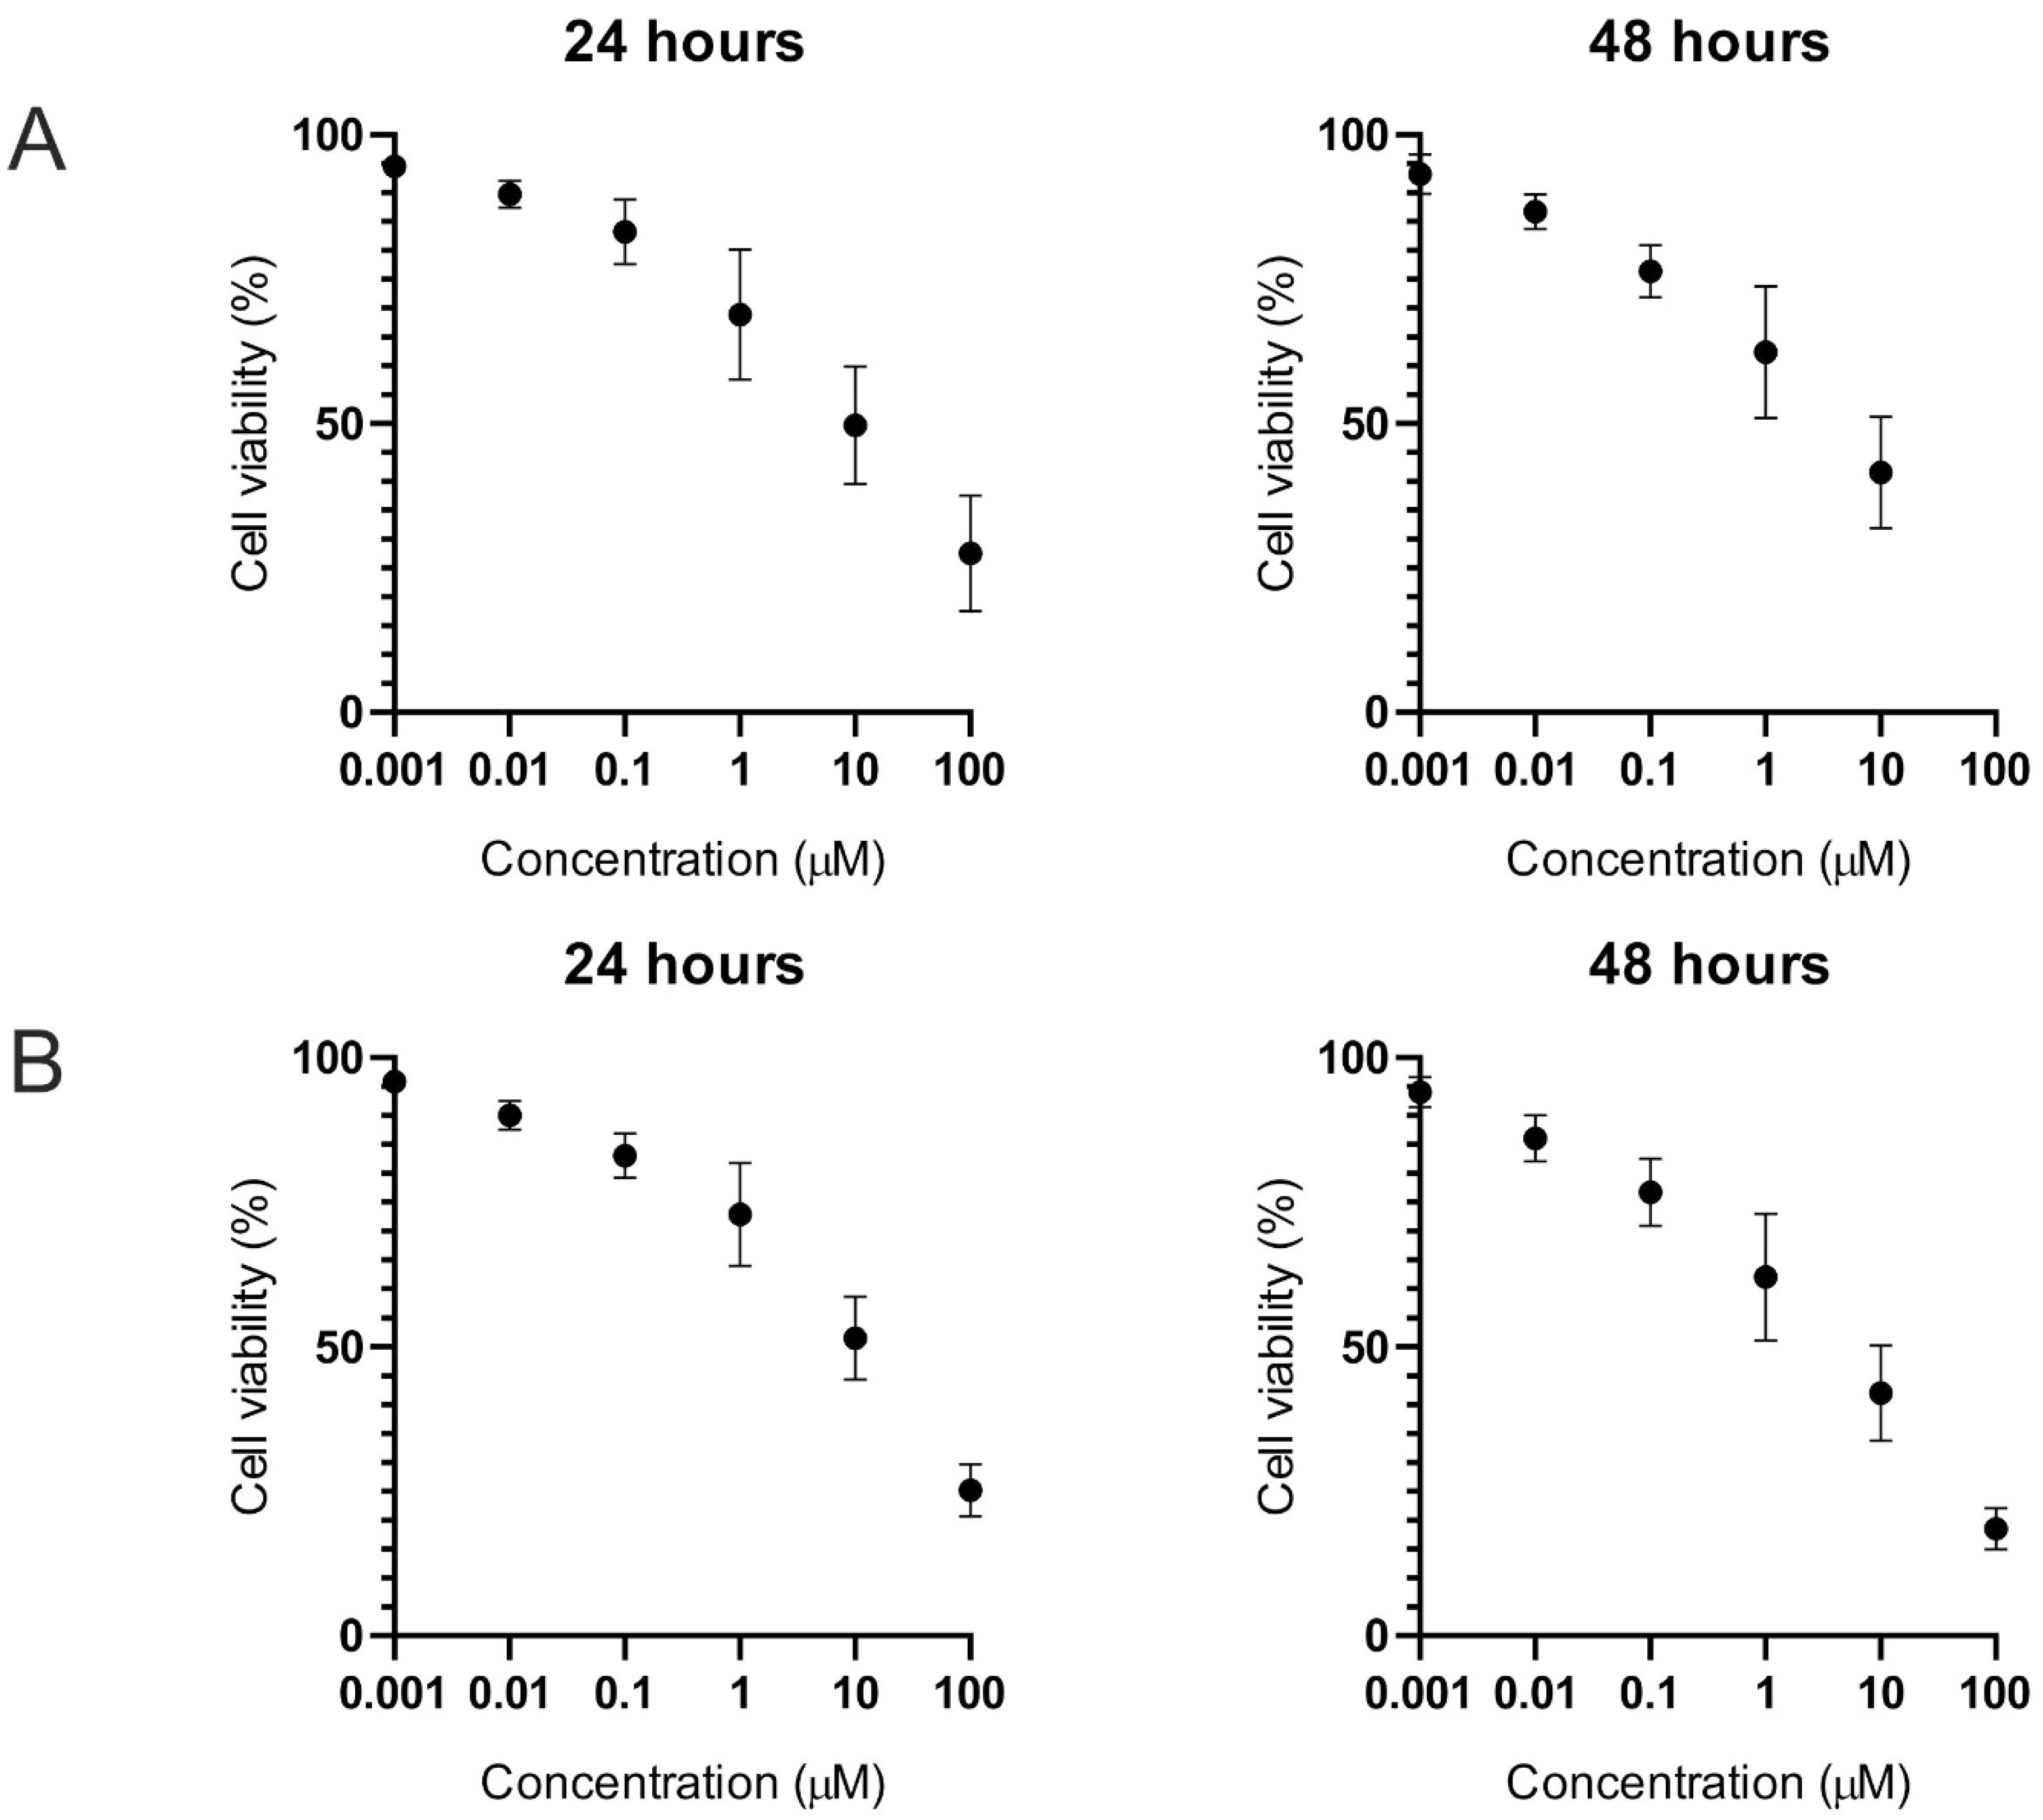
2.1. Cell Viability
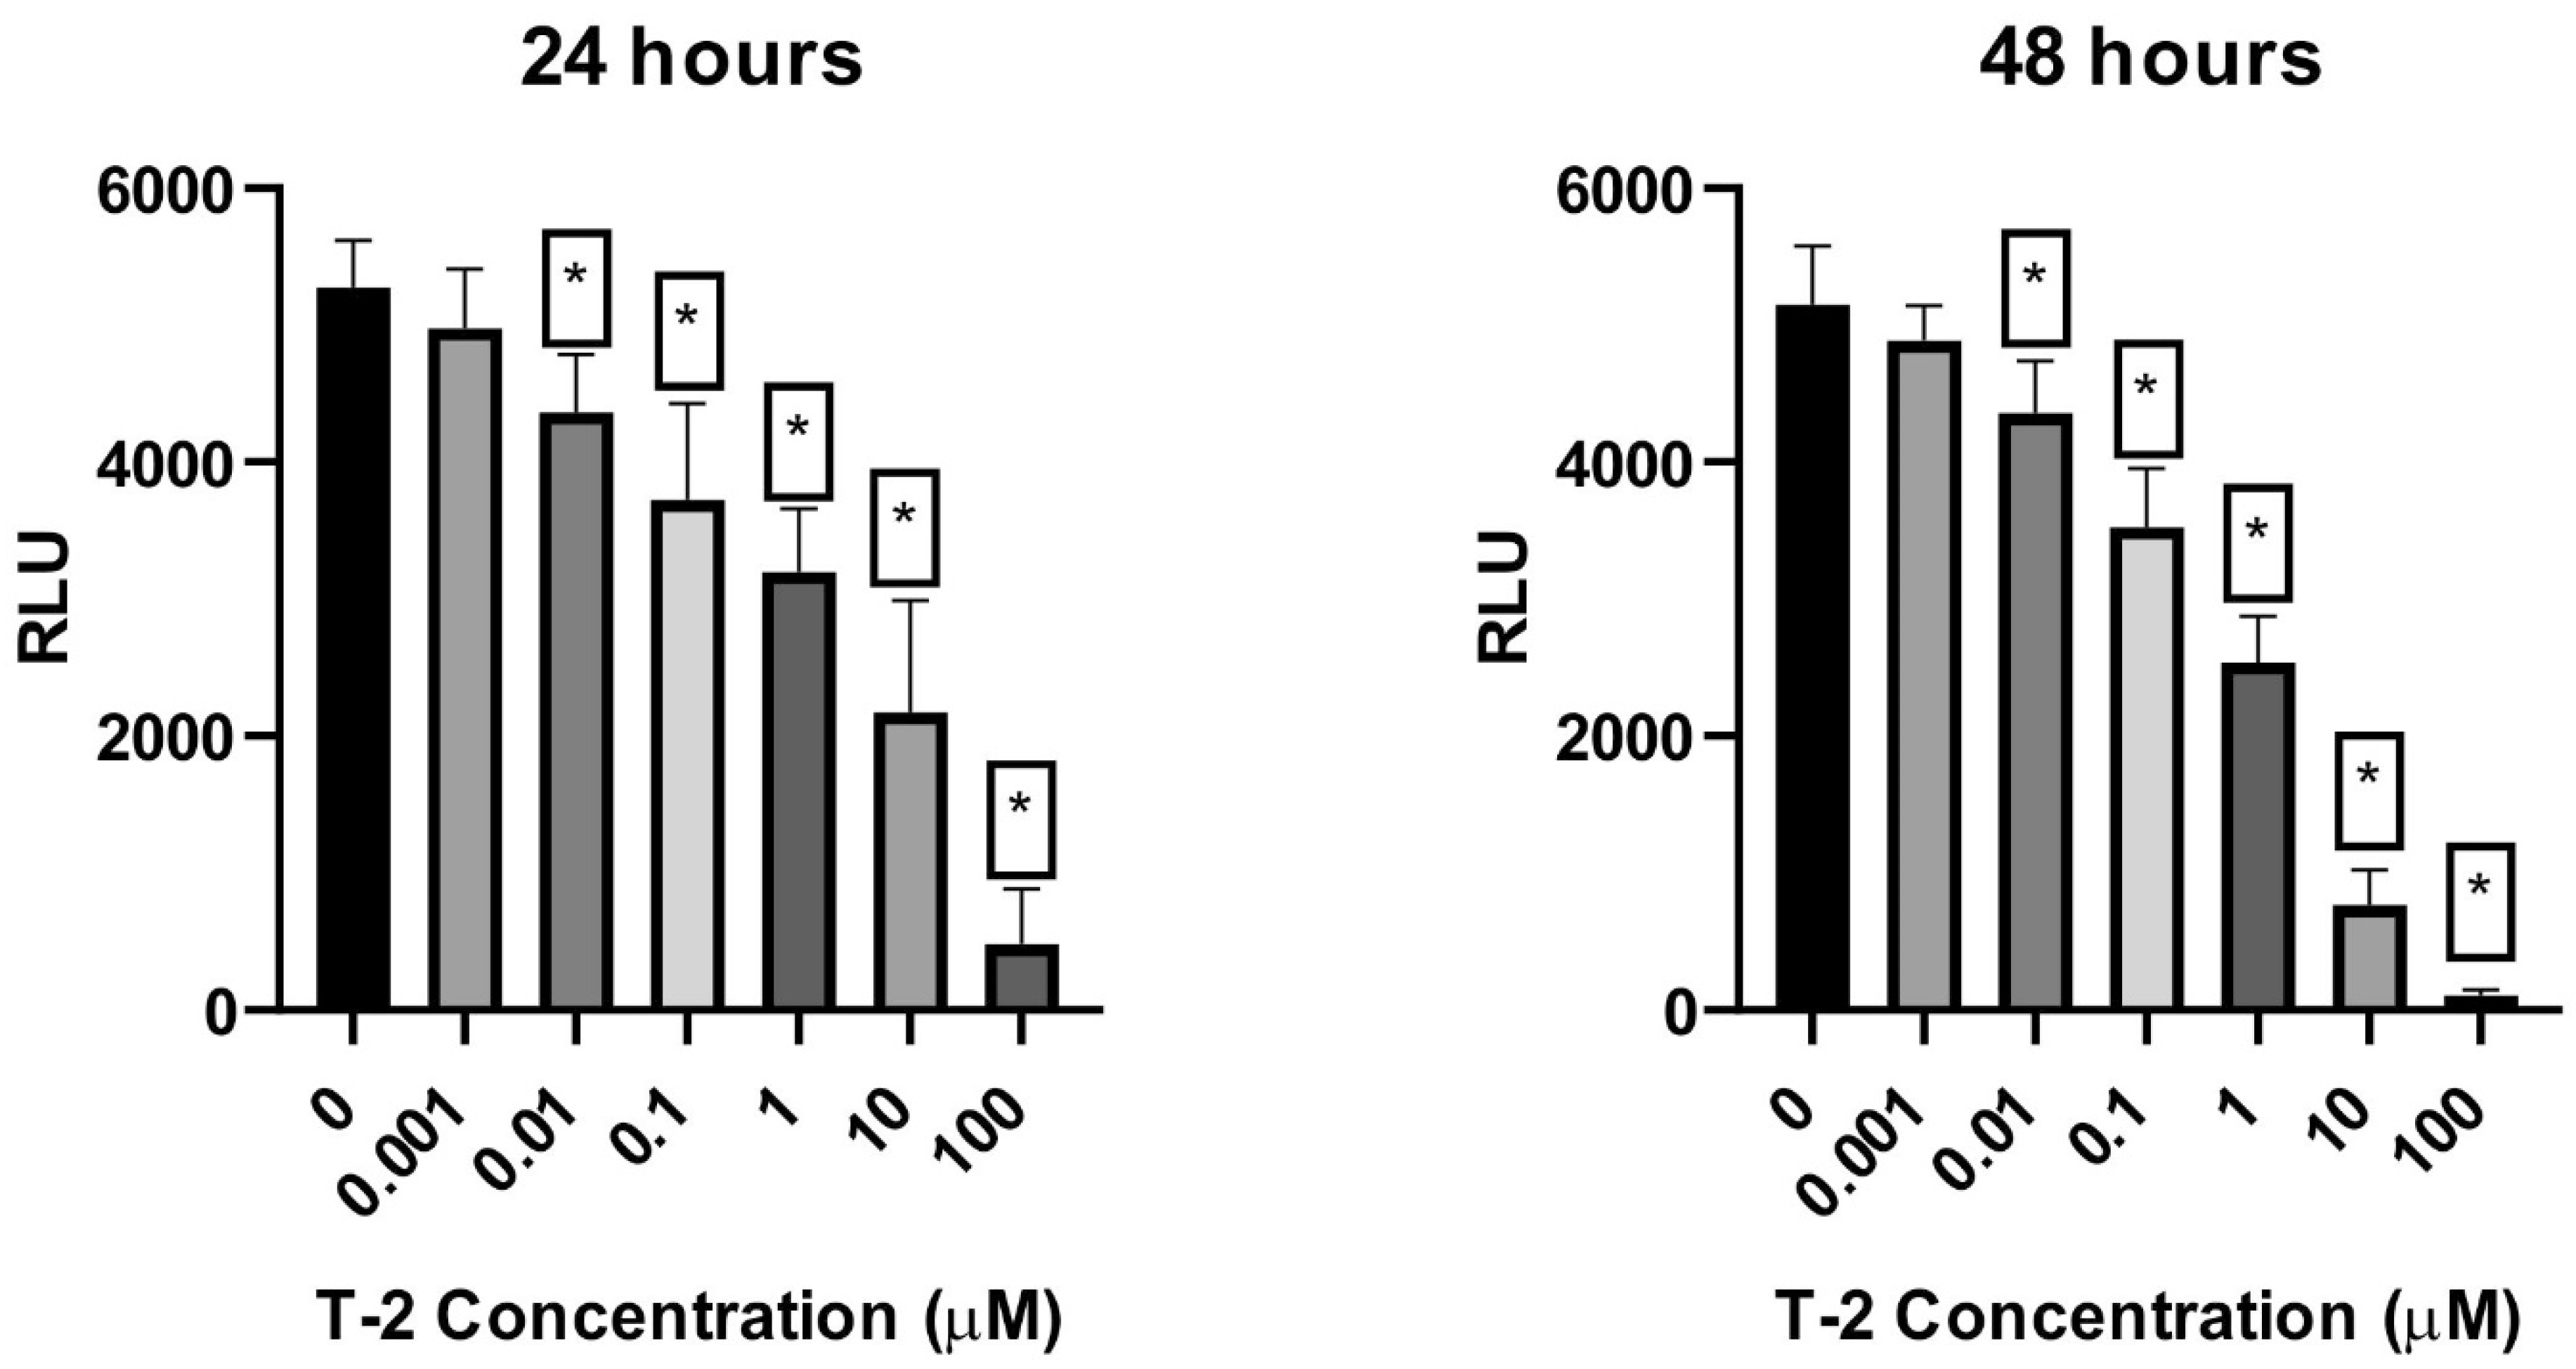
2.2. Cellular ATP Level
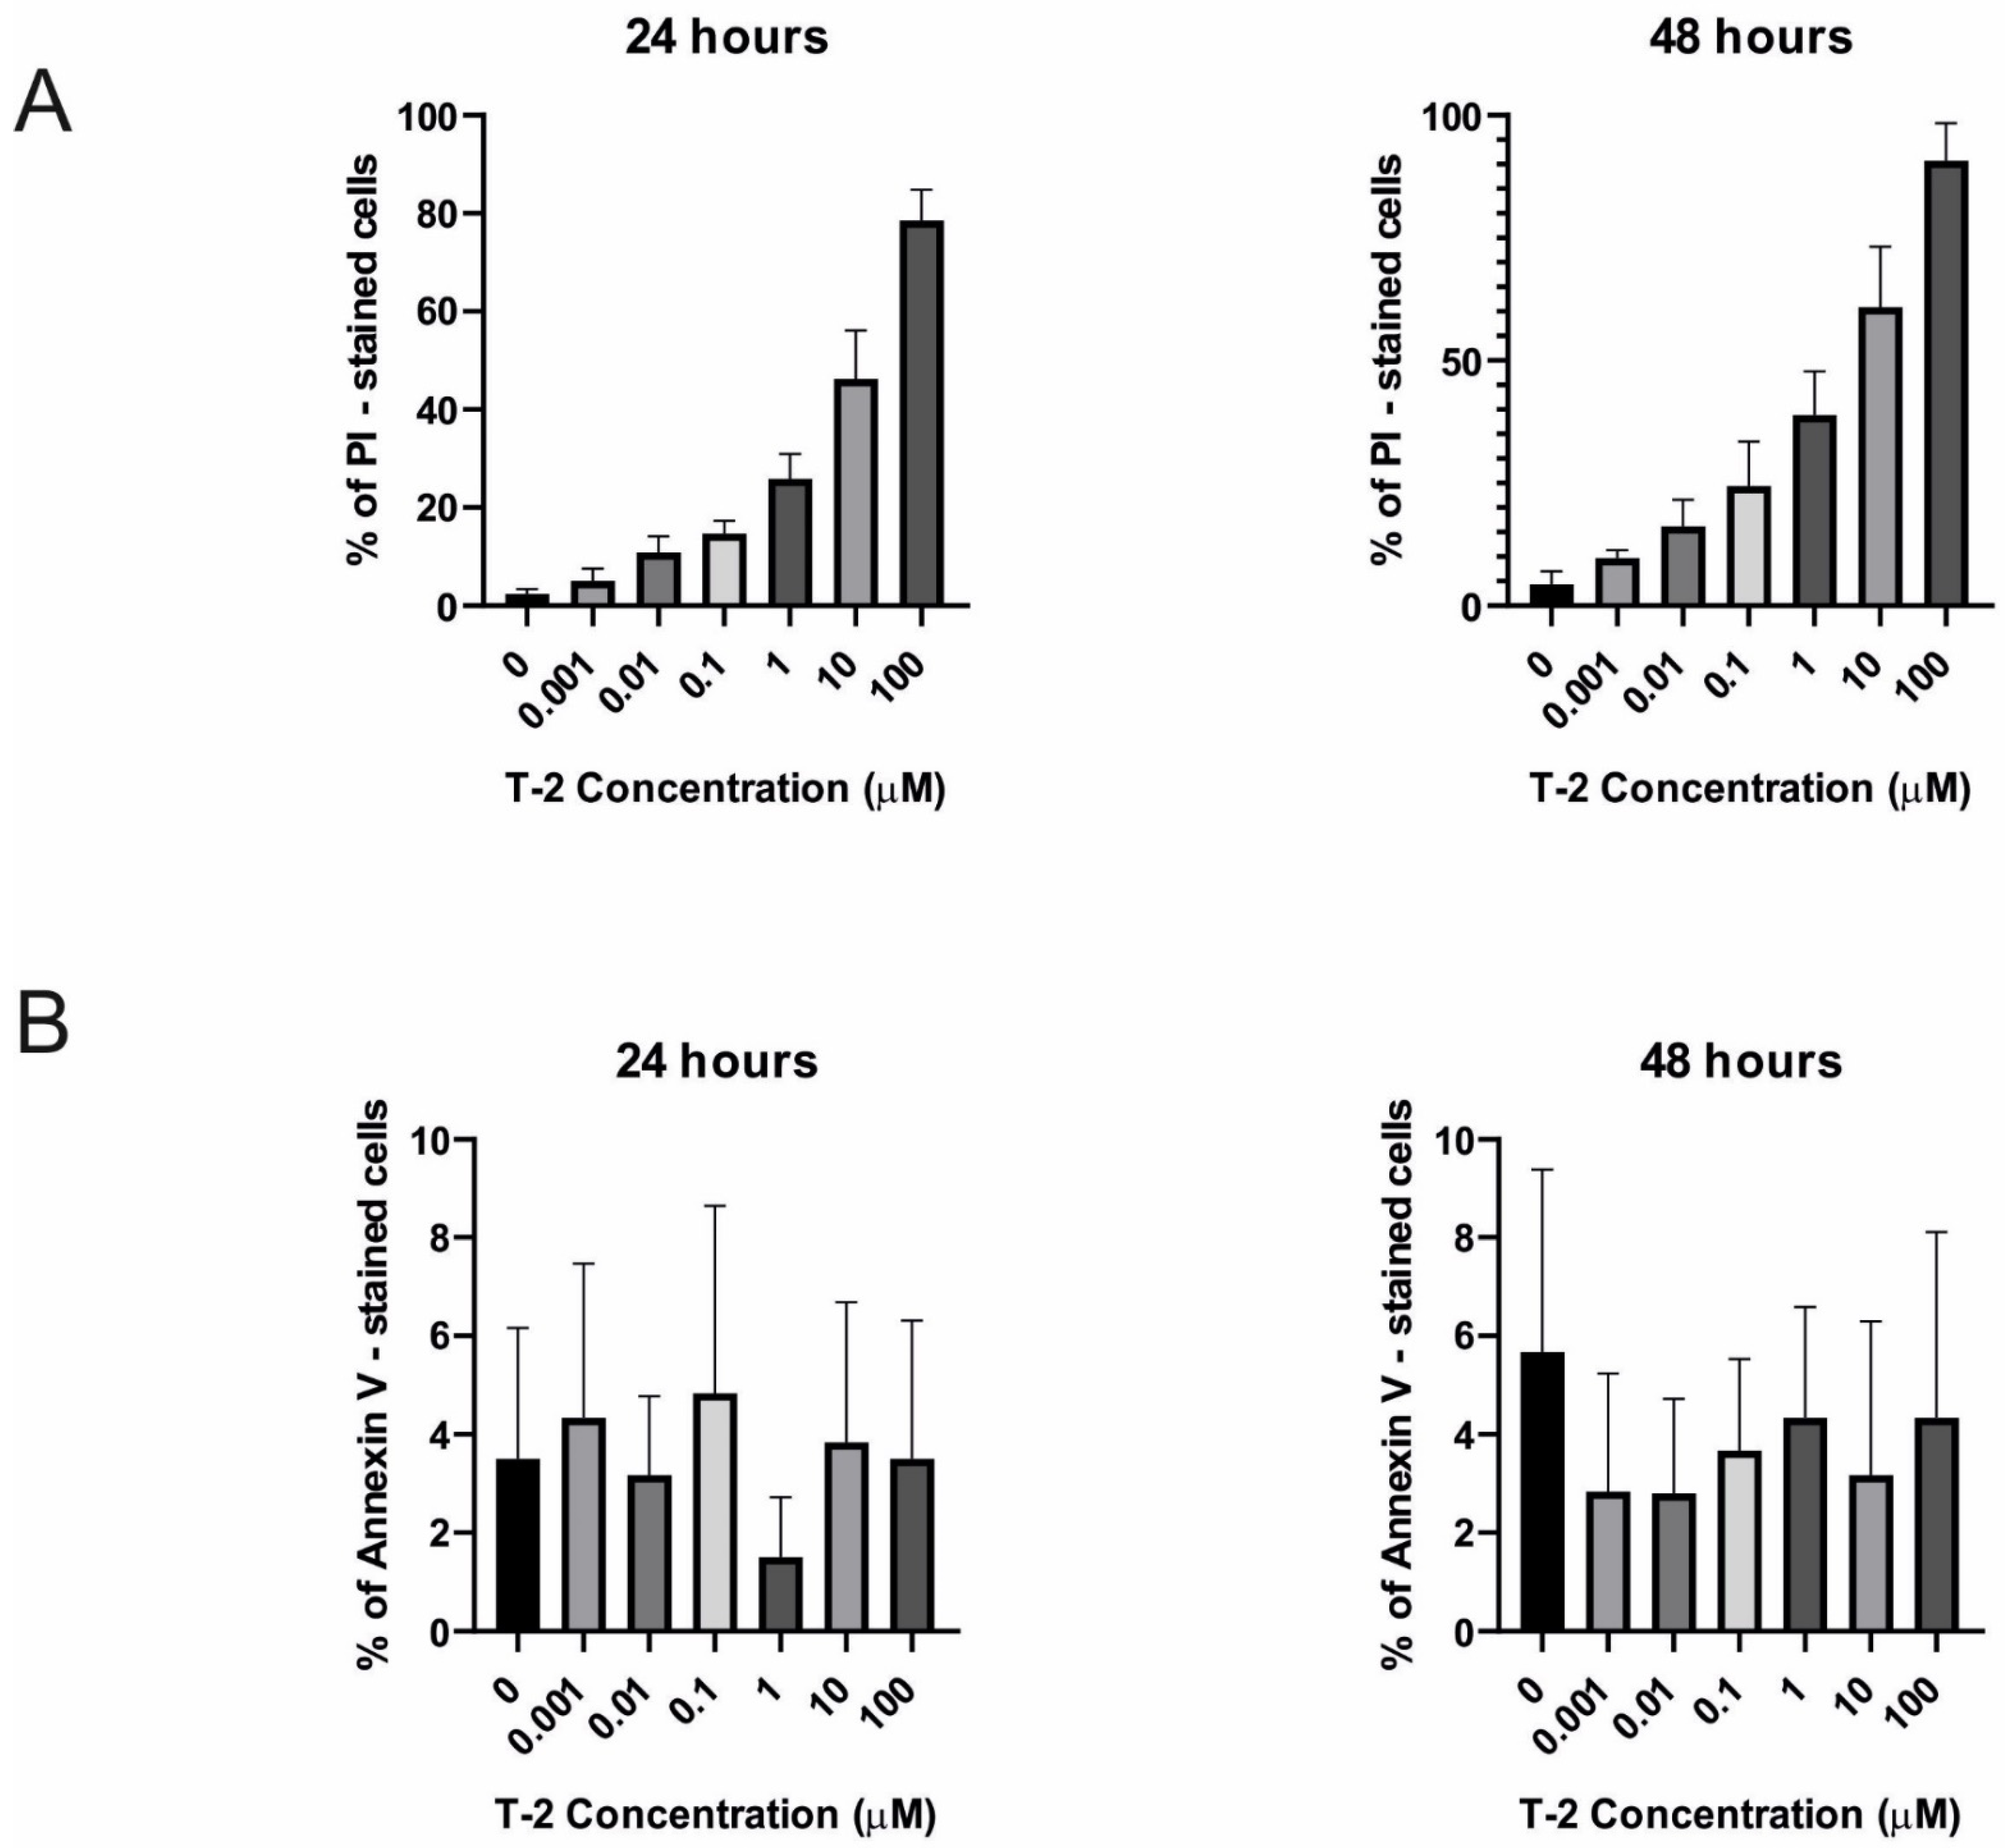
2.3. Apoptosis and Necrosis
2.3.1. Annexin V and Propidium Iodide Staining
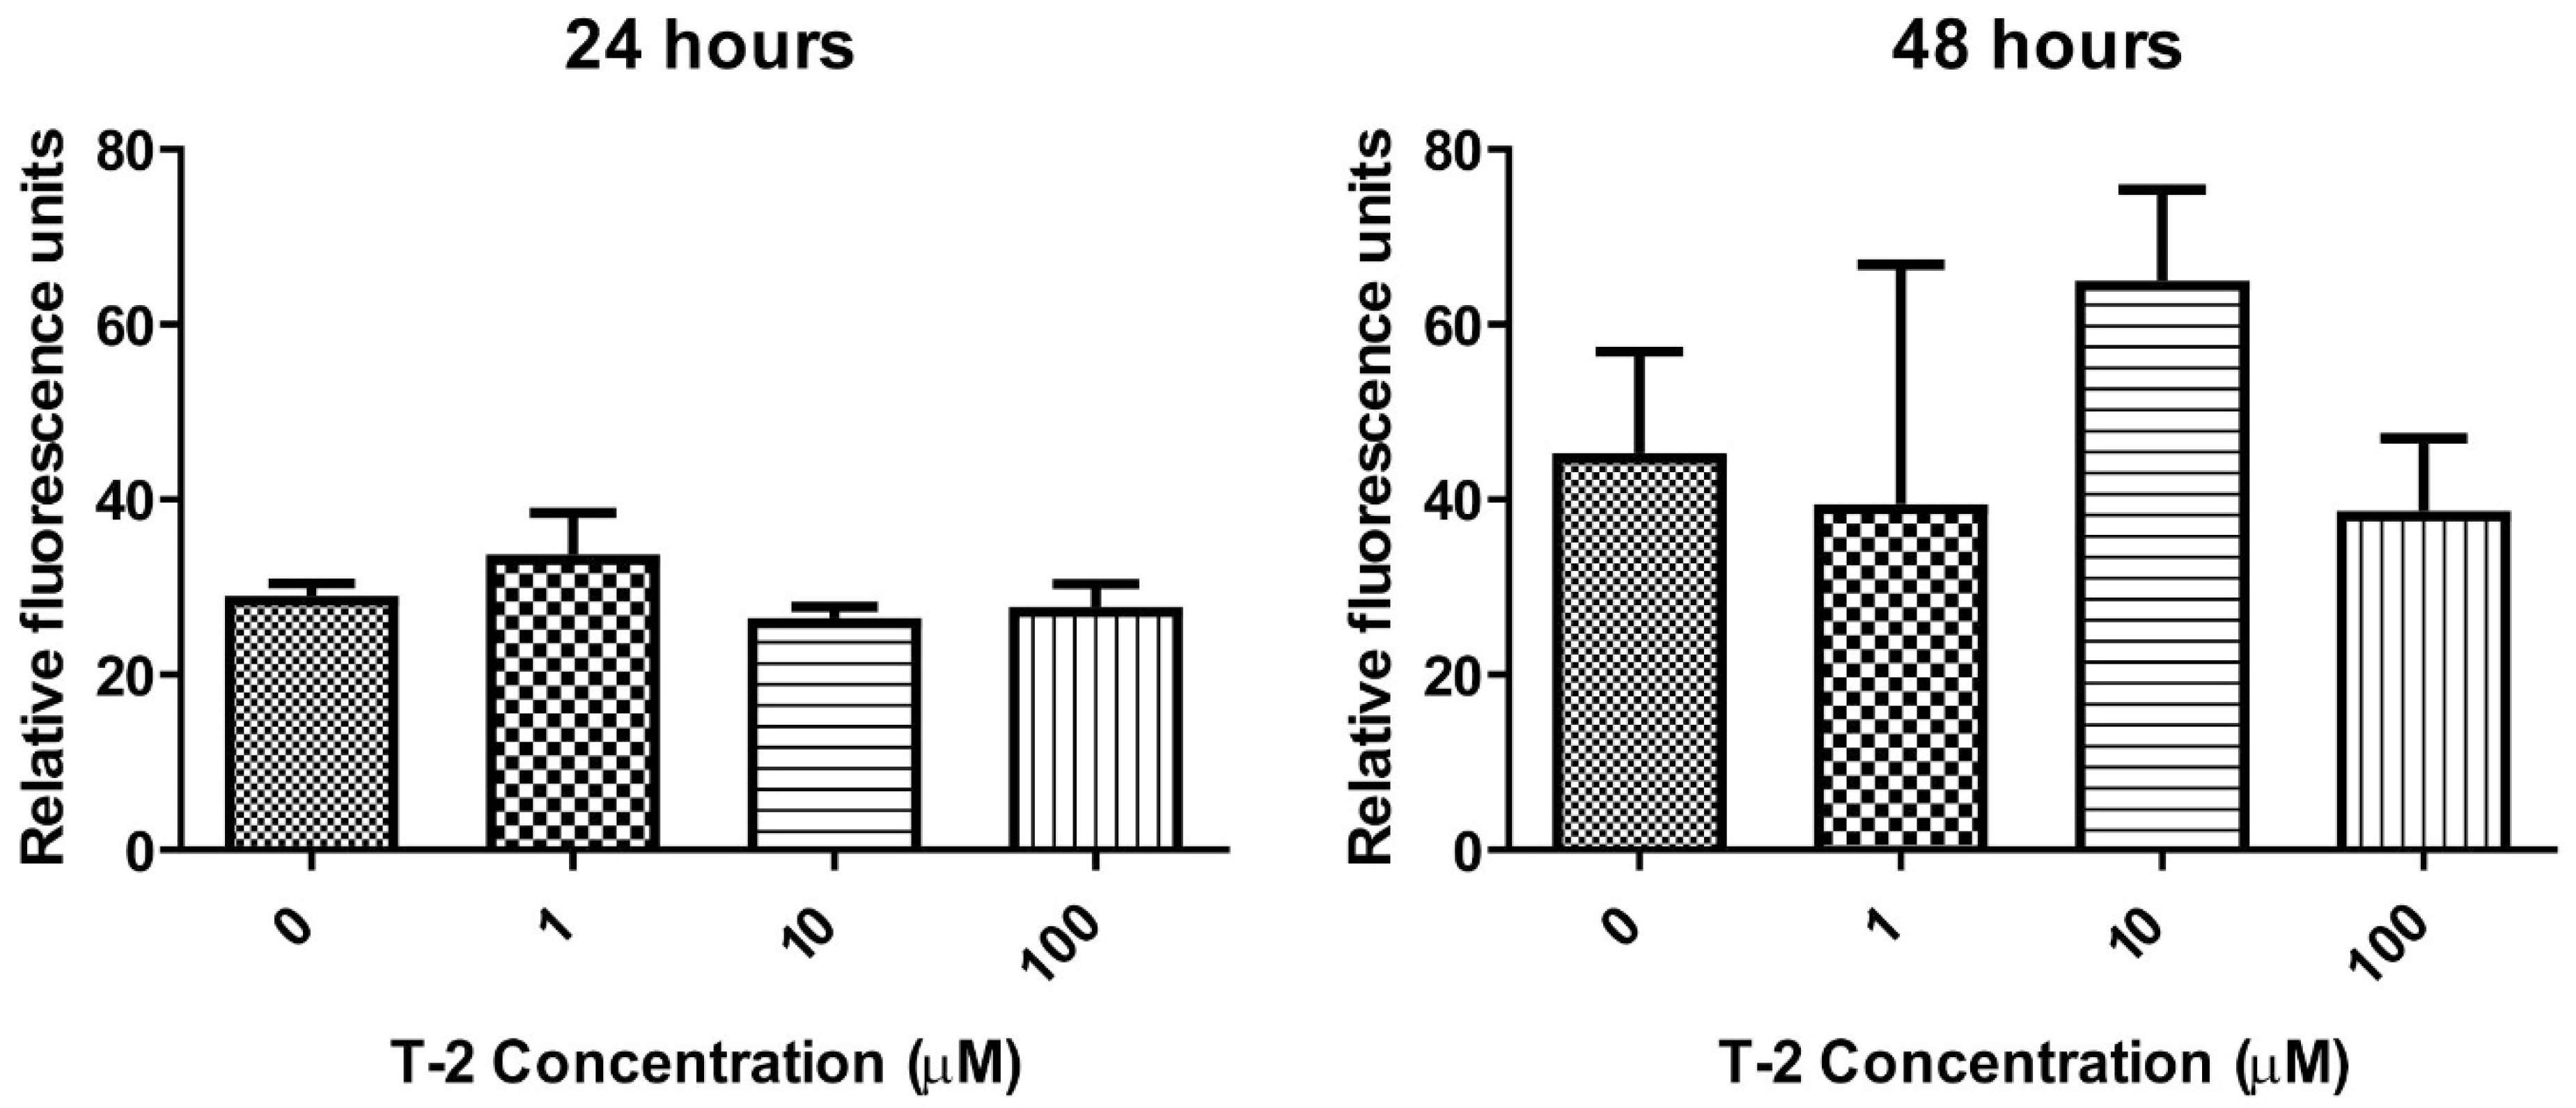
2.3.2. Caspase-3/7 Pathway
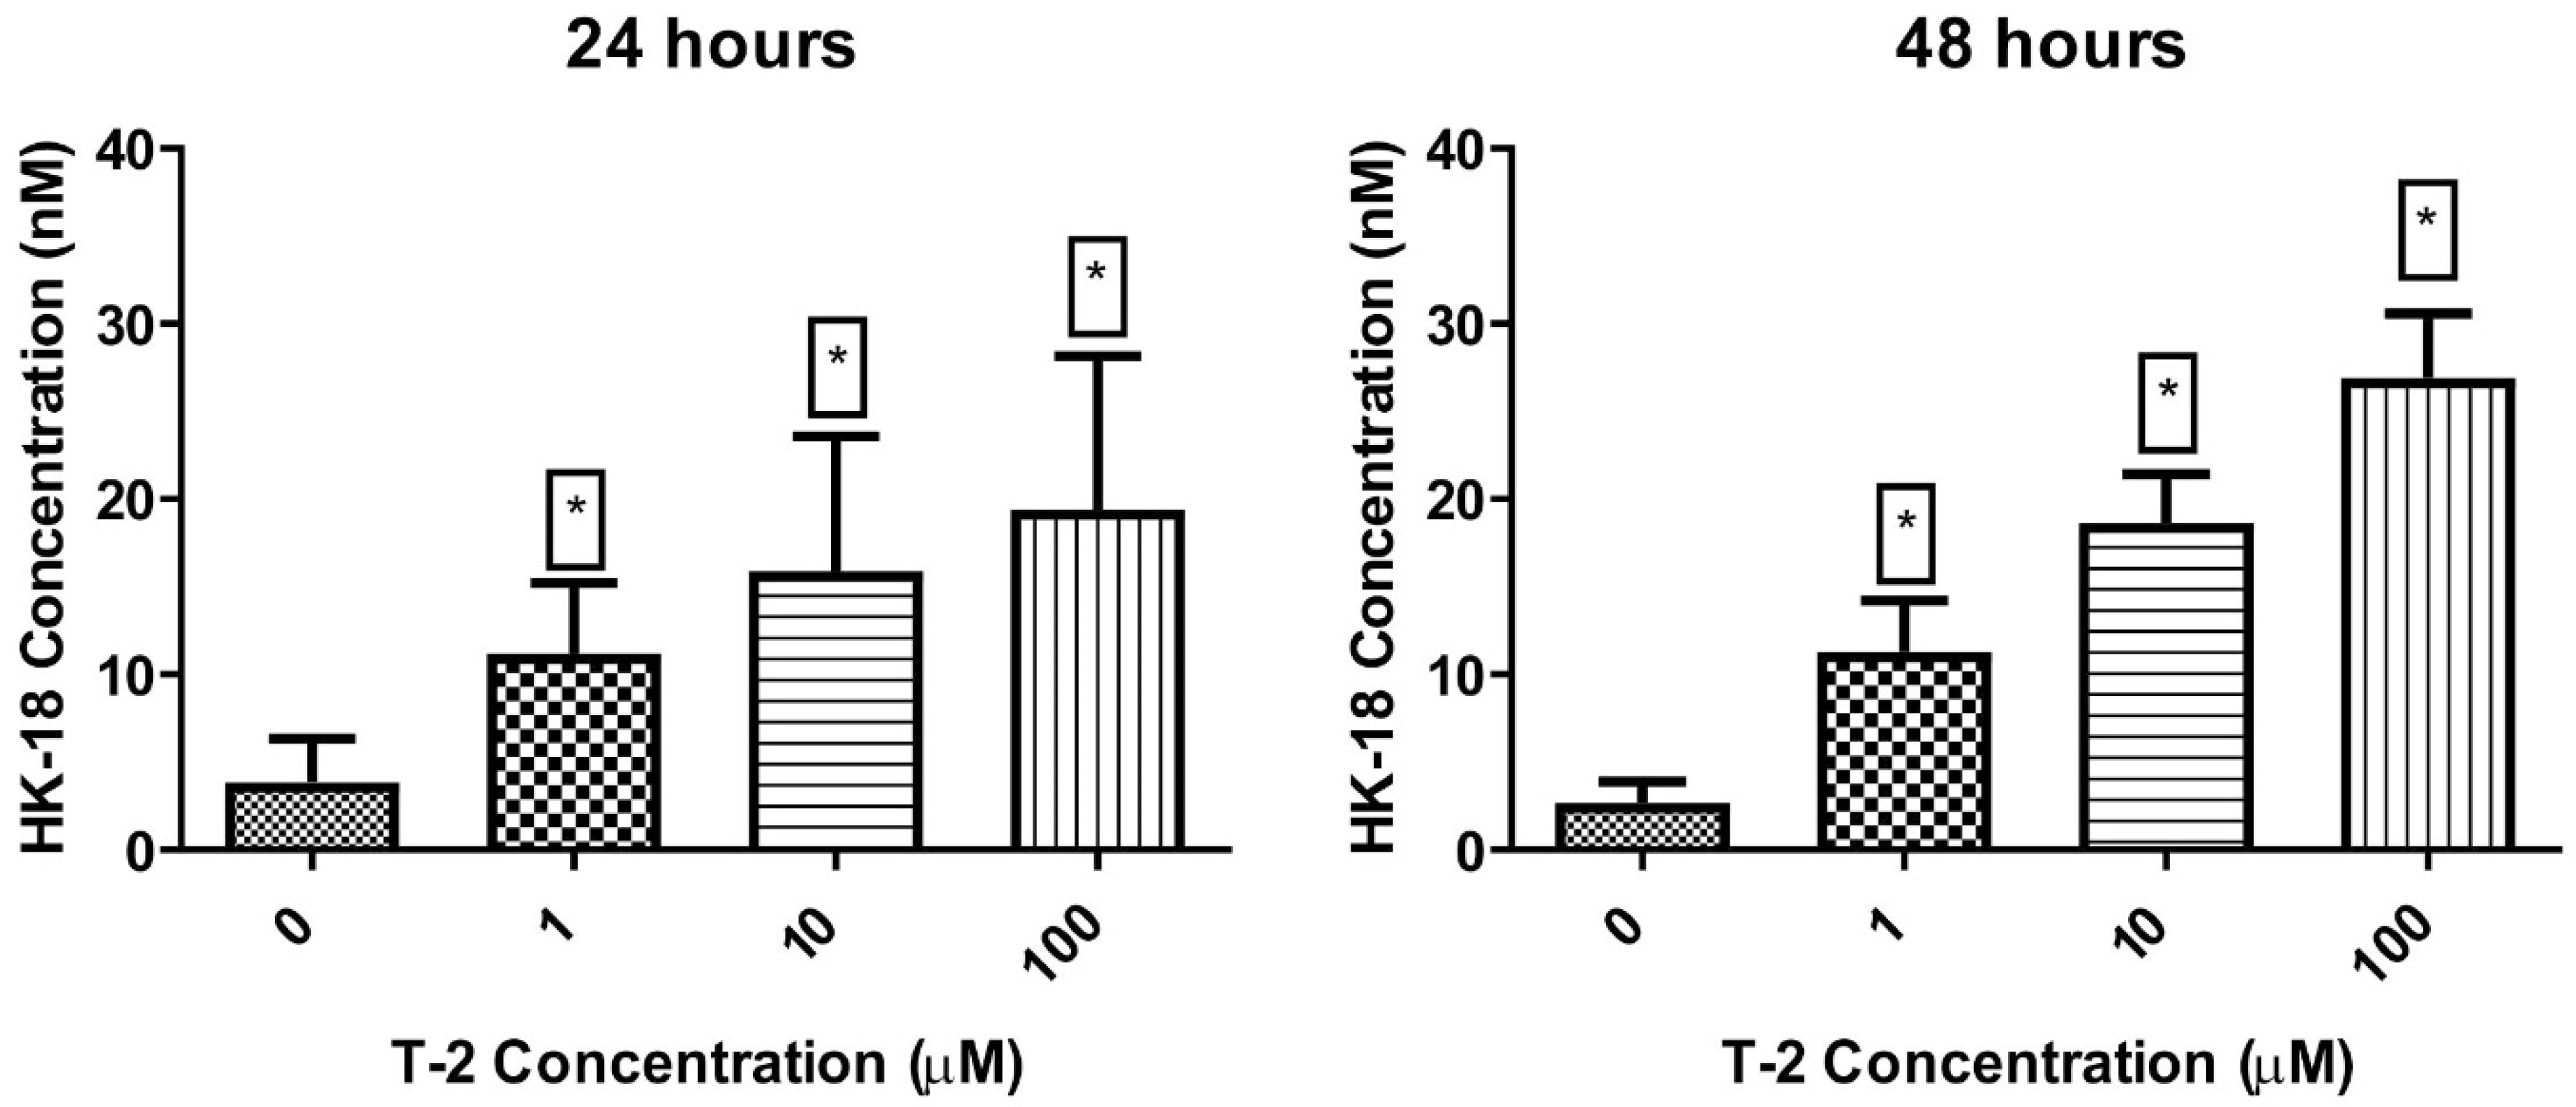
2.3.3. Cytokeratin 18 Concentration
3. Discussion
4. Materials and Methods
4.1. Reagents
4.2. Cellular Material and Culturing Procedure
4.3. Cell Viability Determination
4.4. Analysis of Cellular ATP Level Using the Bioluminometry Method
4.5. Apoptosis/Necrosis Assay—Annexin V Binding and Propidium Iodide Staining
4.6. Determination of Activity of Caspase-3/Caspase-7
4.7. Concentration of Cytokeratin 18 Analysis in Cell Culture Supernatants
4.8. Data Analysis
5. Conclusions
Author Contributions
Funding
Institutional Review Board Statement
Informed Consent Statement
Data Availability Statement
Conflicts of Interest
References
- Nesic, K.; Ivanovic, S.; Nesic, V. Fusarial toxins: Secondary metabolites of Fusarium fungi. Rev. Environ. Contam. Toxicol. 2014, 228, 101–120. [Google Scholar] [CrossRef] [PubMed]
- McCormick, S.P.; Stanley, A.M.; Stover, N.A.; Alexander, N.J. Trichothecenes: From simple to complex mycotoxins. Toxins 2011, 3, 802–814. [Google Scholar] [CrossRef] [PubMed]
- Foroud, N.A.; Eudes, F. Trichothecenes in cereal grains. Int. J. Mol. Sci. 2009, 10, 147–173. [Google Scholar] [CrossRef] [PubMed] [Green Version]
- Janik, E.; Ceremuga, M.; Saluk-Bijak, J.; Bijak, M. Biological Toxins as the Potential Tools for Bioterrorism. Int. J. Mol. Sci. 2019, 20, 1181. [Google Scholar] [CrossRef] [Green Version]
- Kanora, A.; Maes, D. The role of mycotoxins in pig reproduction: A review. Vet. Med. 2009, 54, 565–576. [Google Scholar] [CrossRef] [Green Version]
- Zhang, M.; Huo, B.; Yuan, S.; Ning, B.; Bai, J.; Peng, Y.; Liu, B.; Gao, Z. Ultrasensitive detection of T-2 toxin in food based on bio-barcode and rolling circle amplification. Anal. Chim. Acta 2018, 1043, 98–106. [Google Scholar] [CrossRef]
- Adhikari, M.; Negi, B.; Kaushik, N.; Adhikari, A.; Al-Khedhairy, A.A.; Kaushik, N.K.; Choi, E.H. T-2 mycotoxin: Toxicological effects and decontamination strategies. Oncotarget 2017, 8, 33933–33952. [Google Scholar] [CrossRef] [Green Version]
- Fung, F. T-2 Toxin (Trichothecene Mycotoxins) Attack. In Ciottone’s Disaster Medicine; Elsevier: Amsterdam, The Netherlands, 2016; Volume 157, pp. 801–803. [Google Scholar]
- Albarenque, S.M.; Shinozuka, J.; Iwamoto, S.; Nakayama, H.; Doi, K. T-2 toxin-induced acute skin lesions in Wistar-derived hypotrichotic WBNIILA-Ht rats. Histol. Histopathol. 1999, 14, 337–342. [Google Scholar]
- Hemmati, A.A.; Kalantari, H.; Jalali, A.; Rezai, S.; Zadeh, H.H. Healing effect of quince seed mucilage on T-2 toxin-induced dermal toxicity in rabbit. Exp. Toxicol. Pathol. 2012, 64, 181–186. [Google Scholar] [CrossRef]
- Ueno, Y. Comparative study on skin-necrotizing effect of scirpene metabolites of Fusaria. Jpn. J. Exp. Med. 1970, 40, 33–38. [Google Scholar]
- Bunner, D.; Wannemacher, R.; Neufeld, H.; Hassler, C.; Parker, G. Pathophysiology of Acute T-2 Intoxication in the Cynomolgus Monkey and Comparison to the Rat as a Model. Toxicology 1983, 21, 411–421. [Google Scholar]
- Sokolović, M.; Garaj-Vrhovac, V.; Simpraga, B. T-2 toxin: Incidence and toxicity in poultry. Arch. Ind. Hyg. Toxicol. 2008, 59, 43–52. [Google Scholar] [CrossRef] [PubMed]
- Agrawal, M.; Yadav, P.; Lomash, V.; Bhaskar, A.S.; Lakshmana Rao, P.V. T-2 toxin induced skin inflammation and cutaneous injury in mice. Toxicology 2012, 302, 255–265. [Google Scholar] [CrossRef] [PubMed]
- Afsah-Hejri, L.; Jinap, S.; Hajeb, P.; Radu, S.; Shakibazadeh, S. A Review on Mycotoxins in Food and Feed: Malaysia Case Study. Compr. Rev. Food Sci. Food Saf. 2013, 12, 629–651. [Google Scholar] [CrossRef]
- Haig, A. Chemical Warfare in Southwest Asia and Afghanistan: Report to the Congress from Secretary of State; Special Report No. 98; US Department of State, Bureau of Public Affairs, Office of Public Communication, Editorial Division: Washington, DC, USA, 1982. [Google Scholar]
- Kalantari, H.; Moosavi, M. Review on T-2 Toxin. Jundishapur J. Nat. Pharm. Prod. 2010, 5, 26–38. [Google Scholar]
- Venkataramana, M.; Chandranayaka, S.; Prakash, H.; Niranjana, S. Mycotoxins Relevant to Biowarfare and Their Detection. In Biological Toxins and Bioterrorism; Gopalakrishnakone, P., Balali-Mood, M., Llewellyn, L., Singh, B., Eds.; Springer: Dordrecht, The Netherlands, 2015; Volume 1, p. 295319. [Google Scholar]
- Shin, J.W.; Kwon, S.H.; Choi, J.Y.; Na, J.I.; Huh, C.H.; Choi, H.R.; Park, K.C. Molecular Mechanisms of Dermal Aging and Antiaging Approaches. Int. J. Mol. Sci. 2019, 20, 2126. [Google Scholar] [CrossRef] [Green Version]
- Ueno, Y. The toxicology of mycotoxins. Crit. Rev. Toxicol. 1985, 14, 99–132. [Google Scholar] [CrossRef]
- Bertero, A.; Moretti, A.; Spicer, L.J.; Caloni, F. Molds and Mycotoxins: Potential Species-Specific Effects. Toxins 2018, 10, 244. [Google Scholar] [CrossRef] [Green Version]
- Guilford, F.T.; Hope, J. Deficient glutathione in the pathophysiology of mycotoxin-related illness. Toxins 2014, 6, 608–623. [Google Scholar] [CrossRef] [Green Version]
- Obremski, K.; Podlasz, P.; Zmigrodzka, M.; Winnicka, A.; Woźny, M.; Brzuzan, P.; Jakimiuk, E.; Wojtacha, P.; Gajecka, M.; Zielonka, Ł.; et al. The effect of T-2 toxin on percentages of CD4+, CD8+, CD4+ CD8+ and CD21+ lymphocytes, and mRNA expression levels of selected cytokines in porcine ileal Peyer’s patches. Pol. J. Vet. Sci. 2013, 16, 341–349. [Google Scholar] [CrossRef]
- Li, M.; Pestka, J.J. Comparative induction of 28S ribosomal RNA cleavage by ricin and the trichothecenes deoxynivalenol and T-2 toxin in the macrophage. Toxicol. Sci. 2008, 105, 67–78. [Google Scholar] [CrossRef] [PubMed] [Green Version]
- Hoehler, D.; Marquardt, R.R. Influence of vitamins E and C on the toxic effects of ochratoxin A and T-2 toxin in chicks. Poult. Sci. 1996, 75, 1508–1515. [Google Scholar] [CrossRef] [PubMed]
- Leal, M.; Shimada, A.; Ruíz, F.; de Mejía, E.G. Effect of lycopene on lipid peroxidation and glutathione-dependent enzymes induced by T-2 toxin in vivo. Toxicol. Lett. 1999, 109, 1–10. [Google Scholar] [CrossRef]
- Yang, L.; Yu, Z.; Hou, J.; Deng, Y.; Zhou, Z.; Zhao, Z.; Cui, J. Toxicity and oxidative stress induced by T-2 toxin and HT-2 toxin in broilers and broiler hepatocytes. Food Chem. Toxicol. 2016, 87, 128–137. [Google Scholar] [CrossRef] [PubMed]
- Meurer, F.; Do, H.T.; Sadowski, G.; Held, C. Standard Gibbs energy of metabolic reactions: II. Glucose-6-phosphatase reaction and ATP hydrolysis. Biophys. Chem. 2017, 223, 30–38. [Google Scholar] [CrossRef]
- Méry, B.; Guy, J.B.; Vallard, A.; Espenel, S.; Ardail, D.; Rodriguez-Lafrasse, C.; Rancoule, C.; Magné, N. In Vitro Cell Death Determination for Drug Discovery: A Landscape Review of Real Issues. J. Cell Death 2017, 10, 1179670717691251. [Google Scholar] [CrossRef] [Green Version]
- Nguyen, L.T.; Zajíčková, M.; Mašátová, E.; Matoušková, P.; Skálová, L. The ATP bioluminescence assay: A new application and optimization for viability testing in the parasitic nematode Haemonchus contortus. Vet. Res. 2021, 52, 124. [Google Scholar] [CrossRef]
- Moriwaki, K.; Chan, F. Necrosis-dependent and independent signaling of the RIP kinases in inflammation. Cytokine Growth Factor Rev. 2014, 25, 167–174. [Google Scholar] [CrossRef] [Green Version]
- Elmore, S. Apoptosis: A review of programmed cell death. Toxicol. Pathol. 2007, 35, 495–516. [Google Scholar] [CrossRef]
- Golstein, P.; Kroemer, G. Cell death by necrosis: Towards a molecular definition. Trends Biochem. Sci. 2007, 32, 37–43. [Google Scholar] [CrossRef]
- Syntichaki, P.; Tavernarakis, N. Death by necrosis. Uncontrollable catastrophe, or is there order behind the chaos? EMBO Rep. 2002, 3, 604–609. [Google Scholar] [CrossRef] [PubMed] [Green Version]
- Cullen, J.M. Histologic Patterns of Hepatotoxic Injury. In Comprehensive Toxicology, 2nd ed.; McQueen, C., Ed.; EPA: Washington, DC, USA, 2010; pp. 141–173. [Google Scholar]
- D’Arcy, M.S. Cell death: A review of the major forms of apoptosis, necrosis and autophagy. Cell Biol. Int. 2019, 43, 582–592. [Google Scholar] [CrossRef] [PubMed]
- Dolenšek, T.; Švara, T.; Knific, T.; Gombač, M.; Luzar, B.; Jakovac-Strajn, B. The Influence of Fusarium Mycotoxins on the Liver of Gilts and Their Suckling Piglets. Animals 2021, 11, 2534. [Google Scholar] [CrossRef] [PubMed]
- Gerez, J.; Pinton, P.; Callu, P.; Grosjean, F.; Oswald, I.; Bracarensem, A. Deoxynivalenol alone or in combination with nivalenol and zearalenone induce systemic histological changes in pigs. Exp. Toxicol. Pathol. 2015, 67, 89–98. [Google Scholar] [CrossRef]
- Antonissen, G.; Van Immerseel, F.; Pasmans, F.; Ducatelle, R.; Haesebrouck, F.; Timbermont, L.; Verlinden, M.; Janssens, G.; Eeckhaut, V.; Eeckhout, M.; et al. The mycotoxin deoxynivalenol predisposes for the development of Clostridium perfringens-induced necrotic enteritis in broiler chickens. PLoS ONE 2014, 9, e108775. [Google Scholar] [CrossRef] [Green Version]
- Alsayyah, A.; ElMazoudy, R.; Al-Namshan, M.; Al-Jafary, M.; Alaqeel, N. Chronic neurodegeneration by aflatoxin B1 depends on alterations of brain enzyme activity and immunoexpression of astrocyte in male rats. Ecotoxicol. Environ. Saf. 2019, 182, 109407. [Google Scholar] [CrossRef]
- Osuchowski, M.; Sharma, R. Fumonisin B1 Induces Necrotic Cell Death in BV-2 Cells and Murine Cultured Astrocytes and is Antiproliferative in BV-2 Cells While N2A Cells and Primary Cortical Neurons are Resistant. NeuroToxicology 2005, 26, 981–992. [Google Scholar] [CrossRef]
- Kupski, L.; Freitas, M.; Ribeiro, D.; Furlong, E.; Fernandes, E. Ochratoxin A activates neutrophils and kills these cells through necrosis, an effect eliminated through its conversion into ochratoxin α. Toxicology 2016, 368–369, 91–102. [Google Scholar] [CrossRef]
- Bratton, D.L.; Fadok, V.A.; Richter, D.A.; Kailey, J.M.; Guthrie, L.A.; Henson, P.M. Appearance of phosphatidylserine on apoptotic cells requires calcium-mediated nonspecific flip-flop and is enhanced by loss of the aminophospholipid translocase. J. Biol. Chem. 1997, 272, 26159–26165. [Google Scholar] [CrossRef] [Green Version]
- Dive, C.; Smith, R.A.; Garner, E.; Ward, T.; George-Smith, S.S.; Campbell, F.; Greenhalf, W.; Ghaneh, P.; Neoptolemos, J.P. Considerations for the use of plasma cytokeratin 18 as a biomarker in pancreatic cancer. Br. J. Cancer 2010, 102, 577–582. [Google Scholar] [CrossRef] [Green Version]
- Bouaziz, C.; El Dein, O.S.; El Golli, E.; Abid-Essefi, S.; Brenner, C.; Lemaire, C.; Bacha, H. Different apoptotic pathways induced by zearalenone, T-2 toxin and ochratoxin A in human hepatoma cells. Toxicology 2008, 254, 19–28. [Google Scholar] [CrossRef] [PubMed]
- Zbikowska, H.M.; Antosik, A.; Szejk, M.; Bijak, M.; Olejnik, A.K.; Saluk, J.; Nowak, P. Does quercetin protect human red blood cell membranes against γ-irradiation? Redox Rep. 2014, 19, 65–71. [Google Scholar] [CrossRef] [PubMed]
- Bijak, M.; Saluk, J.; Antosik, A.; Ponczek, M.B.; Zbikowska, H.M.; Borowiecka, M.; Nowak, P. Aronia melanocarpa as a protector against nitration of fibrinogen. Int. J. Biol. Macromol. 2013, 55, 264–268. [Google Scholar] [CrossRef] [PubMed]
Publisher’s Note: MDPI stays neutral with regard to jurisdictional claims in published maps and institutional affiliations. |
© 2022 by the authors. Licensee MDPI, Basel, Switzerland. This article is an open access article distributed under the terms and conditions of the Creative Commons Attribution (CC BY) license (https://creativecommons.org/licenses/by/4.0/).
Share and Cite
Janik-Karpinska, E.; Ceremuga, M.; Wieckowska, M.; Szyposzynska, M.; Niemcewicz, M.; Synowiec, E.; Sliwinski, T.; Bijak, M. Direct T-2 Toxicity on Human Skin—Fibroblast Hs68 Cell Line—In Vitro Study. Int. J. Mol. Sci. 2022, 23, 4929. https://doi.org/10.3390/ijms23094929
Janik-Karpinska E, Ceremuga M, Wieckowska M, Szyposzynska M, Niemcewicz M, Synowiec E, Sliwinski T, Bijak M. Direct T-2 Toxicity on Human Skin—Fibroblast Hs68 Cell Line—In Vitro Study. International Journal of Molecular Sciences. 2022; 23(9):4929. https://doi.org/10.3390/ijms23094929
Chicago/Turabian StyleJanik-Karpinska, Edyta, Michal Ceremuga, Magdalena Wieckowska, Monika Szyposzynska, Marcin Niemcewicz, Ewelina Synowiec, Tomasz Sliwinski, and Michal Bijak. 2022. "Direct T-2 Toxicity on Human Skin—Fibroblast Hs68 Cell Line—In Vitro Study" International Journal of Molecular Sciences 23, no. 9: 4929. https://doi.org/10.3390/ijms23094929