Article

Acidic and Alkaline Conditions Affect the Growth of Tree Peony Plants via Altering Photosynthetic Characteristics, Limiting Nutrient Assimilation, and Impairing ROS Balance

1
Key Laboratory of Biology and Genetic Improvement of Horticultural Crops, Ministry of Agriculture and Rural Affairs, Institute of Vegetables and Flowers, Chinese Academy of Agricultural Sciences, Beijing 100081, China
2
National Agricultural Science and Technology Center, Chengdu 610213, China
*
Authors to whom correspondence should be addressed.
These authors contributed equally to this work.
Int. J. Mol. Sci. 2022, 23(9), 5094; https://doi.org/10.3390/ijms23095094
Submission received: 6 April 2022 / Revised: 26 April 2022 / Accepted: 2 May 2022 / Published: 3 May 2022
(This article belongs to the Section Molecular Plant Sciences)

Abstract

:
Exposure to acidic and alkaline conditions were found to cause the excess accumulation of reactive oxygen species in tree peony, thereby causing damage and inhibiting plant growth and development. The activities of antioxidant enzymes were also found to be significantly up-regulated, especially under alkaline conditions; this explained why tree peony is better adapted to alkaline than to acidic conditions. Through pairwise comparisons, 144 differentially expressed genes (DEGs) associated with plant growth, photosynthesis, and stress were identified. The DEGs related to stress were up-regulated, whereas the remaining DEGs were almost all down-regulated after acid and alkaline treatments. The nutrient assimilation was greatly inhibited. Chlorophyll synthesis genes were suppressed, and chlorophyll content was reduced. The development and structures of stomata and chloroplasts and the transcription of related genes were also influenced. Among photosynthesis-related DEGs, electron transport chains were the most sensitive. The suppressed expression of photosynthesis genes and the reduced light-harvesting capacity, together with the impairment of chloroplasts and stomata, finally led to a sharp decrease in the net photosynthetic rate. Carbohydrate accumulation and plant biomass were also reduced. The present study provides a theoretical basis for the response mechanisms of tree peony to adverse pH conditions and enriches knowledge of plant adaptation to alkaline conditions.

1. Introduction

Tree peony (Paeonia suffruticosa Andr.) is a famous Chinese traditional flowering plant referred to as ‘the king of flowers’, with more than 2000 years of cultivation history [1]. It is also famous worldwide due to its ornamental features and economic value [2]. The tree peony has been used as a medicinal plant since ancient times and at present has gained attention as an emerging oil plant [1,3]. Moreover, tree peony is widely used in landscaping, gardening, potted flower culturing, forcing culture, and oriental flower arranging. The rise in soil pH is one of the factors restricting the vegetative growth and development of tree peony. Hence, a systematic study of pH as it affects plant growth is urgently required to improve cultivation techniques for tree peony.
Soil acidification is a major limiting factor for worldwide sustainable agricultural production. Acidic soil covers approximately 30–40% of the world’s arable land [4]. Soil alkalization is also a significant problem in China [5]. These adverse pH conditions induce the production of reactive oxygen species (ROS) in plant cells. This can cause damage to the plant (in the form of protein oxidization, destroyed nucleic acids, and lipid peroxidation). However, ROS are also involved in various cellular processes, including stress resistance, as signal molecules [6,7]. It has been reported that pH significantly affects nutrient uptake, root growth, flower quality, and other cellular processes [6,8]. To reduce the damage caused by stress, plants will activate several antioxidant enzymes to eliminate the excess ROS [9]. The activities of superoxide dismutase (SOD), peroxidase (POD), and catalase (CAT) are significantly increased when plants are exposed to stress for a long period of time [10], and those species or cultivars with stronger antioxidant enzyme systems exhibit higher tolerance to stress [11].
The process of photosynthesis in leaves is fundamental to biomass production and crop yields [12]. Like most stresses, adverse pH stress is toxic to the photosystem because it inhibits chlorophyll synthesis, destroys thylakoid membrane and chloroplast structure, and hinders photosynthetic electron transport chains (ETCs) [13,14,15]. Electrons become oversupplied when photosynthesis is inhibited under stress conditions, in turn causing excess ROS production and affecting plant growth [10]. In tea plants, a pH of 2.5 was shown to reduce the number of chloroplasts, alter stomatal density and size, and suppress gene expression related to photosynthesis and carbohydrate metabolites [16]. In soybeans, soil acidity caused the disorganization of grana lamellae and decreased the number of thylakoids [17]. Stomatal closure was enhanced and chlorophyll content was reduced under salt and alkali stress in alkaline grasslands, and the two factors together caused a reduction in the net photosynthesis rate (Pn) [18]. Moreover, an extremely high or low pH leads to nutrient element unavailability, ion imbalances, damage to plant membranes, and osmotic stress, thereby inhibiting nutrient absorption and thus affecting plant growth, photosynthesis, and plant disease resistance [14,15,19].
Transcriptome technology is an important method that can be used to reveal the molecular mechanisms of plant responses and adaptability to stress. Using transcriptome techniques, a total of 855 differentially expressed genes (DEGs) associated with photosynthesis, cell walls, and phenylpropanoid metabolism have been found in woody plants, among which the majority of the DEGs related to photosynthesis are up-regulated under optimal pH conditions, including PSI and PSII reaction centers, ATP synthase, the cytochrome b6/f complex, and photosynthetic ETCs [13]. Although research on pH and plant growth has made some progress, there has been systematic studies and even less research on how plants adapt to adverse pH conditions. However, these gaps can be filled through the present research. Two representative pH stress conditions, pH 4.0 and 10.0, were selected to study the effects of acidic and alkaline conditions on a series of physiological processes and the related gene expression patterns in tree peony. The responses included plant growth, flowering, chlorophyll synthesis, photosynthesis, stomatal development and movement, nutrient assimilation and transport, hormone synthesis and signal transduction, and ROS signaling, and metabolism elimination. The results are expected to reveal the mechanism of acidic and alkaline toxicity to tree peony plants and the mechanism of plant adaptation to pH stress.

2. Results

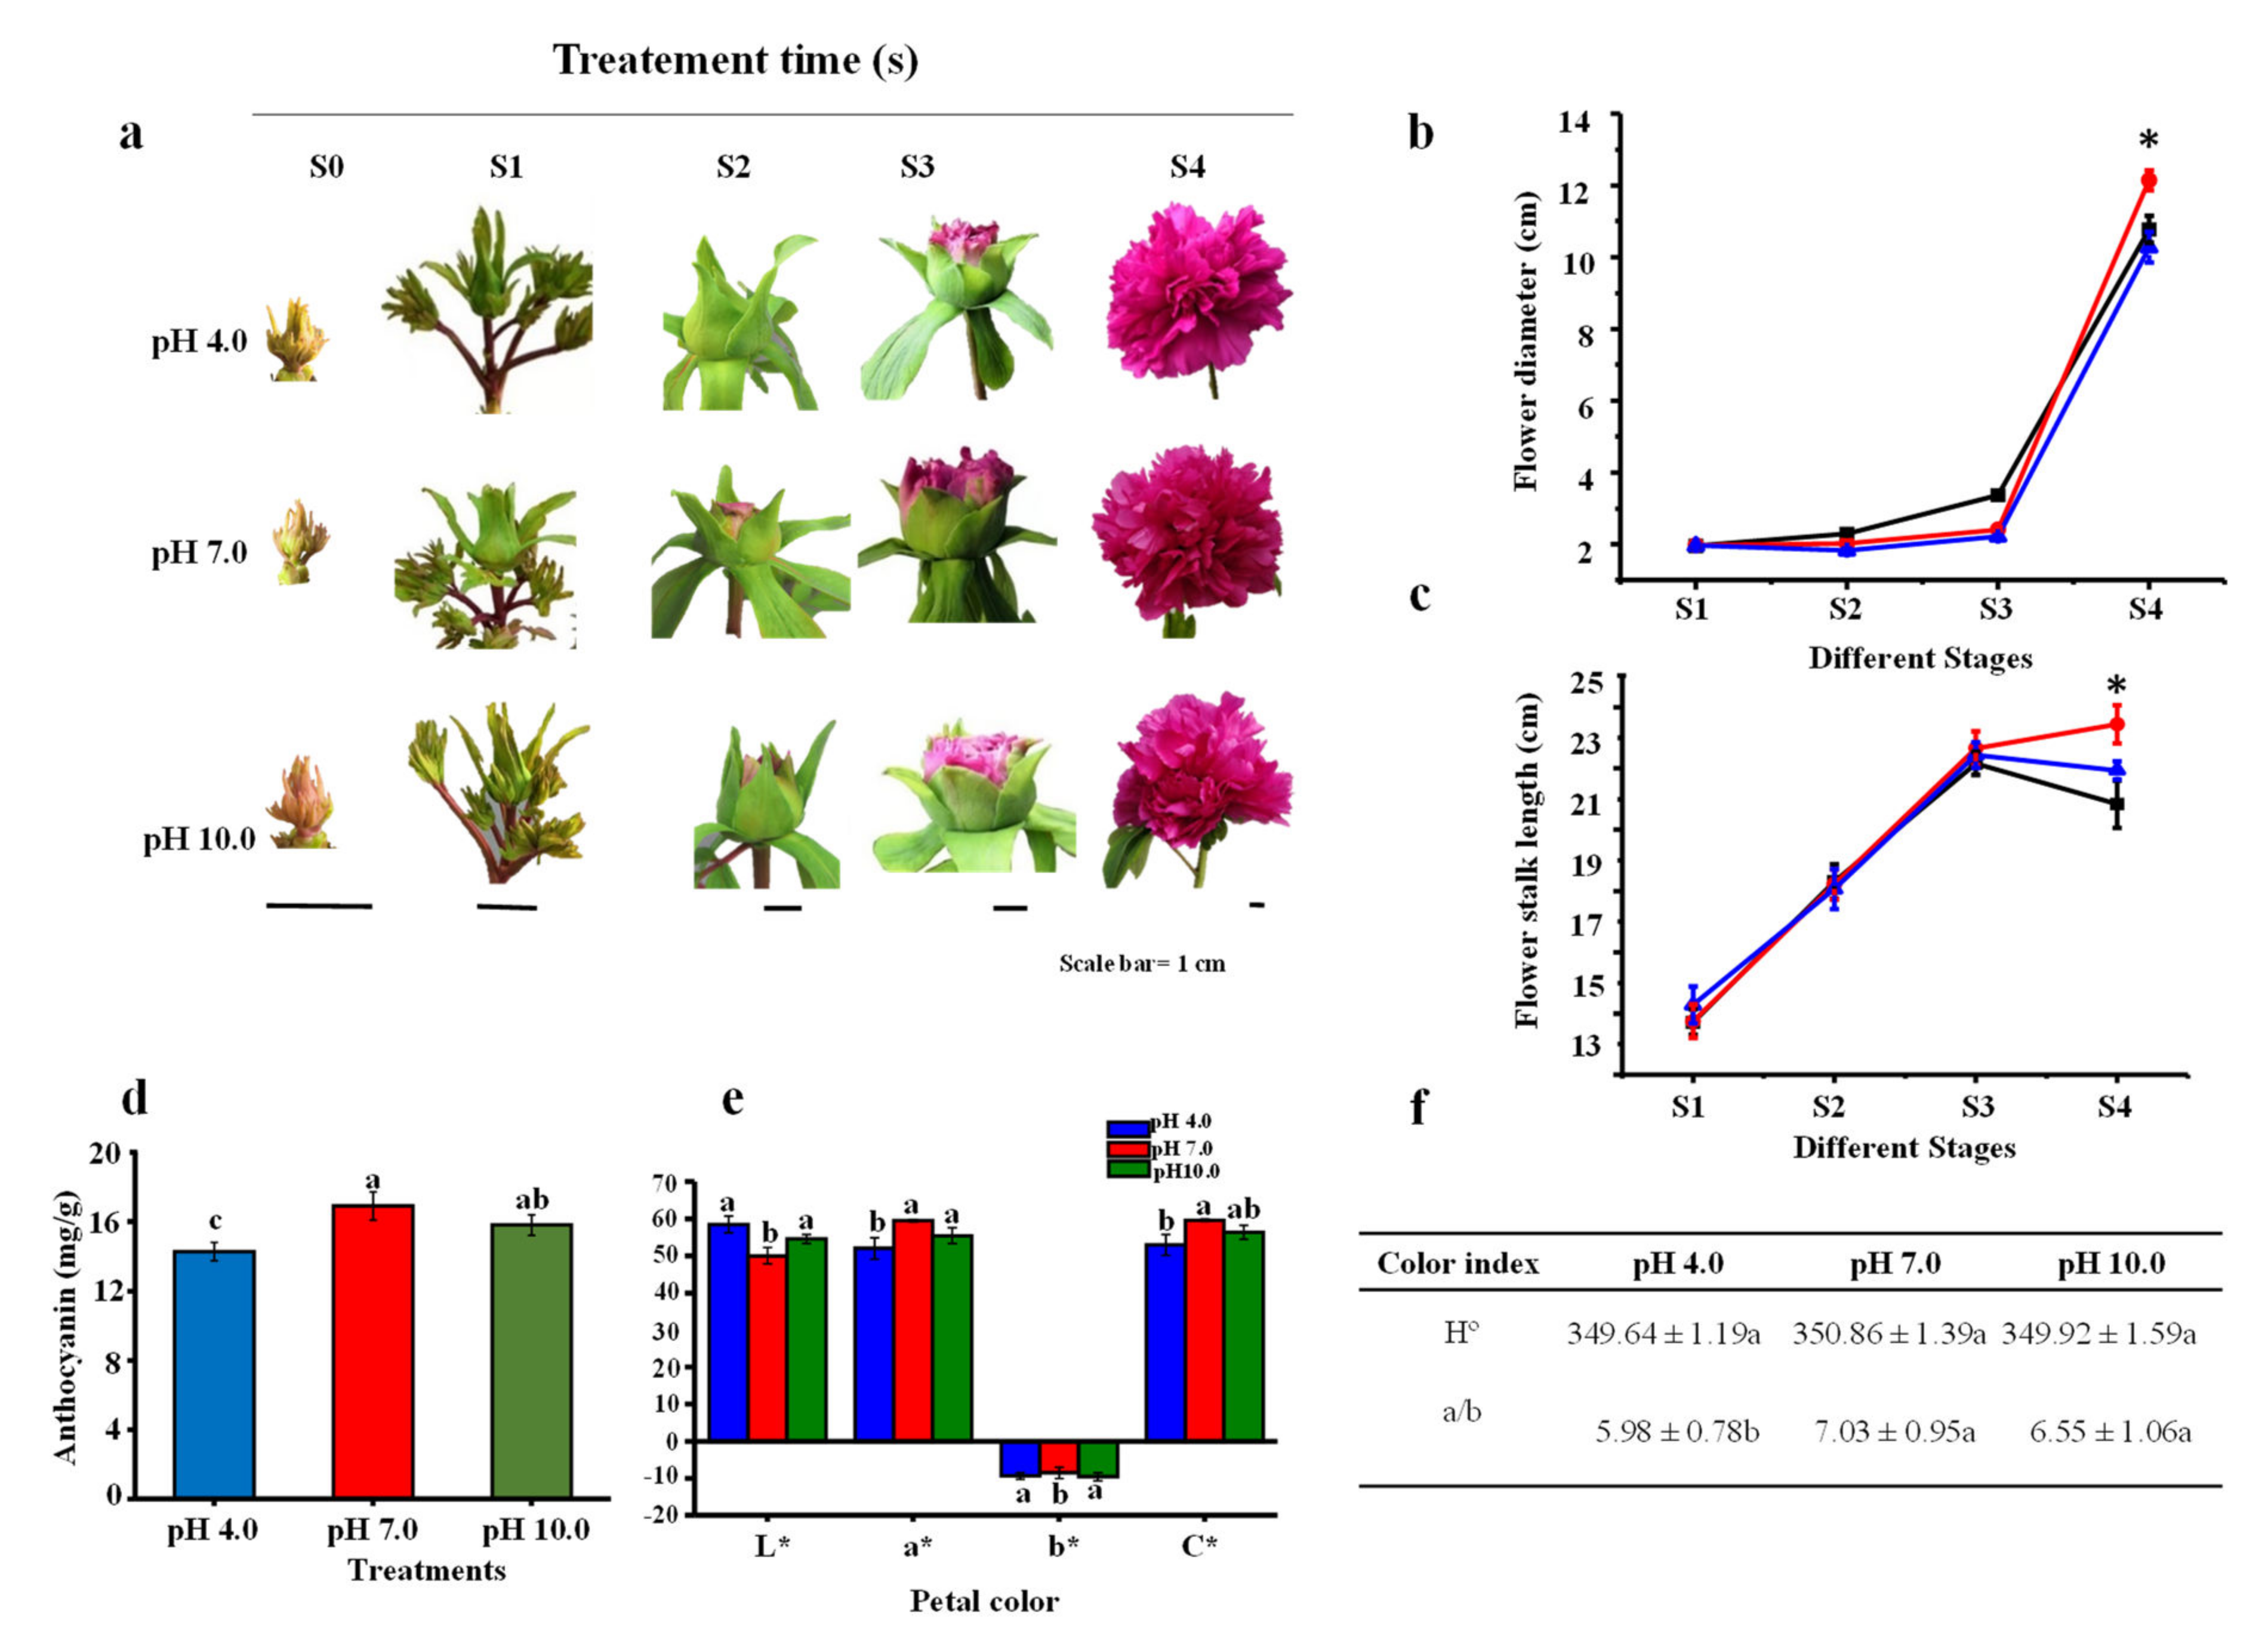
2.1. Morphological Parameters and Anthocyanin Content in Flowers

The morphological flower parameters were observed at the four stages from the bud initiation stage to the flowering stages (Table 1 and Figure 1). The results showed that the developmental process of tree peony was delayed under acidic and alkaline treatments, especially under acidic conditions (Figure 1a). Flower growth parameters, including flower diameter and stalk length, gradually increased from bud initiation until the flowering stage (Figure 1b,c). Flower diameter and stalk length had no significant differences among the three treatments during the first three stages (S1–S3), while alkaline and acidic treatments greatly decreased the growth rates of flower diameter and stalk length at the flowering stage (S4) compared to the controls (pH 7.0). Flower diameter, flower height, stalk length, stalk diameter, flower biomass, and the number of petals were reduced under alkaline and acidic conditions compared to the controls (Table 1).
Alkaline and acidic treatments also caused a rapid increase in the percentage of abnormal flowering, approximately 3.25 times and 4.13 times the percentage of controls in the acidic and alkaline stress groups, respectively (Table 1). Flower quality, especially the petal color, was also significantly affected. Color indices showed that under respective acidic and alkaline conditions, the L* value was enhanced by 14.5% and 8.34%, the a* value was decreased by 12.47% and 6.8%, and the C* value was reduced by 11.1% and 5.4%; additionally, the −b* value was increased by 11.6% compared to the controls (Figure 1e). The H° value showed no significant difference among treatments (Figure 1f). Anthocyanin content was significantly reduced under acidic conditions (15.44%) and not significantly under alkaline conditions (9.67%) (Figure 1d). The higher L* value and lower a* and C* values were responsible for the color fading of tree peony petals under acidic and alkaline conditions, and the effect was more serious under acidic conditions.

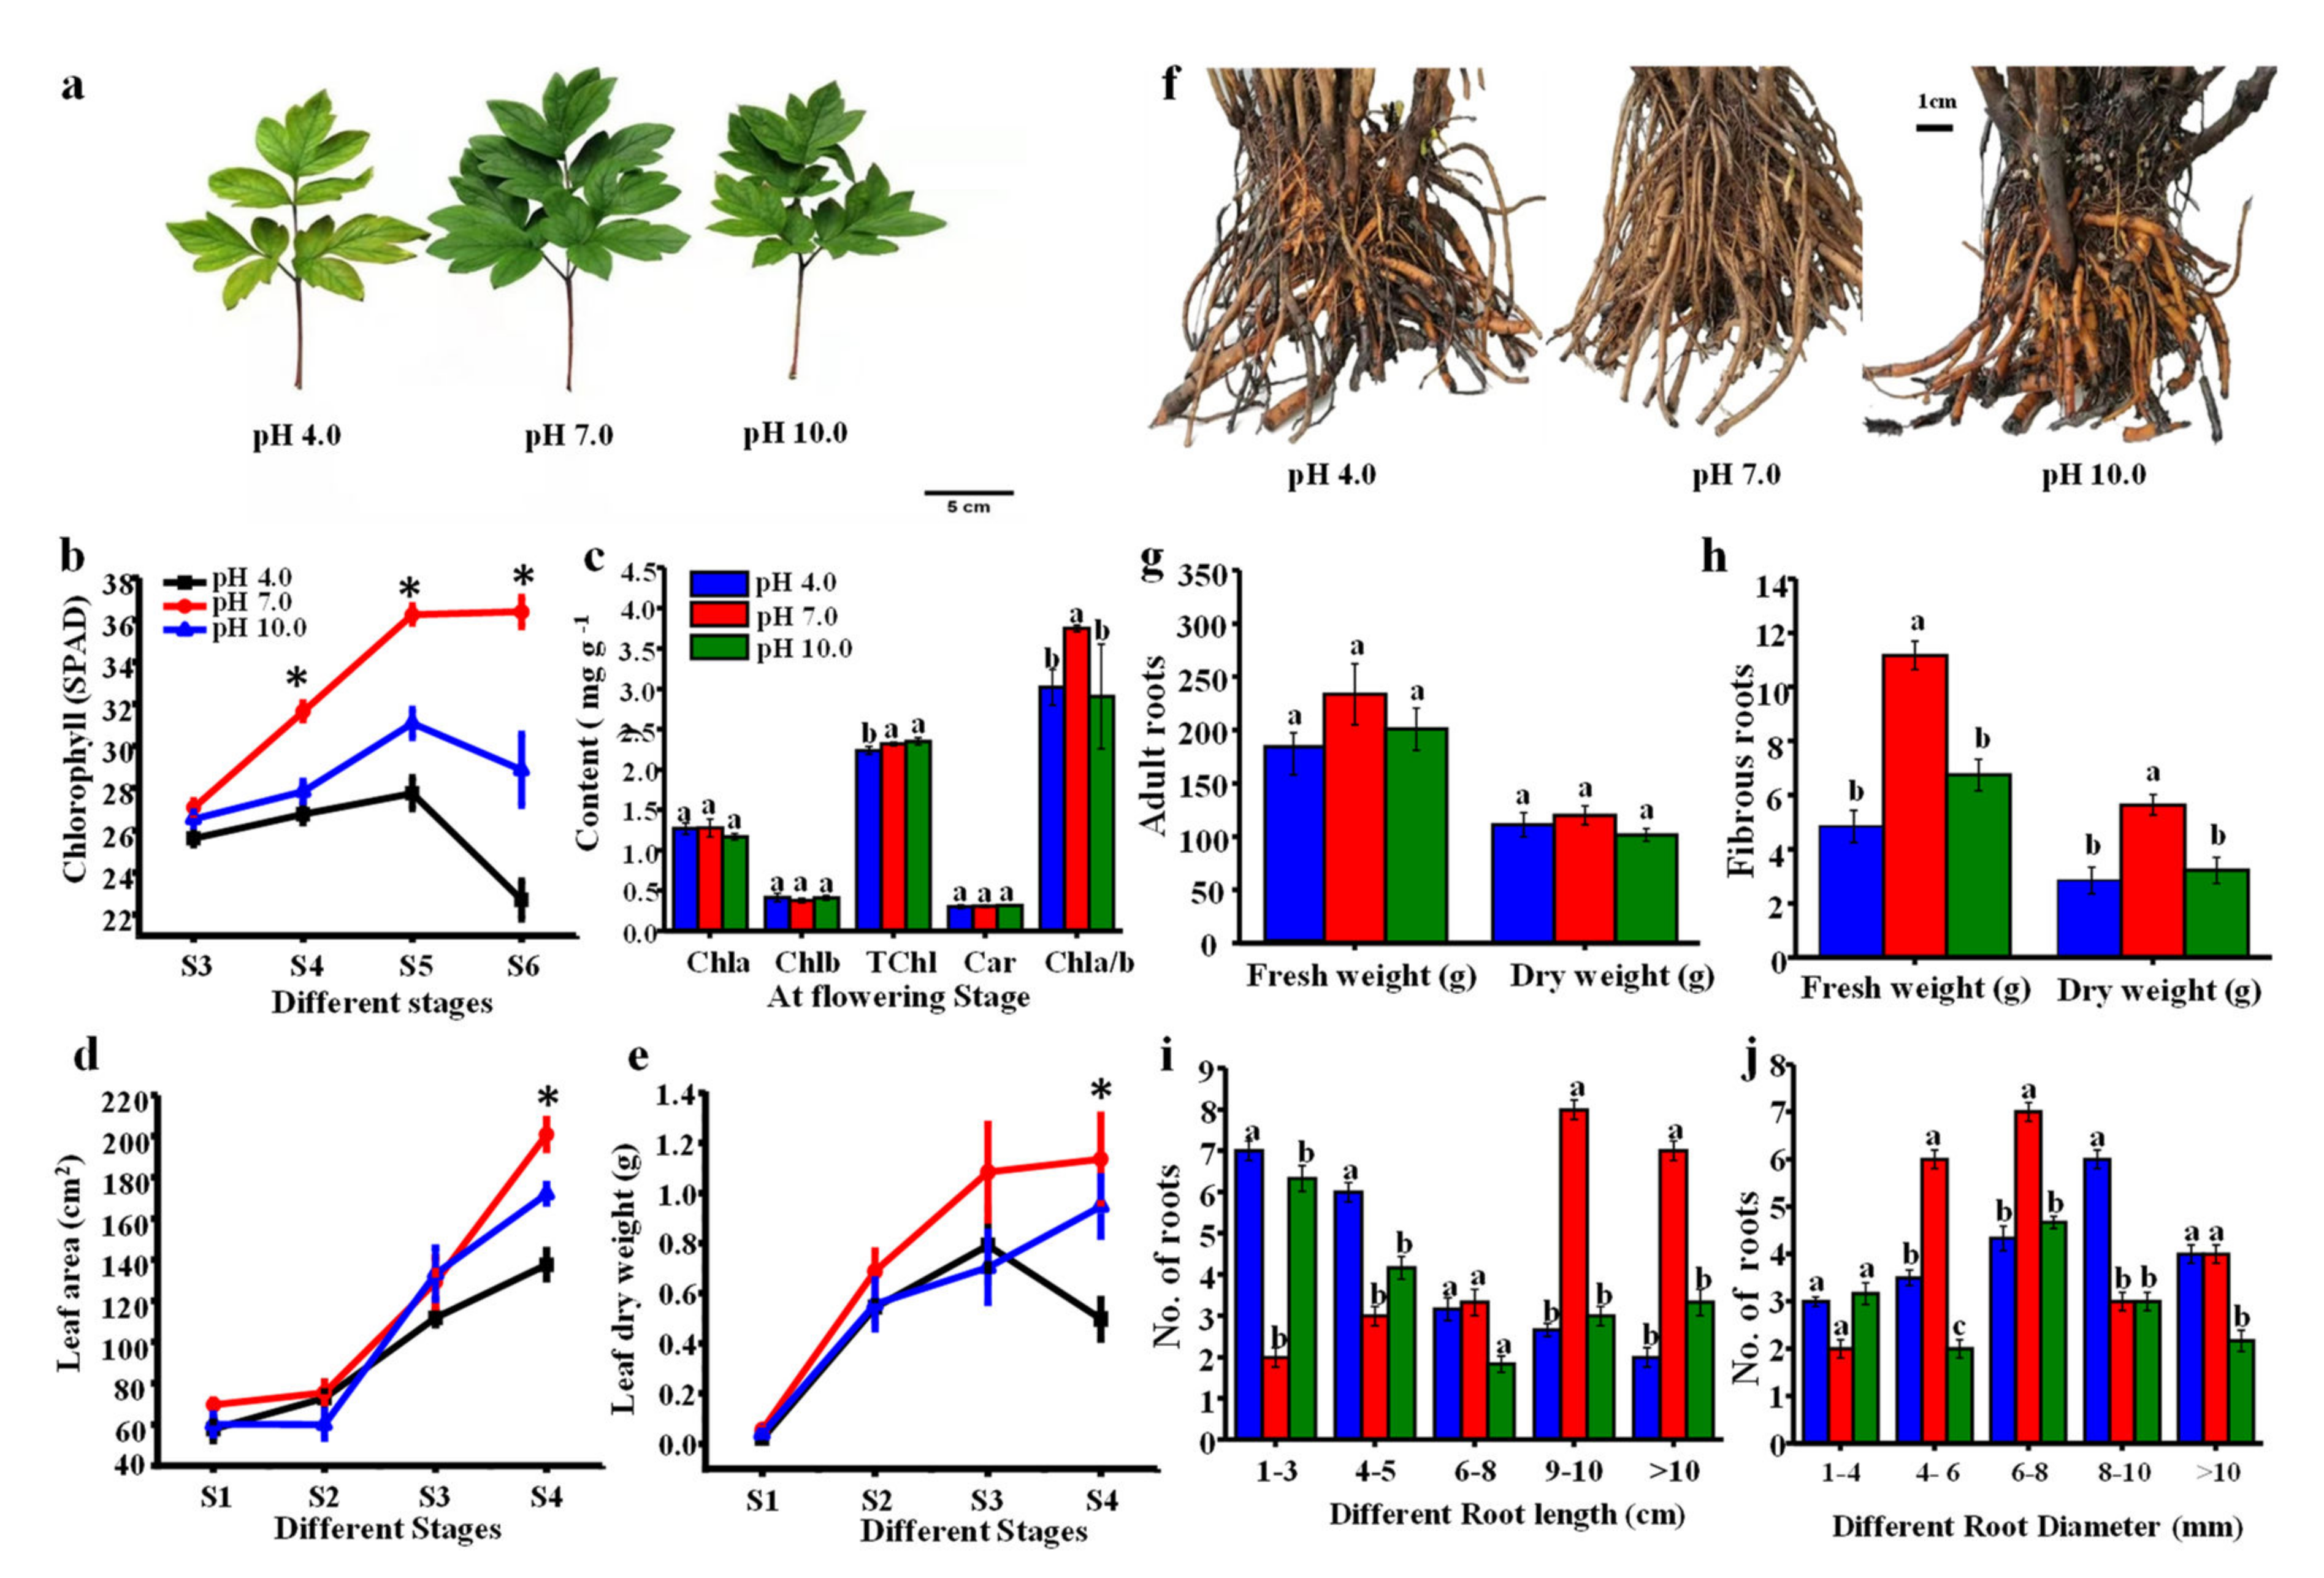
2.2. Morphological Parameters in Leaves and Roots

As shown in Figure 2a, leaves were significantly smaller under acidic and alkaline treatments, and leaf color turned yellow under acidic stress conditions. The chlorophyll level slowly increased from S3 to S5 and then dramatically decreased (from S5 to S6) in treated leaves of tree peony, especially under acidic conditions (Figure 2b). Compared to the control group, the chlorophyll level was significantly lower under acidic and alkaline treatments from the S4 to S6 stages. It appeared that chlorophyll was degraded in the later growth stages, and degradation was more severe under acidic conditions. Total chlorophyll (a + b) content was decreased under acidic conditions, while chlorophyll a, b, and carotenoid had no significant differences among treatments at stage S4. The ratio of chlorophyll a/b was reduced under both the acidic and alkaline treatments (Figure 2c). The leaf area and biomass all gradually increased under the three treatments (Figure 2d,e), and compared to the control group, there were significant reductions in both measures in the acidic and alkaline groups at stage S4.
As shown in Figure 2f, many fibrous roots rotted and the color turned abnormally dark brown in treated plants. The biomass of adult roots was slightly reduced, while the biomass of fibrous roots was significantly lower under acidic and alkaline conditions compared to the control group (Figure 2g,h): the fresh and dry weights of the roots were decreased by 23.6% and 7.25% under acidic treatment and by 13.9% and 15.16% under alkaline treatment compared to controls, respectively; the fresh and dry weights of new fibrous roots were decreased by 56.25% and 49.12% under acidic conditions and by 39.28% and 43.85%, respectively, under alkaline conditions compared to the controls. The root lengths in the acidic and alkaline groups were concentrated at around 1–3 cm (35% and 33.3%, respectively) and 4–5 cm (30% and 22.2%, respectively), while the root lengths in the control group were concentrated at around 9–10 cm (34.8%) and greater than 10 cm (30.4%) (Figure 2i). The diameter of adult roots was concentrated at around 4–6 cm (27.3%) and 6–8 cm (31.8%) in the control group. Root diameter was concentrated at around 6–8 cm (20%) and 8–10 cm (30%) under acidic conditions and was concentrated at around 6–8 cm (33.3%) under alkaline conditions (Figure 2j).

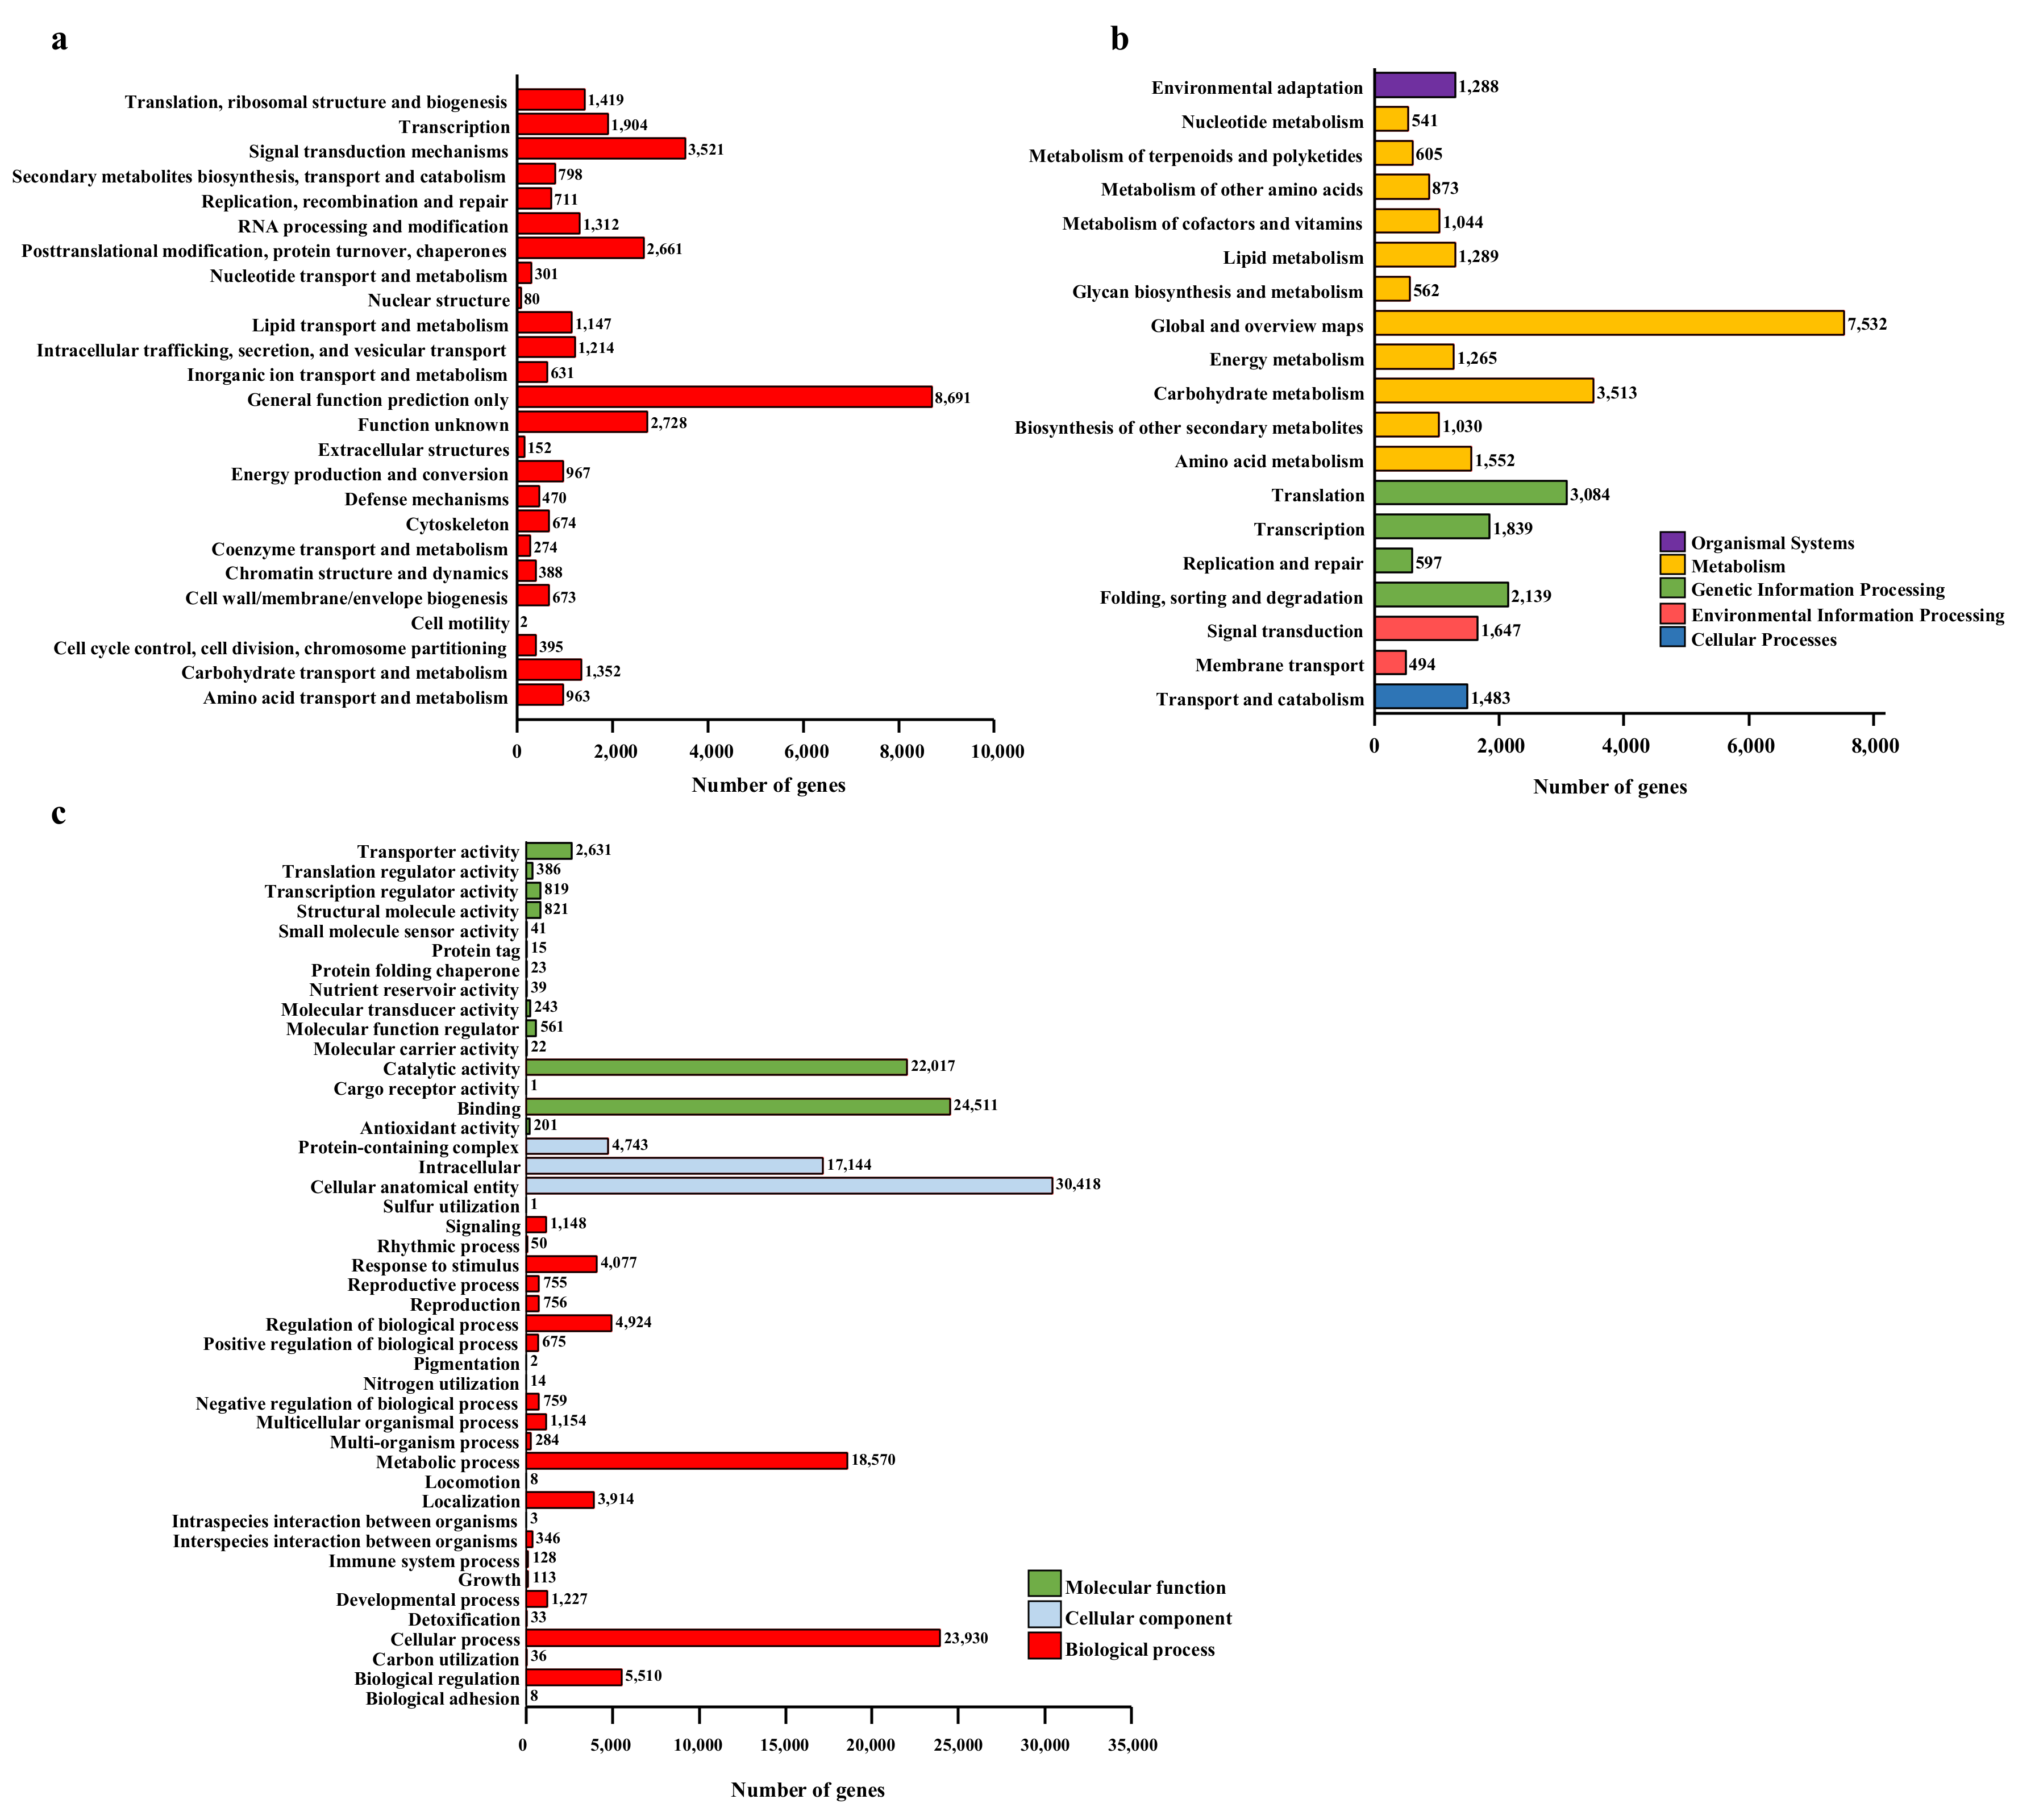
2.3. De novo Transcriptome Assembly, Identification of DEGs, and KEGG Pathway Analysis of DEGs

After the removal of ambiguous reads, adapter sequences, and low-quality reads, a total of 132,167 unigenes were assembled with average sequence length of 698 bp, an N50 length of 1317 bp, and a GC percentage of 39.02%. Among these assembled unigenes, 44,376 and 41,017 were annotated by the NR and NT databases, respectively; 31,208 could be annotated in Swiss-Prot, 33,675 were annotated in KEGG, 33,428 (25.29%) were annotated using KOG, 30,503 (23.08%) were annotated in the Pfam database, and 33,482 could be annotated in GO. A total of 4574 DEGs were identified in tree peony leaves following exposure to acidic conditions (pH 4.0) compared to the control (pH 7.0), of which 2858 were up-regulated and 1716 were down-regulated, and a total of 5006 DEGs were identified in tree peony leaves following exposure to alkaline conditions (pH 10.0) compared to the control, of which 1327 were up-regulated and 3679 were down-regulated (Figure S1a). The two groups (pH 4.0 vs 7.0 and pH 10.0 vs 7.0) shared 1510 DEGs (Figure S1b).
A total of 33,428 unigenes were assigned to 25 KOG functional classifications, among which ‘General function prediction only’ was the largest category (26.00%), followed by ‘Signal transduction mechanisms’ (10.53%), ‘Posttranslational modification’ (7.96%), ‘Transcription’ (5.70%), and ‘Translation’ (4.24%) (Figure 3a). Additionally, 1352 unigenes (4.04%) were assigned to ‘Carbohydrate transport and metabolism’, 976 (2.89%) unigenes were assigned to ‘Energy production and conversion’, and 631 (1.89%) unigenes were assigned to ‘Inorganic ion transport and metabolism’, a class that shared a relatively high percentage of genes among the categories. In addition, 32,377 unigenes were assigned to KEGG pathways (Figure 3b), among which ‘Metabolism pathways’ comprised 61.17%, followed by ‘Genetic information processing’ (23.66%), ‘Environmental information processing’ (6.61%), and ‘Cellular processes’ (4.58%). Further analyses showed that ‘Global and overview maps’ (23.26%), ‘Carbohydrate metabolism’ (10.85%), and ‘Translation pathway’ (9.53%) accounted for the greatest proportions. Furthermore, 173,061 unigenes were successfully annotated by GO assignments; these were classified into 44 functional groups belonging to three GO categories (Figure 3c): ‘Biological process’ (68,425; 39.54%), ‘Molecular function’ (52,331; 30.24%), and ‘Cellular component’ (52,305; 30.22%) (Figure 3c). Among ‘Biological process’, the top two categories were ‘Cellular process’ (23,930; 13.83%) and ‘Metabolic process’ (18,570; 10.73%). Among ‘Cellular component’, ‘Cellular anatomical entity’ (30,418; 17.58%) was the largest category. Within the ‘Molecular function’, the greatest numbers were involved in ‘Binding’ (24,511; 14.16%), ‘Catalytic activity’ (22,017; 12.72%), and ‘Transporter activity’ (2631; 1.52%).
A pathway enrichment analysis of DEGs based on the KEGG database with p < 0.05 as the threshold was performed to identify the functional consequences of gene expression changes associated with plant growth, flowering, photosynthesis, and stress. The results revealed that the most enriched pathways were ‘Metabolism pathways’, ‘Environmental information processing’, ‘Cellular processes’, ‘Carbohydrate metabolism’, ‘Energy production and conversion’, and ‘Inorganic ion transport and metabolism’. A total of 144 DEGs—including 35 DEGs related to growth, flowering, and its regulatory metabolism (Table 2); 75 DEGs related to photosynthesis (Table 3); 22 DEGs related to stress signal and tolerance (Table 4); and 12 DEGs related to iron transport (Table 4)—were identified after further analyses of top DEGs. Of the DEGs related to plant growth, flowering, and regulatory metabolism, five DEGs were found to be related to flowering, seven DEGs were found to be involved in plant growth, four DEGs were found to be related to hormone metabolism, three DEGs were found to be involved in signal transduction, and 16 DEGs were found to be related to the regulatory processes of transcription and translation. Photosynthesis-related gene expression was significantly affected by acidic and alkaline treatments; seven DEGs were shown to be involved in PSI, seven DEGs were shown to be involved in PSII, six DEGs were shown to be involved in light harvesting, 17 DEGs were shown to be involved in photosynthetic ETCs, seven DEGs were shown to be involved in thylakoid formation, six DEGs were shown to be involved in chlorophyll biosynthesis, 10 DEGs were shown to be involved in ATP synthesis, 11 DEGs were shown to be involved in carbon fixation, and three DEGs were shown to be involved in stomatal development and movement, indicating that acidity or alkalinity could affect both the light reactions and carbon fixation of photosynthesis, especially for photosynthetic ETCs.

2.4. Expression Profiles Analysis of Important DEGs Related to Growth and Flowering

The expression levels of flowering-related DEGs were significantly down-regulated under acidic and alkaline conditions (Figure 4). The expression levels of PAUSED (PSD, Unigene8_All) and two-component response regulator-like APRR1 (CL5436.Contig4_All) were significantly reduced by the acid and alkaline treatments. JMJ18 (CL1104.Contig4_All) and WUSCHEL-related homeobox 1 (WOX1, CL8062.Contig3_All) were both down-regulated under acidic conditions, while the flowering time control protein FY (CL8788.Contig3_All) was only down-regulated under alkaline conditions.
Accordingly, cell-division- and plant-growth-related genes were also suppressed under acidic and alkaline conditions. The expression levels of TOUGH (TGH, CL845.Contig2_All) and MIZU-KUSSEI 1 (MIZ1, CL9598.Contig2_All) were significantly reduced under alkaline conditions (Figure 4). B-box zinc finger protein 19 (BBX19) acts as a negative regulator of seedling photomorphogenesis [20]. Acidity and alkalinity increased the expression of BBX19 (CL856.Contig1_All), and exocyst complex component SEC10 (CL14716.Contig6_All) and callose synthase 7 (CALS7, CL542.Contig25_All) were down-regulated under both treatments. The expression level of cell division cycle protein 27 homolog B (CDC27B, CL7886.Contig1_All) was highly reduced under alkaline conditions, and tubulin alpha-5 chain (TUBA5, CL4204.Contig2_All) was decreased under acidic conditions.
One auxin biosynthesis (YUC, Unigene53925_All) and two signal transduction genes (TMK1, CL2731.Contig4_All; AFB2, CL789.Contig8_All) were significantly down-regulated under both treatments. As a negative regulator of the ethylene response pathway, CTR1 (CL7684.Contig1_All) was also down-regulated under both conditions. Three signal transduction pathway genes—CML38-like (Unigene2096_All), SK5 (CL5696.Contig3_All), and IQD14 (Unigene40182_All)—were significantly down-regulated under acidic and alkaline conditions, especially under acidic conditions. A total of 14 genes involved in transcription and translation regulation were down-regulated under acidic and alkaline conditions: BRASSINAZOLE INSENSITIVE PALE GREEN 2 (BPG2, CL6966.Contig2_All), transcription termination factor MTERF4 (CL4833.Contig7_All), shaggy-related protein kinase ASK1 (Unigene19526_All), BLH1 (CL1863.Contig5_All), FAR1-RELATED SEQUENCE 5-like (FRS, Unigene39555_All), and pre-mRNA-processing protein 40A (PRP40A) had extremely low expression levels under alkaline conditions, and methyl-CpG-binding domain (MBD, Unigene46268_All), pre-mRNA-processing-splicing factor 8A (PRP8A, Unigene23105_All), eukaryotic translation initiation factor 3 subunit F (eIF3f, Unigene39851_All), and squamosa-binding protein-like 39 (SPL39, CL6274.Contig5_All) were not expressed under acidic conditions; MBD7 (CL7329.Contig2_All), YRDC (CL3635.Contig6_All), splicing factor U2af large subunit B (U2AF65B, CL12897.Contig1_All), and G-box-binding factor 3 (GBF3, CL1061.Contig4_All) had no detectable expression under both treatments. Acidic and alkaline conditions increased the expression levels of argonaute 1 (AGO1, CL4080.Contig4_All) and replication factor C subunit 1 (RFC1, CL4788.Contig6_All), two genes involved in gene silencing regulation.

2.5. Effect of Irrigation pH Treatment on the Photosynthetic Characteristics

The results regarding photosynthetic characteristics showed that the Pn initially increased and then decreased in all three treatments, with a peak at S5 (Figure 5a). The Pn was significantly weakened under acidic and alkaline conditions compared to the control in all stages, and this effect was much stronger under acidic conditions. The Tr, Gs, and WUE were also reduced by the treatments compared to the control group, with the lowest levels under acidic conditions (Figure 5b,c,e). Nevertheless, the change trend of Ci showed no significant differences among the three treatments (Figure 5d), which suggested that acidic and alkaline conditions could substantially reduce the Pn, Gs, and WUE while affecting Ci, and acidity could apparently do more damage to tree peony photosynthesis than alkaline conditions. Accordingly, soluble sugar was significantly decreased under acidic conditions (20.15%), even though the starch content had no significant differences among treatments (Figure 5f). The soluble protein was significantly reduced under acidic (23.46%) and alkaline (8.46%) treatments compared to the controls.

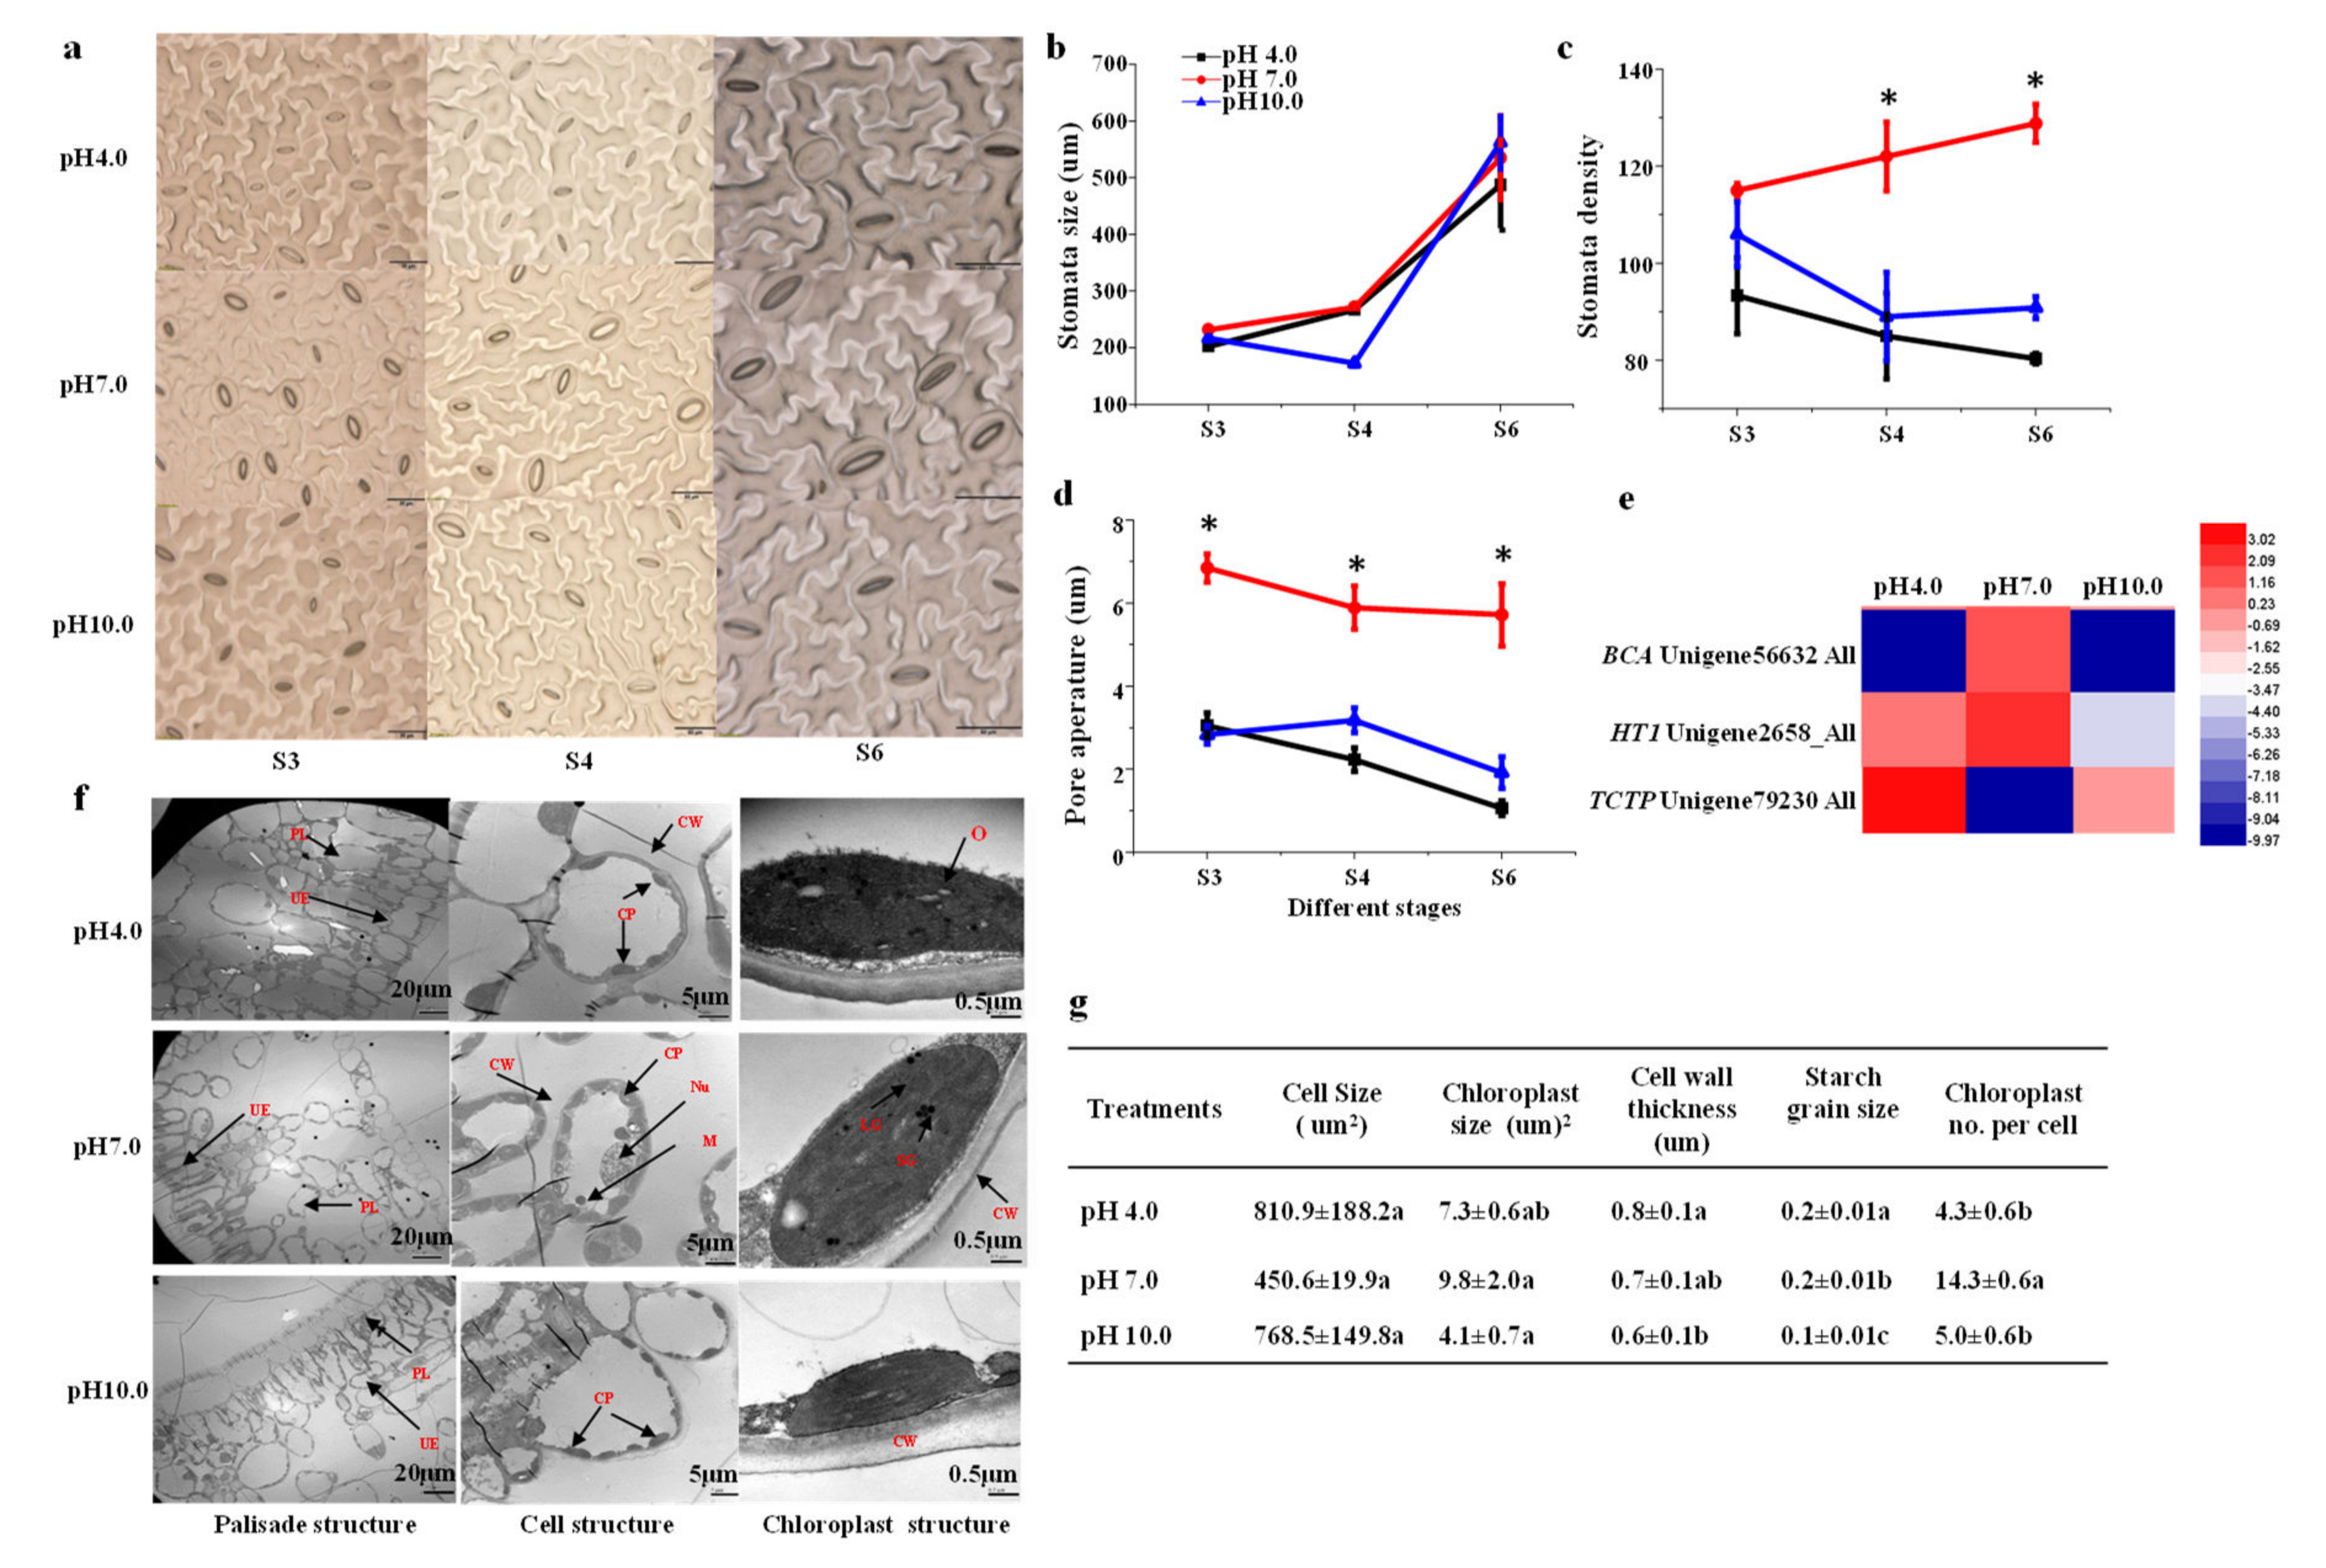
2.6. Stomata Characteristics and Leaf Structure

Stomata play critical roles in photosynthesis. The results showed that stomata size (including guard cell length, guard cell pair width, stomata length, and stomata width) increased with the growth of the tree peony, but there were no significant differences among treatments (Figure 6a,b and Table S3). Stomatal number and density were significantly reduced under acidic and alkaline conditions compared to those of the control from the S4 to S6 stages: the stomatal density was reduced by 18.84% and 7.82% at S3, 30.32% and 27.04% at S4, and 37.64% and 41.87% at S6, respectively, under acidic and alkaline conditions (Figure 6a,c). Moreover, in all three stages, the pore aperture declined under the acidic and alkaline treatment conditions by 55.47% and 55.68% at S3, 62.13% and 46.01% at S4, and 81.64% and 66.6% at S6, respectively, compared to that of the control (Figure 6d).
There were clear differences in internal leaf structure among the three treatments: the results showed that the leaves of the plants grown under acidic and alkaline conditions were thinner, with loose palisade tissue and irregularly arranged spongy mesophyll cells; the leaves in the control group showed the most compact leaf palisade parenchyma, and cell wall thickness was reduced under alkaline conditions. In addition, the shape of palisade mesophyll cells was also affected by the treatments, tending to be round instead of elliptical (Figure 6f,g). The number, size, shape, and the ultrastructure of the chloroplast were influenced by both the acidic and alkaline conditions (Figure 6f). As shown in Figure 5g, despite the cell size having no significant differences among the three treatments, the numbers of chloroplasts per cell were significantly decreased by 69.9% and 65.03% under the acidic and alkaline conditions, respectively, in comparison to the control group. Chloroplast size was also reduced under the acidic and alkaline conditions. The chloroplasts in leaves from the control group had a highly organized inner membrane system; many grana thylakoids were regularly distributed with plentiful grana lamellae, and osmiophilic granules were dispersed and fewer in number. In contrast, the stacks of grana disappeared from the chloroplasts in the yellow leaves grown under the acidic and alkaline conditions. These chloroplasts had only a few stromal thylakoid membranes remaining, along with clusters of osmiophilic granules. The structures of thylakoid membranes in these chloroplasts were extremely disordered. The structures of the stromal lamella and basal lamella in chlorophyll under acidic and alkaline stress were unclear, and the starch granules were not tightly arranged. Under the acidic and alkaline conditions, the numbers of lipid droplets, basal lamellae, and osmophilic granules were much lower in leaf cells grown and the matrix lamella was looser. Starch grain size was decreased under the alkaline conditions.
Stomatal development and movement genes were affected by both treatments. Beta carbonic anhydrase (BCA) is involved in the CO2 signaling pathway that controls gas-exchange between plants and the atmosphere by modulating stomatal development and movement [21,22]. Serine/threonine/tyrosine-protein kinase HT1 is involved in the control of stomatal movement in response to CO2 and functions as a major negative regulator of CO2-induced stomatal closing [23]. Exposure to acidity and alkalinity were found to result in the significant down-regulation of BCA (Unigene56632_All) and HT1 (Unigene2658_All). Translationally-controlled tumor protein (TCTP) is involved in the regulation of abscisic acid- and calcium-mediated stomatal closure, and acidity and alkalinity enhanced the expression of TCTP (Unigene79230_All).

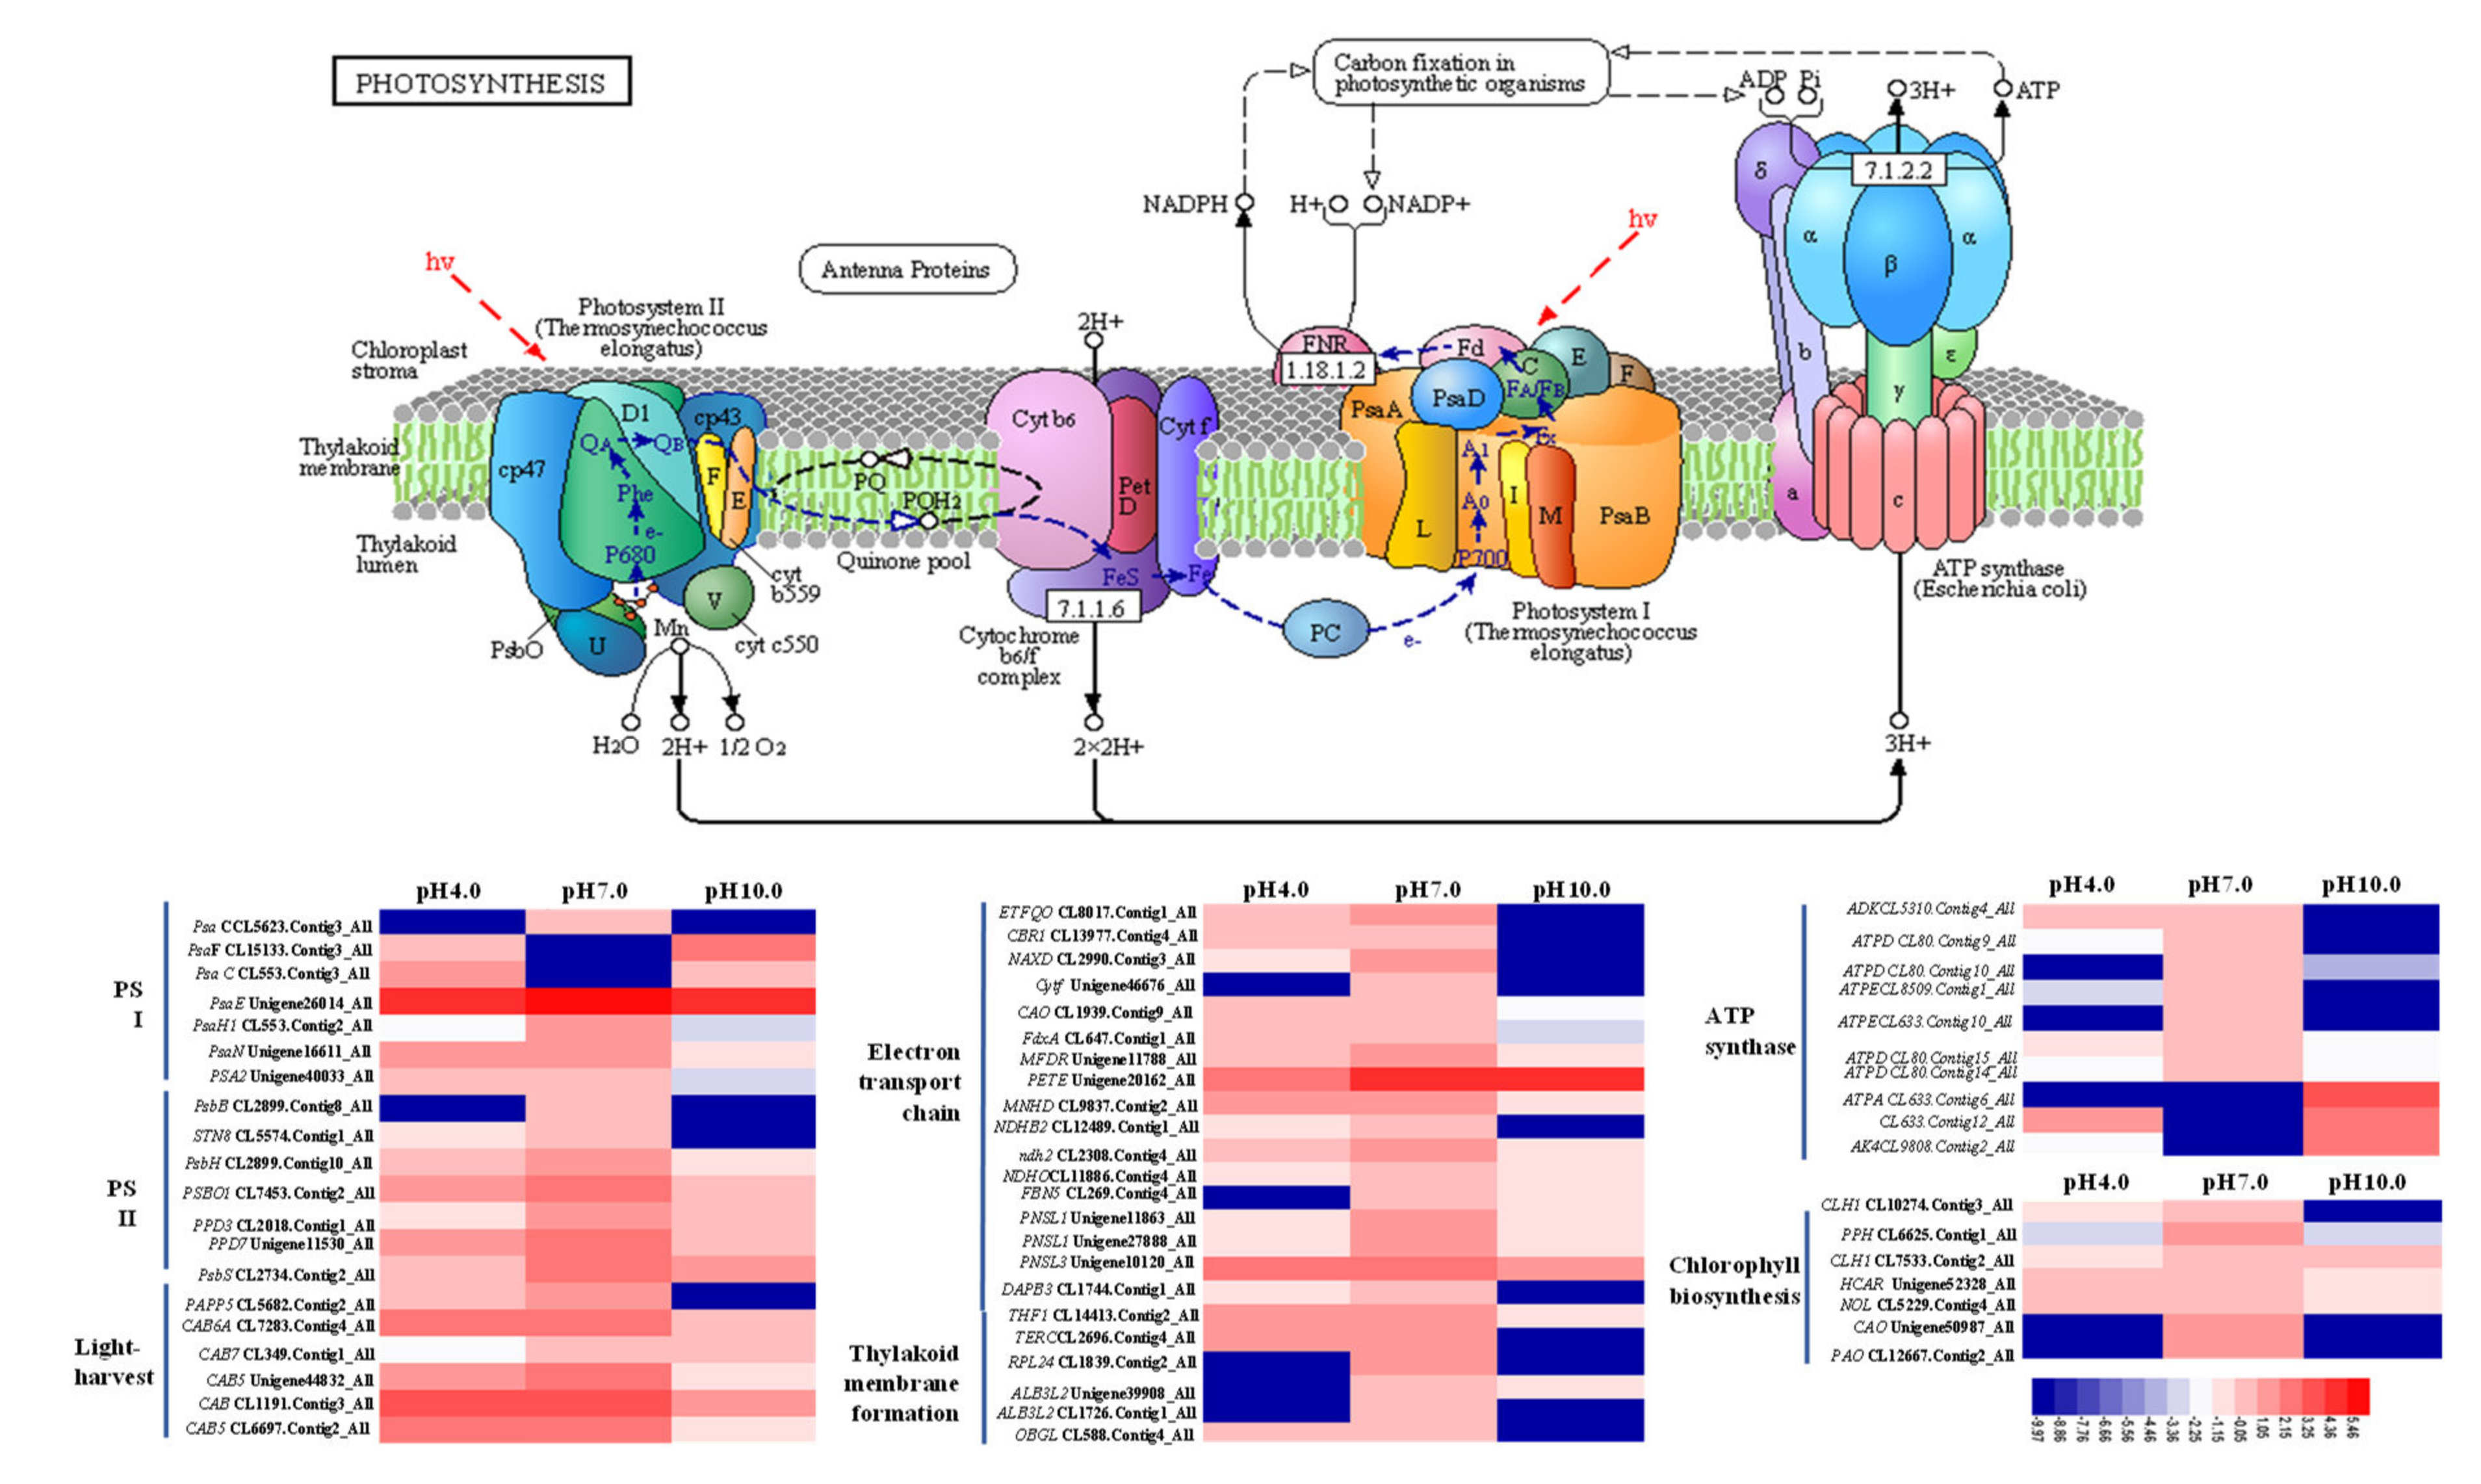
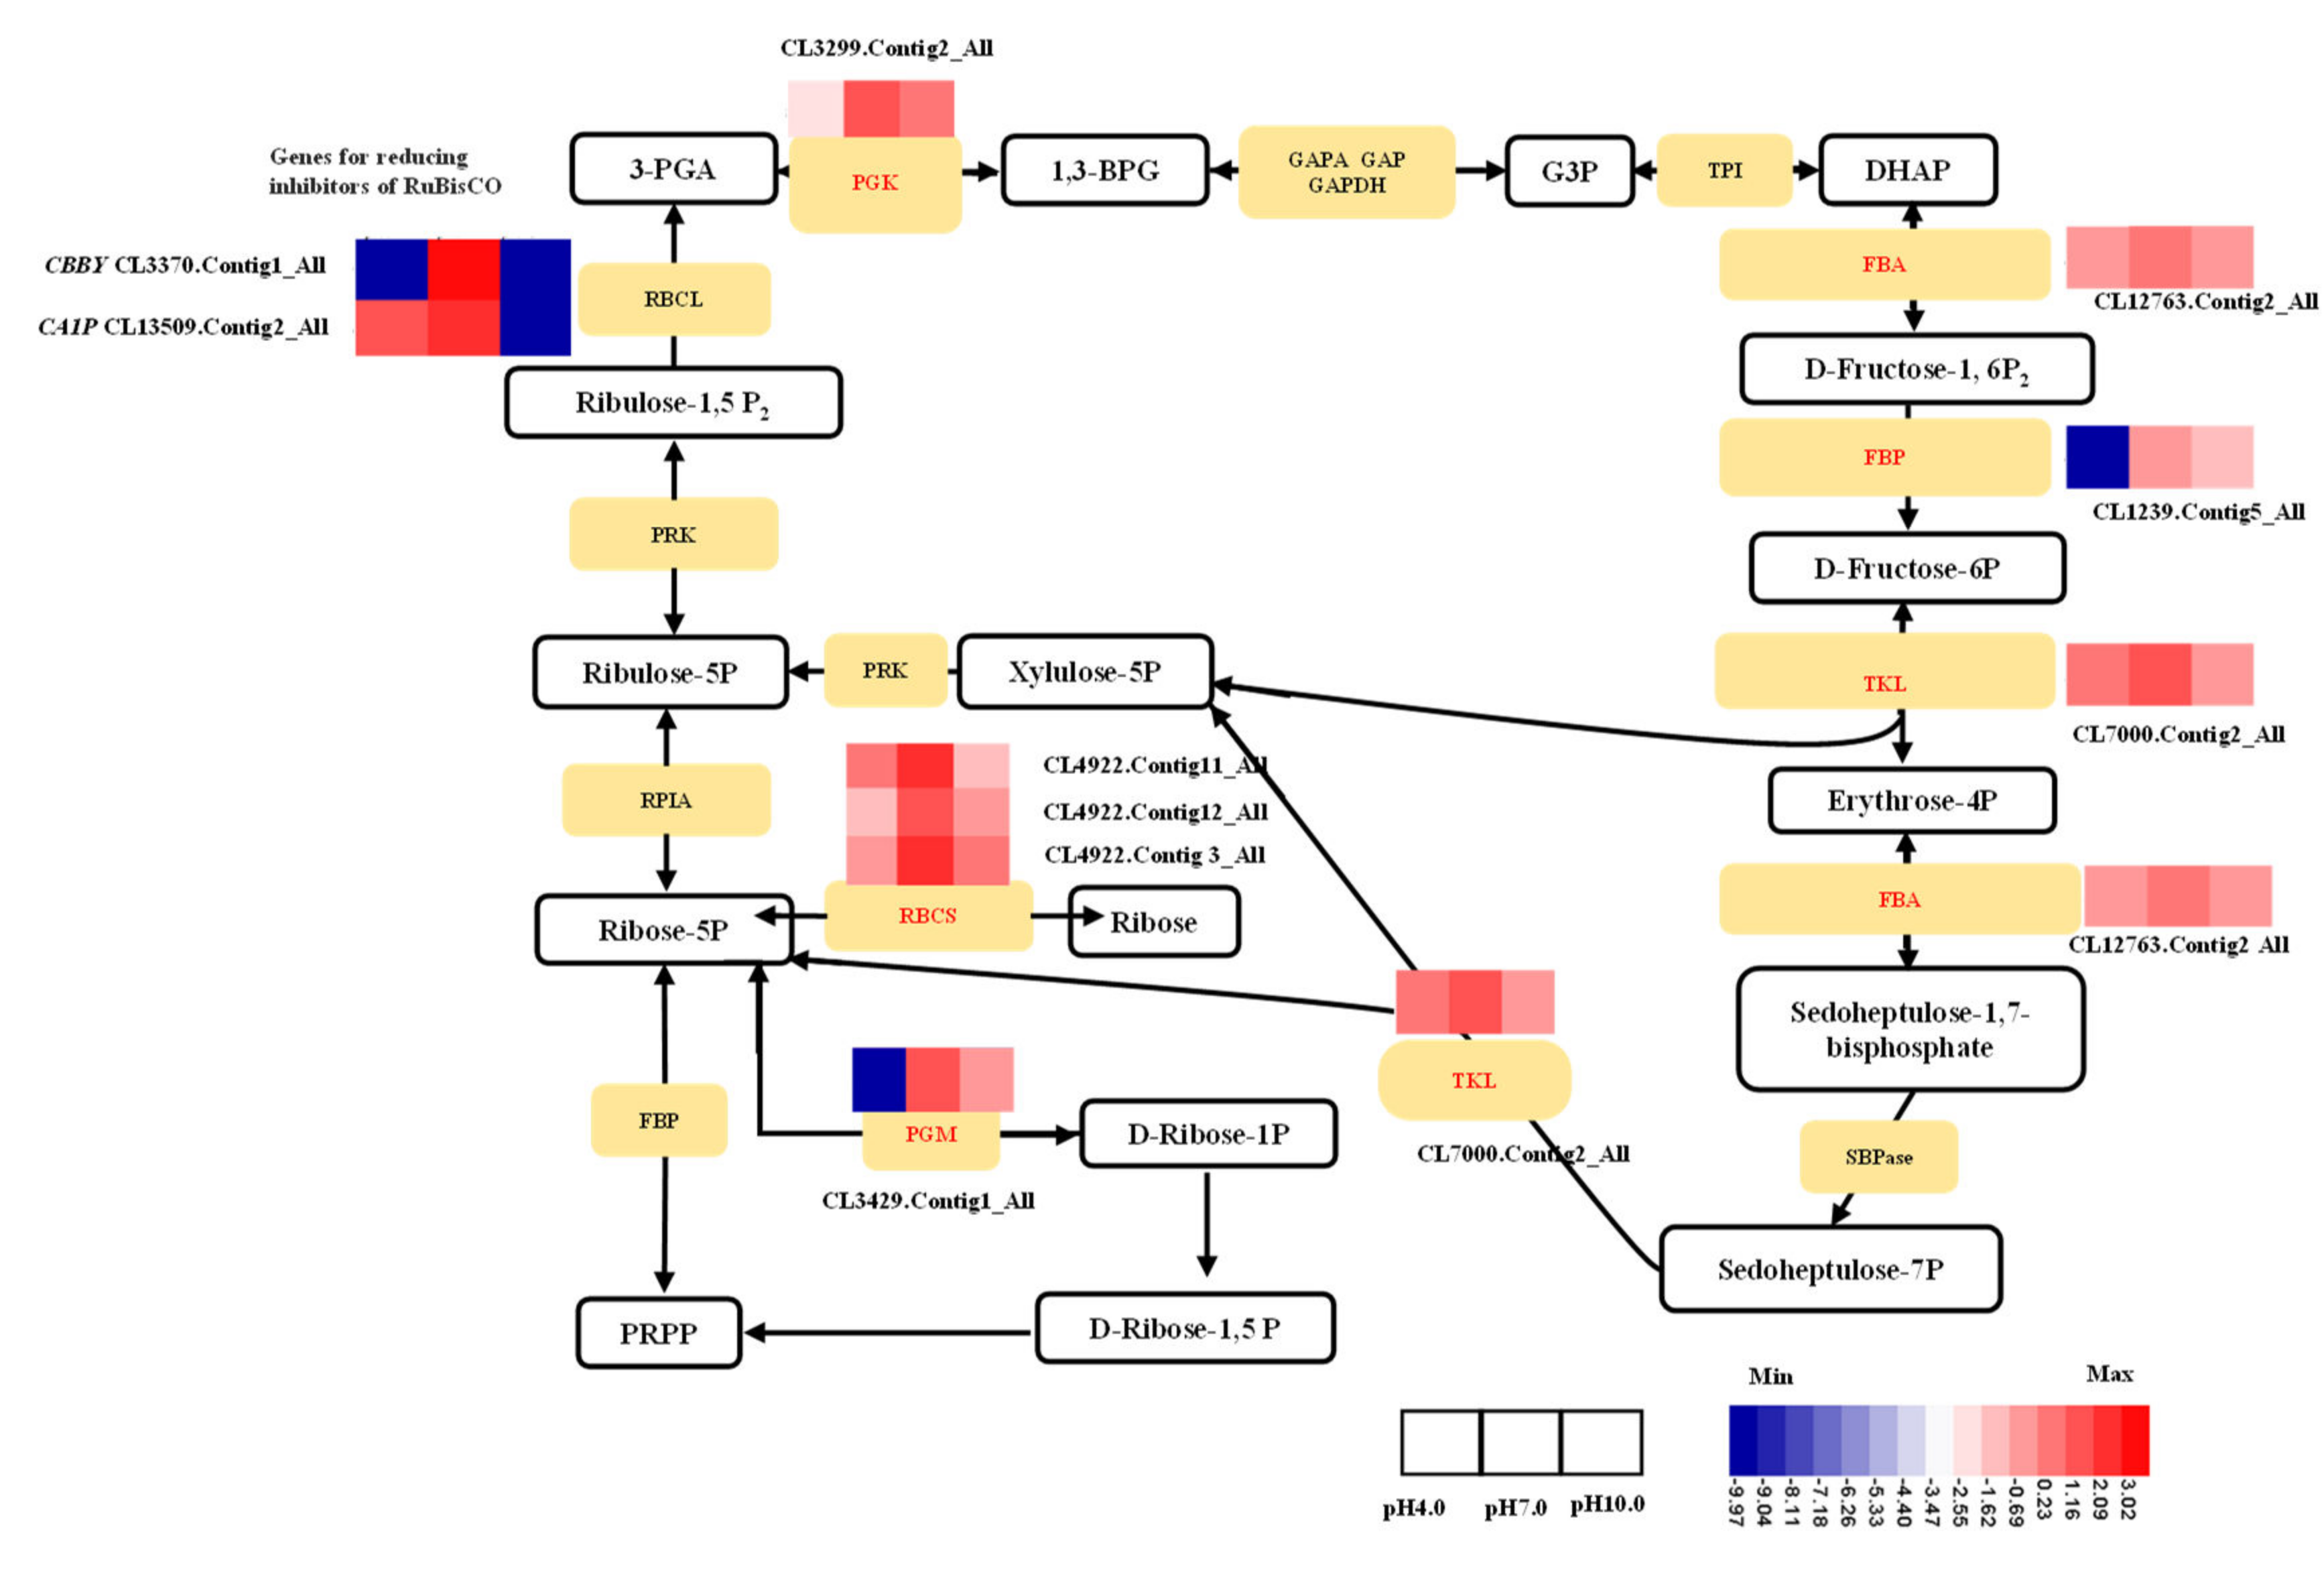
2.7. Expression Profiles Analysis of Important DEGs in Photosynthesis

Acidic and alkaline conditions significantly reduced gene expression related to the light reactions of photosynthesis (Figure 7), including 5 PSⅠ genes (Photosystem I iron-sulfur center (PSAC), CL5623.Contig3_All; photosystem I reaction center subunit IV (PSAE), Unigene26014_All; photosystem I reaction center subunit VI (PSAH1), CL553.Contig2_All; photosystem I reaction center subunit N (PSAN), Unigene16611_All; and PHOTOSYSTEM I ASSEMBLY 2 (PSA2), Unigene40033_All), seven PSⅡ genes (Photosystem II protein D2 protein (PSBB), CL2899.Contig8_All; serine/threonine-protein kinase STN8, CL5574.Contig1_All; photosystem II phosphoprotein PSBH, CL2899.Contig10_All; oxygen-evolving enhancer protein 1 (PSBO1), CL7453.Contig2_All; psbP domain-containing protein 3 (PPD3), CL2018.Contig1_All; PPD7, UniGene 11530_All; photosystem II 22 kDa (PSBS), CL2734.Contig2_All), 5 light-harvest genes (serine/threonine-protein phosphatase 5 (PAPP5), CL5682.Contig2_All; chlorophyll a-b binding protein (CAB6A), CL7283.Contig4_All; CAB7, CL349.Contig1_All; CAB, UniGene 44832_All, CL1191.Contig3_All; and CL6697.Contig2_All)), 17 ETC genes (electron transfer flavoprotein-ubiquinone oxidoreductase (ETFQO, CL8017.Contig1_All; cytochrome b5 reductase 1 (CBR1), CL13977.Contig4_All; ATP-dependent NAD(P)H-hydrate dehydratase (NAXD), CL2990.Contig3_All; cytochrome f (CYTF), Unigene46676_All; chlorophyllide a oxygenase (CAO), CL1939.Contig9_All; 3Fe-4S ferredoxin (FDXA), CL647.Contig1_All; NADPH: adrenodoxin oxidoreductase MFDR, Unigene11788_All; plastocyanin-like (PETE), Unigene20162_All; NADH-Ubiquinone/plastoquinone complex I (MNHD), CL9837.Contig2_All; NADH-plastoquinone oxidoreductase subunit 2 (NDHB2), CL12489.Contig1_All; quinone oxidoreductase (NDH2), CL2308.Contig4_All; NAD(P)H-quinone oxidoreductase subunit O (NDHO), CL11886.Contig4_All; fibrillin-5 (FBN5), CL269.Contig4_All; photosynthetic NDH subunit of lumenal location 1 (PNSL1), Unigene11863_All, Unigene27888_All; PNSL3, UniGene 10120_All; dihydrodipicolinate reductase-like DAPB3, CL1744.Contig1_All)), and 5 thylakoid membrane formation genes (THYLAKOID FORMATION 1 (THF1), CL14413.Contig2_All; thylakoid membrane TERC, CL2696.Contig4_All; 50S ribosomal protein L24 (RPL24), CL1839.Contig2_All; ALBINO3-like protein 2 (ALB3L2), Unigene39908_All, CL1726.Contig1_All; OBG-like GTPase (OBGL), CL588.Contig4_All); see Figure 6. In addition, several ATP synthase genes (ATP synthase delta chain (ATPD), CL80.Contig9-15_All; ATP synthase CF1 epsilon chain (ATPE), CL8509.Contig1_All; and CL633.Contig10_All) and chlorophyll biosynthesis genes (magnesium chelatase subunit I (CHLI1), CL10274.Contig3_All; pheophytinase (PPH), CL6625.Contig1_All; chlorophyll a oxygenase (CAO), Unigene50987_All) were highly repressed under acidic and alkaline conditions. Adenylate kinase (ADK, CL5310.Contig4_All) was reduced under alkaline conditions. Chlorophyllase-1-like (CLH1, CL7533.Contig2_All) was suppressed under acidic conditions, while the expression levels of 7-hydroxymethyl chlorophyll a reductase (HCAR, UniGene 52328_All) and chlorophyll(ide) b reductase (NOL, CL5229.Contig4_All) were slightly decreased under alkaline conditions. The expression levels of ATP synthase CF1 alpha subunit (ATPA, CL633.Contig6) and adenylate kinase 4 (AK4, CL9808.Contig2_All) were enhanced under the alkaline conditions, and the levels of ATPA (Contig 12_All) were enhanced under both treatments.
Both the acidic and alkaline conditions also suppressed the expression of 11 genes in the Calvin cycle of photosynthesis, including bifunctional riboflavin kinase/FMN phosphatase CBBY (CL3370.Contig1_All), 2-carboxy-D-arabinitol-1-phosphatase CA1P (CL13509.Contig2_All), phosphoglycerate mutase 2 (PGM2, CL3429.Contig1_All), ribulose bisphosphate carboxylase small chain (RBCS, CL4922.Contig3, Contig11, and Contig12), phosphoglycerate kinase (PGK, CL3299.Contig2_All), fructose-bisphosphate aldolase (FBA, CL12763.Contig2_All), fructose-1,6-bisphosphatase (FBP, CL1239.Contig5_All), 6-phosphofructo-2-kinase/fructose-2,6-bisphosphatase (PFKFB, UniGene 23926_All), and transketolase (TKL, CL7000.Contig2_All) (Figure 8).

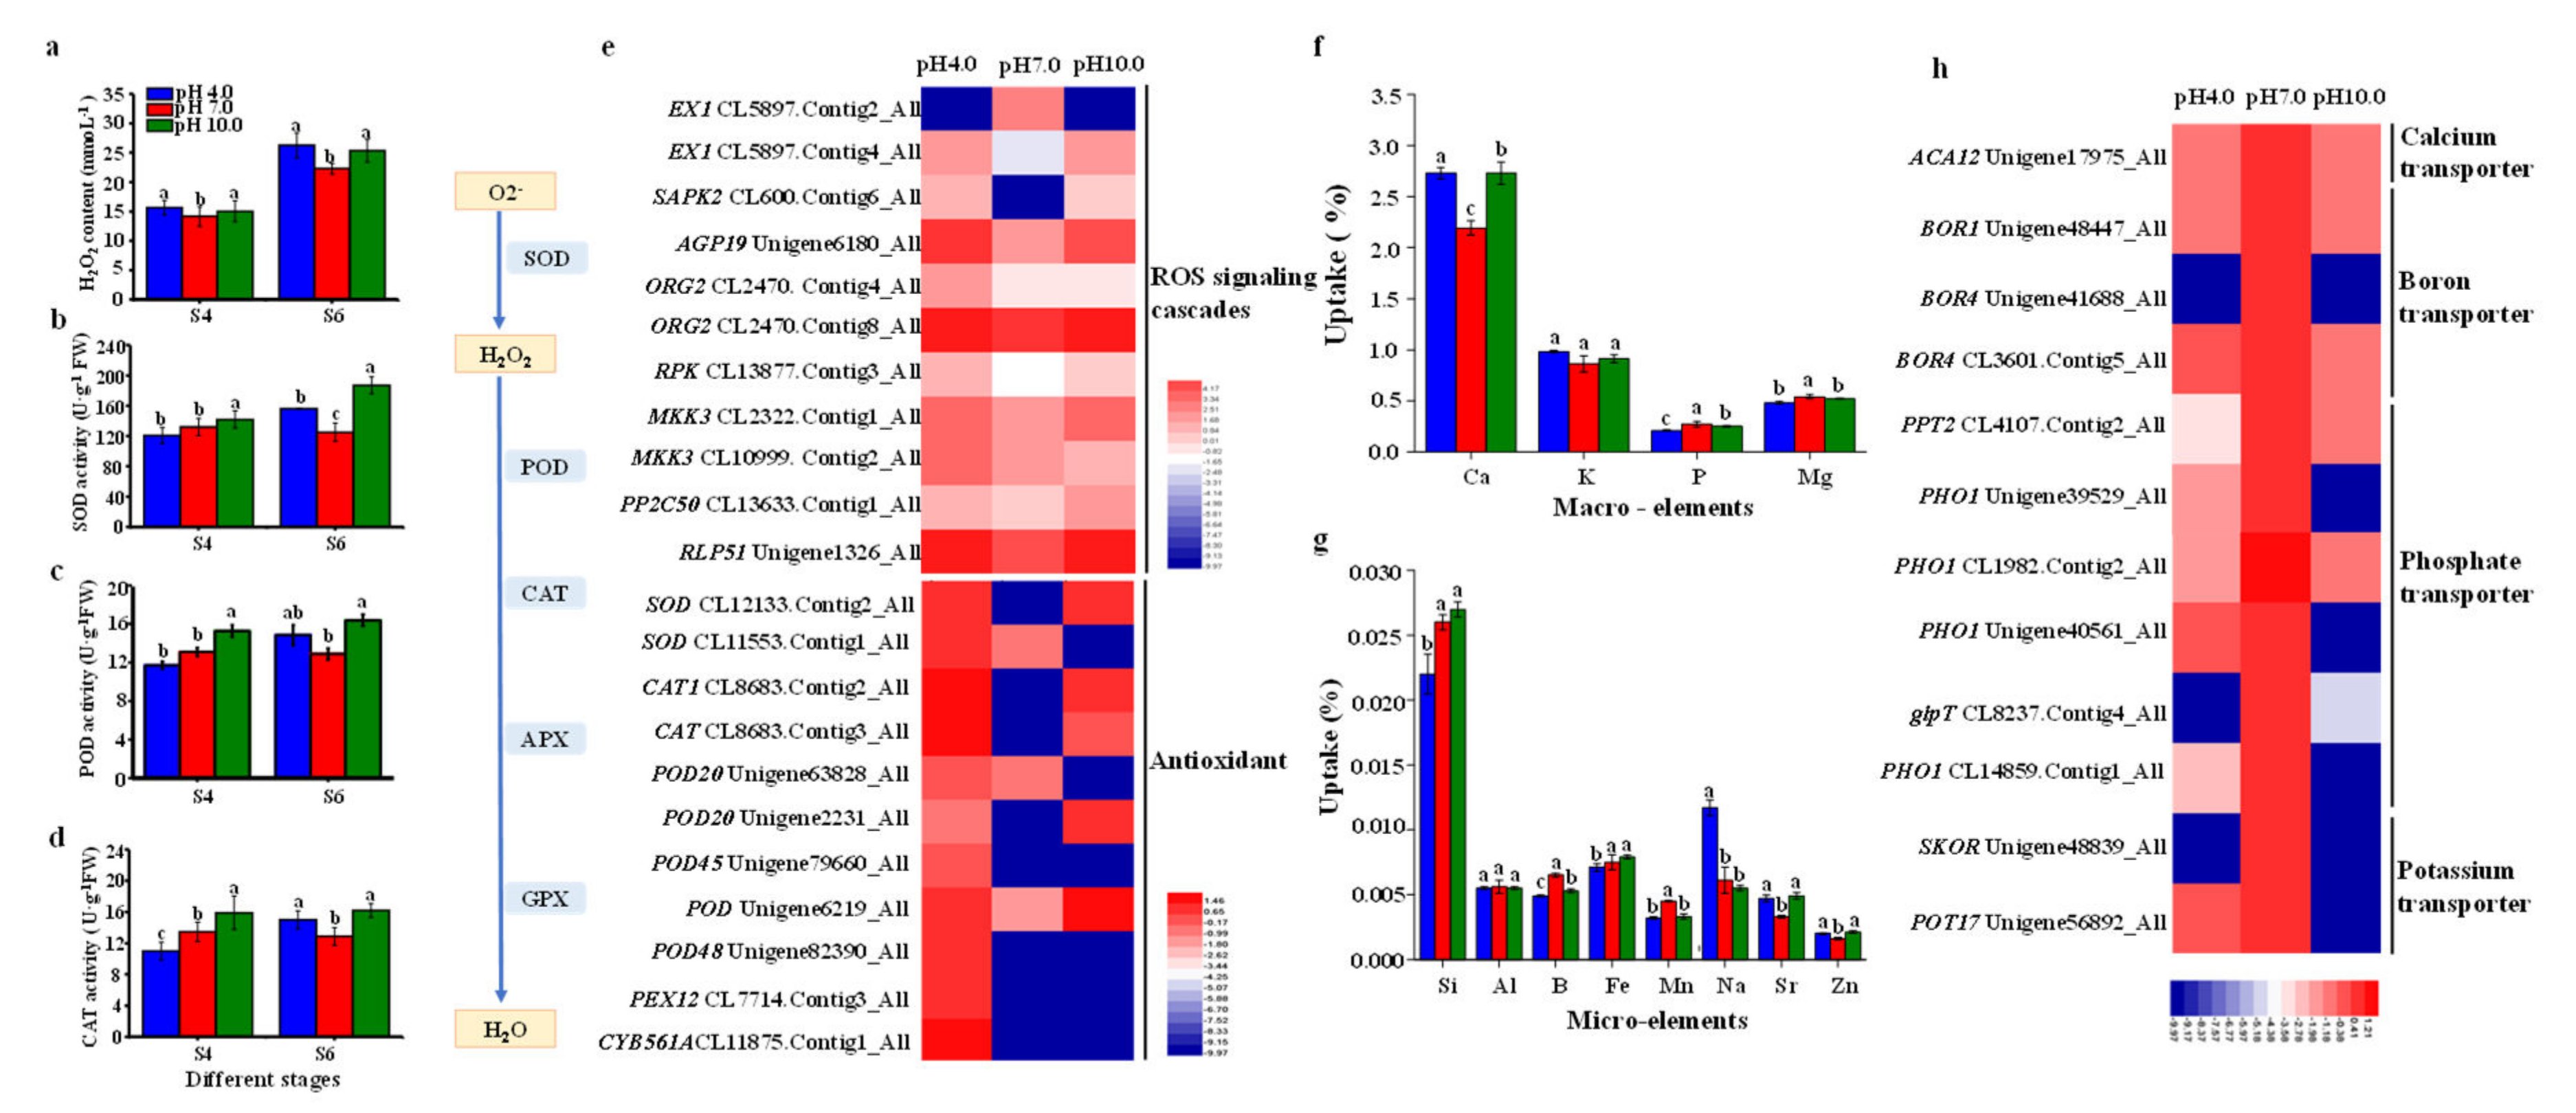
2.8. The Activities of Enzymes, Nutrient Assimilation, and Expression Profiles of Key Genes in ROS Scavenging Pathway and Nutrient Transport

The level of hydrogen peroxide (H2O2) was significantly increased by 8.19% and 6.78% at S4 and by 16.53% and 10.59% at S6 under the acidic and alkaline conditions, respectively, compared to that of the control group (Figure 9a). Most of DEGs involved in ROS signaling cascades, including one EXECUTER 1 (EX1, CL5897.Contig2_All), one Serine/threonine-protein kinase 2 (SAPK2, CL600.Contig6_All), one Lysine-rich arabinogalactan protein 19 (AGP19, Unigene6180_All), two Transcription factor ORG2 (CL2470.Contig4_All, CL2470.Contig8_All), one LRR receptor-like serine/threonine-protein kinase (RPK, CL13877.Contig3_All), two Mitogen-activated protein kinase kinase 3 (MKK3, CL2322.Contig1_All, CL10999.Contig2_All), one Protein phosphatase 2C 50 (PP2C50, CL13633.Contig1_All), and one Receptor-like protein 51 (RLP51, Unigene1326_All) genes were enhanced under both the acidic and alkaline conditions.
The activities of superoxide dismutase (SOD), peroxidase (POD), and catalase (CAT) were significantly enhanced under the alkaline conditions at S4 and being enhanced under both the acidic and alkaline conditions at S6, with a higher level in the latter group: SOD activity increased by 23.97% and 48.60%, POD activity increased by 15.16% and 27.00%, and CAT activity increased by 24.49% and 32.42% at S6 under the acidic and alkaline conditions, respectively (Figure 9b–d). Acidity and alkalinity resulted in the significant up-regulation of the expression levels of SOD (CL12133.Contig2_All), CAT (CL8683.Contig2_All), and POD (Unigene2231_All, Unigene79660_All, Unigene6219_All) genes. One SOD (CL11553.Contig1_All) gene, three POD (Unigene63828_All, Unigene26867_All, and Unigene82390_All) genes, one peroxisome biogenesis protein 12 (PEX12, CL7714.Contig3_All) gene, and one transmembrane ascorbate-dependent reductase CYB561A (CL11875.Contig1_All) gene were up-regulated only under the acidic conditions (Figure 9e).
The results of the nutrient analysis showed that the uptake of P was reduced by 22.22% and 7.4% while the uptake of magnesium (Mg) was decreased 11.11% and 3.7%, respectively, under the acidic and alkaline conditions compared to the controls (Figure 9f). The uptake of K had no significant differences among treatments, but calcium uptake was enhanced in leaves grown under both the acidic and alkaline conditions. The uptake rates of B and Mn were significantly decreased in the adverse pH groups compared to the control group, especially in the acidity group with reductions of 24.81% and 28.88%, respectively (Figure 9g). The assimilation rate of Fe was only reduced under the acidic conditions, with a reduction of 5.33%. The uptake of Si was also inhibited under the acidic conditions in comparison to the control group, but it was increased under the alkaline conditions. Thus, nutrient assimilation, especially for those elements related to photosynthesis and flowering, was reduced under both treatment conditions. The effect was more serious under acidity compared to that under alkalinity. Nutrient transporter genes including one calcium-transporting ATPase 12 (ACA12, Unigene17975_All) gene, three boron transporter (BOR1, Unigene48447_All; BOR4, Unigene41688_All, and CL3601.Contig5_All) genes, six phosphate transporter (PPT2, CL4107.Contig2_All; PHO1, Unigene39529_All, CL1982.Contig2_All, Unigene40561_All, and CL14859.Contig1_All; and glycerol-3-phosphate transporter 1, glpT1, CL8237.Contig4_All) genes, one potassium transporter 17 (POT17, Unigene56892_All) gene, and one potassium channel SKOR (Unigene48839_All) gene were down-regulated under both the acidic and alkaline conditions (Figure 9h).

3. Discussion

3.1. Inhibition of the Growth and Development of Tree Peony Plants Exposed to Acidic and Alkaline Stresses

Acidic and alkaline stresses limit plant growth and development by disturbing numerous physiological processes, including photosynthesis, ionic homeostasis, ROS balance, and the antioxidant system [24]. Acidity stress significantly suppresses root growth, reduces root diameter, and decreases the biomass of rice seedlings [8,25]. Alkaline stress markedly reduces survival percentage and total biomass and inhibits root growth [26,27]. In this study, we observed the severe inhibition of tree peony growth under both the acidic and alkaline conditions, and tree peony was found to be better adapted to alkaline conditions than acidic conditions. Flowering was inhibited and petal color became faded under acidic and alkaline conditions in Ipomoea nil [28] and Paeonia lactiflora [6], consistent with our results. To determine the internal molecular mechanism, we analyzed gene expression related to plant growth and flowering. PSD and WOX1 are required for shoot apical meristem growth [29]. APRR1 controls the photoperiodic flowering response [30]. JMJ18 and FY are involved in the control of flowering time [31,32]. The expression of most genes related to flowering, including PSD, APRR1, JMJ18, WOX1, and FY, were found to be reduced in tree peony grown under acidic and alkaline conditions, explaining why flowering was delayed and the flower quality was greatly reduced. TOUGH (TGH) and MIZU-KUSSEI 1 (MIZ1) are required for plant growth and development [33,34]. Consistent with the flowering genes, TGH and MIZ1 were also significantly down-regulated under adverse pH conditions. The cell-division-related genes SEC10, CDC27B, and CALS7 [35,36] were also down-regulated in tree peony under both the acidic and alkaline conditions, explaining the reason for the suppression of plant growth as affected by adverse pH conditions. TUBA5 is important for the synthesis of microtubules, and microtubules play crucial roles in plant adaptation to stressful environments [37]. The expression of the microtubule synthesis gene TUBA5 was much higher under alkaline conditions than under acidic conditions, a result that may explain why the tree peony grown under alkaline conditions displayed stronger tolerance. Auxin plays an important role in controlling various aspects of plant growth and development [38]. The genes in plant hormone signal transduction pathways are significantly inhibited by highly acidic conditions in tea plants [16]. In tree peony leaves, the expression levels of genes related to auxin biosynthesis and transduction, including TUC, TMK1, and AFB2, were also significantly reduced under acidic and alkaline treatments. Transcription and translation are signs of cellular activity. High levels of transcription and translation accelerate plant growth, development, and metabolism. The present study showed that most of the transcription and translation regulation genes were also suppressed under both the acidic and alkaline conditions. In contrast, the adverse pH conditions raised the possibility of gene silencing through transcriptional and post-transcriptional regulations. Transcription and translation profiles are also affected in response to environmental stresses in other species [39]. These results show that acidic and alkaline conditions affected the plant growth and flowering of tree peony through regulating gene transcription and translation.

3.2. Exposure to Acidity and Alkalinity Reduces Photosynthesis via Weakening Light Capture, Photosynthetic ETCs, ATP Synthesis, Carbon Fixation, and the Development of Stomata

The structure of leaf and chloroplasts, as well as chloroplast movement, are vital for photosynthesis [40,41]. The leaves of tree peony plants grown under acidic and alkaline conditions were thinner than controls, with loose palisade tissue and irregularly arranged spongy mesophyll cells. The number of chloroplasts was significantly reduced in both treatment groups. Moreover, the structures of thylakoid membranes in the chloroplasts of the yellow leaves grown under acidic and alkaline conditions were extremely disordered, and the amounts were also decreased. These changes were similar to the disorganization of thylakoid membranes observed in Ocimum basilicum under stress conditions [42]. Thylakoid-membrane-related genes were found to be down-regulated under abiotic stress at both transcriptome and proteome levels [43]. Six thylakoid membrane formation genes were also down-regulated under acidic and alkaline conditions in tree peony. Changes in chloroplast ultrastructure and quantity were one of the most important reasons for the decrease in the chlorophyll content, and chlorophyll content is also a critical determinant for the Pn [44]. In Puccinellia tenuiflora, photosynthesis is remarkably reduced under alkaline stress due to stomata closure and decreases in chlorophyll content [18]. We also found that the changes in chloroplast ultrastructure and quantity in the acidic and alkaline treatment groups were positively related to chlorophyll content and Pn. Consistently, chlorophyll biosynthesis genes were also highly down-regulated under acidic and alkaline conditions. Significantly lowered chlorophyll contents have been reported in tomato and maize subjected to alkaline stress [45,46]. Chlorophyll and carotenoid contents were found to be significantly lower in plants grown under low pH treatment than in the control groups [47]. Abiotic stress causes the breakdown of chlorophyll and reductions in photosynthetic pigments in rice [48]. In tree peony leaves, it seems that chlorophyll may be degraded in the late growth stage and that the degradation is more severe under acidic conditions, a result that could explain the leaf chlorosis in the acidic group, as has been also reported in quince, pear, and olive [49]. A decrease in chlorophyll content can directly affect light energy absorption capacity [50]. A previous study showed that light energy absorption capacity decreased when white willow was subjected to stress [51]. This study has shown that light-harvesting-related genes were down-regulated under acidic and alkaline conditions. Therefore, the adverse pH level directly affected the number and structure of chloroplasts, the production of chlorophyll molecules, and the expression of LHC-related genes, resulting in a significant reduction in light-harvesting capacity.
Stomata, formed by a pair of guard cells, play an important role as a regulatory gate for the exchange of CO2 between plants and the environment; thus, they regulate stomatal conductance (Gs) and the Pn by changing their aperture and/or density [52]. Our results showed that acidic and alkaline treatments led to stomatal closure. The decrease in Pn under stressful conditions is normally attributed to the suppression of mesophyll conductance and to stomatal closure under moderate and severe stress [53]. When plants are exposed to changing environmental conditions for a short period, stomatal aperture may be the main factor influencing Gs, whereas changes in Gs may be determined by the alteration of both stomatal aperture and stomatal density in response to a changing environment over a longer period [54,55,56]. A low pH (pH 2.5) was found to greatly alter stomatal density and size in tea leaves [16]. The stomatal density of tree peony leaves in our study was also decreased under acidic and alkaline conditions for a long period of treatment, especially under acidic conditions. Accordingly, two stomatal development and movement genes, BCA and HT1, were down-regulated under acidic and alkaline conditions, while one stomatal-closure-inducing gene, TCTP, was enhanced under both conditions. Moreover, the increase in stomatal density was positively correlated with WUE in Leymus chinensis [57], in agreement with our results. Hence, acidity and alkalinity reduced stomatal aperture and density to modulate gas diffusion, thereby affecting photosynthesis.
Photosynthesis is one of the most sensitive processes to stress [10,43]. Previous research has shown that acidic and alkaline stress significantly reduces photosynthesis and productivity [16,18]. In the present study, Pn was significantly decreased under acidic and alkaline treatments compared to the control group. Consistent with this result, the Gs, Tr, and WUE were also significantly reduced under acidic and alkaline conditions. Photosynthesis includes two major stages: light-dependent reactions and light-independent reactions. The light-dependent reactions take place in the thylakoid membrane via two photosystems called PSI and PSII, in which electrons are transferred and the light energy is converted into chemical energy in the form of the ATP and NADPH molecules. In tea leaves, the expression levels of multiple genes related to photosynthesis, including one light-harvesting complex, two PSII subunits, one PSI subunit, and one ferredoxin-NADP(+) reductase (FNR) were found to be reduced under pH 2.5 [16]. Rhododendron prefers acidic soils with a pH of 5.0 or below; a transcriptome comparison showed that photosynthesis-related genes, including LHC genes and petC, petE, petH, and ATP synthesis genes, were all down-regulated under high pH [13]. The transcriptome analysis of tree peony leaves following exposure to acidic and alkaline conditions showed that the most significant DEGs in the light-dependent photosynthesis pathway were concentrated in photosynthetic ETCs, the PSI or PSII reaction-center complex, and ATP synthesis. A total of 17 ETCs, 5 PSI, 7 PSII, and 4 ATP synthase genes were down-regulated under acidic and alkaline conditions, and photosynthetic ETCs were most sensitive. The light-independent stage, also known as the Calvin cycle, takes place in the stroma of chloroplasts. It uses the stored chemical energy from the light-dependent reactions to ‘fix’ CO2 and then creates a product that can be converted into glucose. Adverse stress has been shown to markedly reduce the expression of Calvin cycle genes in cucumbers [58,59]. Based on the transcriptome gene expression, we found that acidic and alkaline conditions suppressed the expression of 11 Calvin cycle genes. In conclusion, our results indicated that acidic and alkaline conditions inhibit tree peony photosynthesis by repressing photosynthetic ETCs, diminishing light-harvesting capacity, decreasing stomatal density and aperture, and weakening enzyme activities in the Calvin Cycle.

3.3. Acidic and Alkaline Conditions Interfere with Nutrient Assimilation and Transport in Tree Peony Leaves

Soil pH can affect nutrient availability and assimilation [18]. It has been reported that soil acidity stress causes a decreased uptake of nutrients (i.e., nitrogen, phosphorus, potassium, calcium, and magnesium) [8] and that alkaline conditions lead to the deficiency of nutrient minerals that in turn limits plant growth and agricultural productivity [60,61]. P is a main component of nucleic acids, proteins, and phospholipids [62]. P deficiency affects protein synthesis, energy metabolism, and signal transduction; decreases chlorophyll content and CO2 assimilation; and impairs photosynthetic ETCs [63]. In maize, alkaline conditions were found to lead to the deficiency of P [64]. Similar results were found in tree peony leaves. B is closely related to flowering and yield [65]. B becomes less available with increasing solution pH [66]. Here, we found a significantly lower level of B in tree peony leaves exposed to both the acidic and alkaline conditions. A previous study showed that B deficiency affects photosynthetic capacity and the transport of photosynthesis products in woody plants [67], a result that may explain why tree peony photosynthesis was inhibited when B absorption was reduced. Fe is required for the synthesis of the heme structure and is an essential component of chlorophyll [68]. In addition, Fe is involved in photosynthetic ETCs in the form of ferritin and ferredoxin. Mg and Mn are not only components of chlorophyll but also activators of Calvin cycle enzymes such as RuBP carboxylase and ribulokinase 5-phosphate [69]. Fe availability for plants depends on the physico-chemical properties of the soil. High pH decreases the availability of Mn [70]. In lettuce, the content of Mg was found to be decreased under low and high pH, but Fe and Mn levels were decreased at higher pH [68]. In tea leaves, the level of Mg decreased with increasing acidity, thereby causing the inhibition of chlorophyll biosynthesis [71,72]. The chlorophyll synthesis and photosynthetic capacity of Carya illinoinensis were found to be reduced when plants were deficient in Mn [73]. Our results showed that the assimilation of Mg, and Mn were all inhibited in the tree peony plants grown under both the acidic and alkaline conditions, as well as that Fe assimilation was only reduced under acidic conditions; this was one of the most important reasons for the decrease in chlorophyll content and the impairment of light-harvesting capacity and ETCs. Therefore, the reductions in P, B, Fe Mg, and Mn assimilation caused the inhibition of chlorophyll biosynthesis, the impairment of light harvesting, and the obstruction of ETCs under acidic and alkaline conditions, consequently suppressing photosynthesis.
Si is widely considered to possess significant potential as a substance that can ameliorate the negative effects of abiotic stresses and improve plant growth and biomass accumulation [74]. The accumulation of Si in tree peony plants was shown to be enhanced under alkaline conditions; this explained why the injury and negative effects on tree peony plants grown under acidic conditions were much greater than those caused by alkaline conditions. The lower pH was shown to increase the absorption of Si in rice due to species adaptation [75]. Ca also has a stimulating effect on plant tolerance to different stresses by regulating antioxidant metabolism [76]. The enhanced antioxidant activities of tree peony plants grown under acidic and alkaline conditions were consistent with the higher accumulation of Ca2+. Mineral nutrient transport genes, including GmPTs, GmZIPs, and GmHKT1, were shown to be significantly down-regulated by acidity in soybeans [15]. Here, we also found that nutrient transporter genes including one calcium-transporting gene, three boron transporting genes, six phosphate transporting genes, one potassium transporting gene, and one potassium channel gene were greatly down-regulated in tree peony leaves under acidic and alkaline conditions. Therefore, the absorption and transport of nutrients were affected by the stress, and these in turn influenced plant growth, flowering, photosynthetic capacity, and plant resistance.

3.4. Redox Homeostasis and the Activities of Antioxidant Enzymes in the Response to Acidic and Alkaline Treatment

At low or moderate levels, ROS are implicated as second messengers in signaling cascades that mediate most biological processes, including programmed cell death (PCD), stomatal closure, and tolerance to different stresses [77]. Meanwhile, a high level of reactive ROS leads to direct oxidative damage for plants and ultimately results in cell death [77,78]. Adverse pH conditions have been shown to lead to increased ROS levels [18,79], and similar results were obtained in this study. In addition, we found that the ROS level was lower under alkaline conditions than acidic conditions. Plants perceive abiotic and biotic stresses and adapt to these stresses by a series of signal transduction factors, including ROS [77,80]. EX1 enables plants to perceive singlet oxygen as a stress signal, activating a nuclear stress response program, triggering a PCD, and impeding PSII without causing photooxidative damage to the plant [81]. AGP19 also regulates PCD [82]. SAPK2, RPK, and PP2C50 are involved in the ABA signal transduction pathway when plants are subjected to stress [83,84,85]. MKK3 is one important component of the ABA signaling pathway; it negatively regulates ROS accumulation [86,87]. RLP51 takes part in plant defense responses [88]. ORG2 plays an important role in iron deficiency-mediated stress regulation [89]. Consistent with the ROS level, the expression levels of these ROS-signaling genes were found to be enhanced in tree peony following exposure to adverse pH conditions, a result that may show the possibility of ROS as a signaling molecule involved in plant responses and adaptions to pH stress. ROS signaling was also shown to be enhanced in Arabidopsis under stress conditions [78]. In response to excess ROS accumulation under stress conditions, plants activate a set of ROS-scavenging enzymes (SOD, POD, CAT, and ascorbate peroxidase (APX)) and non-enzymatic antioxidants (ascorbate, glutathione, carotenoids, and phenolic compounds) to restore cellular ROS homeostasis [18]. SOD is the first antioxidant enzyme that can catalyze O2 to H2O2, and, as such, it plays a central role in plant defense against oxidative stress. The increased activity of SOD directly results in enhanced stress tolerance in plants [90]. Subsequently, POD, CAT, APX, and GPX catalyze the conversion of H2O2 to water. The ability of plants to control oxidant levels under stressful conditions is highly correlated with their stress tolerance [91]. Alkaline stress was found to stimulate the activities of ROS-scavenging enzymes and increase the gene expression of SOD, CAT, POD, and APX in Puccinellia tenuiflora [18]. In this study, the activities of SOD, POD, and CAT were more enhanced under alkaline conditions than under acidic conditions. Moreover, acidic and alkaline treatments resulted in the significant up-regulation of the expression of SOD, POD, and CAT genes. The increasing ROS-scavenging capability of tree peony plants observed in the alkaline group is critical for ROS homeostasis and alkaline tolerance. Accordingly, many tree peony roots were found to be damaged and rotten under acidic conditions, while roots grown under alkaline conditions were in much better condition. Root damage under adverse pH stress is also associated with ROS accumulation in rice [26,27]. ROS can damage the photosynthetic apparatus, particularly PSII, and inhibit the translation of photosynthetic genes, resulting in reductions in Pn and the inhibition of PSII repair [92,93]. In this research, we observed negative correlations of ROS and Pn, which were also confirmed by Sharma et al. (2012) [77]. Adverse pH, particular acidic toxicity, can directly damage citrus roots, thus affecting the uptake of mineral nutrients [8]. The high ROS level in tree peony plants may cause damage to plant roots and negatively regulate the global transcription level, thereby affecting nutrient assimilation and cell metabolism. In addition, the adverse pH conditions were shown to stimulate stomatal closure and regulate a series of genes related to plant growth, photosynthesis, flowering, hormone and signal transduction, transcription, and translation (Figure 9).
Ultimately, plant growth, flowering, photosynthesis, nutrient assimilation and transport, and ROS production and elimination were all shown to be influenced by acidic and alkaline conditions (Figure 10). Adverse pH affected the availability of important nutrients such as P, Fe, Mg, Mn, B, and Si and caused the excess production of ROS that may damage root cells and reduce nutrient assimilation. This could in turn affect chlorophyll synthesis, photosynthesis, and stress tolerance. Furthermore, the activities of ROS-eliminating enzymes (including SOD, CAT, and POD) and the expression of the associated coding genes were enhanced to alleviate the damage caused by adverse pH stress. These adverse pH conditions suppressed the expression of a series of genes related to plant growth, flowering, signal transduction, transcription, translation, light harvesting, photosynthetic ETCs, thylakoid membranes, carbon fixation enzymes, chloroplast development, chlorophyll synthesis, stomatal development, and stomatal aperture through a series of signaling cascades. As a result, plant growth was inhibited, flowering quality was reduced, photosynthesis was impaired, and plant biomass was decreased.

4. Materials and Methods

4.1. Plant Materials and Forcing Culture Conditions

Five-year-old adult plants of P. suffruticosa Andr. ‘Luo Yang Hong’ were collected from the experimental field of the Department of Peony, Chinese Academy of Agricultural Sciences, Beijing, China, and they were potted in plastic flowerpots with pH-balanced media. Sixty plants free of pests or disease and with similar growth conditions were randomly selected in this study, with 20 plants for each treatment. The plants were treated with different pH levels (pH 4.0, 7.0, and 10.0) for five months. The plants were thoroughly irrigated using a glycine buffer solution (pH 4.0 and 10.0) once a week, and distilled water (pH 7.0) was used as the control treatment. The growth parameters, photosynthesis, and samples for the physiological indices and section observation of leaves were collected during the treatment time (S0, bud sprouting stage; S1, hard bud stage; S2, loose bud stage; S3, half open stage; S4, fully opened stage; S5, two weeks after the fully opened stage; and S6, four weeks after the fully opened stage). Flowers were sampled to study flower quality and biomass. Root samples for morphological characteristics and secondary metabolites were collected after five months. All samples were immediately frozen in liquid nitrogen and then stored at −80 °C until analysis.

4.2. Color Indexes and Pigment Estimation

The flower and leaf color indexes were measured with a Minolta CR-300 Chroma Meter (Konica Minolta Optic Inc., Tokyo, Japan). For L* values from 0 to 100, the darkness gradually decreases; the green tone gradually decreases and the red tone becomes clearer from −a* to +a*. The shade of blue gradually decreases and the shade of yellow increases from −b* to +b*. The hue angle was calculated as follows: H° = arctangent (b*/a*). Chroma (C*) and hue angle (h) were calculated according to the following equations: C* = (a*2 + b*2)1/2 and h = tan − 1 (b*/a*). C* is the distance perpendicular from the lightness axis (more distance leads to more chroma).
The anthocyanin content was measured according to the method of Brown [94] at 530 nm. Chlorophyll a and b contents were determined at 663 and 645 nm, respectively, and calculated based on the method of Li [95]. The relative chlorophyll index was constructed using a portable chlorophyll SPAD 502 m (Konica Minolta Optic Inc., Tokyo, Japan). For carotenoid determination, fresh leaves were homogenized in 80% acetone with a homogenizer. Homogenates were centrifuged at 4 °C for 15 min (3000 rpm). Supernatants were used for the analysis of pigments. Absorbances were determined at 470 nm.

4.3. Measurement of Photosynthetic Indexes

The net photosynthesis rate (Pn), transpiration rate (Tr), intercellular carbon dioxide (CO2) concentration (Ci), stomatal conduction (Gs), and photosynthetic water use efficiency (WUE) of leaves were determined between 08:30 and 10:30 from fully expanded third blades using a portable open flow gas exchange system (CIRAS-3 Portable Photosynthesis machine, Amesbury, MA, USA) under ambient CO2 concentrations (chemicals removed). The Pn, Gs, Ci, Tr, and WUE were recorded once the rate of CO2 uptake had stabilized. WUE is given by the ratio of the net CO2 assimilation rate to the transpiration rate.

4.4. Stomata Observation by Light Microscope and Leaf Ultrastructure Observation by TEM

Nail polish imprints were taken from the abaxial surface of mature leaves from plants and examined immediately with an optical microscope (Olympus CX31RTSF, Tokyo, Japan). Stomatal properties were analyzed using the ImageJ software (version 1.8.0). Stomatal density, aperture, and size were calculated as previous described [96].
Samples for transmission electron microscopy (TEM) were prepared according to standard TEM sample preparation protocols. Ultrathin tissue sections were mounted on nickel grids and observed using a transmission electron microscope (Hitachi HT7500, Tokyo, Japan).

4.5. Estimation of Contents of Macro and Micro-Nutrients, Soluble Sugar, Protein, and Starch

Leaf samples were dried in an oven at 80 °C for 72 h and then ground to a fine powder using a mortar and pestle. About 30 mg was reduced to ashes at 550 °C in a muffle furnace for 5 h and then digested with 2 mL of 20% HCl (6N) for 5 min at 60 °C using a heating block. This hot water extract was cooled and filtered using Whatman no. 42 filter paper and finally diluted to a volume of 50 mL with distilled deionized water. Macro and micro nutrient concentrations were determined using an inductively coupled plasma optical emission spectrometer (ICP-OES, Agilent 725, Beijing, China). Soluble sugar, protein, and starch were determined following the work of Ren et al. (2018) [96].

4.6. Determination of Hydrogen Peroxide Level and Activities of Antioxidant Enzymes

The activities of CAT, SOD, and POD were determined using an antioxidant assay kit (Sigma-Aldrich KGT 00150-1, St. Louis, MO, USA) according to the manufacturer’s protocols, and the absorbances were measured at 405, 550, and 420 nm, respectively. The H2O2 level was evaluated using a hydrogen peroxide assay kit (Sigma-Aldrich KGT018, St. Louis, MO, USA) by comparing its absorbance at 405 nm to a standard calibration curve according to its manufacturer’s protocols.

4.7. RNA-seq, Library Construction, Sequence Assembly and Annotation

Total RNA was isolated from the leaves of tree peony plants grown under pH 4.0, 7.0, and 10.0 at S4 using a Trizol extraction kit (Invitrogen, Carlsbad, CA, USA), and DNA was removed using RNase-free DNase I (Takara Biotechnology, Dalian, China) according to the manufacturer’s instructions. Three leaves were used in each sample. The quality of RNA was detected using a NanoDrop 2000 UV/Visible Spectrophotometer (Thermo Scientific, Waltham, MA, USA) and an electrophoresis apparatus (Thermo Scientific, Waltham, MA, USA). High-quality RNA from samples of three treatments was used for cDNA library construction and Illumina sequencing.
Each sample, including leaves from the pH 4.0, 7.0, and 10.0 samples, was used to construct one cDNA library, so three cDNA libraries were constructed in our study. The cDNA library was constructed using the Truseq RNA sample preparation kit (Illumina, San Diego, CA, USA) according to the Illumina manufacturer’s instructions. Briefly, the poly (A) mRNA was isolated using oligo-dT beads (QIAGEN, Hilden, Germany). Subsequently, 200-nt-long mRNA fragments were generated using a fragmentation buffer and first-strand cDNA was synthesized with the addition of random hexamer primers. The second-strand cDNA was synthesized with a SuperScript double-stranded cDNA synthesis kit (Invitrogen, Carlsbad, CA, USA) and purified using a QiaQuick PCR extraction kit (QIAGEN, Hilden, Germany) according to the manufacturer’s instructions. The double-stranded cDNA of the above-mentioned three samples was sequenced using an Illumina HiSeq™4000 platform at the Beijing Genomics Institute Company (Shenzhen, China). All transcription sequencing data are available at the NCBI Short Read Archive (Accession number: SRR19039925-SRR19039927).
All raw reads were initially processed by passing them through quality control (QC) filters to remove adapter sequences, low-quality reads (phred score < 20), unknown nucleotides (Ns), relatively short reads (<50 nt), and terminal nucleotides in both 3′ and 5′ ends to produce clean reads. The clean reads were de novo assembled using the Trinity software to construct unique consensus sequences with no extension on either end. All assembled unigenes were searched and annotated against the publicly available NCBI non-redundant nucleic acid sequence database (NT) using BLASTn analysis and protein databases including the Swiss-Prot protein sequence database (Swiss-Prot), NCBI non-redundant protein database (NR), Clusters of EuKaryotic Orthologous Groups (KOG), and Kyoto Encyclopedia of Genes and Genomes (KEGG) using BLASTx analysis with an E-value cut-off of 1 × 10⁻⁵. To understand the functional classification of the unigenes, Gene Ontology (GO) analysis was conducted on the annotated sequences using the Blast2GO Program and NR annotation results. The potential coding sequences (CDS) of unigenes were identified from NCBI (Open Reading Frame Finder, https://www.ncbi.nlm.nih.gov/orffinder/, accessed on 4 April 2022) and confirmed by BLAST in Swiss-Prot and Pfam protein sequences with Hmmscan.

4.8. Analysis of Differentially Expressed Genes (DEGs), GO and KEGG Enrichment

Differential expression analysis was performed using DESeq2 on the identified DEGs. The DEGs were evaluated based on the genes with FPKM of >1 in at least one sample, and this parameter was set to the p-adjust of <0.05 and |log2FC| of ≥2. GO and KEGG enrichment analyses were performed using Fisher’s exact test for the elucidation of the biological functions of the genes. The false discovery rate was <0.001. K-mean clustering was performed on log2-transformed FPKM values with the Euclidean correlation as a similarity metric for the visualization of genes with similar expression patterns and the exploration of their functions. A heatmap of DEGs was drawn with the Heml software (version 1.0).

4.9. Statistical Analysis
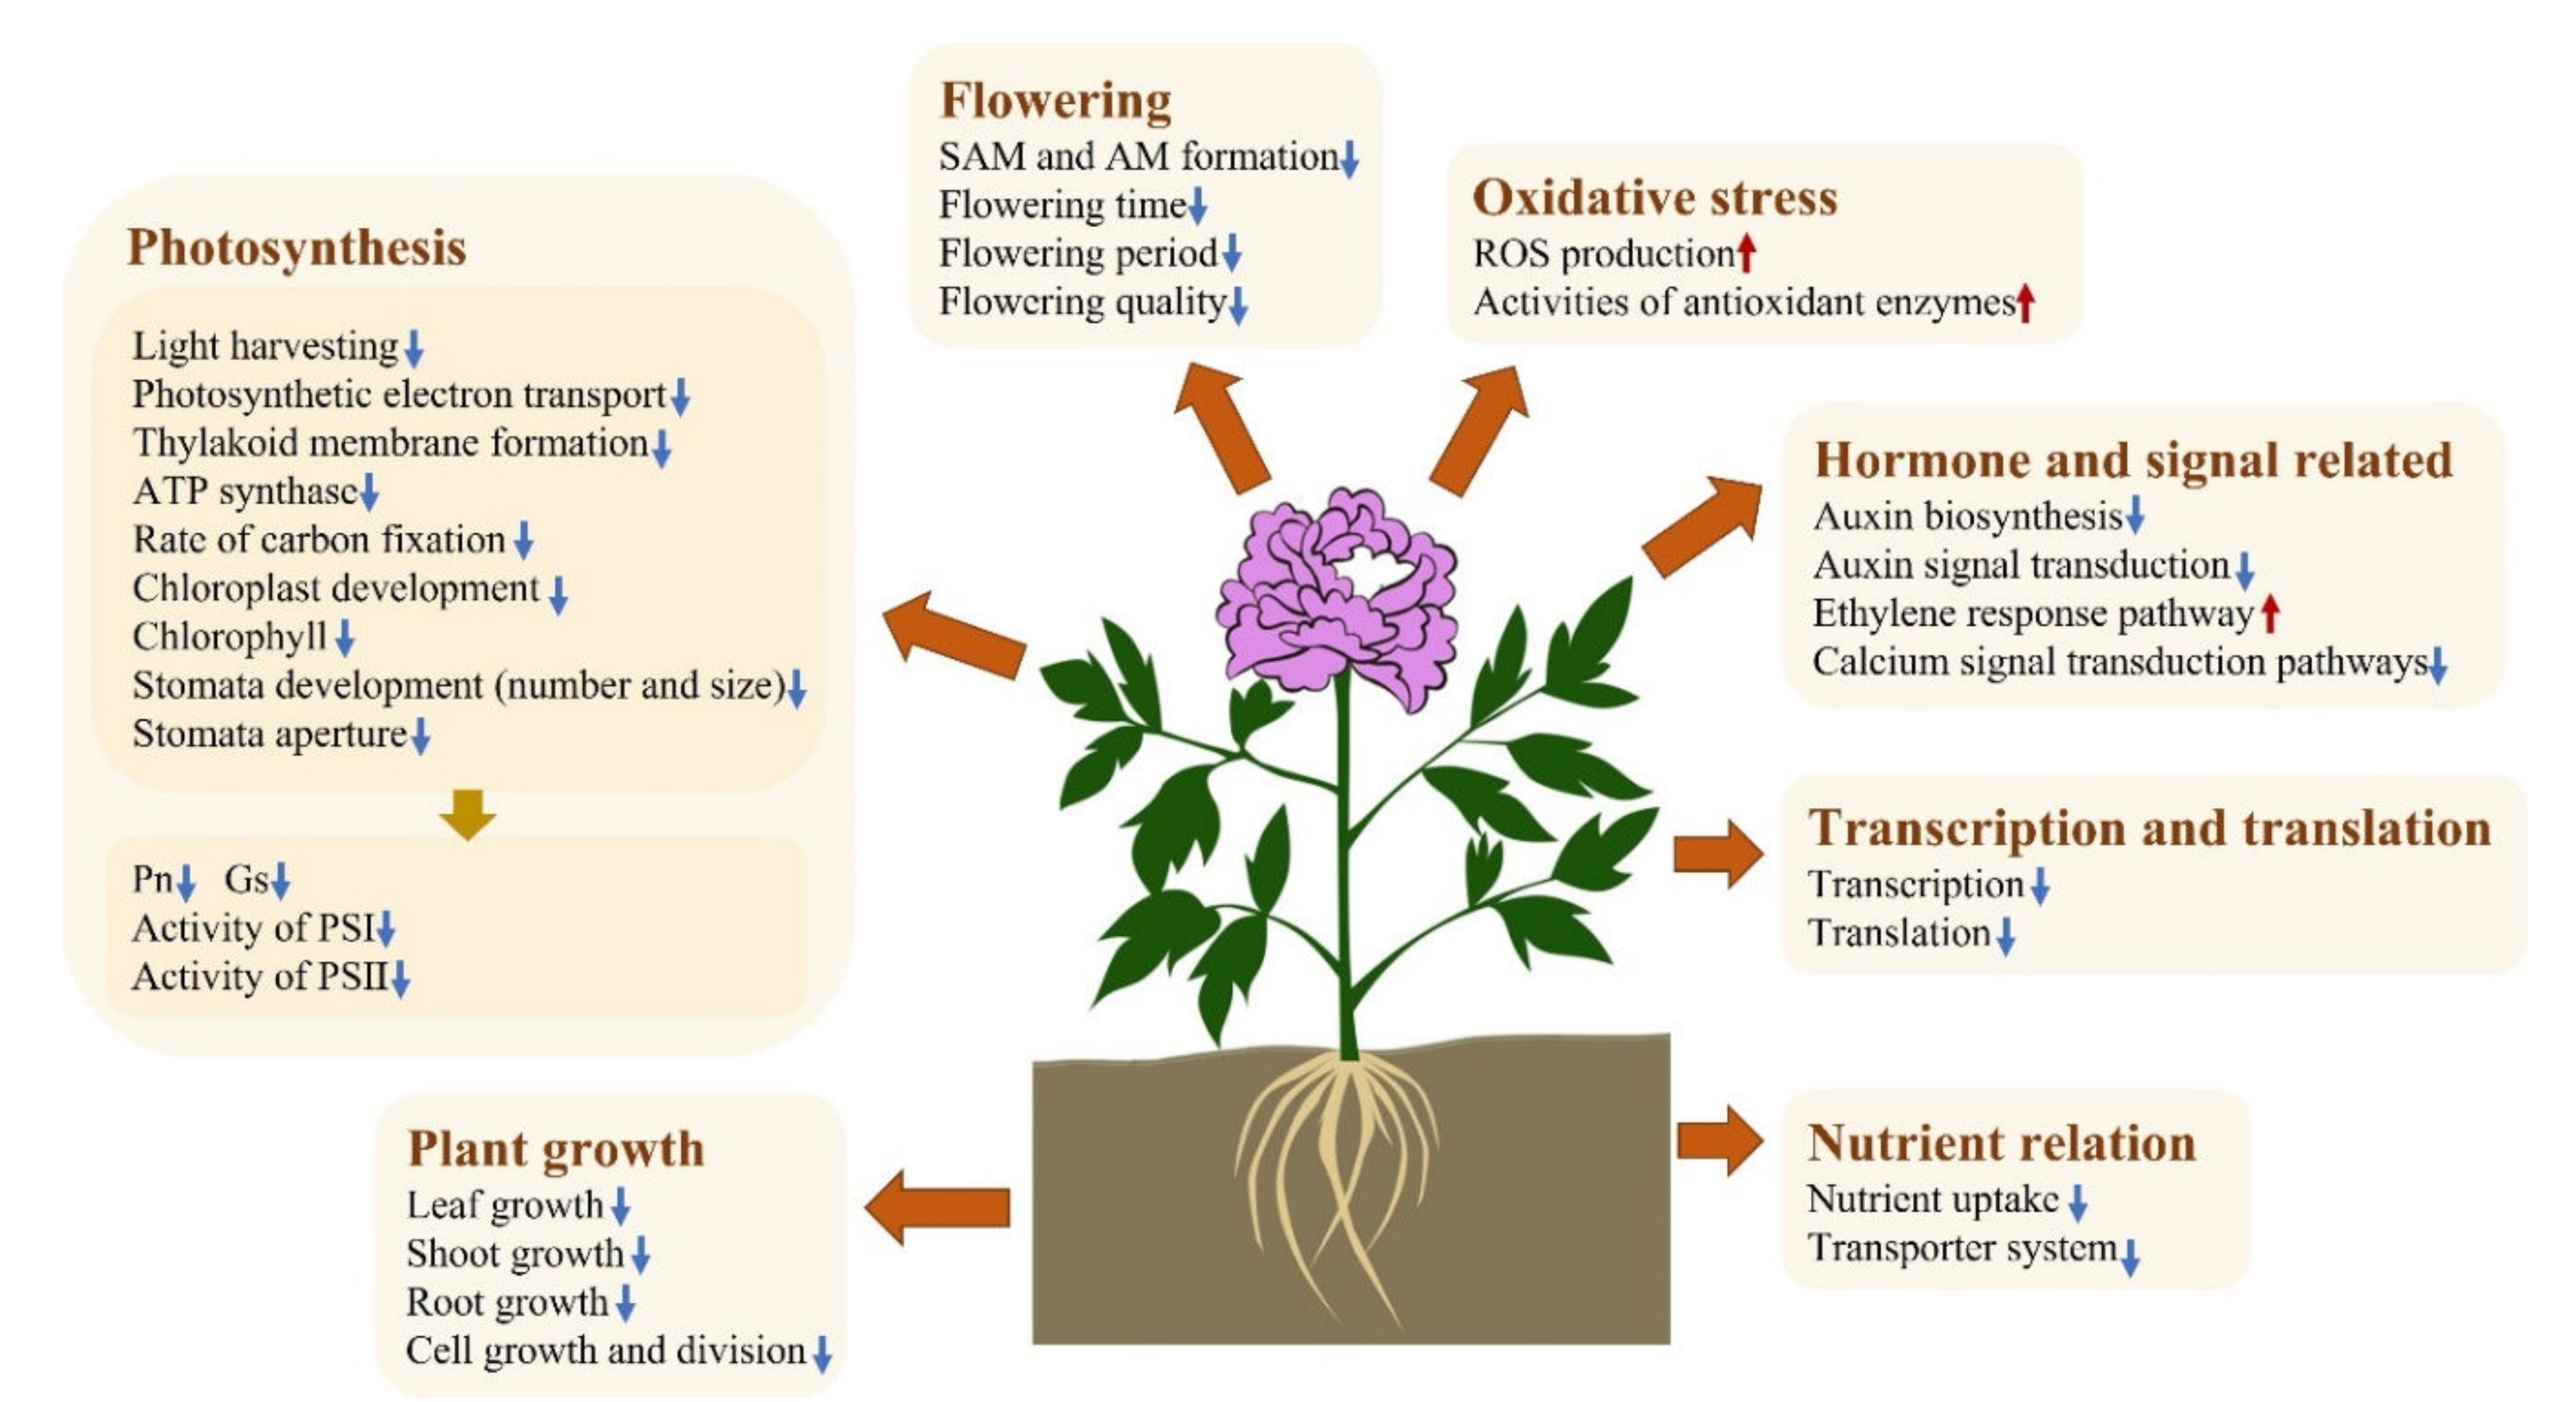
The design of the experiment was completely randomized with twenty replications. The experimental data are expressed as mean ± SE and were analyzed by one-way ANOVA, followed by Duncan’s multiple range test at p < 0.05 to find the statistical significance among treatments using the SPSS Statistics software (version 20.0).

5. Conclusions

Plant growth, flowering, photosynthesis, and the associated regulatory genes of tree peony were found to be affected by acidic and alkaline conditions, and acidity was more toxic than alkalinity to plants because the ROS-scavenging capability of tree peony was enhanced under alkaline conditions. Acidic and alkaline conditions produced excess ROS that caused damage to root, chloroplasts, and photosynthetic systems. In addition, a series of genes related to plant growth, cell division, flowering, auxin biosynthesis and signal transduction, transcription, translation, photosynthesis, chloroplast development, chlorophyll synthesis, and stomatal development was also significantly down-regulated. The DEGs related to photosynthesis were concentrated in light-harvesting capacity, ETCs, the reaction centers of PSII and PSI, ATP synthesis, and carbon fixation, among which ETCs were the most sensitive to the adverse pH. Nutrient assimilation was also affected by acidic and alkaline conditions. The reduced chlorophyll content and low expression of photosynthetic antenna genes synergistically suppressed the light-harvesting capacity. These results jointly led to the reduction in Pn. Accordingly, sugar accumulation and plant biomass were decreased.

Supplementary Materials

The following supporting information can be downloaded at: https://www.mdpi.com/article/10.3390/ijms23095094/s1.

Author Contributions

Conceptualization and Methodology, X.Z. and X.R.; Resources, X.Z., S.W., J.X. and Y.Z.; Data Curation, T.T.A., X.R. and F.S.; Writing—Original Draft Preparation, T.T.A.; Writing—Review and Editing, X.R.; Visualization and Supervision, X.R.; Project Administration, X.R.; Funding Acquisition, X.Z. All authors have read and agreed to the published version of the manuscript.

Funding

This research was supported by the National Key R&D Program of China (2020YFD1000500), Beijing Municipal Natural Science Foundation (No. 6214045), the National Key R&D Program of China (2018YFD1000401), and China Agriculture Research System (CARS-21).

Institutional Review Board Statement

Not applicable.

Informed Consent Statement

Not applicable.

Data Availability Statement

Not applicable.

Acknowledgments

We thank LetPub (www.letpub.com, accessed on 4 April 2022) for its linguistic assistance during the preparation of this manuscript.

Conflicts of Interest

The authors declare that they have no competing interests.

References

  1. Guo, L.; Guo, S.; Xu, J.; He, L.; Carlson, J.E.; Hou, X. Phylogenetic analysis based on chloroplast genome uncover evolutionary relationship of all the nine species and six cultivars of tree peony. Ind. Crops Prod. 2020, 153, 112567. [Google Scholar] [CrossRef]
  2. Yang, Y.; Sun, M.; Li, S.S.; Chen, Q.H.; da Silva, J.A.T.; Wang, A.J.; Yu, X.N.; Wang, L.S. Germplasm resources and genetic breeding of Paeonia: A systematic review. Hortic. Res. 2020, 7, 107. [Google Scholar] [CrossRef] [PubMed]
  3. Zhang, Y.C.; Ge, M.; Wang, X.H.; Zeng, Y.; Liao, Y.X.; Wang, Y.P.; Zeng, Z.L. Discrimination of Moutan Cortex from different sources and geographical origins for quality evaluation using microsatellite markers coupled with chemical analysis. Biochem. Syst. Ecol. 2020, 89, 104005. [Google Scholar] [CrossRef]
  4. Kochian, L.V.; Hoekenga, O.A.; Pineros, M.A. How do crop plants tolerate acid soils? Mechanisms of aluminum tolerance and phosphorous efficiency. Annu. Rev. Plant Biol. 2004, 55, 459–493. [Google Scholar] [CrossRef] [PubMed]
  5. Wang, L.; Seki, K.; Miyazaki, T.; Ishihama, Y. The causes of soil alkalinization in the Songnen Plain of Northeast China. Paddy Water Environ. 2009, 7, 259–270. [Google Scholar] [CrossRef]
  6. Zhao, D.Q.; Hao, Z.J.; Wang, J.; Tao, J. Effects of pH in irrigation water on plant growth and flower quality in herbaceous peony (Paeonia lactiflora Pall.). Sci. Hortic. 2013, 154, 45–53. [Google Scholar] [CrossRef]
  7. Herb, M.; Gluschko, A.; Schramm, M. Reactive Oxygen Species: Not omnipresent but important in many locations. Front. Cell Dev. Biol. 2021, 9, 716406. [Google Scholar] [CrossRef]
  8. Long, A.; Zhang, J.; Yang, L.T.; Ye, X.; Lai, N.W.; Tan, L.L.; Lin, D.; Chen, L.S. Effects of low pH on photosynthesis, related physiological parameters, and nutrient profiles of citrus. Front. Plant Sci. 2017, 8, 185. [Google Scholar] [CrossRef] [Green Version]
  9. Zhang, H.H.; Li, X.; Xu, Z.S.; Wang, Y.; Teng, Z.Y.; An, M.J.; Zhang, Y.H.; Zhu, W.X.; Xu, N.; Sun, G.Y. Toxic effects of heavy metals Pb and Cd on mulberry (Morus alba L.) seedling leaves: Photosynthetic function and reactive oxygen species (ROS) metabolism responses. Ecotoxicol. Environ. Saf. 2020, 195, 110469. [Google Scholar] [CrossRef]
  10. Wang, Y.; Yu, Y.; Zhang, H.; Huo, Y.; Liu, X.; Che, Y.; Wang, J.; Sun, G.; Zhang, H. The phytotoxicity of exposure to two polybrominated diphenyl ethers (BDE47 and BDE209) on photosynthesis and the response of the hormone signaling and ROS scavenging system in tobacco leaves. J. Hazard. Mater. 2022, 426, 128012. [Google Scholar] [CrossRef]
  11. Wang, Y.; Zhu, H.; Tam, N.F.Y. Effect of a polybrominated diphenyl ether congener (BDE-47) on growth and antioxidative enzymes of two mangrove plant species, Kandelia obovata and Avicennia marina, in South China. Mar. Pollut. Bull. 2014, 85, 376–384. [Google Scholar] [CrossRef]
  12. Johnson, M.P. Photosynthesis. Essays Biochem. 2016, 60, 255–273. [Google Scholar] [CrossRef] [PubMed]
  13. Zhou, X.L.; Wang, Y.H.; Shen, S.K. Transcriptomic comparison reveals modifications in gene expression, photosynthesis, and cell wall in woody plant as responses to external pH changes. Ecotoxicol. Environ. Saf. 2020, 203, 111007. [Google Scholar] [CrossRef] [PubMed]
  14. Guo, R.; Yang, Z.; Li, F.; Yan, C.; Zhong, X.; Liu, Q.; Xia, X.; Li, H.; Zhao, L. Comparative metabolic responses and adaptive strategies of wheat (Triticum aestivum) to salt and alkali stress. BMC Plant Biol. 2015, 15, 170. [Google Scholar] [CrossRef] [PubMed] [Green Version]
  15. Chen, Q.; Wu, W.; Zhao, T.; Tan, W.; Tian, J.; Liang, C. Complex gene regulation underlying mineral nutrient homeostasis in soybean root response to acidity stress. Genes 2019, 10, 402. [Google Scholar] [CrossRef] [PubMed] [Green Version]
  16. Zhang, C.; Yi, X.; Zhou, F.; Gao, X.; Wang, M.; Chen, J.; Huang, J.; Shen, C. Comprehensive transcriptome profiling of tea leaves (Camellia sinensis) in response to simulated acid rain. Sci. Hortic. 2020, 272, 109491. [Google Scholar] [CrossRef]
  17. Sun, J.; Hu, H.; Li, Y.; Wang, L.; Zhou, Q.; Huang, X. Effects and mechanism of acid rain on plant chloroplast ATP synthase. Environ. Sci. Pollut. Res. Int. 2016, 23, 18296–18306. [Google Scholar] [CrossRef] [PubMed]
  18. Yin, Z.; Zhang, H.; Zhao, Q.; Yoo, M.-J.; Zhu, N.; Yu, J.; Yu, J.; Guo, S.; Miao, Y.; Chen, S.; et al. Physiological and comparative proteomic analyses of saline-alkali NaHCO3-responses in leaves of halophyte Puccinellia tenuiflora. Plant Soil 2019, 437, 137–158. [Google Scholar] [CrossRef]
  19. Moreau, H.; Zimmermann, S.D.; Gaillard, I.; Paris, N. pH biosensing in the plant apoplast—A focus on root cell elongation. J. Plant Physiol. 2021, 187, 504–514. [Google Scholar] [CrossRef]
  20. Kumagai, T.; Ito, S.; Nakamichi, N.; Niwa, Y.; Murakami, M.; Yamashino, T.; Mizuno, T. The Common Function of a Novel Subfamily of B-Box Zinc Finger Proteins with Reference to Circadian-Associated Events in Arabidopsis thaliana. Biosci. Biotechnol. Biochem. 2008, 72, 1539–1549. [Google Scholar] [CrossRef] [Green Version]
  21. Hu, H.; Boisson-Dernier, A.; Israelsson-Nordström, M.; Böhmer, M.; Xue, S.; Ries, A.; Godoski, J.; Kuhn, J.M.; Schroeder, J.I. Carbonic anhydrases are upstream regulators of CO2-controlled stomatal movements in guard cells. Nat. Cell Biol. 2010, 12, 87–93. [Google Scholar] [CrossRef] [Green Version]
  22. Engineer, C.B.; Ghassemian, M.; Anderson, J.C.; Peck, S.C.; Hu, H.; Schroeder, J.I. Carbonic anhydrases, EPF2 and a novel protease mediate CO2 control of stomatal development. Nature 2014, 513, 246–250. [Google Scholar] [CrossRef] [Green Version]
  23. Hashimoto, M.; Negi, J.; Young, J.; Israelsson, M.; Schroeder, J.I.; Iba, K. Arabidopsis HT1 kinase controls stomatal movements in response to CO2. Nat. Cell Biol. 2006, 8, 391–397. [Google Scholar] [CrossRef]
  24. Geng, G.; Wang, G.; Stevanato, P.; Lv, C.; Wang, Q.; Yu, L.; Wang, Y. Physiological and Proteomic Analysis of Different Molecular Mechanisms of Sugar Beet Response to Acidic and Alkaline pH Environment. Front. Plant Sci. 2021, 12, 682799. [Google Scholar] [CrossRef]
  25. Zhang, Y.K.; Zhu, D.F.; Zhang, Y.P.; Chen, H.Z.; Xiang, J.; Lin, X.Q. Low pH-induced changes of antioxidant enzyme and ATPase activities in the roots of rice (Oryza sativa L.) seedlings. PLoS ONE 2015, 10, e0116971. [Google Scholar] [CrossRef] [Green Version]
  26. Lv, B.-S.; Li, X.-W.; Ma, H.-Y.; Sun, Y.; Wei, L.-X.; Jiang, C.-J.; Liang, Z.-W. Differences in Growth and Physiology of Rice in Response to Different Saline-Alkaline Stress Factors. J. Agron. 2013, 105, 1119–1128. [Google Scholar] [CrossRef]
  27. Wei, L.X.; Lv, B.S.; Wang, M.M.; Ma, H.Y.; Yang, H.Y.; Liu, X.L.; Jiang, C.J.; Liang, Z.W. Priming effect of abscisic acid on alkaline stress tolerance in rice (Oryza sativa L.) seedlings. Plant Physiol. Biochem. 2015, 90, 50–57. [Google Scholar] [CrossRef]
  28. Fukada-Tanaka, S.; Inagaki, Y.; Yamaguchi, T.; Saito, N.; Iida, S. Colour-enhancing protein in blue petals. Nature 2000, 407, 581. [Google Scholar] [CrossRef]
  29. Hunter, C.A.; Aukerman, M.J.; Sun, H.; Fokina, M.; Poethig, R.S. PAUSED Encodes the Arabidopsis Exportin-t Ortholog. J. Plant Physiol. 2003, 132, 2135–2143. [Google Scholar] [CrossRef] [Green Version]
  30. Matsushika, A.; Makino, S.; Kojima, M.; Mizuno, T. Circadian Waves of Expression of the APRR1/TOC1 Family of Pseudo-Response Regulators in Arabidopsis thaliana: Insight into the Plant Circadian Clock. Plant Cell Physiol. 2000, 41, 1002–1012. [Google Scholar] [CrossRef] [Green Version]
  31. Yang, H.; Han, Z.; Cao, Y.; Fan, D.; Li, H.; Mo, H.; Feng, Y.; Liu, L.; Wang, Z.; Yue, Y.; et al. A companion cell-dominant and developmentally regulated H3K4 demethylase controls flowering time in Arabidopsis via the repression of FLC expression. PLoS Genet. 2012, 8, e1002664. [Google Scholar] [CrossRef] [PubMed]
  32. Henderson, I.R.; Liu, F.; Drea, S.; Simpson, G.G.; Dean, C. An allelic series reveals essential roles for FY in plant development in addition to flowering-time control. Development 2005, 132, 3597–3607. [Google Scholar] [CrossRef] [PubMed] [Green Version]
  33. Calderon-Villalobos, L.I.A.; Kuhnle, C.; Dohmann, E.M.N.; Li, H.; Bevan, M.; Schwechheimer, C. The Evolutionarily Conserved TOUGH Protein Is Required for Proper Development of Arabidopsis thaliana. Plant Cell 2005, 17, 2473–2485. [Google Scholar] [CrossRef] [PubMed] [Green Version]
  34. Moriwaki, T.; Miyazawa, Y.; Kobayashi, A.; Uchida, M.; Watanabe, C.; Fujii, N.; Takahashi, H. Hormonal Regulation of Lateral Root Development in Arabidopsis Modulated by MIZ1 and Requirement of GNOM Activity for MIZ1 Function. J. Plant Physiol. 2011, 157, 1209–1220. [Google Scholar] [CrossRef] [PubMed] [Green Version]
  35. Fendrych, M.; Synek, L.; Pečenková, T.; Toupalová, H.; Cole, R.; Drdová, E.; Nebesářová, J.; Šedinová, M.; Hála, M.; Fowler, J.E.; et al. The Arabidopsis Exocyst Complex Is Involved in Cytokinesis and Cell Plate Maturation. Plant Cell 2010, 22, 3053–3065. [Google Scholar] [CrossRef] [Green Version]
  36. Blilou, I.; Frugier, F.; Folmer, S.; Serralbo, O.; Willemsen, V.; Wolkenfelt, H.; Eloy, N.B.; Ferreira, P.C.; Weisbeek, P.; Scheres, B. The Arabidopsis HOBBIT gene encodes a CDC27 homolog that links the plant cell cycle to progression of cell differentiation. Genes Dev. 2002, 16, 2566–2575. [Google Scholar] [CrossRef] [Green Version]
  37. Chun, H.J.; Baek, D.; Jin, B.J.; Cho, H.M.; Park, M.S.; Lee, S.H.; Lim, L.H.; Cha, Y.J.; Bae, D.W.; Kim, S.T.; et al. Microtubule Dynamics Plays a Vital Role in Plant Adaptation and Tolerance to Salt Stress. Int. J. Mol. Sci. 2021, 22, 5957. [Google Scholar] [CrossRef]
  38. Lv, B.; Yan, Z.; Tian, H.; Zhang, X.; Ding, Z. Local Auxin Biosynthesis Mediates Plant Growth and Development. Trends Plant Sci. 2019, 24, 6–9. [Google Scholar] [CrossRef]
  39. Lackner, D.H.; Schmidt, M.W.; Wu, S.; Wolf, D.A.; Bähler, J. Regulation of transcriptome, translation, and proteome in response to environmental stress in fission yeast. Genome Biol. 2012, 13, R25. [Google Scholar] [CrossRef] [Green Version]
  40. Lauterbach, M.; van der Merwe, P.d.W.; Keßler, L.; Pirie, M.D.; Bellstedt, D.U.; Kadereit, G. Evolution of leaf anatomy in arid environments—A case study in southern African Tetraena and Roepera (Zygophyllaceae). Mol. Phylogenetics Evol. 2016, 97, 129–144. [Google Scholar] [CrossRef]
  41. Gotoh, E.; Suetsugu, N.; Higa, T.; Matsushita, T.; Tsukaya, H.; Wada, M. Palisade cell shape affects the light-induced chloroplast movements and leaf photosynthesis. Sci. Rep. 2018, 8, 1472. [Google Scholar] [CrossRef]
  42. Bishehkolaei, R.; Fahimi, H.; Saadatmand, S.; Nejadsattari, T.; Lahouti, M.; Yazdi, F.T. Ultrastructural localisation of chromium in Ocimum basilicum. Turk. J. Bot. 2011, 35, 261–268. [Google Scholar]
  43. Zhang, J.; Wang, S.; Song, S.; Xu, F.; Pan, Y.; Wang, H. Transcriptomic and proteomic analyses reveal new insight into chlorophyll synthesis and chloroplast structure of maize leaves under zinc deficiency stress. J. Proteom. 2019, 199, 123–134. [Google Scholar] [CrossRef]
  44. Garty, J.; Tamir, O.; Hassid, I.; Eshel, A.; Cohen, Y.; Karnieli, A.; Orlovsky, L. Photosynthesis, Chlorophyll Integrity, and Spectral Reflectance in Lichens Exposed to Air Pollution. J. Environ. Qual. 2001, 30, 884–893. [Google Scholar] [CrossRef] [Green Version]
  45. Khan, A.; Kamran, M.; Imran, M.; Al-Harrasi, A.; Al-Rawahi, A.; Al-Amri, I.; Lee, I.-J.; Khan, A.L. Silicon and salicylic acid confer high-pH stress tolerance in tomato seedlings. Sci. Rep. 2019, 9, 19788. [Google Scholar] [CrossRef] [Green Version]
  46. Mir, M.A.; John, R.; Alyemeni, M.N.; Alam, P.; Ahmad, P. Jasmonic acid ameliorates alkaline stress by improving growth performance, ascorbate glutathione cycle and glyoxylase system in maize seedlings. Sci. Rep. 2018, 8, 2831. [Google Scholar] [CrossRef]
  47. Liu, Y.; Wang, Q.; Zhang, Y.; Cui, J.; Chen, G.; Xie, B.; Wu, C.; Liu, H. Synergistic and antagonistic effects of salinity and pH on germination in switchgrass (Panicum virgatum L.). PLoS ONE 2014, 9, e85282. [Google Scholar] [CrossRef]
  48. Wang, H.; Wu, Z.; Chen, Y.; Yang, C.; Shi, D. Effects of salt and alkali stresses on growth and ion balance in rice (Oryza sativa L.). Plant Soil Environ. 2011, 57, 286–294. [Google Scholar] [CrossRef]
  49. De la Guardia, M.D.; Alcántara, E. A comparison of ferric-chelate reductase and chlorophyll and growth ratios as indices of selection of quince, pear and olive genotypes under iron deficiency stress. Plant Soil 2002, 241, 49–56. [Google Scholar] [CrossRef]
  50. Lu, Y.; Gan, Q.; Iwai, M.; Alboresi, A.; Burlacot, A.; Dautermann, O.; Takahashi, H.; Crisanto, T.; Peltier, G.; Morosinotto, T.; et al. Role of an ancient light-harvesting protein of PSI in light absorption and photoprotection. Nat. Commun. 2021, 12, 679. [Google Scholar] [CrossRef]
  51. Ran, X.; Wang, X.; Gao, X.; Liang, H.; Liu, B.; Huang, X. Effects of salt stress on the photosynthetic physiology and mineral ion absorption and distribution in white willow (Salix alba L.). PLoS ONE 2021, 16, e0260086. [Google Scholar] [CrossRef]
  52. Vialet-Chabrand, S.R.M.; Matthews, J.S.A.; McAusland, L.; Blatt, M.R.; Griffiths, H.; Lawson, T. Temporal Dynamics of Stomatal Behavior: Modeling and Implications for Photosynthesis and Water Use. J. Plant Physiol. 2017, 174, 603–613. [Google Scholar] [CrossRef] [PubMed] [Green Version]
  53. Chaves, M.M.; Flexas, J.; Pinheiro, C. Photosynthesis under drought and salt stress: Regulation mechanisms from whole plant to cell. Ann. Bot. 2009, 103, 551–560. [Google Scholar] [CrossRef] [PubMed] [Green Version]
  54. Franks, P.J.; Farquhar, G.D. The mechanical diversity of stomata and its significance in gas-exchange control. J. Plant Physiol. 2007, 143, 78–87. [Google Scholar] [CrossRef] [Green Version]
  55. Yan, F.; Sun, Y.; Song, F.; Liu, F. Differential responses of stomatal morphology to partial root-zone drying and deficit irrigation in potato leaves under varied nitrogen rates. Sci. Hortic. 2012, 145, 76–83. [Google Scholar] [CrossRef]
  56. Büssis, D.; von Groll, U.; Fisahn, J.; Altmann, T. Stomatal aperture can compensate altered stomatal density in Arabidopsis thaliana at growth light conditions. Funct. Plant Biol. 2006, 33, 1037–1043. [Google Scholar] [CrossRef]
  57. Limin, Y.; Mei, H.; Guangsheng, Z.; Jiandong, L. The changes in water-use efficiency and stoma density of Leymus chinensis along Northeast China Transect. Acta Ecologica. Sinica. 2007, 27, 16–23. [Google Scholar] [CrossRef]
  58. Shu, S.; Chen, L.; Lu, W.; Sun, J.; Guo, S.; Yuan, Y.; Li, J. Effects of exogenous spermidine on photosynthetic capacity and expression of Calvin cycle genes in salt-stressed cucumber seedlings. J. Plant Res. 2014, 127, 763–773. [Google Scholar] [CrossRef]
  59. Sayed, A.I.H.; El-hamahmy, M.A.M.; Rafudeen, M.S.; Ebrahim, M.K.H. Exogenous spermidine enhances expression of Calvin cycle genes and photosynthetic efficiency in sweet sorghum seedlings under salt stress. Biol. Plant. 2019, 63, 511–518. [Google Scholar]
  60. Artiola, J.; Rasmussen, C.; Freitas, R. Effects of a Biochar-Amended Alkaline Soil on the Growth of Romaine Lettuce and Bermudagrass. Soil Sci. 2012, 177, 561–570. [Google Scholar] [CrossRef]
  61. Gao, Z.; Han, J.; Mu, C.; Lin, J.; Li, X.; Lin, L.; Sun, S. Effects of Saline and Alkaline Stresses on Growth and Physiological Changes in Oat (Avena sativa L.) Seedlings. Not. Bot. Horti. Agrobot. Cluj-Napoca 2014, 42, 357–362. [Google Scholar] [CrossRef] [Green Version]
  62. Dotaniya, M.L.; Pingoliya, K.K.; Lata, M.; Verma, R.; Regar, K.L. Role of phosphorus in chickpea (Cicer arietinum L.) production. Afr. J. Agric. Res. 2014, 9, 3736–3743. [Google Scholar]
  63. Meng, X.; Chen, W.W.; Wang, Y.Y.; Huang, Z.R.; Ye, X.; Chen, L.S.; Yang, L.T. Effects of phosphorus deficiency on the absorption of mineral nutrients, photosynthetic system performance and antioxidant metabolism in Citrus grandis. PLoS ONE 2021, 16, e0246944. [Google Scholar] [CrossRef]
  64. Sirisuntornlak, N.; Ullah, H.; Sonjaroon, W.; Anusontpornperm, S.; Arirob, W.; Datta, A. Interactive Effects of Silicon and Soil pH on Growth, Yield and Nutrient Uptake of Maize. Silicon 2021, 13, 289–299. [Google Scholar] [CrossRef]
  65. Alimuddin, S.; Musa, Y.; Azrai, M.; Asrul, L. Effect of boron on flowering, yield components and grain yield of two prolific maize (Zea mays L.) hybrids. IOP Conference Series: Environ. Earth Sci. 2020, 484, 012076. [Google Scholar] [CrossRef]
  66. Goldberg, S.; Lesch, S.M.; Suarez, D.L. Predicting selenite adsorption by soils using soil chemical parameters in the constant capacitance model. Geochim. Et Cosmochim. Acta 2007, 71, 5750–5762. [Google Scholar] [CrossRef]
  67. Wang, N.; Yang, C.; Pan, Z.; Liu, Y.; Peng, S. Boron deficiency in woody plants: Various responses and tolerance mechanisms. Front. Plant Sci. 2015, 6, 916. [Google Scholar] [CrossRef] [Green Version]
  68. Roosta, H.R. Interaction between water alkalinity and nutrient solution ph on the vegetative growth, chlorophyll fluorescence and leaf magnesium, iron, manganese, and zinc concentrations in lettuce. J. Plant Nutr. 2011, 34, 717–731. [Google Scholar] [CrossRef]
  69. Millaleo, R.; Reyes- Diaz, M.; Ivanov, A.G.; Mora, M.L.; Alberdi, M. Manganese as essential and toxic element for plants: Transport, accumulation and resistance mechanisms. Soil Sci. Plant Nutr. 2010, 10, 470–481. [Google Scholar] [CrossRef] [Green Version]
  70. George, E.; Horst, W.J.; Neumann, E. Chapter 17—Adaptation of Plants to Adverse Chemical Soil Conditions. In Marschner’s Mineral Nutrition of Higher Plants, 3rd ed.; Marschner, P., Ed.; Academic Press: San Diego, CA, USA, 2012; pp. 409–472. [Google Scholar] [CrossRef]
  71. Hu, X.F.; Wu, A.Q.; Wang, F.C.; Chen, F.S. The effects of simulated acid rain on internal nutrient cycling and the ratios of Mg, Al, Ca, N, and P in tea plants of a subtropical plantation. Environ. Monit. Assess. 2019, 191, 99. [Google Scholar] [CrossRef]
  72. Duan, X.; Hu, X.; Chen, F.; Deng, Z. Effects of Simulated Acid Rain and Aluminum Enrichment on Growth and Photosynthesis of Tea Seedlings. Adv. Mat. Res. 2012, 610–613, 181–185. [Google Scholar] [CrossRef]
  73. Henriques, F.S. Gas exchange, chlorophyll a fluorescence kinetics and lipid peroxidation of pecan leaves with varying manganese concentrations. Plant Sci. J. 2003, 165, 239–244. [Google Scholar] [CrossRef]
  74. Verma, K.; Zeng, X.-P.; Zeng, Y.; Li, D.-M.; Guo, D.-J.; Rajput, V.; Chen, G.-L.; Barakhov, A.; Minkina, T.; Li, Y. Characteristics of leaf stomata and their relationship with photosynthesis in Saccharum officinarum under drought and silicon application. ACS Omega 2020, 5, 24145–24153. [Google Scholar] [CrossRef] [PubMed]
  75. Tavakkoli, E.; Lyons, G.; English, P.; Guppy, C.N. Silicon nutrition of rice is affected by soil pH, weathering and silicon fertilization. Soil Sci. Plant Nutr. 2011, 174, 437–446. [Google Scholar] [CrossRef]
  76. Jiang, Y.; Huang, B. Effects of calcium on antioxidant activities and water relations associated with heat tolerance in two cool-season grasses. J. Exp. Bot. 2001, 52, 341–349. [Google Scholar] [CrossRef]
  77. Sharma, P.; Jha, A.B.; Dubey, R.S.; Pessarakli, M. Reactive oxygen species, oxidative damage, and antioxidative defense mechanism in plants under stressful conditions. J. Bot. 2012, 2012, 217037. [Google Scholar] [CrossRef] [Green Version]
  78. Castro, B.; Citterico, M.; Kimura, S.; Stevens, D.M.; Wrzaczek, M.; Coaker, G. Stress-induced reactive oxygen species compartmentalization, perception and signalling. Nat. Plants 2021, 7, 403–412. [Google Scholar] [CrossRef]
  79. Noctor, G.; Mhamdi, A.; Foyer, C.H. The roles of reactive oxygen metabolism in drought: Not so cut and dried. J. Plant Physiol. 2014, 164, 1636–1648. [Google Scholar] [CrossRef] [Green Version]
  80. Wang, L.; Sadeghnezhad, E.; Guan, P.; Gong, P. Review: Microtubules monitor calcium and reactive oxygen species signatures in signal transduction. Plant Sci. J. 2021, 304, 110589. [Google Scholar] [CrossRef]
  81. Kim, C.; Meskauskiene, R.; Zhang, S.; Lee, K.P.; Lakshmanan Ashok, M.; Blajecka, K.; Herrfurth, C.; Feussner, I.; Apel, K. Chloroplasts of Arabidopsis are the source and a primary target of a plant-specific programmed cell death signaling pathway. Plant Cell 2012, 24, 3026–3039. [Google Scholar] [CrossRef] [Green Version]
  82. Yang, J.; Sardar, H.S.; McGovern, K.R.; Zhang, Y.; Showalter, A.M. A lysine-rich arabinogalactan protein in Arabidopsis is essential for plant growth and development, including cell division and expansion. Plant J. 2007, 49, 629–640. [Google Scholar] [CrossRef]
  83. Kim, H.; Hwang, H.; Hong, J.W.; Lee, Y.N.; Ahn, I.P.; Yoon, I.S.; Yoo, S.D.; Lee, S.; Lee, S.C.; Kim, B.G. A rice orthologue of the ABA receptor, OsPYL/RCAR5, is a positive regulator of the ABA signal transduction pathway in seed germination and early seedling growth. J. Exp. Bot. 2012, 63, 1013–1024. [Google Scholar] [CrossRef] [Green Version]
  84. Osakabe, Y.; Maruyama, K.; Seki, M.; Satou, M.; Shinozaki, K.; Yamaguchi-Shinozaki, K. Leucine-rich repeat receptor-like kinase1 is a key membrane-bound regulator of abscisic acid early signaling in Arabidopsis. Plant Cell 2005, 17, 1105–1119. [Google Scholar] [CrossRef] [Green Version]
  85. Han, S.; Min, M.K.; Lee, S.Y.; Lim, C.W.; Bhatnagar, N.; Lee, Y.; Shin, D.; Chung, K.Y.; Lee, S.C.; Kim, B.G.; et al. Modulation of ABA signaling by altering motif of PP2Cs in Oryza sativa. Mol. Plant 2017, 10, 1190–1205. [Google Scholar] [CrossRef] [Green Version]
  86. Takahashi, F.; Mizoguchi, T.; Yoshida, R.; Ichimura, K.; Shinozaki, K. Calmodulin-dependent activation of MAP kinase for ROS homeostasis in Arabidopsis. Mol. Cell 2011, 41, 649–660. [Google Scholar] [CrossRef]
  87. Danquah, A.; de Zélicourt, A.; Boudsocq, M.; Neubauer, J.; Frei dit Frey, N.; Leonhardt, N.; Pateyron, S.; Gwinner, F.; Tamby, J.P.; Ortiz-Masia, D.; et al. Identification and characterization of an ABA-activated MAP kinase cascade in Arabidopsis thaliana. Plant J. 2015, 82, 232–244. [Google Scholar] [CrossRef]
  88. Steinbrenner Adam, D.; Muñoz-Amatriaín, M.; Chaparro Antonio, F.; Aguilar-Venegas Jessica, M.; Lo, S.; Okuda, S.; Glauser, G.; Dongiovanni, J.; Shi, D.; Hall, M.; et al. A receptor-like protein mediates plant immune responses to herbivore-associated molecular patterns. Proc. Natl. Acad. Sci. USA 2020, 117, 31510–31518. [Google Scholar] [CrossRef]
  89. Wang, H.-Y.; Klatte, M.; Jakoby, M.; Bäumlein, H.; Weisshaar, B.; Bauer, P. Iron deficiency-mediated stress regulation of four subgroup Ib BHLH genes in Arabidopsis thaliana. Planta 2007, 226, 897–908. [Google Scholar] [CrossRef] [Green Version]
  90. Gupta, A.S.; Heinen, J.L.; Holaday, A.S.; Burke, J.J.; Allen, R.D. Increased resistance to oxidative stress in transgenic plants that overexpress chloroplastic Cu/Zn superoxide dismutase. Proc. Natl. Acad. Sci. USA 1993, 90, 1629–1633. [Google Scholar] [CrossRef] [Green Version]
  91. Kusvuran, S.; Kiran, S.; Ellialtioglu, S. Antioxidant enzyme activities and abiotic stress tolerance relationship in vegetable crops. In Book Abiotic and Biotic Stress in Plants-Recent Advances and Future Perspectives; Shanker, A.K., Shanker, C., Eds.; IntechOpen: London, UK, 2016; pp. 481–506. [Google Scholar] [CrossRef] [Green Version]
  92. Nishiyama, Y.; Allakhverdiev, S.I.; Yamamoto, H.; Hayashi, H.; Murata, N. Singlet oxygen inhibits the repair of photosystem II by suppressing the translation elongation of the D1 protein in Synechocystis sp. PCC 6803. Biochemistry 2004, 43, 11321–11330. [Google Scholar] [CrossRef]
  93. Nishiyama, Y.; Murata, N. Revised scheme for the mechanism of photoinhibition and its application to enhance the abiotic stress tolerance of the photosynthetic machinery. Appl. Microbiol. Biotechnol. APPL 2014, 98, 8777–8796. [Google Scholar] [CrossRef]
  94. Brown, P.N.; Shipley, P.R. Determination of anthocyanins in cranberry fruit and cranberry fruit products by high-performance liquid chromatography with ultraviolet detection: Single-laboratory validation. J. AOAC Int. 2011, 94, 459–466. [Google Scholar] [CrossRef] [Green Version]
  95. Li, Y.; He, N.; Hou, J.; Xu, L.; Liu, C.; Zhang, J.; Wang, Q.; Zhang, X.; Wu, X. Factors Influencing Leaf Chlorophyll Content in Natural Forests at the Biome Scale. Front. Ecol. Evol. 2018, 6, 64. [Google Scholar] [CrossRef] [Green Version]
  96. Ren, X.X.; Liu, Y.; Jeong, H.K.; Jeong, B.R. Supplementary Light Source Affects the Growth and Development of Codonopsis lanceolata Seedlings. Int. J. Mol. Sci. 2018, 19, 3074. [Google Scholar] [CrossRef] [Green Version]
Figure 1. Influence of different pH treatments on the flowering features of P. suffruticosa ‘Luoyanghong’. (a) Morphology of flowers, (b) flower diameter, (c) flower stalk length, (d) anthocyanin accumulation in petal, and (e,f) flower color indexes. S0, bud sprouting stage; S1, hard bud stage; S2, loose bud stage; S3, half open stage; S4, fully opened stage. Scale bar is 1 cm. Asterisks and different lowercase letters indicate significant differences among different treatments in leaves (Duncan’s test at p < 0.05 after analysis of variance; data are shown as mean ± SE).
Ijms 23 05094 g001
Figure 2. Influence of different pH treatments on the leaf and root growth of P. suffruticosa ‘Luoyanghong’. (a) Morphological changes of leaf, bar = 5 cm; (b,c) chlorophyll and carotenoid contents; (d) leaf area; (e) leaf biomass; (f) morphological changes of root, bar = 1 cm; (g,h) biomass of adult roots and fibrous roots; and (i,j) the distribution of root. S0, bud sprouting stage; S1, hard bud stage; S2, loose bud stage; S3, half open stage; S4, fully opened stage; S5, two weeks after the fully opened stage; S6, four weeks after the fully opened stage. Asterisks and different lowercase letters indicate significant differences among different treatments in leaves (Duncan’s test at p < 0.05 after analysis of variance; data are shown as mean ± SE).
Ijms 23 05094 g002
Figure 3. DEG analysis via (a) KOG functional classification, (b) KEGG pathways distribution, and (c) Gene Ontology (GO) assignments for tree peony transcriptome unigenes.
Ijms 23 05094 g003
Figure 4. Gene expression patterns related to the flowering, growth, hormone, signal, and regulation of transcription and translation by FPKM analysis in three samples.
Ijms 23 05094 g004
Figure 5. Influence of different pH treatments on the photosynthetic indexes of P. suffruticosa ‘Luoyanghong’ at four consecutive weekly stages from the bud initiation stage to 4 weeks after flowering stage. (a) Net photosynthetic rate (Pn); (b) transpiration rate (Tr); (c) stomatal conductance (Gs); (d) intercellular CO2 levels (Ci); (e) water use efficiency (WUE) values; and (f) the accumulation of carbohydrates and protein. S0, bud sprouting stage; S1, hard bud stage; S2, loose bud stage; S3, half open stage; S4, fully opened stage; S5, two weeks after the fully opened stage; S6, four weeks after the fully opened stage. Asterisks and different lowercase letters indicate significant differences among different treatments in leaves (Duncan’s test at p < 0.05 after analysis of variance; data are shown as mean ± SE).
Ijms 23 05094 g005
Figure 6. Influence of different pH treatments on the characteristics of stomata and chloroplast of P. suffruticosa ‘Luoyanghong’. (a) The morphology of stomata, bar = 50 µm; (b) stomata size; (c) stomata density; (d) stomata aperture; (e) expression patterns of genes involved in stomatal development and movement; (f) the structure of leaf and chloroplast with different magnification of 700× (left), 3000× (middle), and 50,000× (right); and (g) the characteristics of chloroplast. UE, upper epidermis; PL, palisade mesophyll; CW, cell wall; CP, chloroplast; GL, grana lamella; M, mitochondria; O, osmiophilic granule; SG, starch grain. S0, bud sprouting stage; S1, hard bud stage; S2, loose bud stage; S3, half open stage; S4, fully opened stage; S5, two weeks after the fully opened stage; S6, four weeks after the fully opened stage. Asterisks and different letters indicate significant differences from the control group (one-way ANOVA, p < 0.05).
Ijms 23 05094 g006
Figure 7. Expression pattern of DEGs involved in the light reactions of photosynthesis situated in the KEGG pathway by FPKM analysis.
Ijms 23 05094 g007
Figure 8. Expression pattern of DEGs shown to be involved in the Calvin cycle of photosynthesis by FPKM analysis.
Ijms 23 05094 g008
Figure 9. Influence of different pH treatments on H2O2 content, the activities of antioxidant enzymes, and nutrient assimilation. (a) H2O2 content, (b) SOD activity, (c) POD activity, (d) CAT activity, (e) heatmap of gene expression of ROS signal cascades and scavenging enzymes, (f,g) nutrient uptake, and (h) heatmap of gene expression of nutrient transporter. Different lowercase letters indicate significant differences among different treatments in leaves (Duncan’s test at p < 0.05 after analysis of variance; data are shown as mean ± SE).
Ijms 23 05094 g009
Figure 10. An overview of the effects of acidity and alkaline stress on flowering, plant growth, photosynthesis, oxidative stress, nutrient relation, and the regulation pathways in the tree peony plant. The upward arrow means increase, and the downward arrow means decrease. SAM is short for shoot apical meristem (SAM) and AM is short for axillary meristem, which are important for flowering and branching patterns, respectively.
Ijms 23 05094 g010
Table 1. Influence of different pH treatments on the morphological characteristics of flower quality at the full flowering stage. Different lowercase letters indicate significant differences among different treatments in leaves (Duncan’s test at p < 0.05 after analysis of variance; data are shown as mean ± SE).
TreatmentFlower Diameter (cm)Flower Height (cm)Flower Stalk Length (cm)Flower Stalk Diameter (cm)Fresh Weight (g)Dry Weight (g)No. of PetalsAbnormal Flowering Percentage (%)
pH 4.010.77 ± 0.38b3.84 ± 0.17b20.83 ± 0.77b6.9 ± 0.26b15.24 ± 0.61b3.12 ± 0.05a75.66 ± 4.33b26
pH 7.012.14 ± 0.28a6.16 ± 0.29a23.44 ± 0.62a7.82 ± 0.28a21.75 ± 0.82a3.48 ± 0.13a90.16 ± 2.18a8
pH 10.010.27 ± 0.43b4.05 ± 0.28b21.94 ± 0.3ab7.08 ± 0.18b16.22 ± 0.73b3.03 ± 0.08a81.83 ± 2.3ab33
Table 2. Identification of the candidate genes involved in photosynthesis.
No.Gene NameUniGene IDSequence Length (bp)Coding Sequence Length (bp)Gene NameHomology Species and GenBank NumberCDS Length of Homology Species (bp)
PSI
1PsaCCL5623.Contig3 All1455945Photosystem I iron-sulfur centerActinidia chinensis, NKQK01000029.11212
2PsaCCL553.Contig3 All1288213Photosystem I iron-sulfur centerNicotiana tomentosiformis, XM 009612956.3438
3PsaFCL15133.Contig3 All651237Photosystem I reaction center subunit IIIAbrus precatorius, XM 027497800.1669
4PsaEUnigene26014 All723501photosystem I reaction center subunit IVJuglans regia, XM 018994420.2573
5PsaH1CL553.Contig2 All1316216photosystem I reaction center subunit VI-1Nicotiana tomentosiformis, XM 009612956.3438
6PsaNUnigene16611 All396162Photosystem I reaction center subunit NCephalotus follicularis, BDDD01006702.1429
7PSA2Unigene40033 All1497501PHOTOSYSTEM I ASSEMBLY 2Morus notabilis, XM 024170885.1363
PSII
8PsbBCL2899.Contig8 All93681527Photosystem II protein D2 proteinPaeonia obovata, YP 009114474.11527
9STN8CL5574.Contig1 All1222489Serine/threonine-protein kinase STN8Pistacia vera, XM 031391586.11500
10PsbHCL2899.Contig10 All2735345Photosystem II phosphoproteinPaeonia obovata, NC 026076.1222
11PSBO1CL7453.Contig2 All1521786Oxygen-evolving enhancer protein 1Nicotiana attenuata, XM 019379586.1999
12PPD3CL2018.Contig1 All1082555psbP domain-containing protein 3Carica papaya, XM 022046797.1762
13PPD7Unigene11530 All1296390psbP domain-containing protein 7Populus euphratica, XM 011038539.1858
14PSBSCL2734.Contig2 All381282photosystem II 22 kDaTanacetum cinerariifolium, BKCJ010081569.1550
Light-harvesting complex
15PAPP5CL5682.Contig2 All718615 partialserine/threonine-protein phosphatase 5Hibiscus syriacus, XM 039206886.11623
16CAB6ACL7283.Contig4 All683234chlorophyll a-b binding protein 6ABenincasa hispida, XM 039035318.1741
17CAB7CL349.Contig1 All399399chlorophyll a-b binding protein 7Tripterygium wilfordii, XM 038846989.1939
18CAB5Unigene44832 All372255chlorophyll a-b binding protein 5Amborella trichopoda, XM 006836691.3795
19CABCL1191.Contig3 All508321chlorophyll a-b binding proteinVitis vinifera, XM 010657584.1816
20CAB5CL6697.Contig2 All222166chlorophyll a-b binding protein 5Telopea speciosissima, XM 043835320.1825
Photosynthetic electron transport chain
21ETFQOCL8017.Contig1 All1732732 partialelectron transfer flavoprotein-ubiquinone oxidoreductaseCannabis sativa, XM 030652288.11329
22CBR1CL13977.Contig4 All1536738NADH--cytochrome b5 reductase 1-likeVitis riparia, XM 034832700.1837
23NAXDCL2990.Contig3 All1485996ATP-dependent NAD(P)H-hydrate dehydrataseJuglans microcarpa x Juglans regia,
XM 041145087.1
1137
24CytfUnigene46676 All336219Cytochrome fEurycoma longifolia, MH751519.1963
25CAOCL1939.Contig9 All24221215Chlorophyllide a oxygenaseJuglans regia, XM 018952223.21605
26fdxACL647.Contig1 All14254683Fe-4S ferredoxinLupinus albus, WOCE01000019.11014
27MFDRUnigene11788 All1231957NADPH:adrenodoxin oxidoreductaseCarya illinoinensis, XM 043121482.11176
28petEUnigene20162 All747555Plastocyanin-like proteinCorchorus olitorius, AWUE01016532.1534
29MNHDCL9837.Contig2 All2528324NADH-Ubiquinone/plastoquinone complex I proteinPrunus dulcis, AP021287.11944
30ndhB2CL12489.Contig1 All243165NADH-plastoquinone oxidoreductase subunit 2Iseilema macratherum, NC 030611.11533
31ndh2CL2308.Contig4 All1627213Quinone oxidoreductaseVitis vinifera, QGNW01001796.11089
32ndhOCL11886.Contig4 All681189NAD(P)H-quinone oxidoreductase subunit OCarica papaya, XM 022044181.1501
33FBN5CL269.Contig4 All1159792Fibrillin-5Prunus dulcis, XM 034364758.1816
34PNSL1Unigene11863 All697357Photosynthetic NDH subunit of lumenal location 1Vitis vinifera, QGNW01000023.1708
35PNSL1Unigene27888 All1097342Photosynthetic NDH subunit of lumenal location 1Vitis vinifera, QGNW01000023.1708
36PNSL3Unigene10120 All1308633Photosynthetic NDH subunit of lumenal location 3Camellia sinensis, XM 028241493.1666
37DAPB3CL1744.Contig1 All1424605 partialDihydrodipicolinate reductase-like protein CRR1Juglans regia, XM 018993624.2903
Thylakoid formation and chloroplast development
38THF1CL14413.Contig2 All971759THYLAKOID FORMATION 1Senna tora, JAAIUW010000012.1897
39TERCCL2696.Contig4 All993804thylakoid membrane protein TERCCamellia sinensis, XM 028237267.11077
40RPL24CL1839.Contig2 All103048050S ribosomal protein L24Telopea speciosissima, XM 043834893.1480
41ALB3L2Unigene39908 All1042666ALBINO3-like protein 2Quercus suber, XM 024024971.1726
42ALB3L2CL1726.Contig1 All1396567ALBINO3-like protein 2Vitis riparia, XM 034854167.1921
43OBGLCL588.Contig4 All1305996GTP-binding proteinNelumbo nucifera, XM 010251428.2990
44CSP41BCL2622.Contig3 All1339192chloroplast stem-loop binding protein of 41 kDa bCannabis sativa, XM 030649812.11146
Chlorophyll biosynthesis
45CHLI1CL10274.Contig3 All31531083magnesium chelatase subunit I (CHLI)Ziziphus jujuba, XM 016018749.21266
46PPHCL6625.Contig1 All1231636pheophytinaseManihot esculenta, XM 021744990.21116
47CLH1CL7533.Contig2 All1010690chlorophyllase-1-likeVitis riparia, XM 034834294.1960
48HCARUnigene52328 All10765857-hydroxymethyl chlorophyll a reductaseVitis vinifera, XM 019220129.11128
49NOLCL5229.Contig4 All1303852chlorophyll(ide) b reductase NOLPrunus mume, XM 008233562.21059
50CAOUnigene50987 All211162chlorophyll a oxygenaseCapsicum annuum, DQ423120.1299
Chlorophyll catabolism
51PAOCL12667.Contig2 All2501444 partialpheophorbide a oxygenaseParasponia andersonii, JXTB01000035.11626
ATP synthase
52ADKCL5310.Contig4 All1007714adenylate kinaseTripterygium wilfordii, KAF5731549.1897
53ATPDCL80.Contig9 All2583267ATP synthase delta chainFragaria vesca, XM 004290397.2753
54ATPDCL80.Contig10 All2488267ATP synthase delta chainFragaria vesca, XM 004290397.2753
55ATPECL8509.Contig1 All1125402ATP synthase CF1 epsilon chainPaeonia ludlowii, NC 035623.1402
56ATPECL633.Contig10 All14,0201527ATP synthase CF1 alpha subunitPaeonia obovata, YP 009114434.11527
57ATPDCL80.Contig15 All2028276ATP synthase delta chainFragaria vesca subsp. Vesca, XM 004290397.2753
58ATPDCL80.Contig14 All1868270ATP synthase delta chainFragaria vesca, XM 004290397.2753
59ATPACL633.Contig6 All13,8861527ATP synthase CF1 alpha subunitPaeonia obovata, YP 009114434.11527
60ATPACL633.Contig12 All13,3081527ATP synthase CF1 alpha subunitPaeonia obovata, YP 009114434.11527
61AK4CL9808.Contig2 All806669Adenylate kinase 4Populus alba, XM 035053161.1741
Carbon fixation
62CBBY-likeCL3370.Contig1 All936708riboflavin kinase Bifunctional riboflavin kinase/FMN phosphataseCamellia sinensis, XM 028260557.1891
63CA1PCL13509.Contig2 All18699002-carboxy-D-arabinitol-1-phosphataseCamellia sinensis, XM 028230931.11605
64PGM2CL3429.Contig1 All1293243phosphoglycerate mutase, 2,3-bisphosphoglycerate-independentActinidia rufa, GFZ05492.1258
65RBCS-F1CL4922.Contig11 All700279ribulose-1,5-bisphosphate carboxylase small chain F1Lupinus angustifolius, XM 019587259.1531
66RBCSCL4922.Contig12 All290261ribulose bisphosphate carboxylase small chainTanacetum cinerariifolium, BKCJ010045582.11899
67RBCSCL4922.Contig3 All310251ribulose bisphosphate carboxylase small subunitCarya illinoinensis, XM 043105128.1549
68PGKCL3299.Contig2 All16821368phosphoglycerate kinaseHerrania umbratica, XM 021443140.11206
69FBACL12763.Contig2 All754216Fructose-bisphosphate aldolaseApostasia shenzhenica, KZ451885.11110
70FbpCL1239.Contig5 All770219fructose-1,6-bisphosphataseVigna angularis, XM 017556201.1477
71PFKFBUnigene23926 All210817886-phosphofructo-2-kinase/fructose-2,6-bisphosphataseVitis riparia, XM 034831796.12271
72TKLCL7000.Contig2 All846321transketolaseFragaria vesca, FJ887833.1363
Stomatal development and movement
73BCAUnigene56632 All1532414carbonic anhydraseVitis riparia, XM 034820072.1984
74HT1Unigene2658 All20081122Serine/threonine-protein kinase HT1Vitis vinifera, XM 002270717.31125
Table 3. Identification of the candidate genes involved in stress and nutrient transport.
No.Gene NameUniGene IDSequence Length (bp)Coding Sequence Length (bp)Gene NameHomology Species and GenBank NumberCDS Length of Homology Species (bp)
Stress-related genes
1SODCL12133.Contig2 All752663Superoxide dismutase [Fe]Quercus suber, XM 024033160.1936
2SODCL11553.Contig1_All235114superoxide dismutaseVitis riparia, XM_034849451.1687
3CAT1CL8683.Contig2_All241150Catalase isozyme 1Cocos nucifera, CM017878.12833
4CATCL8683.Contig3_All231129CatalaseThalictrum thalictroides, ABWDY010037995.11464
5POD20Unigene63828_All233233Peroxidase 20Populus trichocarpa, XM006368377.21017
6POD20Unigene2231_All264264Peroxidase 20Vitis vinifera, QGNW01000083.1855
7POD45Unigene79660_All336336Peroxidase 45Gossypium hirsutum, XM016865128.2996
8PODUnigene6219_All895838PeroxidaseThalictrum thalictroides, JABWDY010016849.1972
9POD48Unigene82390_All305305Peroxidase 48Malus domestica, XM029108818.1699
10PEX12CL7714.Contig3 All1173840Peroxisome biogenesis protein 12Ziziphus jujuba, XM 016020053.21182
11CYB561ACL11875.Contig1 All873669Transmembrane ascorbate ferrireductase 3Coffea arabica, XM 027240953.1663
12TCTPUnigene79230 All375300 partialTranslationally-controlled tumor proteinCapra hircus, XM 018056766.1660
13AGO1CL4080.Contig4 All36833255Protein argonaute 1Vitis vinifera, XM 002271189.33258
14RFC1CL4788.Contig6 All15581167Replication factor C subunit 1-likePopulus euphratica, XM 011015553.11302
15EX1CL5897.Contig2_All27991380EXECUTER 1Camellia sinensis, XM_028237292.11488
16EX1CL5897.Contig4_All28221095protein EXECUTER 1Camellia sinensis, XM_028237292.11488
Ion transport
17ACA12Unigene17975_All611534Calcium-transporting ATPase 12Glycine soja, XM_028369732.13162
18BOR1Unigene48447_All566174boron transporter 1Zingiber officinale, XM_042585939.12139
19BOR4Unigene41688_All263212boron transporter 4-likeRicinus communis, XM_025157068.11923
20BOR4CL3601.Contig5_All19031062boron transporter 4-likeCamellia sinensis, XM_028235763.12136
21PPT2CL4107.Contig2_All2381855phosphoenolpyruvate/phosphate translocator 2Prunus avium, XM_021948621.11014
22PHO1Unigene39529_All1188609Phosphate transporter PHO1-like 3Vitis vinifera, QGNW01000145.12394
23TDTUnigene43599_All977588tonoplast dicarboxylate transporterCamellia sinensis, XM_028254388.11644
24PHO1CL1982.Contig2_All5028774phosphate transporter PHO1 homolog 3Cannabis sativa, XM_030628536.12424
25PHO1Unigene40561_All727354phosphate transporter PHO1 homolog 3-likeVitis vinifera, XM_019218049.1614
26glpTCL8237.Contig4_All25091053glycerol-3-phosphate transporter 1Prunus avium, XM_021967732.11563
27PHO1CL14859.Contig1_All1305945phosphate transporter PHO1 homolog 3-likeCarya illinoinensis, XM_043134065.12406
28SKORUnigene48839_All228226potassium channel SKOR-likeHerrania umbratica, XM_021436349.12448
29POT17Unigene56892_All18851593potassium transporter 17Rosa chinensis, XM_024336662.21785
Table 4. Identification of the candidate genes involved in growth, flowering, and related regulation metabolism.
No.Gene NameUniGene IDSequence Length (bp)Coding Sequence Length (bp)Gene NameHomology Species and GenBank NumberCDS Length of Homology Species (bp)
Flowering-related genes
1PSDUnigene8 All1646216 partialExportin-T-like isoform X2Populus alba, XM 035040257.12892
2APRR1CL5436.Contig4 All1643813 partialTwo-component response regulator-like APRR1Vitis vinifera, QGNW01000154.11662
3JMJ18CL1104.Contig4 All35512940Lysine-specific demethylase JMJ18-like isoform X1Vitis riparia, XM 034842267.13261
4WOX1CL8062.Contig3 All1081645WUSCHEL-related homeobox 1-like, partialMacadamia integrifolia, XM 042620797.1825
5FYCL8788.Contig3 All27142313Flowering time control protein FYVitis vinifera, XM 010647342.22346
6AAOCL5090.Contig6 All1541723F-box/FBD/LRR-repeat proteinSesamum indicum, XM 011078410.21311
Plant-growth-related genes
7TGHCL845.Contig2 All999843G-patch domain-containing protein TGHActinidia rufa, BJWL01000006.1822
8MIZ1CL9598.Contig2 All895705Protein MIZU-KUSSEI 1Ricinus communis, XM 002510226.3690
9BBX19CL856.Contig1 All1081672B-box zinc finger protein 19 isoform X1Ziziphus jujuba, XM 016036814.2639
Genes involved in cell growth and division
10SEC10CL14716.Contig6 All30722505Exocyst complex component Sec10-likeParasponia andersonii, JXTB01000066.12538
11CDC27BCL7886.Contig1 All1665735 partialCell division cycle protein 27 homolog B isoform X2Manihot esculenta, XM 021741898.22190
12CALS7CL542.Contig25 All2923360 partialCallose synthase 7-likeQuercus suber, XM 024021939.12802
13TUBA5CL4204.Contig2 All17411350Tubulin alpha-5 chainMacadamia integrifolia, XM 042625060.11353
14TSSCL4166.Contig4 All63175649TSSVitis vinifera, XM 002278334.45592
15EXPA1CL12917.Contig4 All1172753Expansin-A1Fragaria vesca, XM 004297244.2756
Hormone-related genes
16TMK1CL2731.Contig4 All33272901Receptor protein kinase TMK1-likeVitis vinifera, XM 002274874.42883
17YUCUnigene53925 All418315 partialIndole-3-pyruvate monooxygenase YUCCA3Cajanus cajan, XM 020366995.21293
18AFB2CL789.Contig8 All27191719AUXIN SIGNALING F-BOX 2Vitis vinifera, XM 019225111.11719
19CTR1CL7684.Contig1 All48544242Serine/threonine-protein kinase CTR1Vitis vinifera, QGNW01001367.14296
Signal transduction
20CML38Unigene2096 All371345Calcium-binding protein CML38-likeMangifera indica, XM 044647080.1423
21SK5CL5696.Contig3 All11651050Calcium-dependent protein kinase SK5-likeHevea brasiliensis, XM 021816377.11629
22IQD14Unigene40182 All1308480 partialIQ-DOMAIN 14 isoform X1Senna tora, JAAIUW010000012.11536
Regulation of transcription and translation
23BPG2CL6966.Contig2 All23271671BRASSINAZOLE INSENSITIVE PALE GREEN 2Vitis vinifera, XM 010655630.21983
24MTERF4CL4833.Contig7 All21131578Transcription termination factor MTERF4Carya illinoinensis, XM 043135353.11575
25ASK1Unigene19526 All20641230Shaggy-related protein kinase alphaQuercus lobata, XM 031102093.11230
26BLH1CL1863.Contig5 All34502073BEL1-like homeodomain protein 1Morella rubra, RXIC02000092.12091
27FRSUnigene39555 All1222399 partialFAR1-RELATED SEQUENCE 5-likeRosa chinensis, XM 040508409.11290
28MBDUnigene46268 All905816Methyl-CpG-binding domain-containing protein 10-like isoform X2Juglans microcarpa, XM 041162513.1822
29MBD7CL7329.Contig2 All958885Methyl-CpG-binding domain-containing protein 5Carica papaya, XM 022038861.1738
30YRDCCL3635.Contig6 All1361873YRDC domain-containing proteinTheobroma cacao, XM 007016659.2837
31PRP40ACL379.Contig13 All35023117Pre-mRNA-processing protein 40ANelumbo nucifera, XM 010275221.23141
32PRP8AUnigene23105 All36672472 partialPre-mRNA-processing-splicing factor 8AVitis vinifera, XM 003632714.37044
33eIF3fUnigene39851 All1004597Eukaryotic translation initiation factor 3 subunit F-likeTelopea speciosissima, XM 043846840.1858
34SPL39CL6274.Contig5 All17381020Squamosa-binding protein-like 39Paeonia suffruticosa, MT239473.12700
35U2AF65BCL12897.Contig1 All942537 partialSplicing factor U2af large subunit B-like isoform X1Telopea speciosissima, XM 043832750.11665
36GBF3CL1061.Contig4 All1254909G-box-binding factor 3Benincasa hispida, XM 039043265.11254
Publisher’s Note: MDPI stays neutral with regard to jurisdictional claims in published maps and institutional affiliations.

