1. Introduction
Clinical approaches for the management of deep caries and symptomatic pulpitis traditionally involve removal of the entire pulp tissue as part of root canal treatment (RCT), a process which is destructive, costly, and decreases the functional lifespan of the tooth [
1]. Given these shortcomings, attention has now shifted towards vital pulp treatment (VPT) procedures, which aim to preserve the pulp and stimulate its natural reparative abilities [
2]. Current VPT materials, such as mineral trioxide aggregate (MTA), have demonstrated improved success rates for the treatment of pulpitis compared to calcium hydroxide materials; however, many of these new materials remain limited by their cytotoxicity, non-specific action, poor handling properties, and unpredictable reparative capacity [
3].
Exciting opportunities exist for the development of new dental biomaterials, which target the cellular agents regulating dental pulp reparative processes, including epigenetic modulators, such as DNA methyltransferases (DNMTs) and histone deacetylases (HDACs). The therapeutic potential for DNMT inhibitors (DNMTis) has previously been demonstrated, with treatment of human dental pulp cells (DPCs) with the DNMTi 5-aza-2′-deoxycytidine (5-AZA-CdR) resulting in upregulation of a panel of odontogenic markers, such as dentin matrix acidic phosphoprotein 1 (DMP1) and dentin sialophosphoprotein (DSPP), as well as an increase in mineralisation activity [
4]. Extensive research has also highlighted the potential therapeutic use of HDAC inhibitors (HDACis) for use in regenerative endodontics. These include the pan-HDACis trichostatin A (TSA), valproic acid (VPA), and suberoylanilide hydroxamic acid (SAHA), among others. In a series of studies, these HDACis were shown to stimulate differentiation and mineralisation in both rodent and human DPC cultures [
5,
6,
7,
8], highlighting an exciting avenue for further translational research.
Recently, the role of non-coding RNAs in dental pulp mineralisation and repair has also been highlighted. Specifically, a number of microRNAs (miRNAs) have been identified as being altered in expression during DPC differentiation, such as miR-20a [
9], miR-665 [
10], and miR-338-3p [
11]. Although not recognised as epigenetic modifiers in their own right, the recent literature has highlighted a significant interaction between miRNAs and epigenetic modifications, such as DNA methylation and histone acetylation, in a number of critical cellular processes, including differentiation [
12]. Therefore, it is possible that the increase in DPC mineralisation, which occurs following exposure to HDACis [
5,
6] and DNMTis [
4], may be orchestrated by, or related to, miRNA expression. At present, little is known about the nature of these interactions in DPC populations and how they might regulate dental pulp mineralisation and repair. A deeper understanding of this has the potential to lead to the discovery of novel therapeutic targets in the field of regenerative endodontics.
The miRNA expression profile of mineralising human DPCs has previously been analysed using a microarray approach [
13]. This study identified 22 differentially regulated miRNAs compared to non-mineralising DPCs after 14 days in culture, with 12 being upregulated and 10 being downregulated. Furthermore, target gene analysis identified genes associated with the Wnt and MAPK signalling pathways, which have been linked to odontoblast-like cell differentiation [
14,
15]. Although a well established and affordable method for profiling large numbers of miRNAs, microarray analysis lacks the specificity of newer high-throughput methods, such as RNA sequencing (RNAseq), as well as the capacity to detect novel miRNAs and distinguish between variants of existing miRNAs. In addition, while the role of miRNAs, both in DPC mineralisation and as orchestrators of other epigenetic modifications, is a growing area of research, the effect of epigenetic inhibitors on the global miRNA expression profile in mineralising DPCs has not yet been investigated using high-throughput methods.
Here, for the first time, the miRNA expression profile of mineralising DPCs was established using next-generation sequencing, and the effect of two pharmacological epigenetic inhibitors on this profile—a HDACi (SAHA) and a DNMTi (5-AZA-CdR)—was investigated. Furthermore, bioinformatic analyses, such as target gene prediction, pathway analysis, and GO enrichment, were carried out to determine potential mechanisms through which the miRNAs identified might regulate DPC mineralisation, as well as the effects of epigenetic modifications on these mechanisms. Finally, miRNAs were identified from these data, and their expression profiles were validated using qRT-PCR, having the purpose of identifying potential therapeutic targets. The principal aim of this research was to analyse the role of miRNAs in epigenetically-mediated DPC mineralisation, highlight mechanistic interactions, and identify specific miRNAs of interest. A secondary aim was to uncover potential avenues for further investigation, which will ultimately aid in the development of next-generation biologically-based therapeutics for use in regenerative endodontics.
3. Discussion
The molecular mechanisms underlying dental pulp mineralisation and repair are yet to be fully elucidated; however, a deeper understanding would provide exciting opportunities for the development of biologically based, topically applied therapeutic interventions for the stimulation of the natural reparative abilities of the dental pulp. Cellular processes in other parts of the body have already been shown to be regulated, at least in part, by the relationship between miRNAs and other epigenetic modifications [
31], and it is likely that DPC mineralisation is no exception.
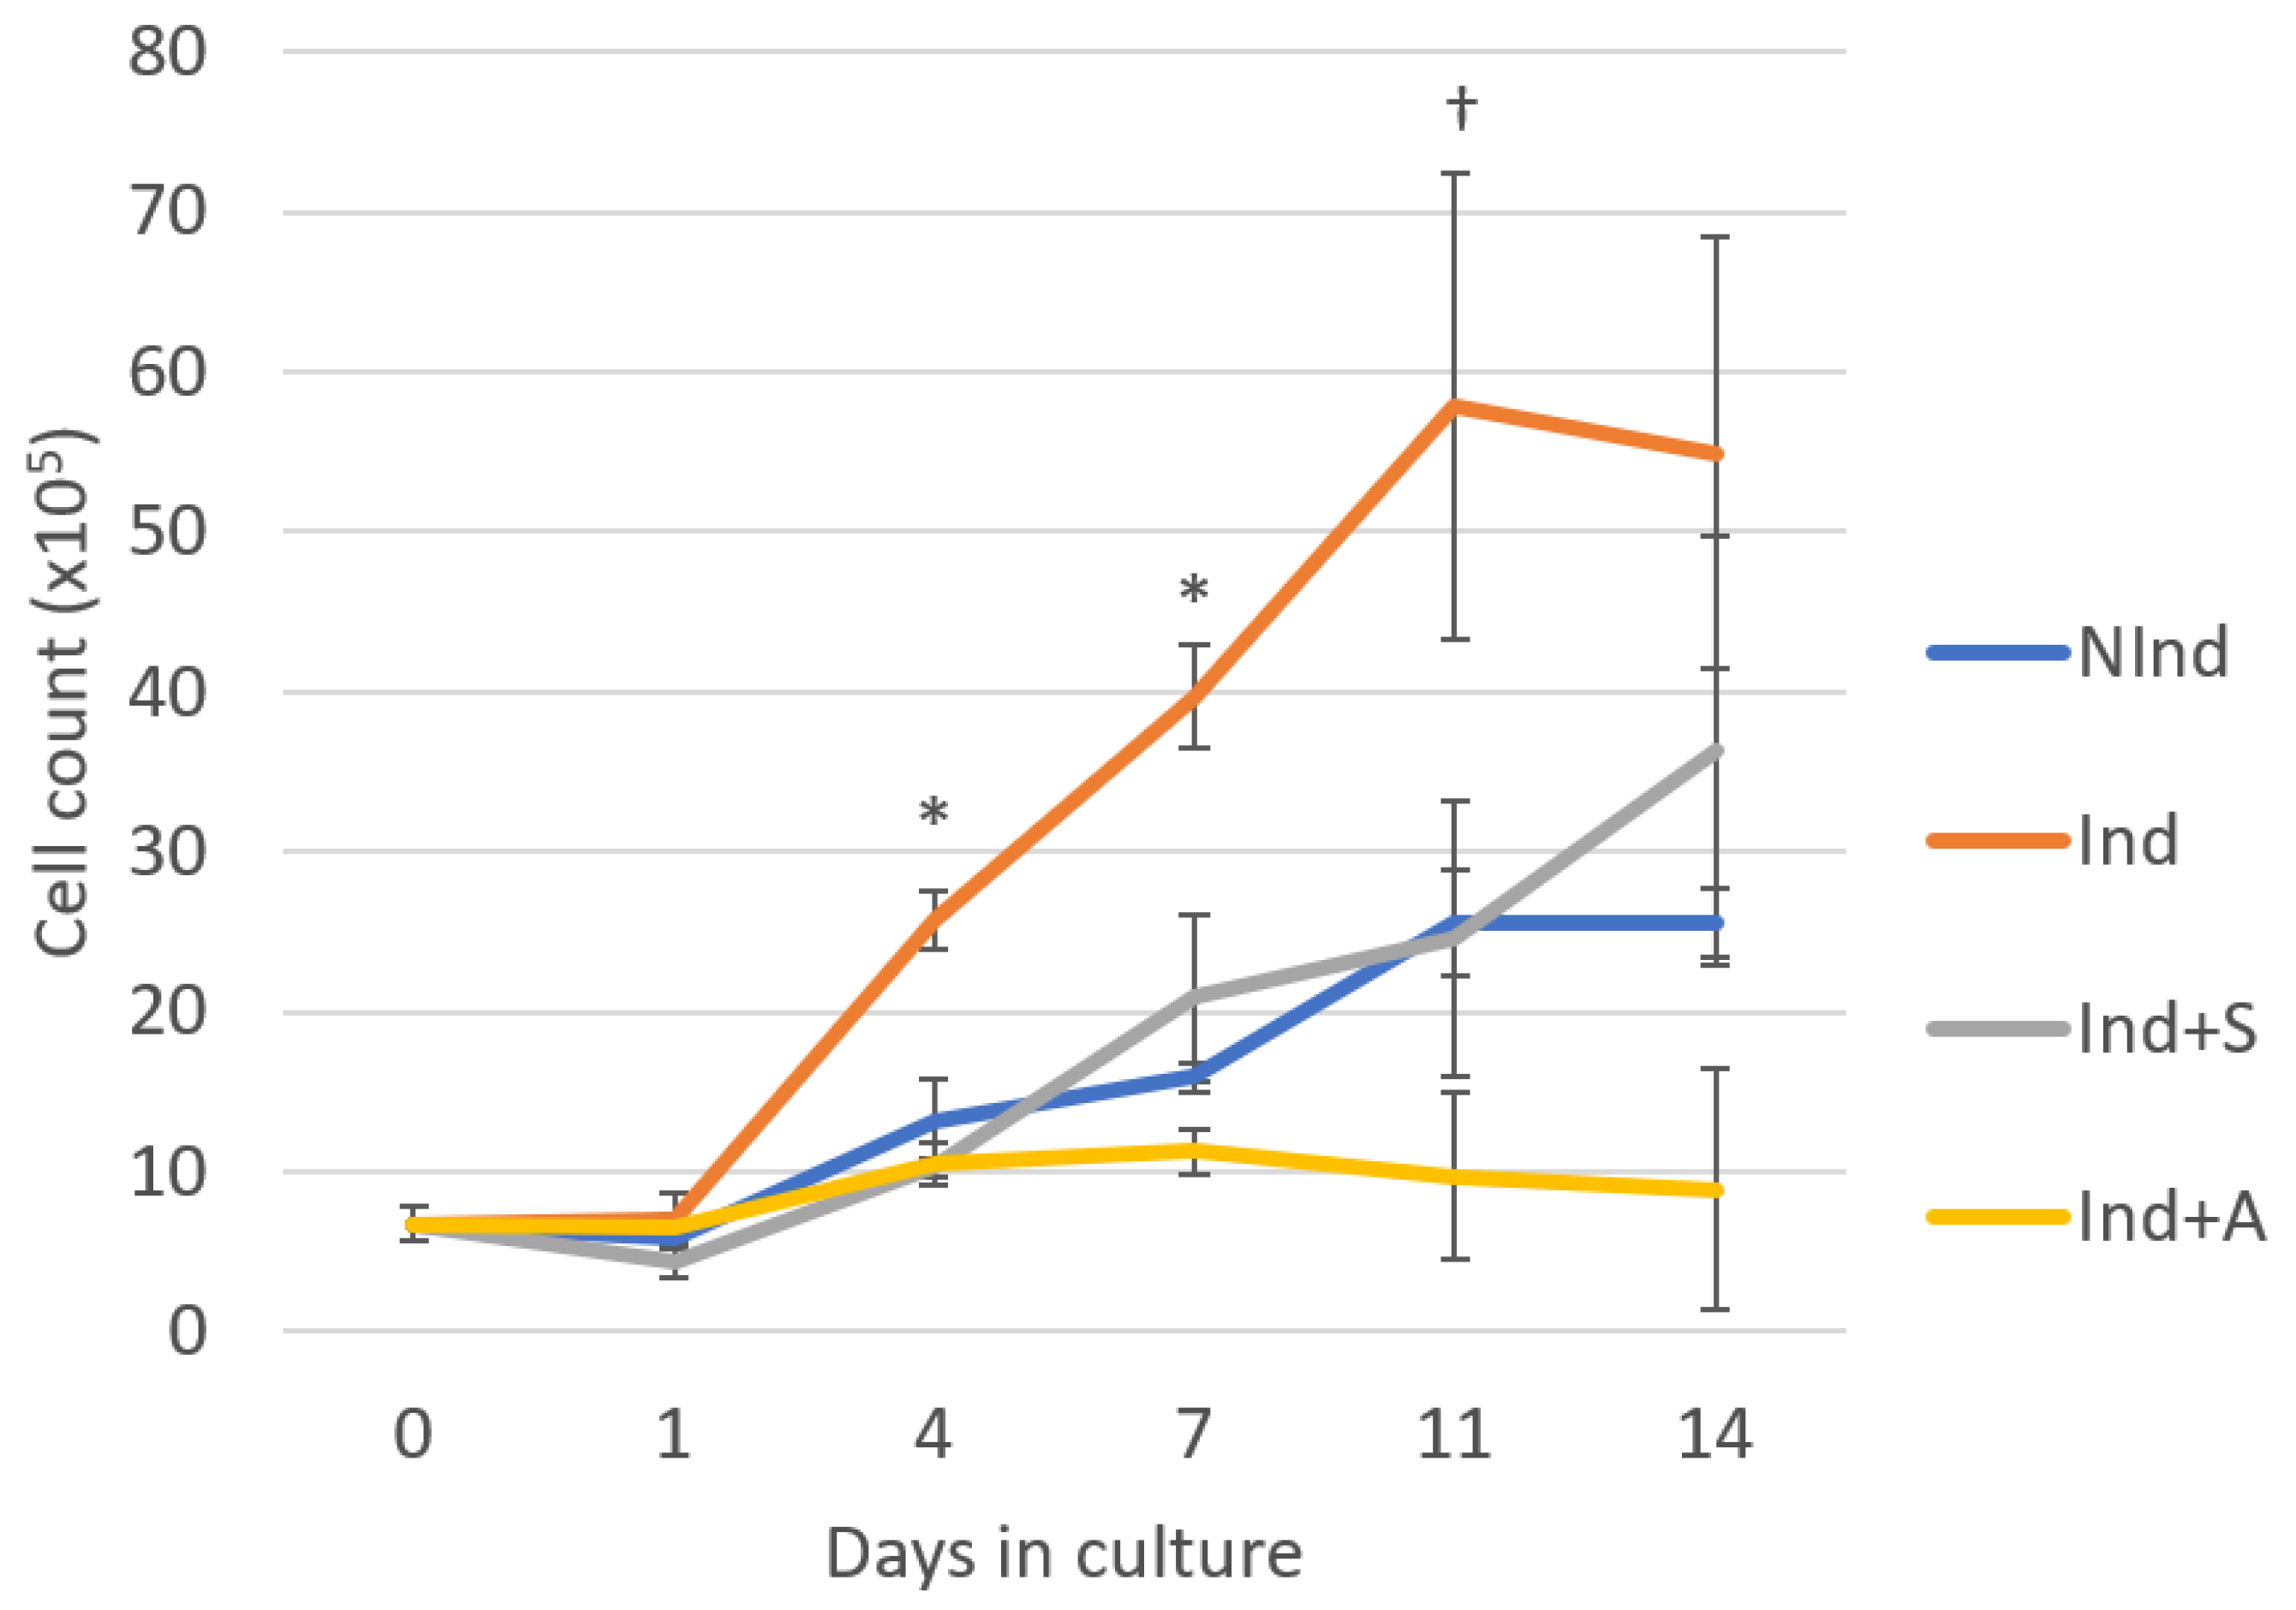
The effect of SAHA and 5-AZA-CdR on DPC growth rate was determined by Trypan Blue staining and cell counting at a range of time points from days 1 through 14. Notably, the growth curve of DPCs in the NInd group was similar to previously established growth curves of rodent DPCs cultured under similar conditions [
5]. There appeared to be minimal change in cell number between the four groups on day 1. Thereafter, culturing the cells in mineralising medium had a positive effect on DPC proliferation, while supplementary addition of both SAHA and 5-AZA-CdR attenuated cell growth. Cells exposed to SAHA displayed a cell growth profile similar to that of those cultured in normal medium, demonstrating an increase in cell number throughout the 14 days, while 5-AZA-CdR appeared to suppress cell proliferation, with no discernible change in the number of cells throughout the duration of the timecourse. Consequently, it can be concluded that, at a concentration of 1μM, both SAHA and 5-AZA-CdR suppress the growth rate of mineralising DPCs, albeit to varying degrees.
Alizarin Red S staining was used to visualise and quantify extracellular calcific nodule formation in cultures. Cultures of the NInd control did not display any red stained deposits indicative of mineralisation, as opposed to the three experimental groups, which all demonstrated strong staining visible from day 11 and increasing in intensity by day 14. At day 14 in particular, SAHA and 5-AZA-CdR both had a positive effect on mineralisation of DPCs compared to mineralising medium alone. This is consistent with previous studies, which demonstrated that short-term treatment with SAHA promoted mineralisation of rodent DPCs [
6]. 5-AZA-CdR was also previously shown to accelerate hDPC mineralization [
4]. After seven days of culture in mineralising medium and exposure to 5-AZA-CdR, there was an increase in expression of the odontogenic markers DSPP and DMP1. The transcription factors RUNX2, DLX5, and OSX were also upregulated by day 7, as was the formation of mineralised nodules, as detected by Alizarin Red S staining at 14 days [
4].
The miRNA expression profile of mineralising DPCs has previously been investigated using microarray analysis to investigate differentially expressed lncRNAs, miRNAs, and mRNAs in human dental pulp stem cells (hDPSCs), which had been induced to differentiate in vitro [
32]. The resulting data were used to construct regulatory networks in differentiating DPSCs. Another study used a microarray platform to identify differentially regulated miRNAs in human DPCs, which had been cultured in mineralising medium for 14 days [
13]. In that study, it was shown that 22 known mature miRNAs were differentially regulated, of which 10 were downregulated, and 12 were upregulated. In the current study, small RNAseq was used to investigate the miRNA expression profile of rodent DPCs, and no differentially expressed miRNAs were found in mineralising DPCs compared to non-mineralising when using the moderated
t-test combined with Storey’s bootstrapping method. Subsequently, the less stringent Mann-Whitney U test was applied, which demonstrated 43 miRNAs to be differentially regulated in DPCs cultured in mineralising medium compared to DPCs cultured in normal medium, of which 20 were upregulated and 23 were downregulated. The larger number of differentially expressed miRNAs reported in the present study when using a Mann-Whitney U test compared to the microarray analysis [
13] is possibly due to the use of rodent DPCs, rather than human DPCs. Alternatively, it may reflect the use of RNAseq, which can accurately detect a higher percentage of differentially expressed genes compared to microarray analysis, with an increased sensitivity for genes with relatively low expression levels [
33,
34].
The number of differentially expressed miRNAs (>1.5 fold) in the Ind+S and Ind+A groups compared to the NInd control were similar to the number in the Ind+A group compared to the Ind control, ranging from 24 to 30. The number of differentially expressed miRNAs in Ind+S compared to Ind was notably higher, at 95, which suggests that miRNA expression may be linked to epigenetic modifications, such as histone acetylation [
35]. Notably, the majority of differentially regulated miRNAs were upregulated by the epigenetic inhibitors. The magnitude of the fold change was also interesting, with the largest absolute fold change in Ind+S compared to NInd being 8.5, which related to a decrease in the expression of miR-3553. In contrast, the highest fold change in expression in Ind+A compared to NInd was a 603.9-fold increase (miR-881-3p), implying an important role for 5-AZA-CdR in regulating the expression of miR-881-3p, in addition to a number of other miRNAs that were highly differentially expressed.
The results of the RNAseq analysis revealed a number of differentially regulated miRNAs in the experimental groups which have previously been shown to have links with mineralisation and epigenetic processes. miR-205, which was upregulated in Ind+A compared to Ind, has been suggested to inhibit osteogenesis of bone marrow mesenchymal stem cells (BMMSCs) by targeting Runx2, a key transcription factor in osteogenesis [
29,
30,
36]. In addition, miR-205 has been shown to be regulated by DNA methylation in numerous cancers [
37,
38,
39]. Furthermore, many of the miRNAs upregulated in Ind+S compared to the Ind control have been shown to be induced by HDACis, including miR-139-5p [
40], miR-375-3p [
41], and miR-211-5p [
42]. The differential expression of selected miRNAs in response to alterations in histone acetylation and DNA methylation highlights an obvious interaction between miRNAs and other epigenetic modifications. These interactions may be responsible for the range of cellular effects, including the increase in mineralisation, observed in DPCs following exposure to SAHA [
6] and 5-AZA-CdR [
4].
Potential target genes with a wide variety of functions were identified for the differentially expressed miRNAs in each group. These include Smad4, which acts as a key mediator of the TGF-β/BMP signalling pathway and has been proposed to play a critical role in tooth development [
43], and Tnf-α, which encodes a pro-inflammatory cytokine and is upregulated in diseased pulp compared to healthy pulp [
44]. In addition, exposure to Tnf-α has been shown to induce mineralisation of DPCs, as evidenced by increased mineralised nodule formation and expression of dentin sialoprotein (DSP), DMP1, and osteocalcin (OC) [
45]. Functional analysis of the predicted target genes was carried out by GO enrichment and KEGG pathway analysis. Mineralisation and stem cell-related terms were highly enriched for the target genes, including terms such as regulation of bone mineralisation, Wnt, and MAPK signalling pathways. Notably, similar findings were previously reported when the miRNA expression profile of mineralising DPCs was investigated using microarray profiling [
13]. Indeed, the MAPK pathway has been strongly implicated in the regulation of odontoblast activation in response to dentine matrix protein and growth factor stimulants [
46].
The expression of miR-346 and miR-881-3p was quantified to validate the RNAseq data. These miRNAs demonstrated the highest fold change in expression in Ind+S and Ind+A compared to Ind, respectively—a finding confirmed by qRT-PCR analysis. The expression of four additional miRNAs—miR-182, miR-200b-3p, miR-221-5p, and miR-205—was also quantified using qRT-PCR. When compared to the NInd group, mineralising medium alone (Ind) did not have a significant effect on the expression of any of the four miRNAs at day 1; however, by day 4, the expression of each miRNA was increased and indeed sustained through day 7 of culture. These data would suggest that inducing DPCs to mineralise does not immediately affect the expression of the selected miRNAs; however, the eventual alteration in expression is ultimately sustained. It is unclear whether this sustained effect is due to continuous replenishment of the mineralising medium, or if inducing DPCs to mineralise results in permanent changes in miRNA expression due to alterations in regulatory mechanisms. In this regard, it would be of interest to quantify the expression of these miRNAs at later time points.
In contrast to the effect of mineralising medium alone, both SAHA and 5-AZA-CdR appeared to have immediate, yet transient effects on miRNA expression when compared to Ind. Both epigenetic inhibitors exerted a strong positive influence on the expression of miR-182 when compared to Ind at day 1; however, by day 4 of culture, this effect had rapidly diminished. By day 7, the expression of miR-182 was increased in Ind+A again; however, this may be due to the reapplication of 5-AZA-CdR to the medium at day 4. Similarly, miR-221-5p was significantly upregulated in Ind+A compared to Ind at day 1, although, by day 4, it demonstrated no significant difference in expression. While the epigenetic inhibitors did not have an effect on miRNA expression in all conditions, when there was an effect, it occurred at day 1, but it had diminished by day 4. This would suggest that, at least for the four miRNAs that were investigated, any effect of epigenetic inhibitors on their expression was immediate, yet brief, with the effects abating following inhibitor withdrawal from the culture. Interestingly, the previous literature has established that the effect of HDACis on miRNA expression is immediate, with exposure to the HDACi LAQ824 resulting in rapid changes in expression of 27 of 67 predetermined miRNAs [
47]. In a separate study, the inhibitory effects of the Class II-specific HDACi MC1568 on HDAC activity were demonstrated to diminish following treatment withdrawal, with HDAC activity being restored and histone acetylation levels decreasing accordingly [
48]. Similar results have been demonstrated for 5-AZA-CdR, with re-methylation of sites demonstrated to occur following withdrawal of treatment [
49].
RNAseq is a powerful and robust tool for the analysis of differential miRNA expression profiles in experimental cultures. In the current study, the use of RNAseq and subsequent bioinformatic analyses, such as GO enrichment and pathway analysis, provided valuable insights into the mechanisms by which miRNAs may regulate DPC mineralisation. Of particular interest was the relationship between miRNAs and other epigenetic machinery in mineralising DPCs, an area of research which has not been previously investigated using high-throughput methods.
While further experimental work is required to validate many of the target genes and pathways identified in the current study, this study has nevertheless confirmed that there is a large-scale alteration in miRNA expression in mineralising DPCs. In addition, it was shown that exposing the cells to pharmacological epigenetic inhibitors results in a much greater change in miRNA expression, suggesting that the increase in mineralisation observed when DPCs are exposed to epigenetic inhibitors may be regulated, at least in part, by the interactions between miRNAs and epigenetic modifiers. Perhaps most importantly, the work carried out in this study enabled the selection of a number of miRNAs for further investigation, which may play a key role in epigenetic regulation of dentine–pulp repair processes. As an overarching aim of regenerative endodontics is to identify biologically-based therapeutic targets for use in treatment of pulpitis, future research should establish an expression profile for the human orthologs of the identified miRNAs in human DPCs in vitro, followed by the use of miRNA mimics and inhibitors to determine the role of these miRNAs in dental pulp reparative processes.
4. Materials and Methods
4.1. DPC Isolation and Culture
Rodent DPCs were isolated using an enzymatic digestion technique, as previously described [
50], from the extracted incisors of freshly sacrificed adult male Wistar Hannover rats, approximately four weeks old and weighing 100–120 g. The rats had been housed in Trinity Biomedical Sciences Institute (TBSI) Animal Facility, Trinity College Dublin under conditions in line with EU guidelines, and had been sacrificed no more than one hour previously by cervical dislocation. Following extraction, the pulp was extirpated from each tooth and transferred to a sterile glass slide, prior to being physically minced into 1 mm
3 pieces using a sterile scalpel. The pieces were transferred to a 50 mL centrifuge tube (Abdos Labtech, New Delhi, India), containing 4 mL Trypsin-EDTA (Sigma-Aldrich, Arklow, Ireland), prior to incubation at 37 °C, 5% CO
2 for 40 min (MCO 18-AC, Sanyo, Osaka, Japan), with agitation every 10 min using a pipette to improve dissociation. At the end of the digestion period, the reaction was halted with the addition of normal (non-mineralising) cell culture medium, which consisted of 4 mL α-MEM (Biosera, Labtech International, East Sussex, UK), supplemented with 1% Penicillin/Streptomycin (100 units/mL of penicillin with 100μg/mL streptomycin) (Sigma-Aldrich, Arklow, Ireland) and 10% (
v/
v) Foetal Calf Serum (FCS) (Biosera, Labtech International, East Sussex, UK). The cell suspension was passed through a 70 μm cell strainer (Falcon, Corning, Flintshire, UK) into a sterile 50 mL centrifuge tube, which was subsequently centrifuged for 3 min at 250×
g (Universal 320, Hettich, Tuttlingen, Germany). The pellet was then resuspended in 700 µL normal medium. The cells were seeded in 700 µL in T25 flasks (Sarstedt, Leicester, UK), with each flask representing pulp tissue from four incisor teeth. The cells were expanded in culture until passage 2 for use in subsequent experiments.
4.2. Induction of Mineralisation in Experimental Cultures with Addition of Pharmacological Epigenetic Inhibitors
When cultures had reached 80% confluence in six-well plates, as determined by phase contrast microscopy (experimental day 0), wells were assigned to one of the four experimental groups, and the media were changed according to
Table 6. For induction of mineralisation, cells were cultured in mineralising medium, which consisted of α-MEM supplemented with 1% Penicillin/Streptomycin and 10% (
v/
v) FCS, as described above, with the addition of 50 mg/l ascorbic acid (Sigma-Aldrich, Arklow, Ireland), 10 nM dexamethasone, and 10 mM β-glycerophosphate (Sigma-Aldrich, Arklow, Ireland) [
51]. For treatment with a HDACi, 5 mg of SAHA (Sigma-Aldrich, Arklow, Ireland) was dissolved in 3.8 mL dimethyl sulfoxide (DMSO) (Sigma-Aldrich, Arklow, Ireland) to prepare a 5 mM stock solution, prior to supplementation in culture medium at a final concentration of 1 µM [
6]. For treatment with a DNMTi, 5 mg of 5-AZA-CdR (Sigma-Aldrich, Arklow, Ireland) was dissolved in 219 μL DMSO to prepare a 100 mM stock solution, prior to supplementation in cell culture medium at a final concentration of 1 µM [
4].
The media in all wells were replaced every three days. SAHA was added only on day 0 and was not reapplied throughout the remainder of the experiment, as studies have previously shown that this results in optimal stimulatory effects [
6], while 5-AZA-CdR was added on days 0 and 4 [
4]. The DNMTi was reapplied due to its instability in aqueous solution and the reversible nature of DNA methylation, with the previous literature indicating that hypo-methylation of DNA reverts following withdrawal of the inhibitor [
49].
4.3. Cell Growth Curve Analysis
The rate of cell growth over time was investigated by staining the cells with Trypan Blue and counting using a haemocytometer on days 1, 4, 7, 11, and 14. To calculate cell numbers, the medium was carefully aspirated, and the cells were washed briefly with 1 mL Trypsin-EDTA, which had been previously incubated at 37 °C, to remove residual traces of FCS. The initial Trypsin-EDTA wash was aspirated, and an additional 1 mL of Trypsin-EDTA was added. Cultures were then incubated at 37 °C for 5–10 min, or until the cells had detached from the base of the flask, as viewed under phase contrast microscopy, prior to the addition of 1 mL of normal medium to stop the reaction. The cells were then transferred to a single 50 mL centrifuge tube and centrifuged at 100× g for 3 min. The supernatant was carefully removed from the cell pellet following centrifugation, and the pellet was resuspended in 1 mL normal medium. A 10 µL volume of this suspension was then added to 10 µL Trypan Blue stain (Sigma-Aldrich, Arklow, Ireland), mixed thoroughly, and incubated for 5 min at room temperature. A sterile glass coverslip was placed on a Bright Line haemocytometer (Hausser Scientific, Horsham, PA, USA), and 10 µL of the Trypan Blue/cell solution were applied with a pipette under the coverslip until it had been completely filled by capillary action. The number of viable cells in each of the four outer squares of the haemocytometer were then counted under phase contrast microscopy. Cells that had excluded the Trypan Blue dye were considered viable. The cell concentration was then calculated as follows:
Cell concentration = average cell count per square × 2 (dilution factor) × 104 (volume of outer square)
Three biological replicates were analysed in duplicate.
4.4. Alizarin Red S Staining
To confirm induction of mineralisation, DPCs were stained with 2% (
w/
v) Alizarin Red S (Millipore, Cork, Ireland) on days 11 and 14 of culture. Briefly, the medium was aspirated, and the cells were washed with PBS. The cells were then fixed with 1 mL neutral buffered 10% formalin (Sigma-Aldrich, Arklow, Ireland) and washed three times for 5 min each with ultrapure water before being incubated with 1 mL Alizarin Red S solution (2%
w/
v) for 20 min. The cells were then washed three times with ultrapure, autoclaved water for 5 min each. Images of the wells were taken and stored as JPEG files, prior to solubilisation of the stain and quantification by spectrophotometric analysis at 405 nm (Tecan Genios Spectrophotometer, Unitech, Dublin, Ireland) [
52]. Mineral production per cell was subsequently calculated by dividing the concentration of Alizarin Red S in each group by the corresponding number of cells counted in parallel DPC cultures using a haemocytometer and Trypan Blue staining, as described above. Three biological replicates were analysed in triplicate.
4.5. miRNA Extraction
miRNA was isolated and extracted as a component of the total RNA sample using the miRNeasy Mini Kit (Qiagen, Redwood City, CA, USA), according to the manufacturer’s instructions. Extracted RNA was analysed using a Nanodrop 2000 c spectrophotometer (Thermo-Fisher, Dublin, Ireland) to determine the yield and quality. RNA samples were considered to be of acceptable quality for RNAseq and qRT-PCR if the 260/280 and 260/230 ratios were greater than 1.8 and 2.0, respectively.
4.6. RNA Sequencing
RNA, including miRNA, which had been isolated from each of the four experimental groups on day 4 of culture, was analysed by GeneWiz (GeneWiz, South Plainfield, NJ, USA). Three technical replicates were analysed for each group. Library preparation was carried out using the TruSeq Small RNA Library Prep Kit (Illumina, San Diego, CA, USA), prior to RNA sequencing using the Illumina HiSeq 2500 system (Illumina, San Diego, CA, USA). Data were supplied as 12 fastq files, which were analysed using Strand NGS ver3.4 (Strand Life Sciences, Bengaluru, India). The reads were initially trimmed to remove adapter sequences (CutAdapt 1.14, Python 2.7.10), following which sequence reads 15 to 35 nucleotides in length were retained for subsequent analysis. The reads were then aligned against the rat reference genome from assembly Rnor_6.0 (RGSC, 2014) [
53]. To identify the various sRNA classes, reads were searched against tRNAscan-SE [
18] to annotate tRNAs, miRBase-21 [
20] to annotate miRNAs, and Ensembl (release 98, [
19]) to annotate the remaining small RNAs, such as ribosomal RNA and small nucleolar RNA (snoRNA). Prior to analysis, miRNA counts were normalised to reads per kilobase of transcript, as well as per million mapped reads (RPKM).
4.7. Identification of Differentially Expressed miRNAs
For characterisation of miRNA expression profiles under the various experimental conditions, the data were organised such that NInd was used as a control against which Ind, Ind+S, and Ind+A could be compared, and Ind was used as a control against which Ind+S and Ind+A could be compared, resulting in a total of five experimental vs. control pairings. Differential expression was performed on each pairing on Strand NGS, using both a Mann-Whitney U test (fold change cut-off >1.5, p ≤ 0.05) and a moderated t-test (fold change cut-off >1.5, q ≤ 0.05), independently of each other.
4.8. Functional Annotation
A list of predicted target genes for each list of differentially regulated miRNAs was generated using Strand NGS, which utilises the miRDB database for target gene prediction. A
p-value cut-off of ≤0.05 was applied. GO enrichment, using DAVID v6.8 (
https://david.ncifcrf.gov/, accessed on 16 October 2020) [
22,
23] and KEGG pathway analysis, using DIANA-miRPath v.3 (
http://www.microrna.gr/miRPathv3/, accessed on 22 October 2020) [
54], were carried out on the resulting lists of target genes.
4.9. Selection of miRNAs for Validation Using qRT-PCR
The mature miRNA sequences which were differentially regulated in Ind+S and Ind+A compared to NInd, as determined by a moderated
t-test, were compiled into one datasheet consisting of 90 mature miRNA sequences. A Venn diagram was constructed, which displayed the number of shared differentially expressed miRNAs between groups. The same process was applied to mature miRNAs which were differentially regulated in Ind+S vs. Ind and Ind+A vs. Ind, yielding a total of 118 mature miRNA sequences. A selection of miRNAs were identified from the datasets through a search of the literature, using PubMed (
https://pubmed.ncbi.nlm.nih.gov/, accessed on 12 April 2021) to identify previous associations with mineralisation, differentiation, or epigenetic processes. The list of miRNAs was further refined based on the results of in-depth functional analysis, as described below.
4.9.1. Target Gene Prediction
For each of the mature miRNA sequences, three different software tools were used to generate a list of predicted target genes—TargetScan (
http://www.targetscan.org/vert_80/, accessed on 8 October 2020) [
55], miRDB (
http://mirdb.org/, accessed on 8 October 2020) [
56,
57], and DIANA-microT-CDS (
http://www.microrna.gr/webServer/, accessed on 8 October 2020) [
58]. To increase specificity, only target genes which were predicted by at least two of the target prediction tools were considered for further analysis [
59,
60,
61].
4.9.2. Functional Annotation of Individual miRNAs
GO enrichment and KEGG pathway analysis was carried out for each list of target genes using DAVID bioinformatics resources. GO terms and KEGG pathways that were related to stem cell or mineralisation processes were noted for further investigation.
4.9.3. Orthology Analysis
The existence of a human equivalent for each miRNA was determined by searching miRBase for the miRNA, replacing the prefix ‘rno’ with ‘hsa’. If present, the sequence of the mature human miRNA was manually aligned and compared to that of the equivalent rodent miRNA using the Basic Local Alignment Search Tool (BLAST) software (
https://blast.ncbi.nlm.nih.gov/Blast.cgi, accessed on 12 April 2021) [
62]. The target genes of the human miRNA were then predicted using TargetScan, miRDB and DIANA-microT-CDS, as described above. The list of target genes was compared to that of the rodent miRNA, and the shared target genes were used to generate a functional analysis profile through GO enrichment and KEGG pathway analysis, so as to determine shared functions of the human and rodent miRNA. Using the predicted target genes, functional annotation, and conservation in humans as references, a selection of miRNAs—miR-182, miR-200b-3p, miR-205, miR-221-5p, miR-346, and miR-881-3p—were chosen for quantification using qRT-PCR.
4.10. Validation of miRNA Expression Using qRT-PCR
The expression of the selected miRNAs was further investigated by quantification using qRT-PCR. Total RNA, containing miRNA, which had been isolated on days 1, 4, and 7 of culture, was converted into cDNA using the miRCURY LNA RT Kit (Qiagen, Redwood City, CA, USA), following the manufacturer’s instructions. Subsequently, qRT-PCR for quantification of the selected miRNAs was carried out using the miRCURY LNA SYBR Green PCR Kit (Qiagen, Redwood City, CA, USA) and associated primers (miRCURY LNA miRNA PCR Assay, Qiagen, Redwood City, CA, USA). Primer sequences are listed in
Table 7.
U6 was used as an internal reference gene. Reactions were performed using the Applied Biosystems 7500 Fast Real-Time PCR System (Thermo-Fisher, Dublin, Ireland) and consisted of an initial incubation at 95 °C for 2 min to activate the PCR reaction, followed by 40 repeated amplification cycles, with a typical cycle involving denaturation at 95 °C for 10 s followed by combined annealing and extension at 56 °C for 60 s. Three independent biological replicates were analysed in duplicate. Fold change in expression was calculated using the formula 2
−(ΔCt(Exp)−ΔCt(Ctrl)), where Ct is the threshold cycle, ΔCt is Ct(target gene) − Ct(reference gene), Exp is the experimental and Ctrl is the control samples. Three independent biological replicates were analysed in duplicate.
4.11. Statistical Analysis
One-way analysis of variance (ANOVA) combined with post-hoc Tukey’s test was used to analyse the effect of four different culture conditions on cell proliferation, metabolic activity, and mineralisation. Strand NGS software was used to carry out statistical analysis on the RNAseq data, including differential expression analysis, for which the moderated t-test combined with Storey’s bootstrapping to account for multiple testing was used. Mean and standard deviation were used for statistical analysis. Differences were considered statistically significant at p ≤ 0.05. For analysis of qRT-PCR data, an independent t-test was applied to the fold change values.


