Article

Genome-Wide Analysis of Strictosidine Synthase-like Gene Family Revealed Their Response to Biotic/Abiotic Stress in Poplar

1
State Key Laboratory of Tree Genetics and Breeding, Northeast Forestry University, Harbin 150040, China
2
Co-Innovation Center for Sustainable Forestry in Southern China, Bamboo Research Institute, Nanjing Forestry University, 159 Longpan Road, Nanjing 210037, China
*
Authors to whom correspondence should be addressed.
Int. J. Mol. Sci. 2023, 24(12), 10117; https://doi.org/10.3390/ijms241210117
Submission received: 12 May 2023 / Revised: 2 June 2023 / Accepted: 13 June 2023 / Published: 14 June 2023
(This article belongs to the Special Issue Advances in Forest Tree Physiology, Breeding and Genetic Research)

Abstract

:
The strictosidine synthase-like (SSL) gene family is a small plant immune-regulated gene family that plays a critical role in plant resistance to biotic/abiotic stresses. To date, very little has been reported on the SSL gene in plants. In this study, a total of thirteen SSLs genes were identified from poplar, and these were classified into four subgroups based on multiple sequence alignment and phylogenetic tree analysis, and members of the same subgroup were found to have similar gene structures and motifs. The results of the collinearity analysis showed that poplar SSLs had more collinear genes in the woody plants Salix purpurea and Eucalyptus grandis. The promoter analysis revealed that the promoter region of PtrSSLs contains a large number of biotic/abiotic stress response elements. Subsequently, we examined the expression patterns of PtrSSLs following drought, salt, and leaf blight stress, using RT-qPCR to validate the response of PtrSSLs to biotic/abiotic stresses. In addition, the prediction of transcription factor (TF) regulatory networks identified several TFs, such as ATMYB46, ATMYB15, AGL20, STOP1, ATWRKY65, and so on, that may be induced in the expression of PtrSSLs in response to adversity stress. In conclusion, this study provides a solid basis for a functional analysis of the SSL gene family in response to biotic/abiotic stresses in poplar.

1. Introduction

In nature, plants defend themselves against damaging biotic and abiotic factors through a variety of defense responses [1]. In general, the various defense responses of plants depend on a transcriptional regulatory network consisting of top-level transcription factors (TFs) and bottom-level structural genes [2,3,4]. To date, a wide range of plant stress-response TFs and structural genes have been identified from different plant species that are important for maintaining plant identity, adapting to environmental changes, and supporting plant growth [5,6,7,8,9,10,11]. The plant strictosidine synthase-like (SSL) genes are a kind of gene closely related to plant immune regulation; they share a similar extracellular structural domain (of ca. 400 aa in length) with the animal immune protein hemomucin [12]. The enzyme is responsible for combining geraniol diphosphate and tryptamine precursors in the cytosolic matrix to produce the intermediate compound strictosidine (STR). STR is a precursor compound for the biosynthesis of many monoterpene alkaloids, which play an important role in the defense mechanisms of plants, enhancing their resistance to biotic/abiotic stresses such as negative environments, parasites, fungi, and bacteria. The plant SSL gene has two characteristic structural domains, the Strictosidine synthase domain (PF03088) and the Strictosidine synthase-like N-terminal domain (PF20067). The Strictosidine synthase domain is directly related to STR synthesis and the Strictosidine synthase-like N-terminal has a six-bladed beta-propeller fold structure and have similar mechanistic features to strictosidine synthase domain.
Currently, our limited knowledge of the plant SSL family comes mainly from Arabidopsis thaliana, and the research shows that all classes of AtSSL genes respond to a variety of biotic and abiotic stresses [13]. In addition, AtSSL4-7 was detected to synthesize STR and was induced by various phytohormones, such as salicylic acid, methyl jasmonate, ethylene, and so on [1,13]. In other plants, there are a few reports of SSL genes being involved in plant resistance processes. For example, in Catharanthus roseus, drought stress was found to induce the expression of the STR gene up to 5.6-fold, which, in turn, alleviated drought damage on the plant [14]. Tomato miR1916 overexpression lines exhibited reduced tolerance to drought, possibly due to the repressive effect of miR1916 on the target STR gene [15]. Chitooligosaccharides are the only basic amino oligosaccharides with positively charged cations in nature which can improve crop resistance and yield [16,17]. It has been proposed that chitooligosaccharides may enhance plant stress tolerance by inducing the expression of secologanin synthase (SLS), STR, strictosidine glucosidase (SGD), and other genes [18]. In Solanum lycopersicum, silencing of sly-miR1916 was found to lead to increased expression of the target genes STR-2, UDP-glycosyltransferases (UGTs), late blight resistance protein homolog R1B-16, disease resistance protein RPP13-like, and MYB transcription factor (MYB12), which, in turn, enhanced the resistance of tomato leaves to Phytophthora infestans and Botrytis cinerea [19]. Overall, there is growing evidence that members of the SSL family can be involved in plant resistance to stress. However, no systematic analysis of the expression patterns of poplar SSL family members in response to biotic/abiotic stresses has yet been carried out.
Populus trichocarpa was selected as a research material for this study; it is the model plant in woody plant research and has had its genome sequenced with a clear genetic background [20]. However, there is a lack of research on the SSL family in P. trichocarpa. We identified a total of 13 SSL genes from poplar, using bioinformatics methods, and performed a gene structure analysis, chromosomal localization, a collinearity analysis, and a promoter analysis based on their clear genetic background. In the meanwhile, we analyzed the expression pattern of PtrSSLs under biotic/abiotic stresses, using RT-qPCR. This study provides new information about the evolutionary relationships of the PtrSSL family, which serves as a reference for understanding the biological functions of SSLs in poplar.

2. Result

2.1. Phylogenetic and Structural Analysis of PtrSSL Family

We used HMMER software to search for members of the strictosidine synthase-like (SSL) family in Populus trichocarpa, Arabidopsis thaliana, and Salix purpurea by mapping the conserved structural domains, PF03088 and PF20067, to protein sequences in the most recent version of the database for each species. Eventually, 13, 15, and 22 SSLs were obtained in Populus trichocarpa, Arabidopsis thaliana, and Salix purpurea, respectively, and phylogenetic trees were constructed. SSL family members of Populus trichocarpa and Salix purpurea were named regarding the previously published names of Arabidopsis thaliana SSLs, as shown in Figure 1 and Table 1. The phylogenetic analysis showed that the SSL family members could be divided into four groups, Groups I-IV, containing 9, 19, 7, and 15 SSLs, respectively (Figure 1). We found that each group contained SSLs from all three species, implying that SSLs from herbaceous and woody plants may have similar evolutionary patterns. The results also show that all branches of PtrSSLs are adjacent to branches of SpuSSLs compared to Arabidopsis, suggesting that the two woody species, Populus trichocarpa and Salix purpurea, are more closely related, and SSLs diverged with the evolution of the herbaceous woody plant.
Our analysis of the protein physicochemical properties showed that the length of the SSL family amino acids in all three species ranged from 98 (PtrSSL11) to 570 (PtrSSL4), and the molecular weight ranged from 10878.46 (PtrSSL11) to 62,550.88 (PtrSSL4). The pI of the SSL protein ranged from 4.69 (SpuSSL3) to 9.8 (SpuSSL20); a majority of AtSSL proteins (11/15) were acidic (pI < 7); and nearly half of PtrSSL and SpuSSL proteins were acidic, accounting for 6/13 and 11/22, respectively. The aliphatic index of the SSL protein ranged from 75.2 (AtSSL1) to 104.29 (AtSSL7), and most SSL proteins were stable. The grand average of hydropathicity (GRAVY) value ranged from −0.403 (AtSSL1) to 0.349 (SpuSSL3). Of these, 8/15 of the AtSSL proteins, 10/13 of the PtrSSL proteins, and 9/22 of the SpuSSL proteins were hydrophilic. Overall, the physicochemical properties of SSL proteins from different species are different (Table 1).
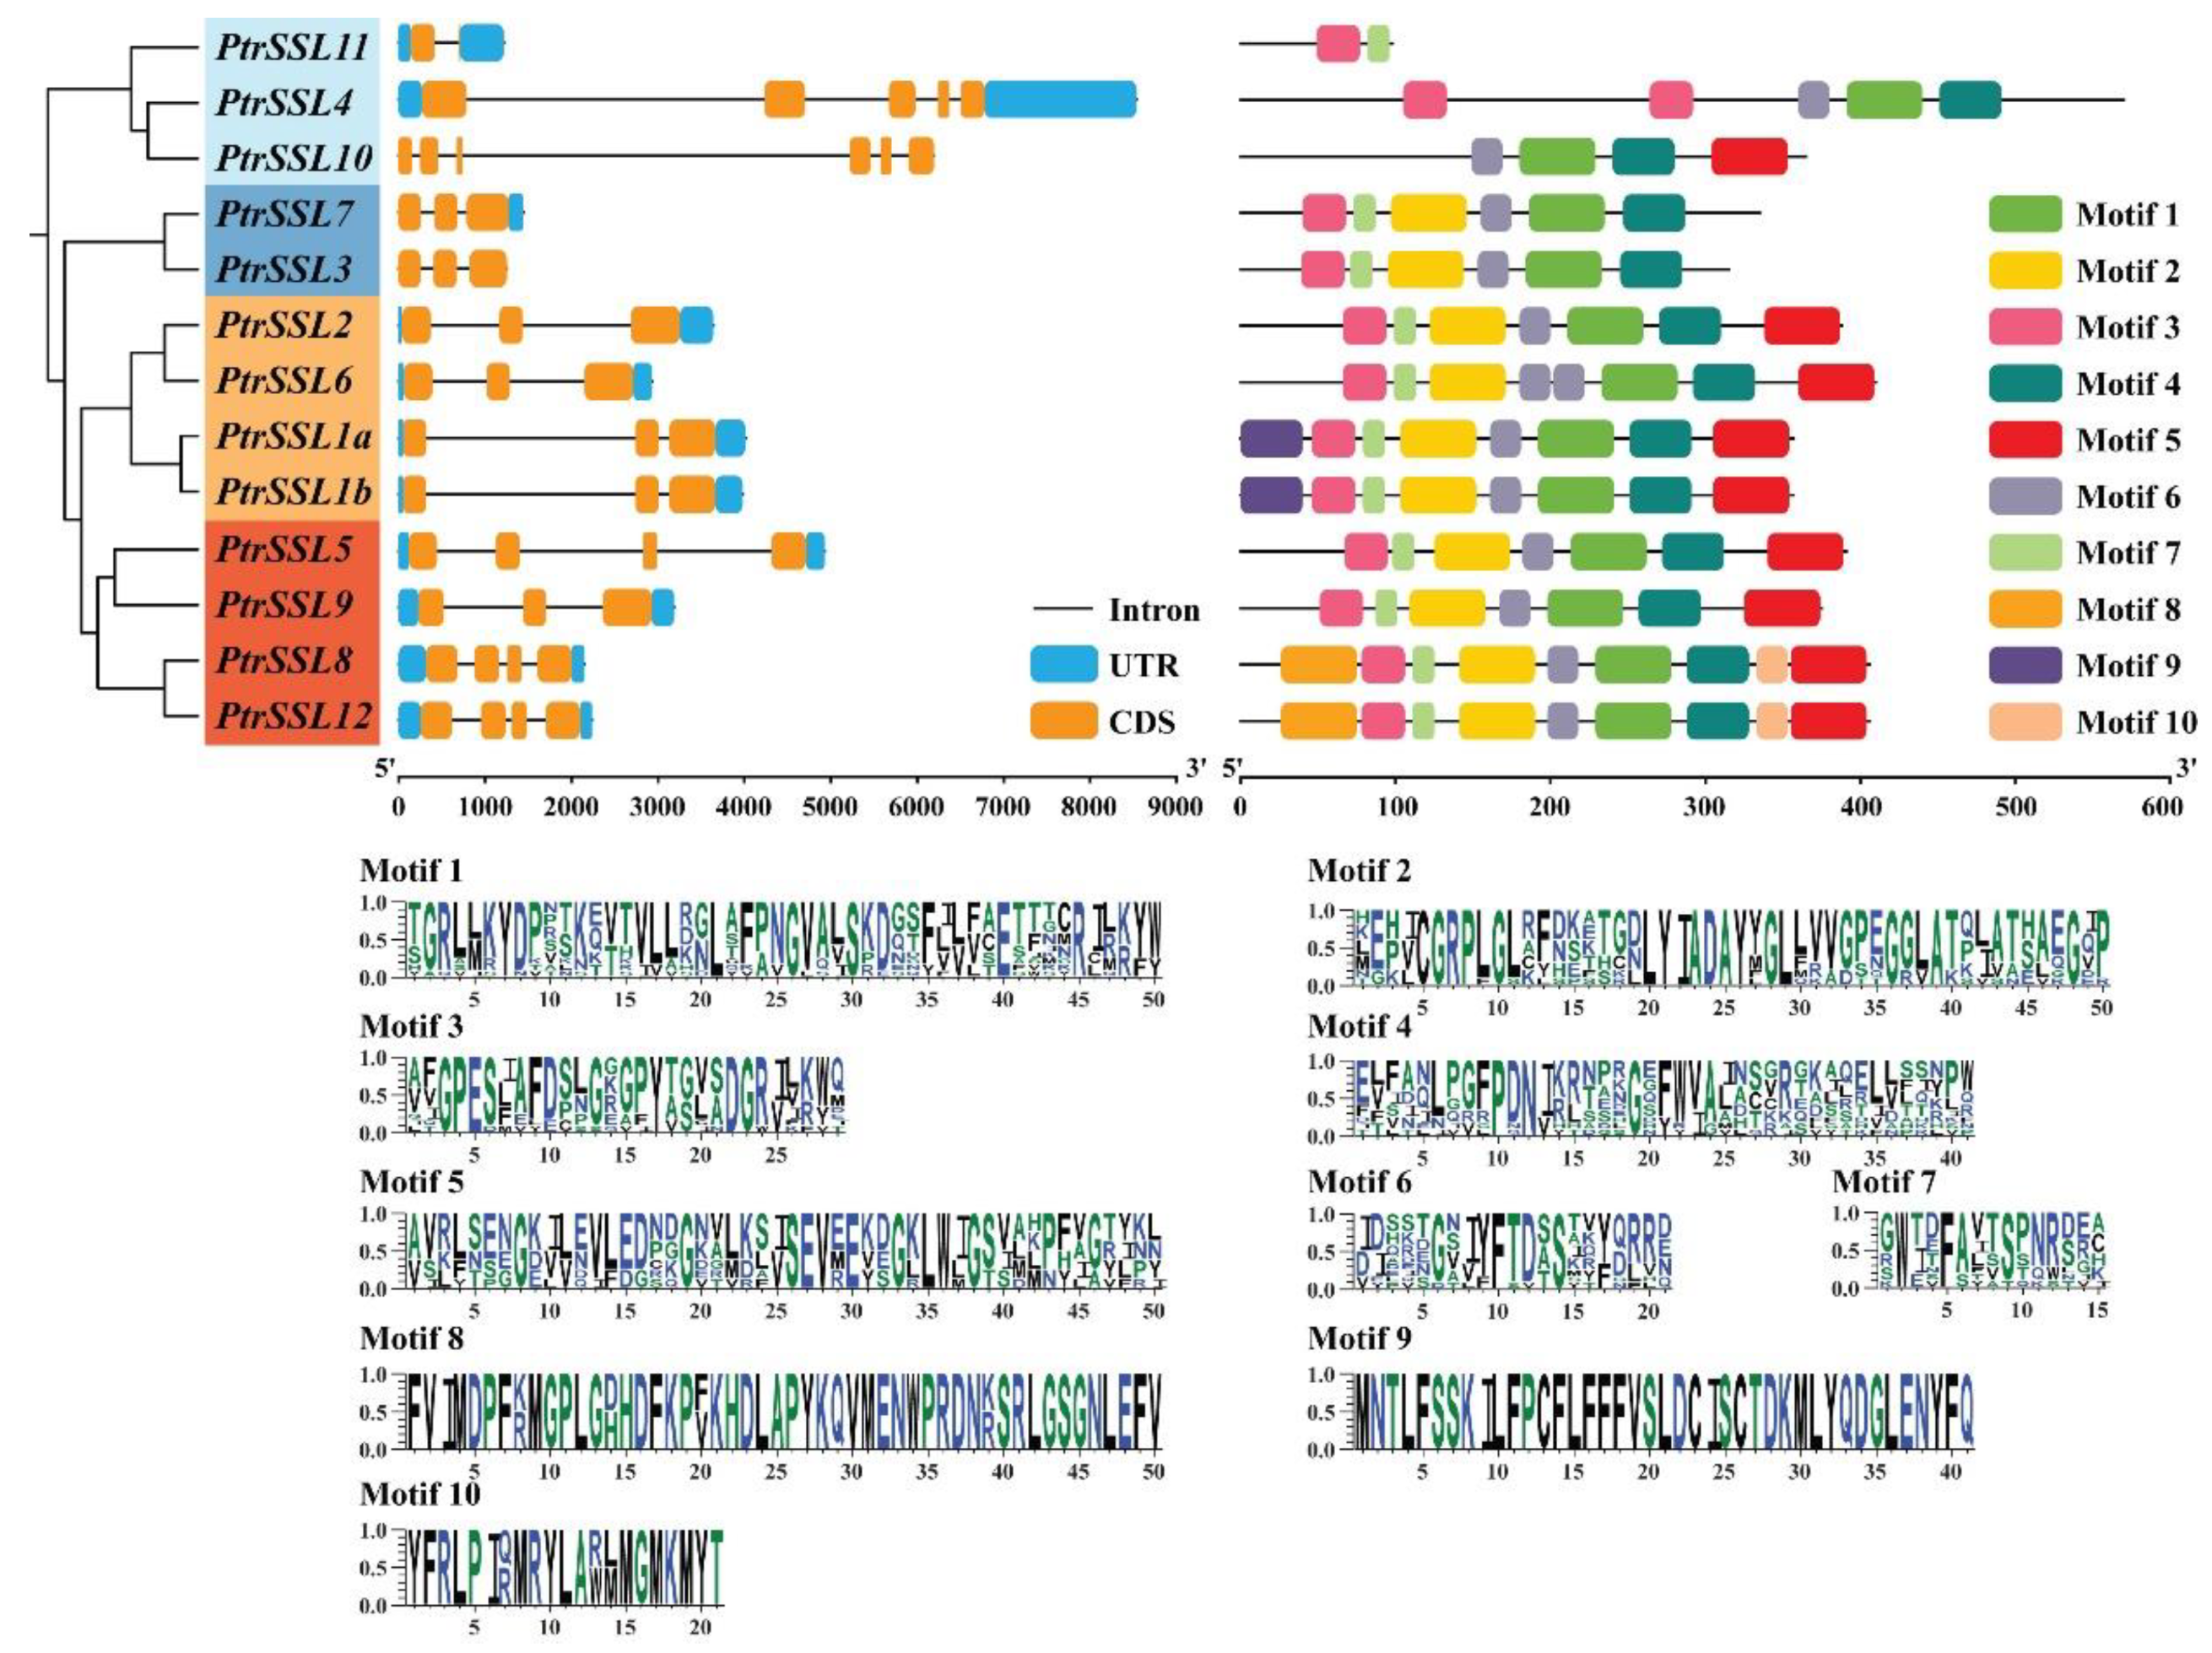
In addition, we analyzed the gene structure and motif of PtrSSLs by using TBtools and MEME software. In general, the SSL genes that are in the same evolutionary branch have structural similarities. The genetic structure analysis revealed that Group I members contained 4–7 exons, Group II members contained 3–4 exons, all Group III members contained 5 exons, and Group IV members contained 5–6 exons (Figure 2). In Groups II–IV, the genetic structure of the members within each subgroup is similar, except for Group I, where the number of exons varies considerably between members. To further confirm the similar characteristics of the members of the subgroup, we performed a motif analysis, which revealed that the types and numbers of motifs contained in the members within each subgroup were similar in Groups II–IV (Figure 2). For example, the two members of Group II, PtrSSL3 and PtrSSL7, have the same type and number of motifs. We also found that the motif distributions of Group III and Group IV were very similar, probably because the two subgroups originated from the same evolutionary branch. Only the three members of Group I differed significantly in the type of motif they contained, implying that the functions of the three genes may differ significantly. Overall, this corresponds to the results of our phylogenetic tree analysis.

2.2. Chromosomal Distribution and Collinearity Analysis of PtrSSLs

To explore the distribution of PtrSSLs on poplar chromosomes, we determined the chromosome location information of PtrSSLs according to the Populus trichocarpa v4.1 database in Phytozome (Supplementary Table S1). We also mapped the gene distribution based on their starting position on the chromosome (Figure 3). The results showed that there were 13 PtrSSLs not evenly distributed on the 9 chromosomes and 1 scaffold (Figure 3). Chr16 contains the greatest number of PtrSSLs, namely PtrSSL6, PtrSSL9, and PtrSSL11. Chr06 contains two PtrSSLs, namely PtrSSL2 and PtrSSL10. Chr01, Chr05, Chr07, Chr08, Chr12, Chr15, Chr17, and scaffold_509 each have one PtrSSL distributed as PtrSSL5, PtrSSL4, PtrSSL8, PtrSSL1a, PtrSSL3, PtrSSL7, PtrSSL12, and PtrSSL1b, respectively. To explore the gene duplication events of PtrSSL family members, a collinearity analysis was performed by using MCScanX. A total of four highly homologous gene pairs were obtained, both of which were segmental duplications (Figure 3). The Ka/Ks of these genes were both less than 1, indicating that a strong purifying selection was experienced (Table 2). All gene pairs are more than 80% homologous, indicating that they evolved to form paralogous genes as a result of gene duplication events. In addition, PtrSSL1a and PtrSSL1b have identical CDS and amino acid sequences, resulting in Ka and Ks values of 0. Although they are highly homologous, they originate from different chromosomes, Chr08 and scaffold 509, and are therefore judged to be two genes.
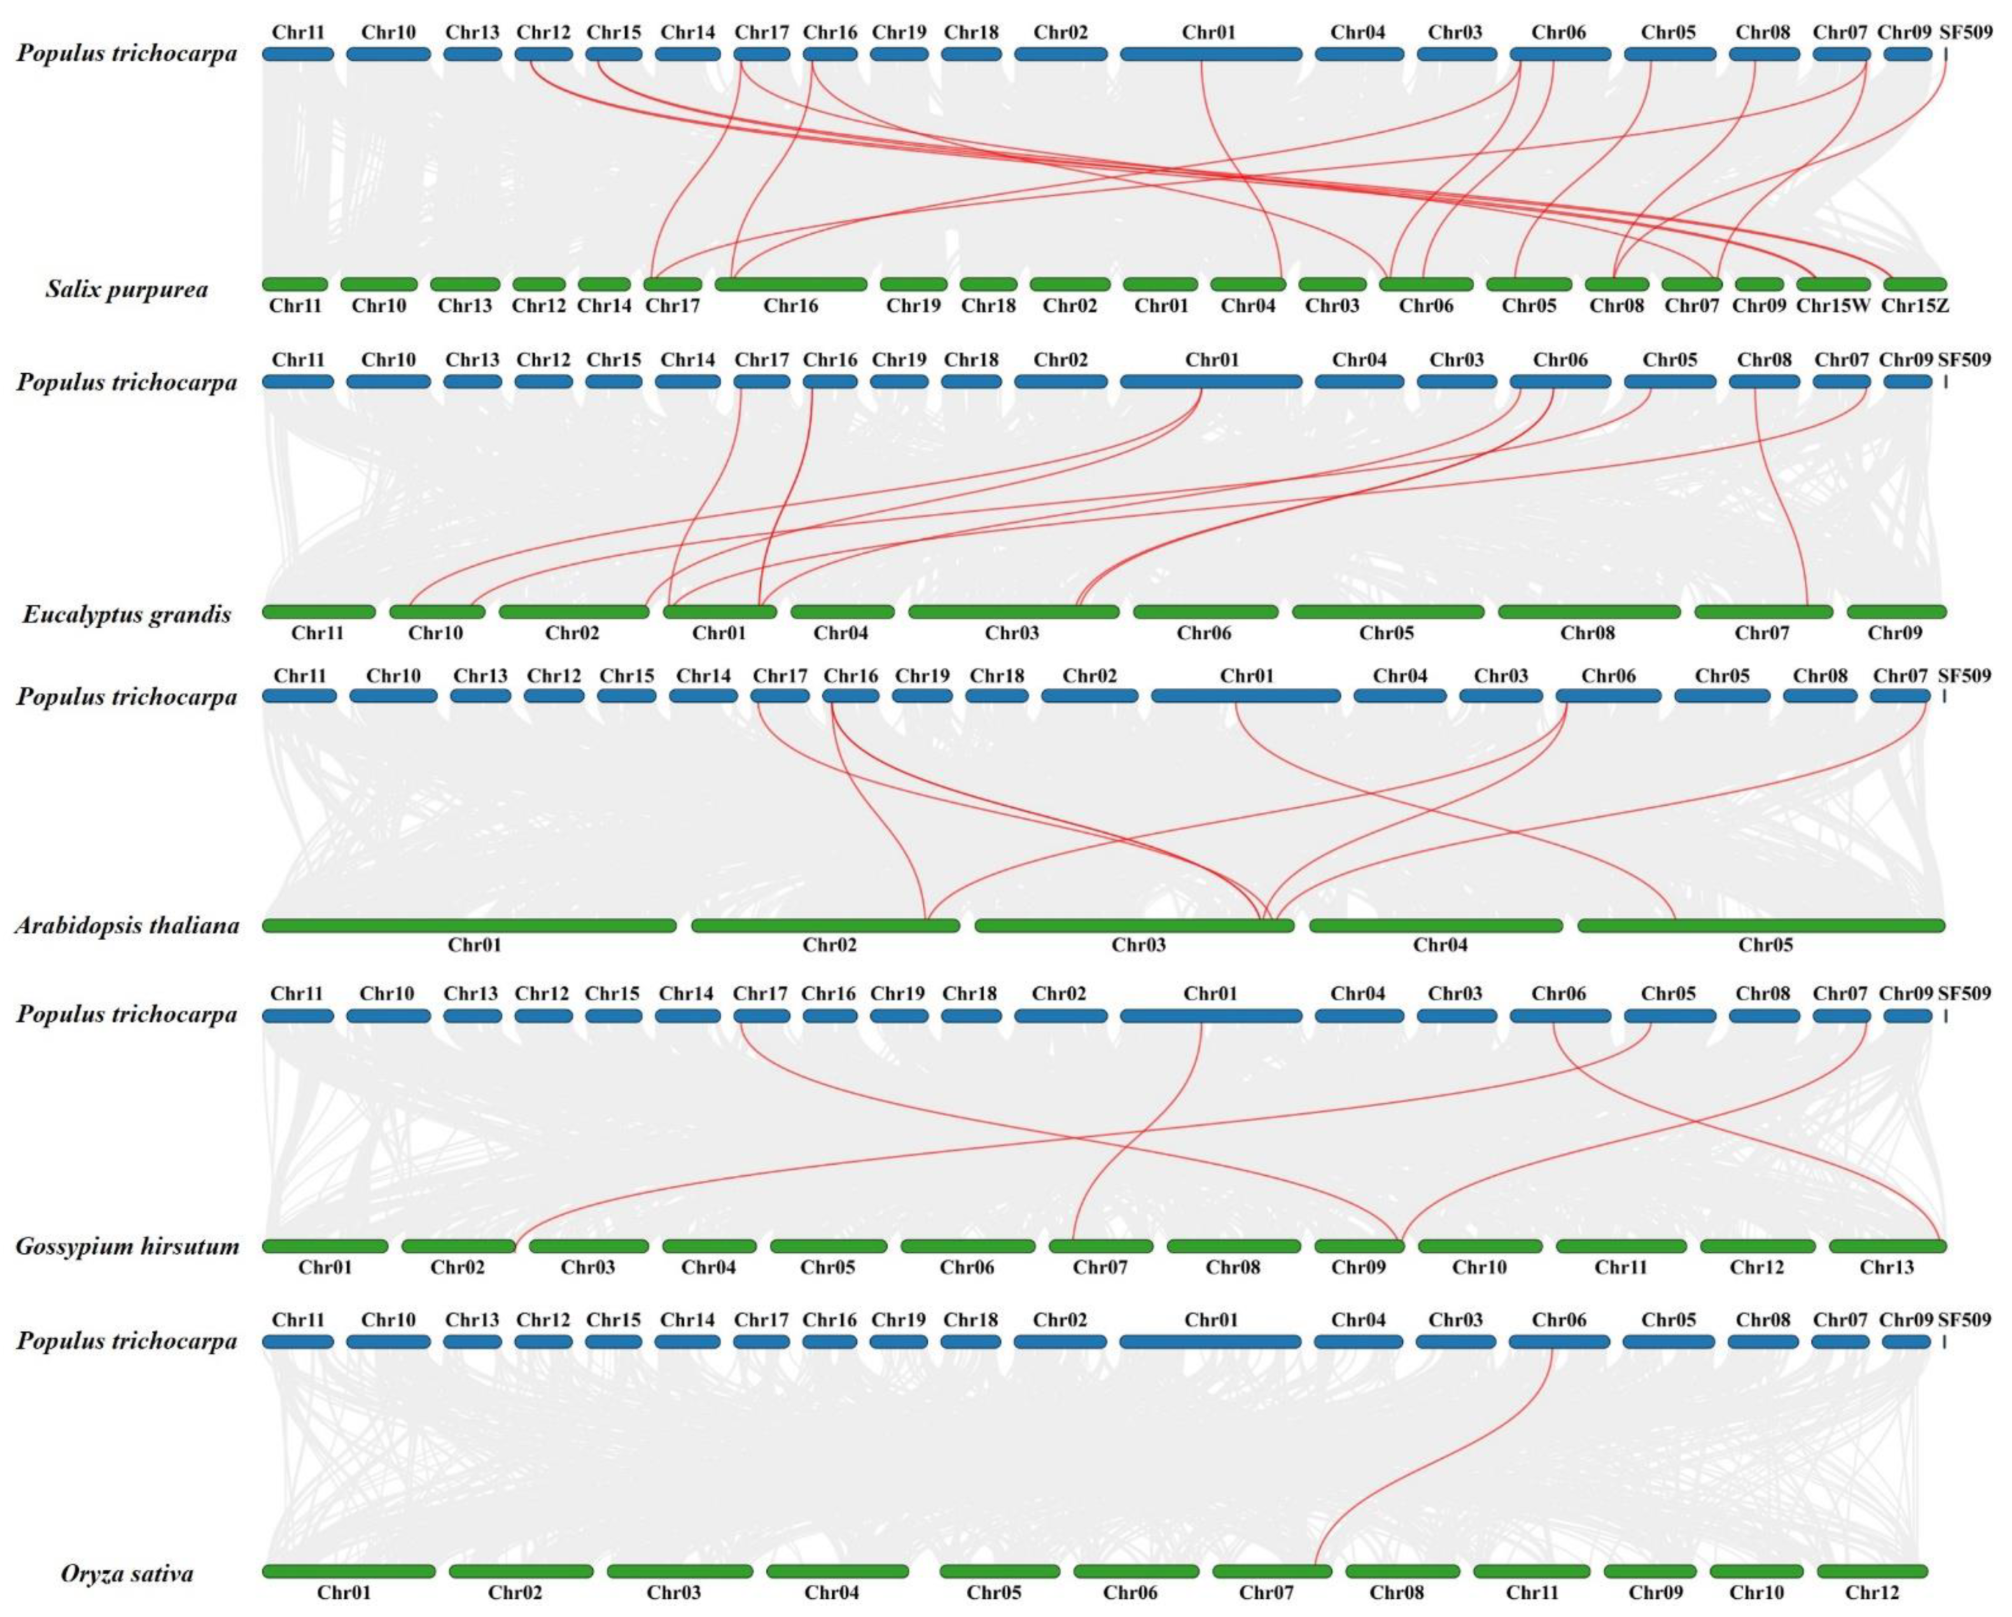
To further investigate the evolutionary relationship of PtrSSLs, we constructed a phylogram of SSL genes between P. trichocarpa with five other plant species, including four dicots (Salix purpurea, Eucalyptus grandis, Arabidopsis thaliana, and Gossypium hirsutum) and one monocot (Oryza sativa). As shown in Figure 4 and Supplementary Table S2, there were 18, 11, 8, 5, and 1 homologous pair/s between P. trichocarpa with S. purpurea, E. grandis, A. thaliana, G. hirsutum, and O. sativa, respectively. Six PtrSSLs (PtSSL2, PtSSL5, PtSSL6, PtSSL8, PtSSL10, and PtSSL12) showed a high level of collinearity with other species SSL genes (collinear genes = 5). Overall, poplar SSL genes have the highest number of collinear genes, with those being in S. purpurea and E. grandis, which are also woody dicotyledons.

2.3. Cis-Elements Analysis of PtrSSLs Promoters

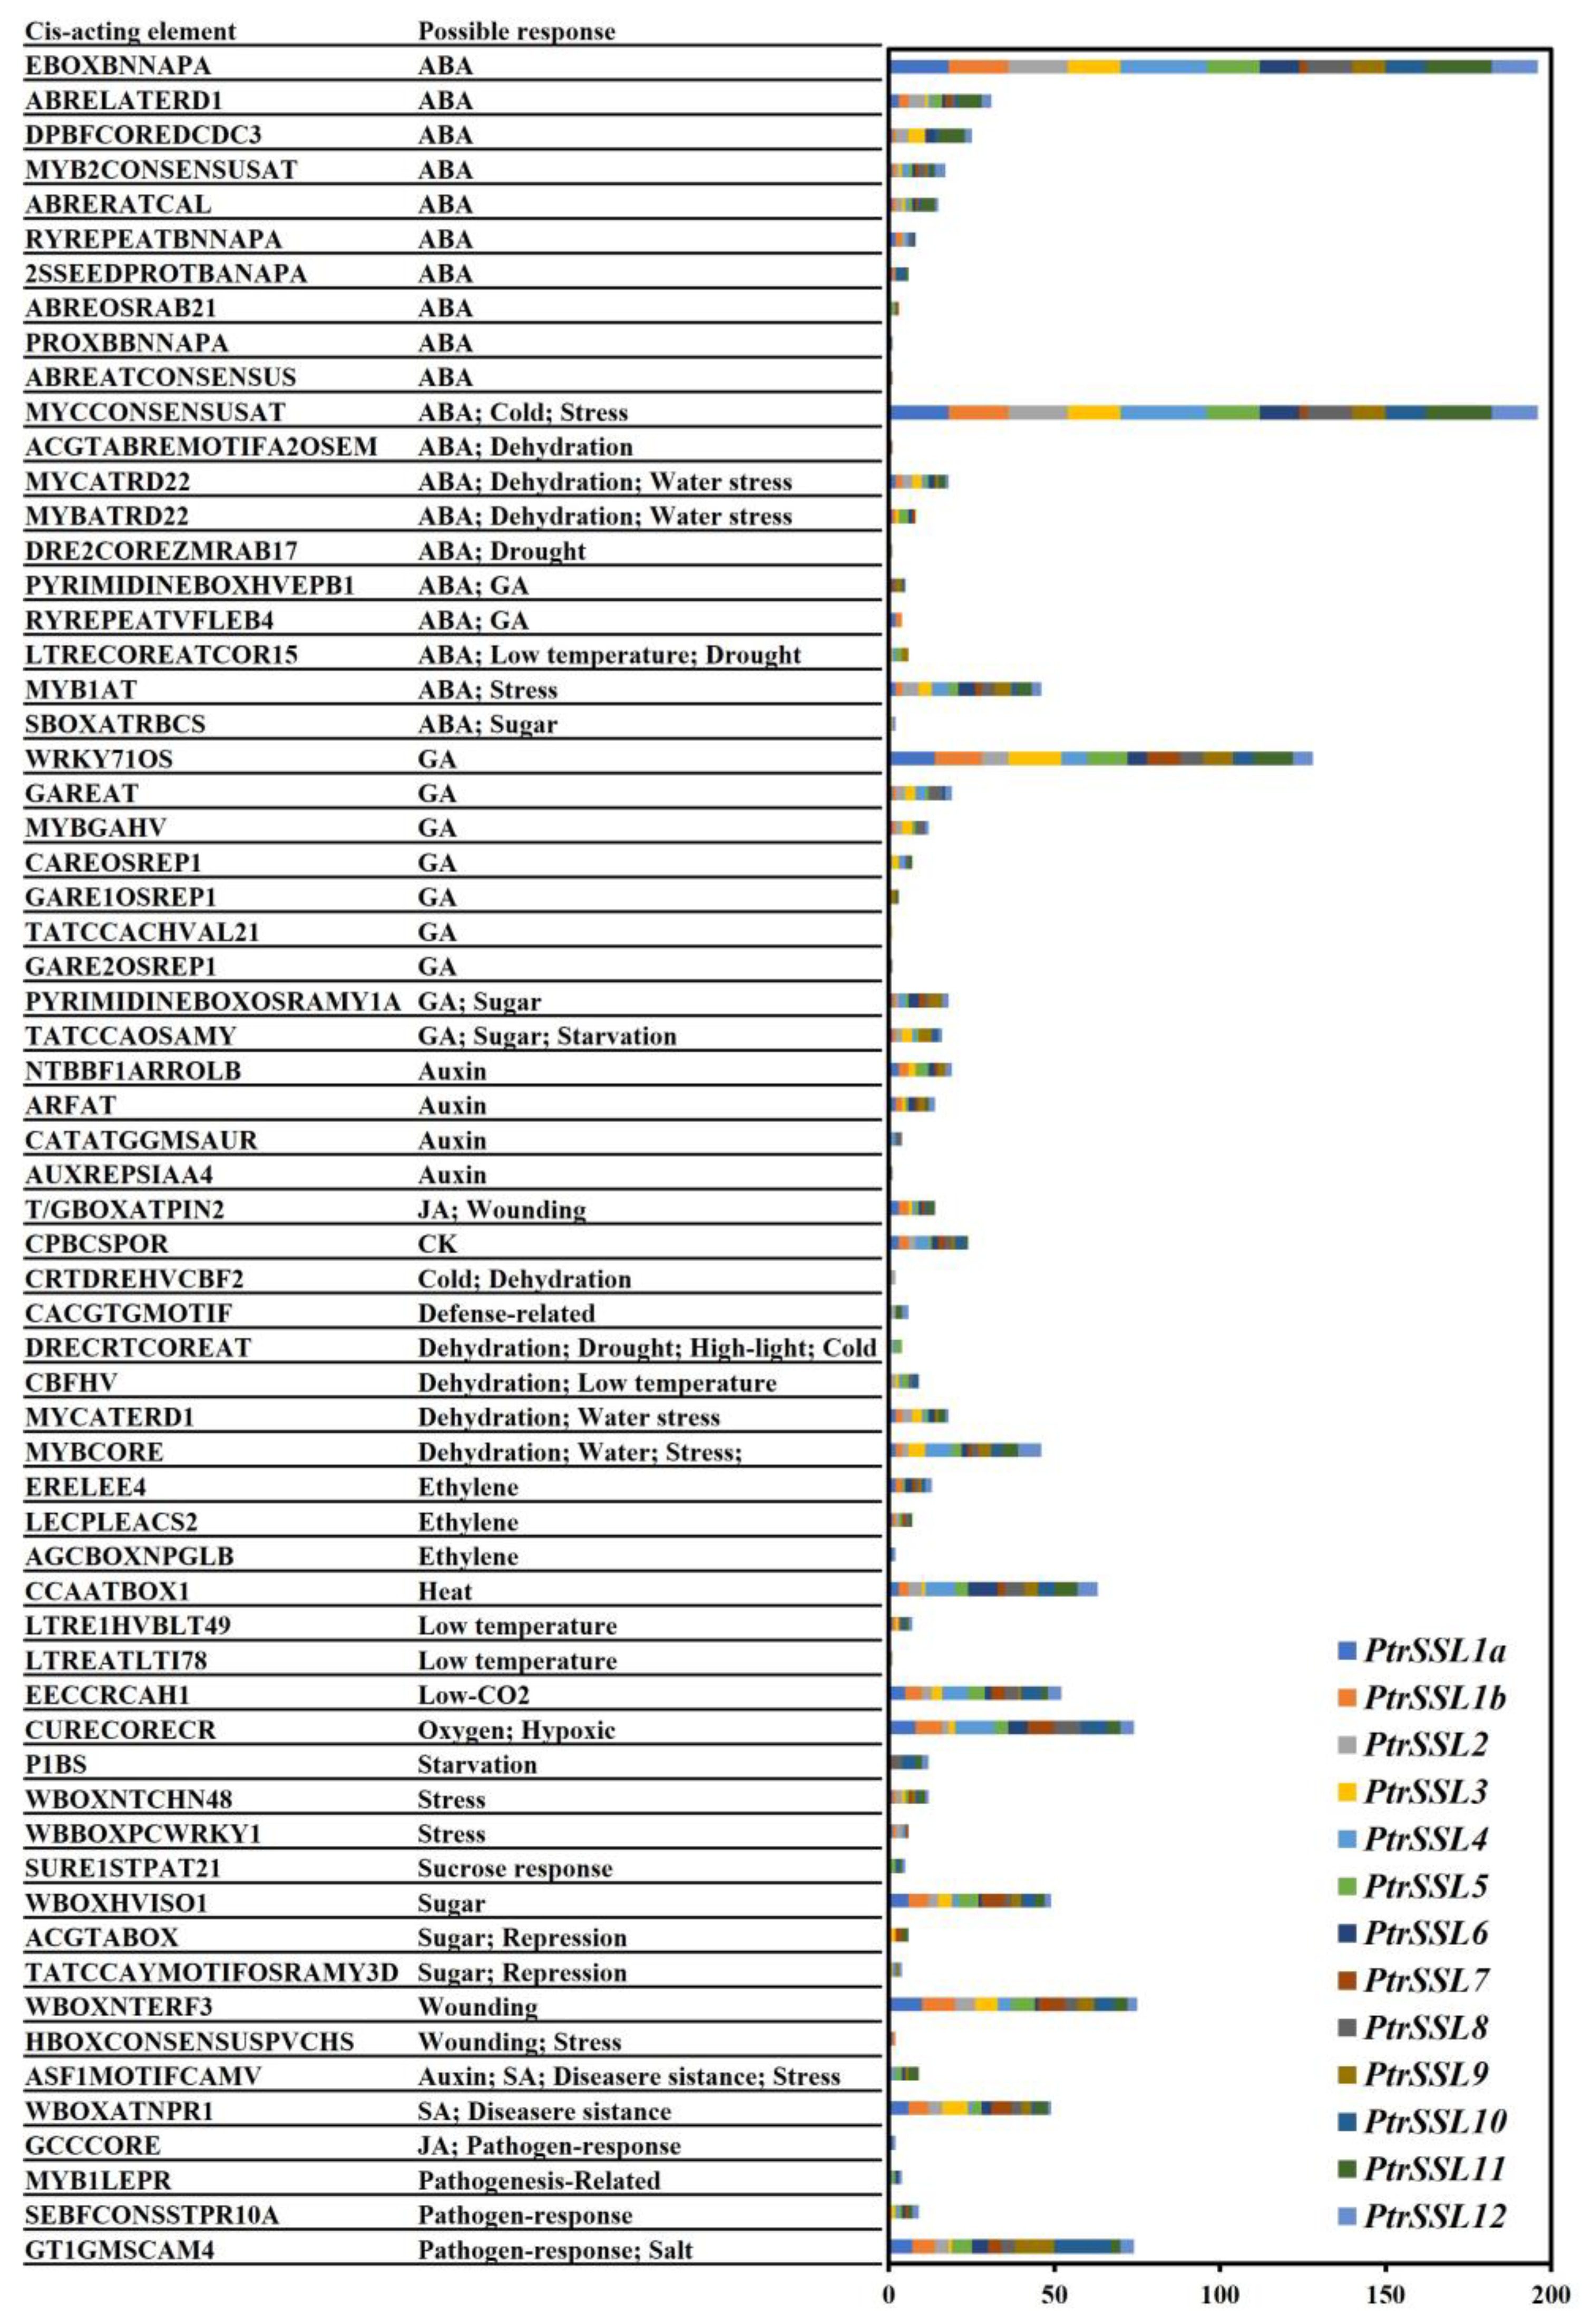
Cis elements are specific DNA sequences located upstream of the gene coding sequence that can bind to regulatory proteins. We predicted the cis-elements in the 2000 bp upstream sequence of all PtrSSLs through PLACE [21]. As shown in Figure 5 and Supplementary Table S3, the elements associated with stress and hormonal responses cover a wide range of family members. A large number of cis elements associated with abiotic stresses were found in the promoter regions of most PtrSSLs, for example, in response to dehydration (ACGTABREMOTIFA2OSEM, MYCATRD22, MYBATRD22, etc.), water stress (MYCATRD22, MYBATRD22, MYCATERD1, etc.), drought (DRE2COREZMRAB17, LTRECOREATCOR15, DRECRTCOREAT, etc.), low temperature (LTRECOREATCOR15, LTRE1HVBLT49, LTREATLTI78, etc.), cold (CRTDREHVCBF2, DRECRTCOREAT, MYCCONSENSUSAT, etc.), stress (MYB1AT, MYBCORE, HBOXCONSENSUSPVCHS, etc.), and so on. Similarly, a large number of cis-elements associated with biotic stresses were found in most member promoter regions, such as disease-resistance (ASF1MOTIFCAMV, WBOXATNPR1), pathogen-response (GCCCORE, SEBFCONSSTPR10A, GT1GMSCAM4), and pathogenesis-related (MYB1LEPR) ones. A total of 41 phytohormone-related elements were identified, including abscisic acid response elements (EBOXBNNAPA, ABRELATERD1, DPBFCOREDCDC3, etc.), salicylic acid response elements (ASF1MOTIFCAMV, WBOXATNPR1), gibberellin response element (WRKY71OS, GAREAT, MYBGAHV, etc.), auxin response elements (NTBBF1ARROLB, ARFAT, CATATGGMSAUR, etc.), jasmonic acid response elements (T/GBOXATPIN2 and GCCCORE), and ethylene response elements (ERELEE4, LECPLEACS2, and AGCBOXNPGLB). In addition, each of the PtrSSLs’ promoters contained abundant ABA response elements, with PtrSSL4 containing the largest number, i.e., 65, and PtrSSL7 containing the lowest number, i.e., 15. All of these results point to the possible involvement of the PtrSSL gene in the plant response to hormones and biotic/abiotic stresses.

2.4. Expression Patterns of PtrSSLs in Roots, Stems, and Leaves

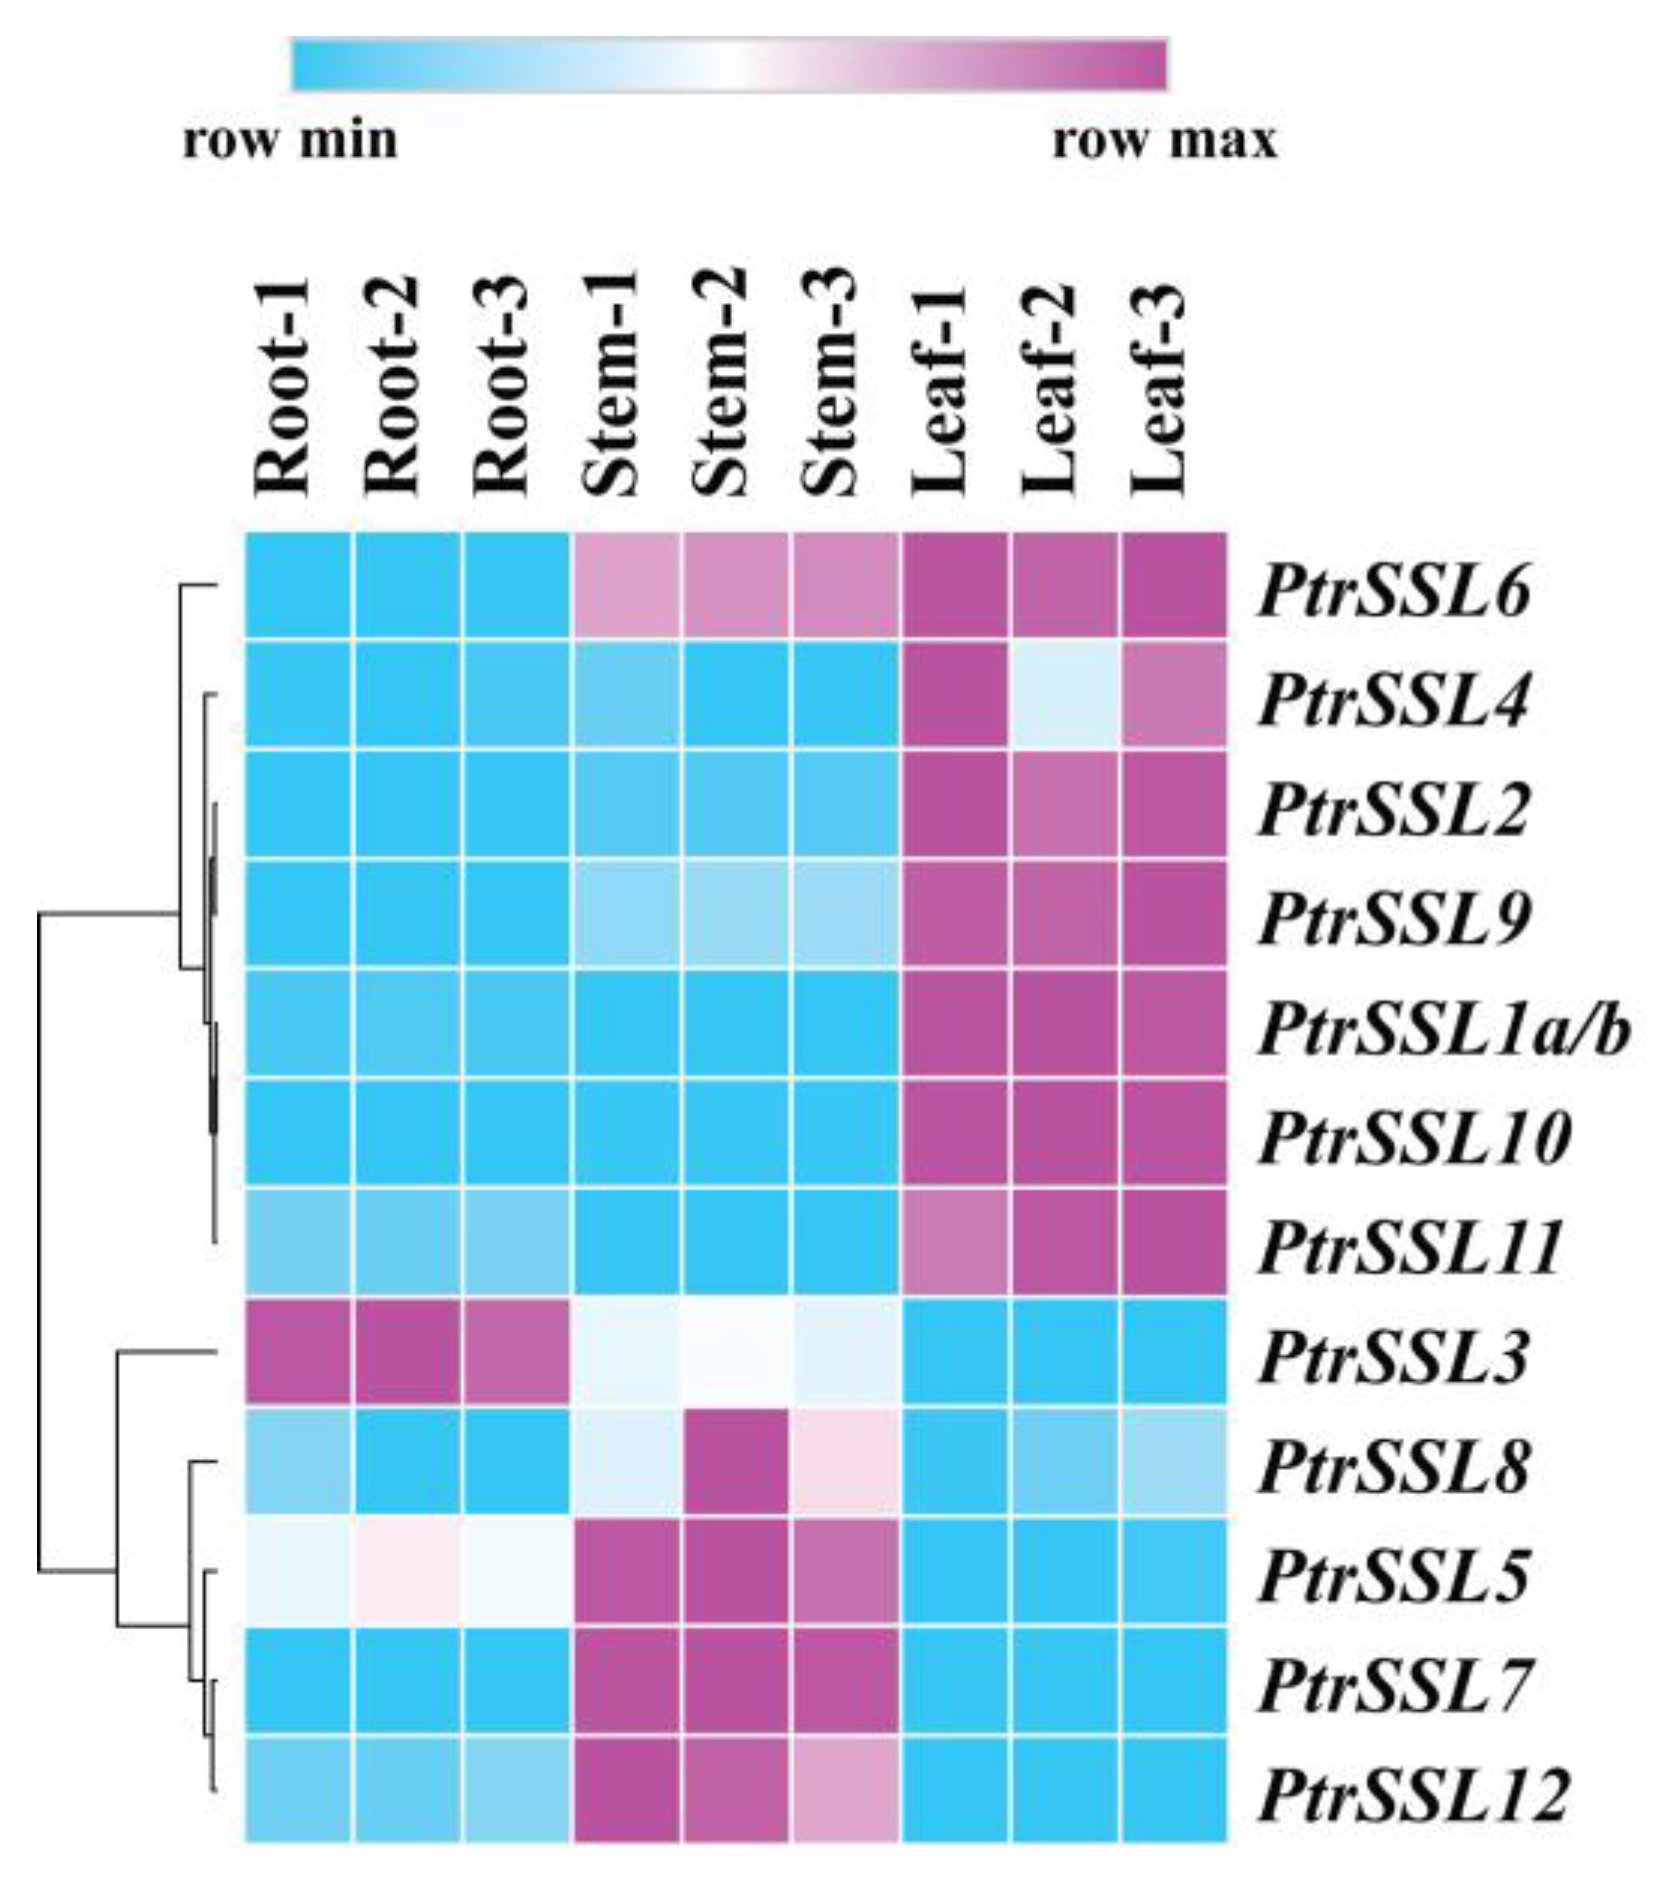
To investigate the expression pattern of PtrSSLs in poplar, three tissues (root, stem, and leaf) were sampled from Populus trichocarpa for qPCR assays. The cluster analysis revealed that seven PtrSSLs exhibited high expression levels in leaves, among which PtrSSL6 was highly expressed in both stems and leaves, indicating their potential role in leaf function (Figure 6 and Supplementary Table S4). Additionally, four PtrSSLs, namely PtrSSL5, PtrSSL7, PtrSSL8, and PtrSSL12, exhibited high expression levels in stems, suggesting their involvement in stem function. Only PtrSSL3 showed high expression levels in roots, indicating its specific function in the roots. Overall, the different members of PtrSSLs have different expression patterns in roots, stems, and leaves, suggesting that the function of these genes may involve different biological processes.

2.5. Analysis of Upstream TF Regulation Network

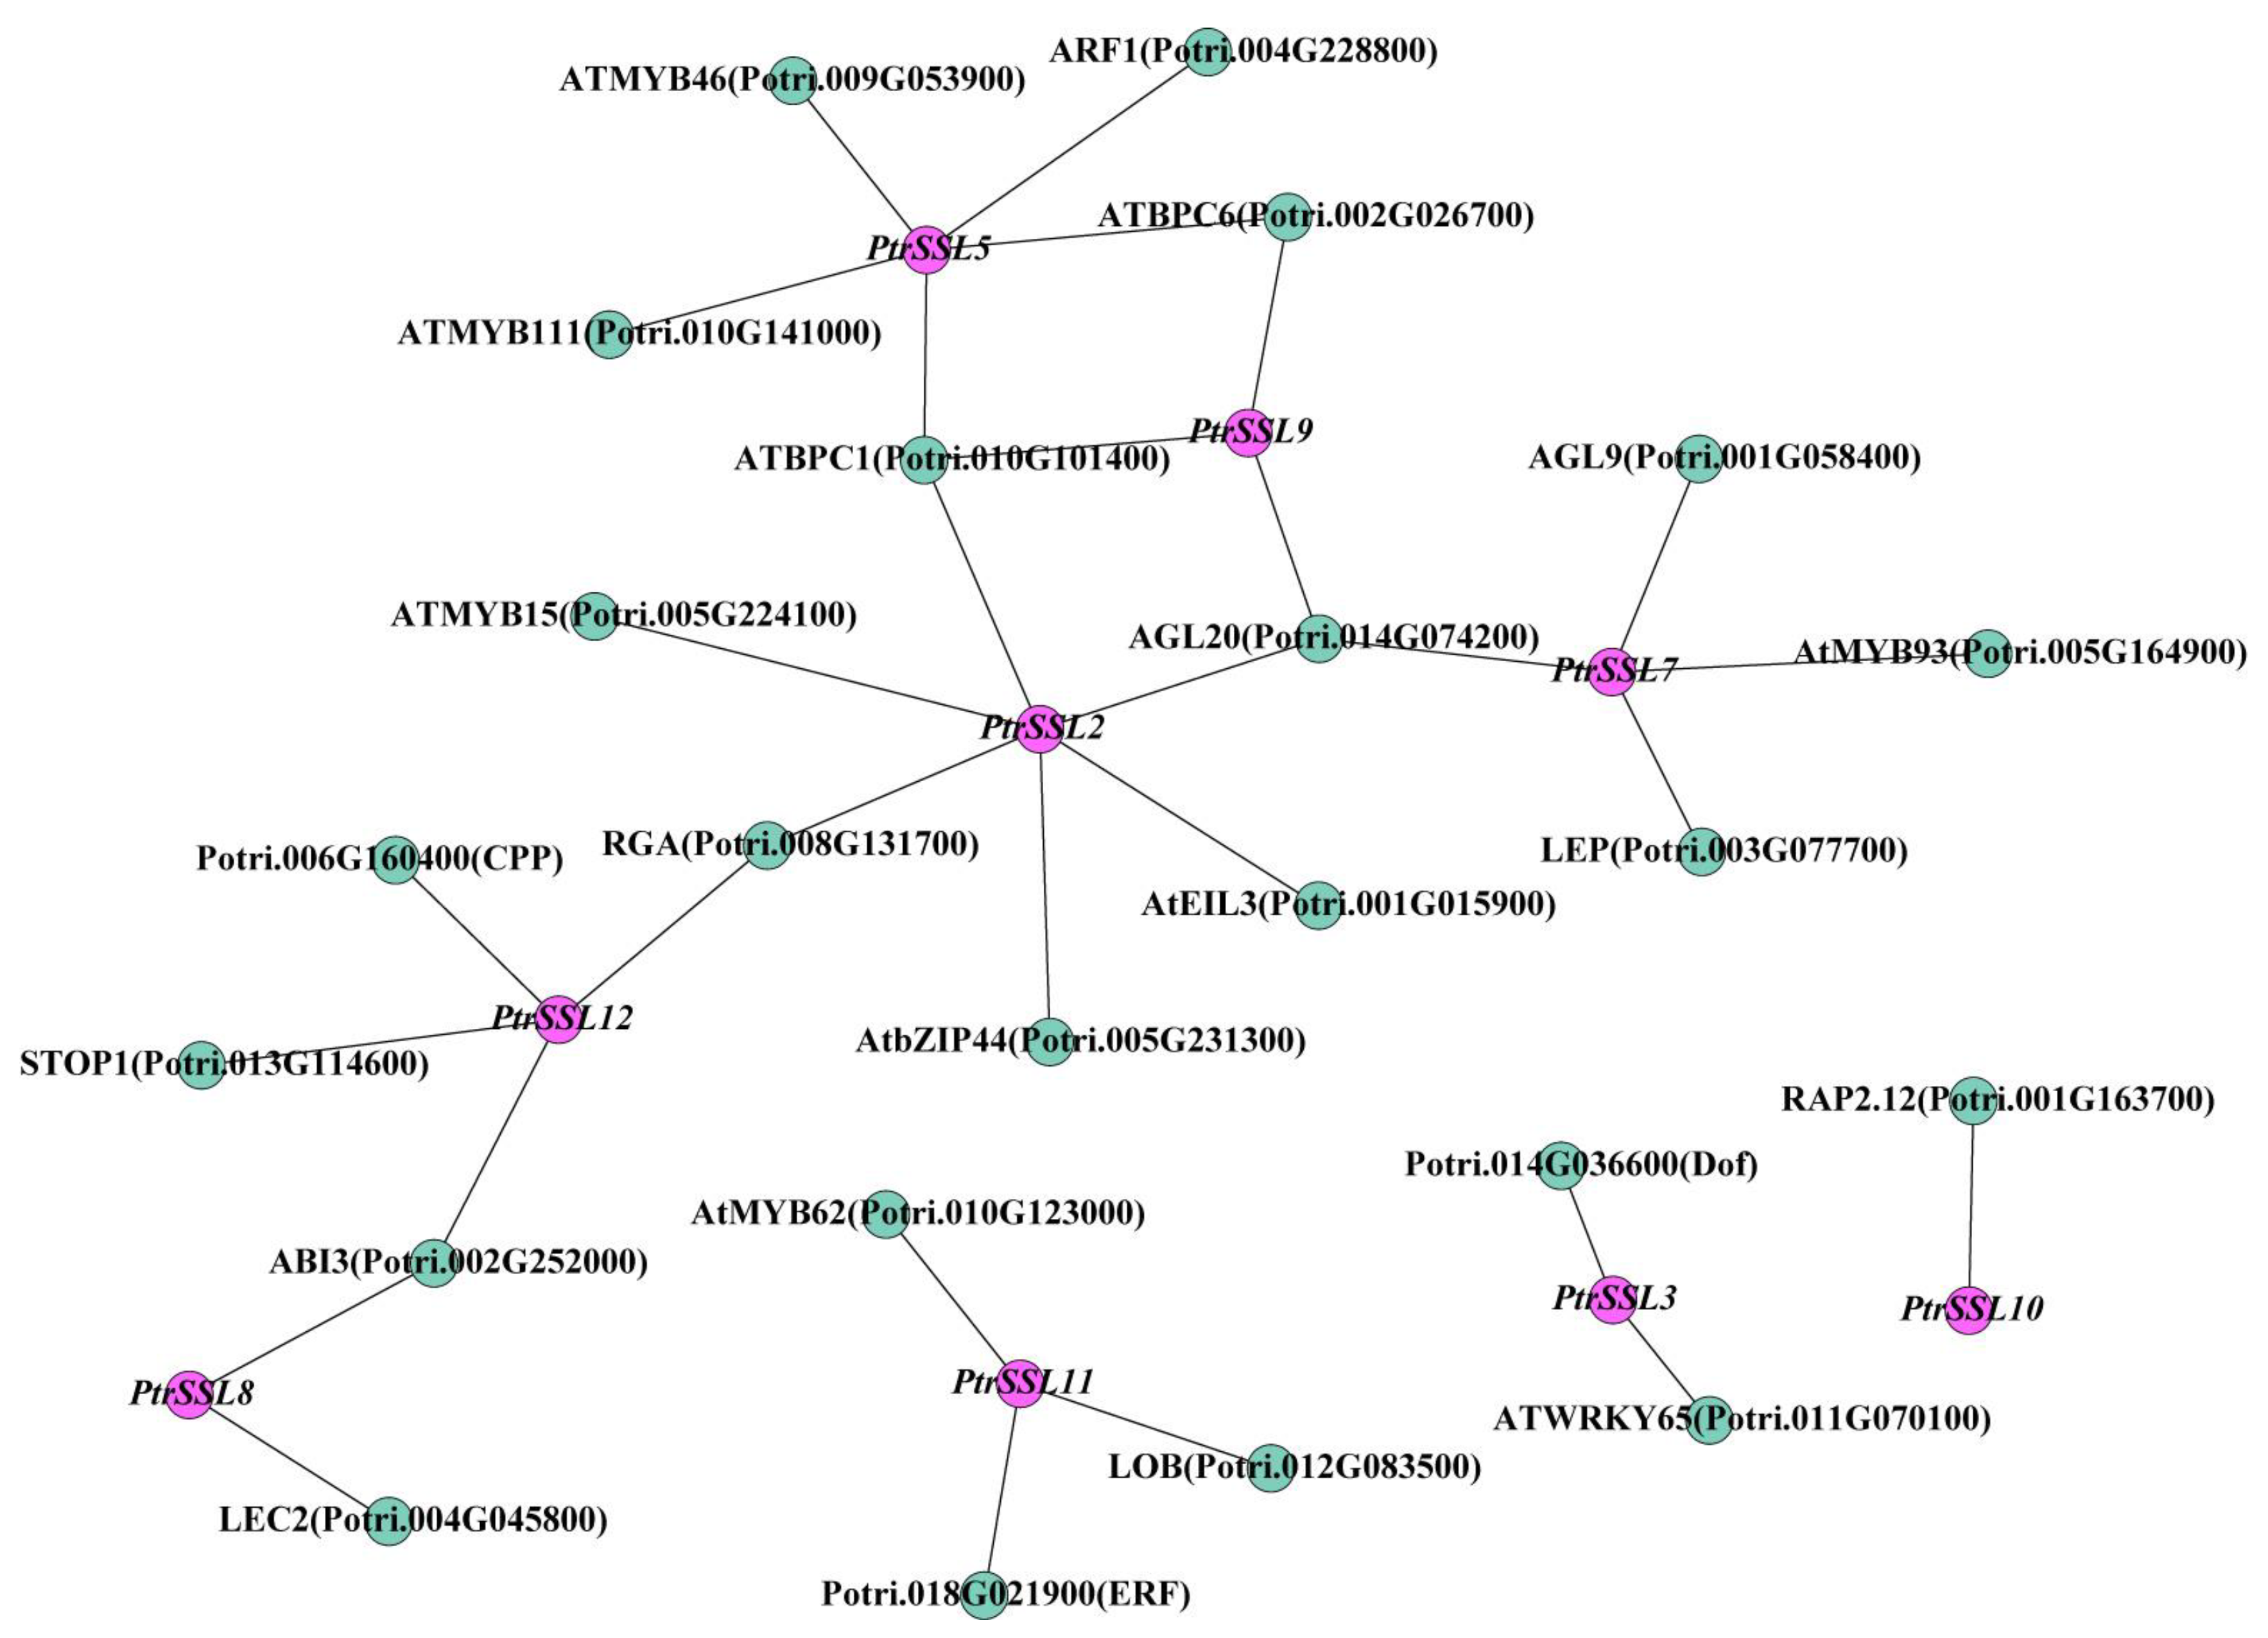
In order to gain a better understanding of the underlying function of PtrSSLs, their upstream regulators were predicted by utilizing online websites and transcriptome data. The results show that the network consists of 9 PtrSSLs and 23 transcription factors (Figure 7). Based on previous studies, several of these TFs have been reported to be associated with plant adversity stress. For example, ABI3 mediates dehydration-stress signaling in Arabidopsis through the regulation of a group of genes that play a role primarily during the stress-recovery phase [22]. MtABI3 overexpression enhanced tolerance of transgenic Medicago truncatula to mannitol, drought, and salt stresses and induced the expression of adversity-related genes [23]. AGL20/SOC1 can repress a broad array of genes that mediate abiotic stress responses in flowering induction [24]. Arabidopsis BPC1/BPC2 positively regulates plant salt tolerance by repressing GALS1 expression and β-1,4-galactan accumulation [25]. MYB15 and MYB46 are both from the MYB family, and one study found that MYB15 is essential for basal immunity (PTI) in Chinese wild grape [26]. The myb15 mutant plants show increased tolerance to freezing stress, whereas its overexpression reduces freezing tolerance [27]. MYB46 likely functions as a disease-susceptibility modulator to Botrytis cinerea through the integration of cell wall remodeling and downstream activation of secondary lines of defense [28]. MYB46 could enhance salt and osmotic stress tolerance in apple by directly activating stress-responsive signals [29]. In addition, WRKY65 [30], RGA (AtRGA1) [31,32], and STOP1 [33] have also been reported to respond to or participate in a variety of stresses.

2.6. RT-qPCR Validation of PtrSSLs under Different Stresses

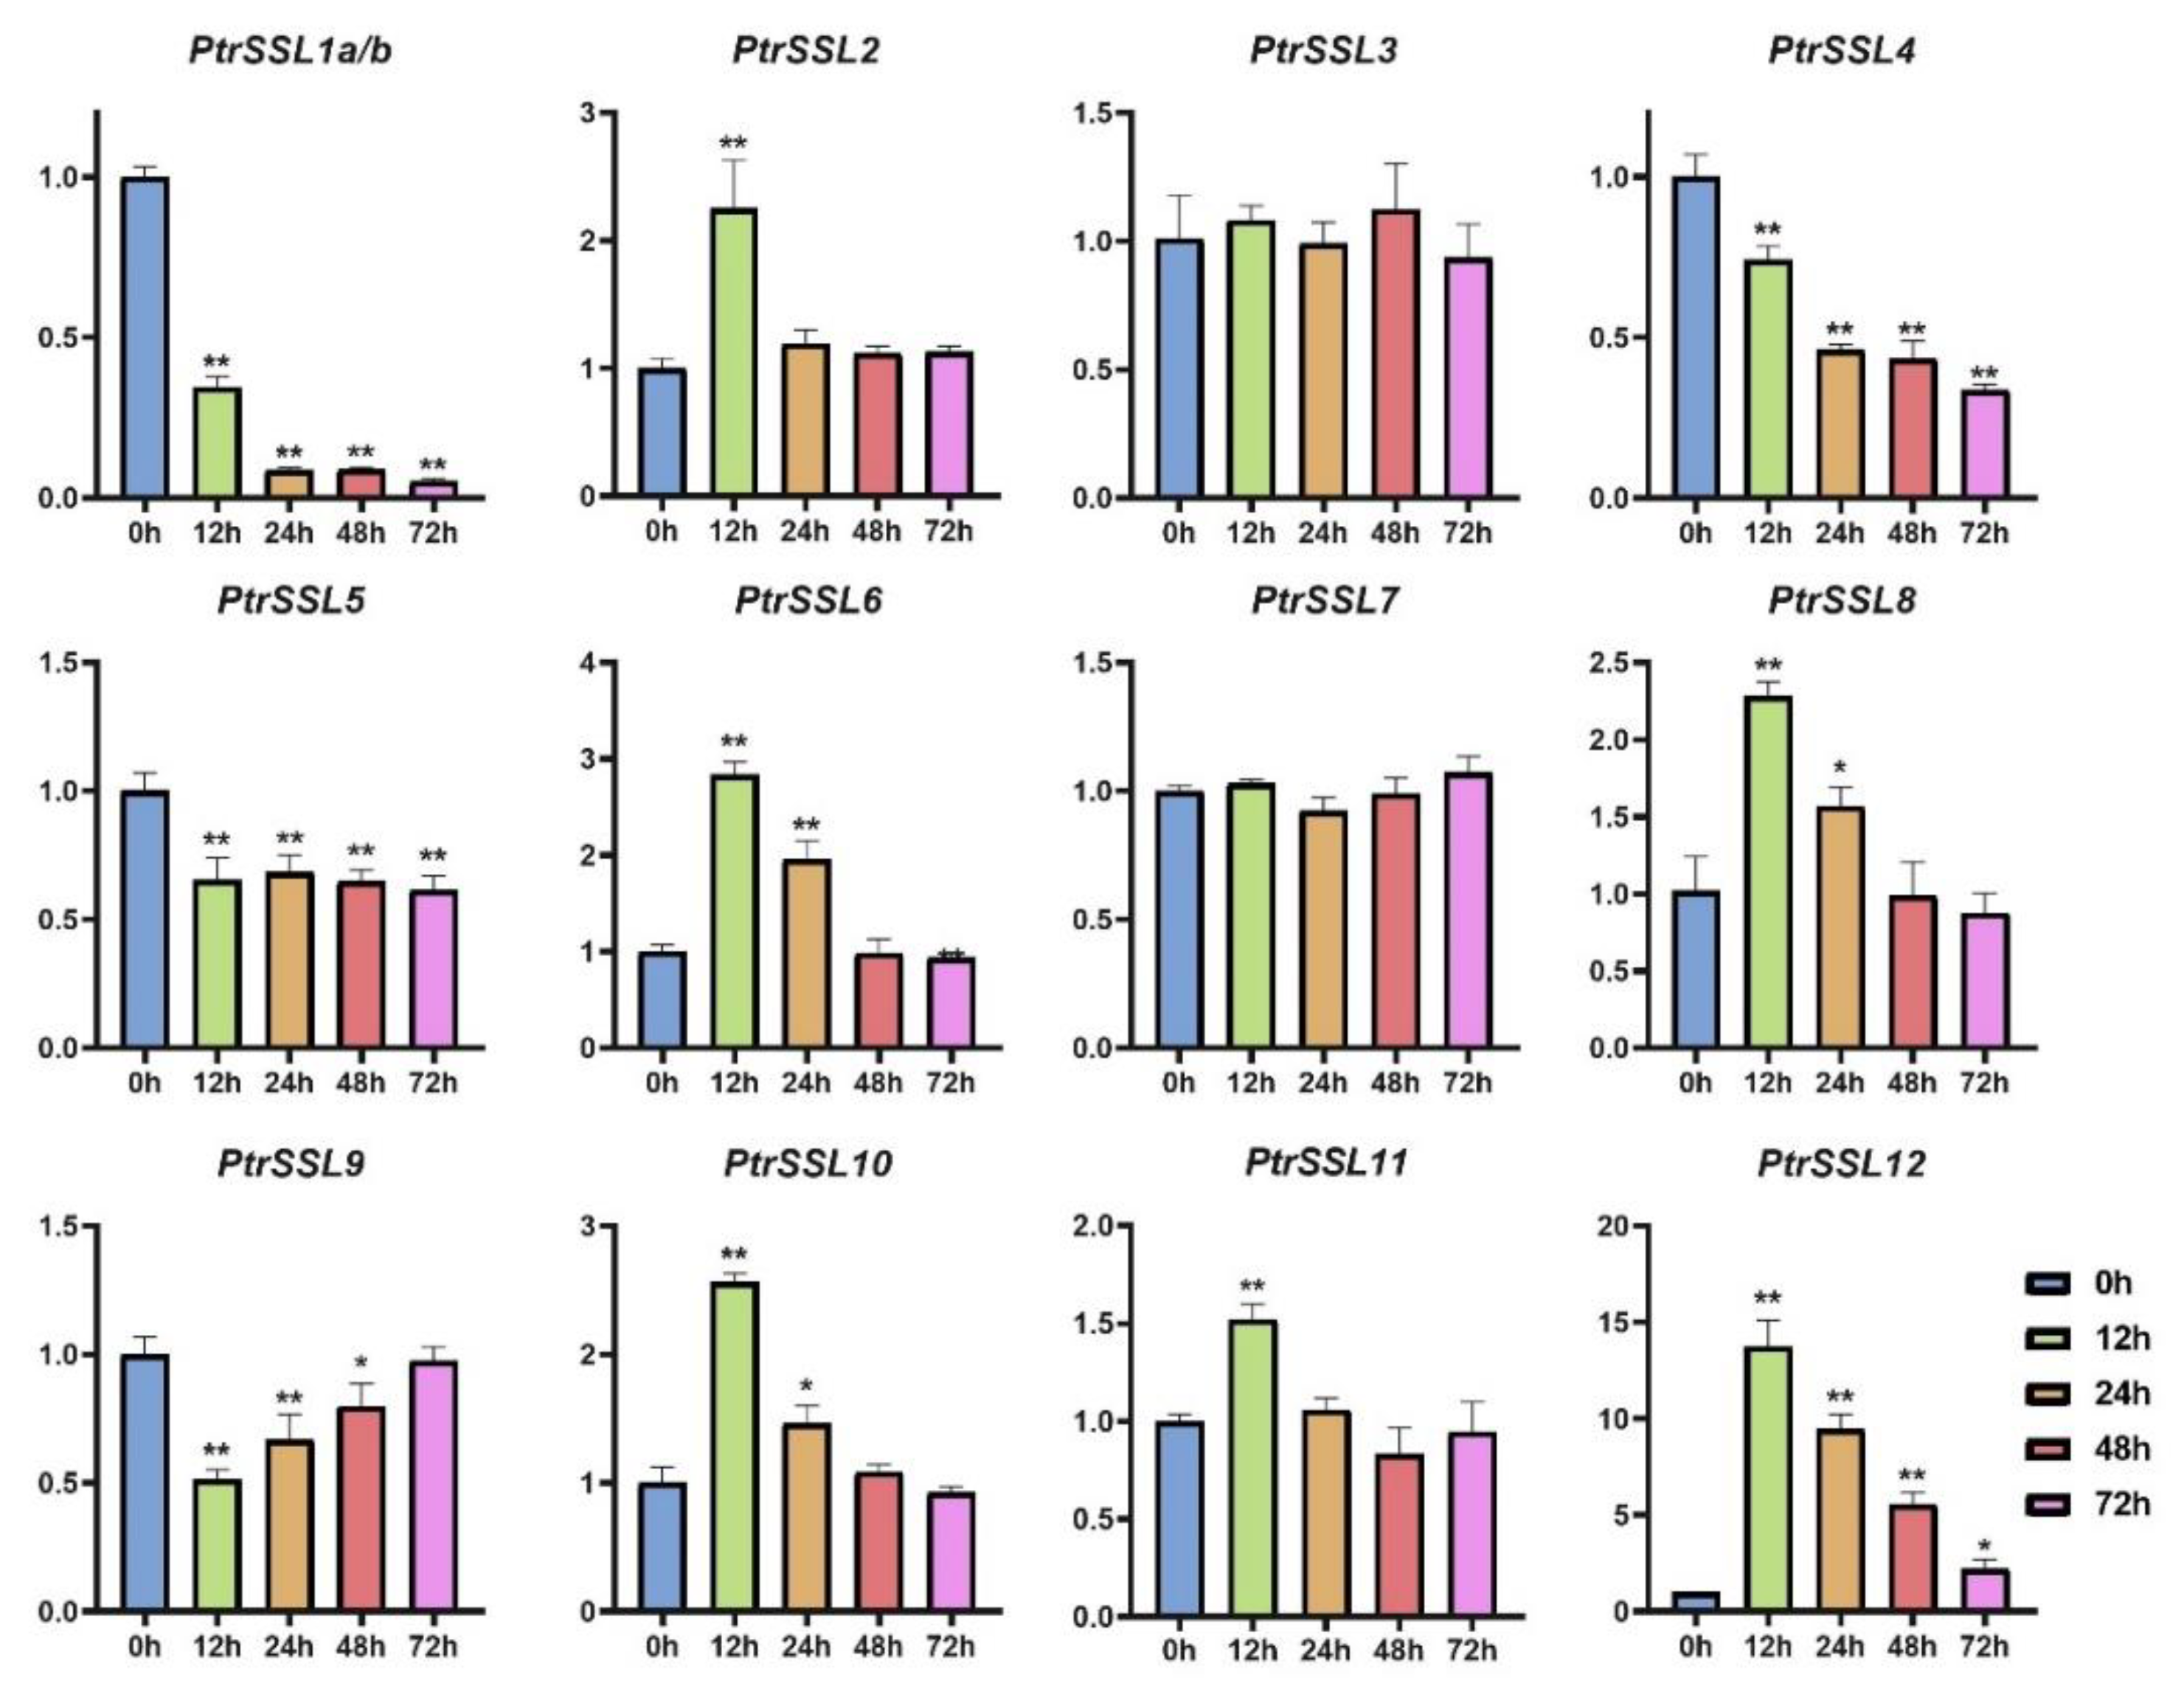
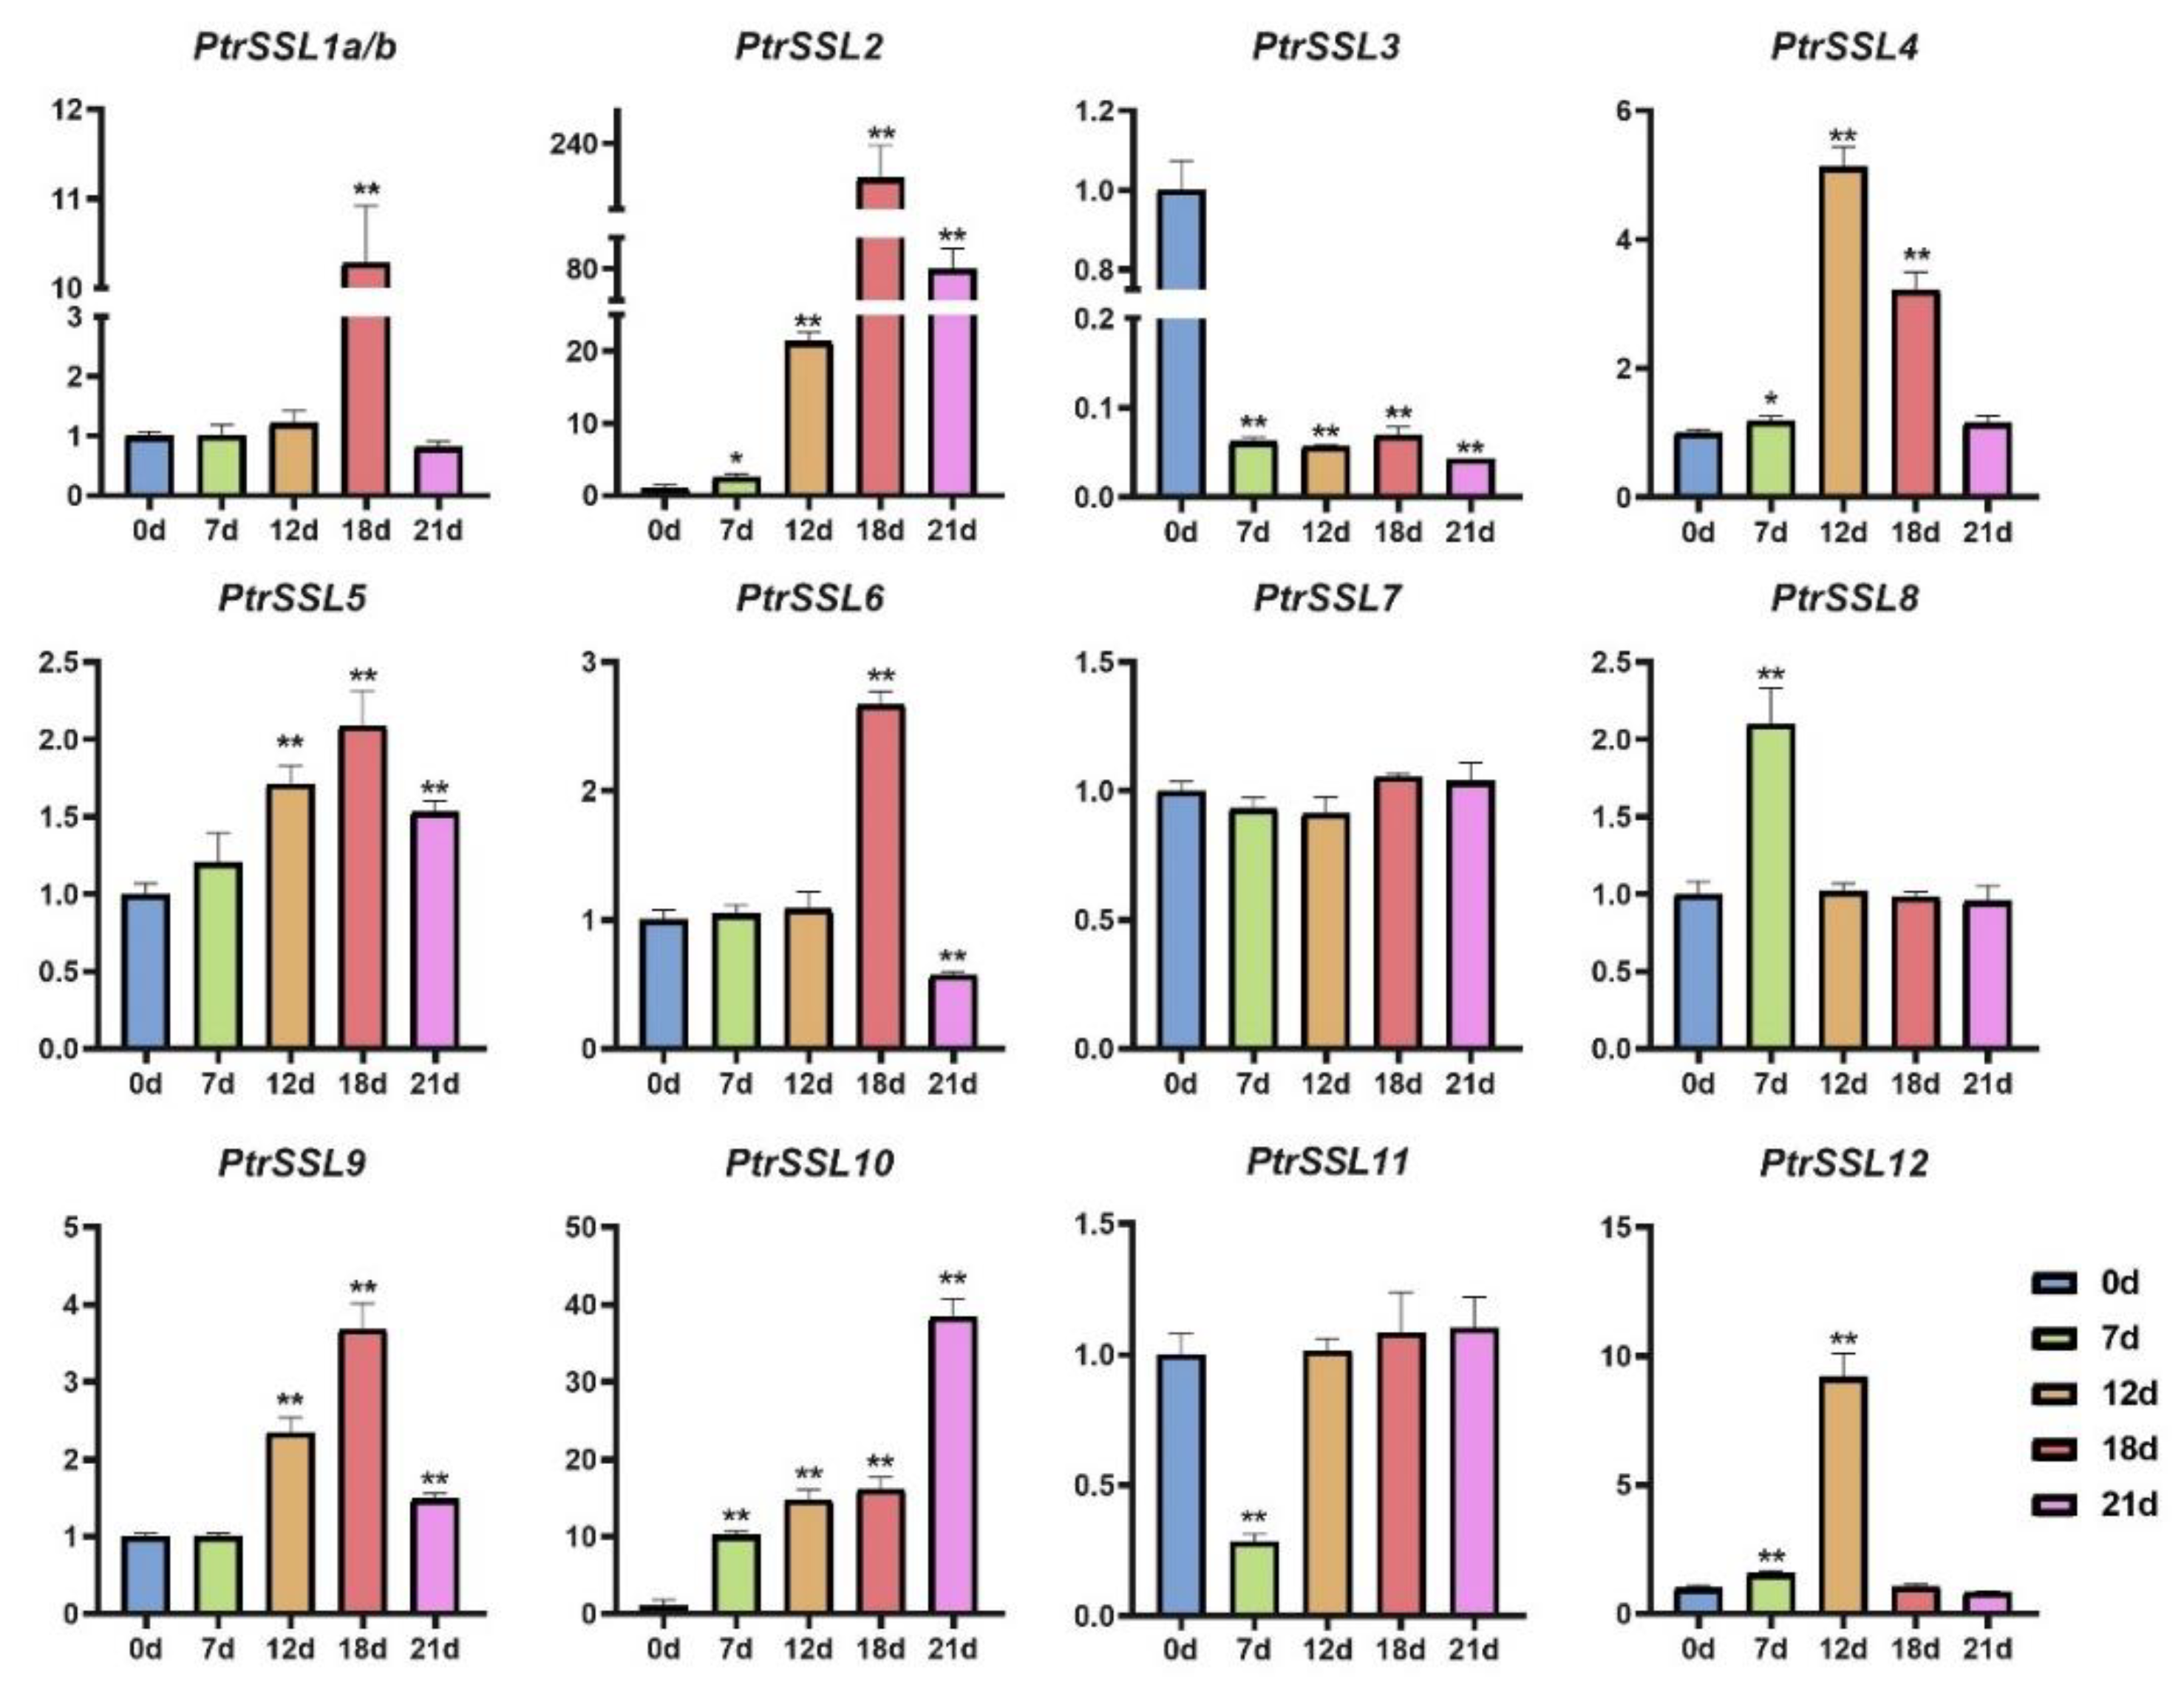
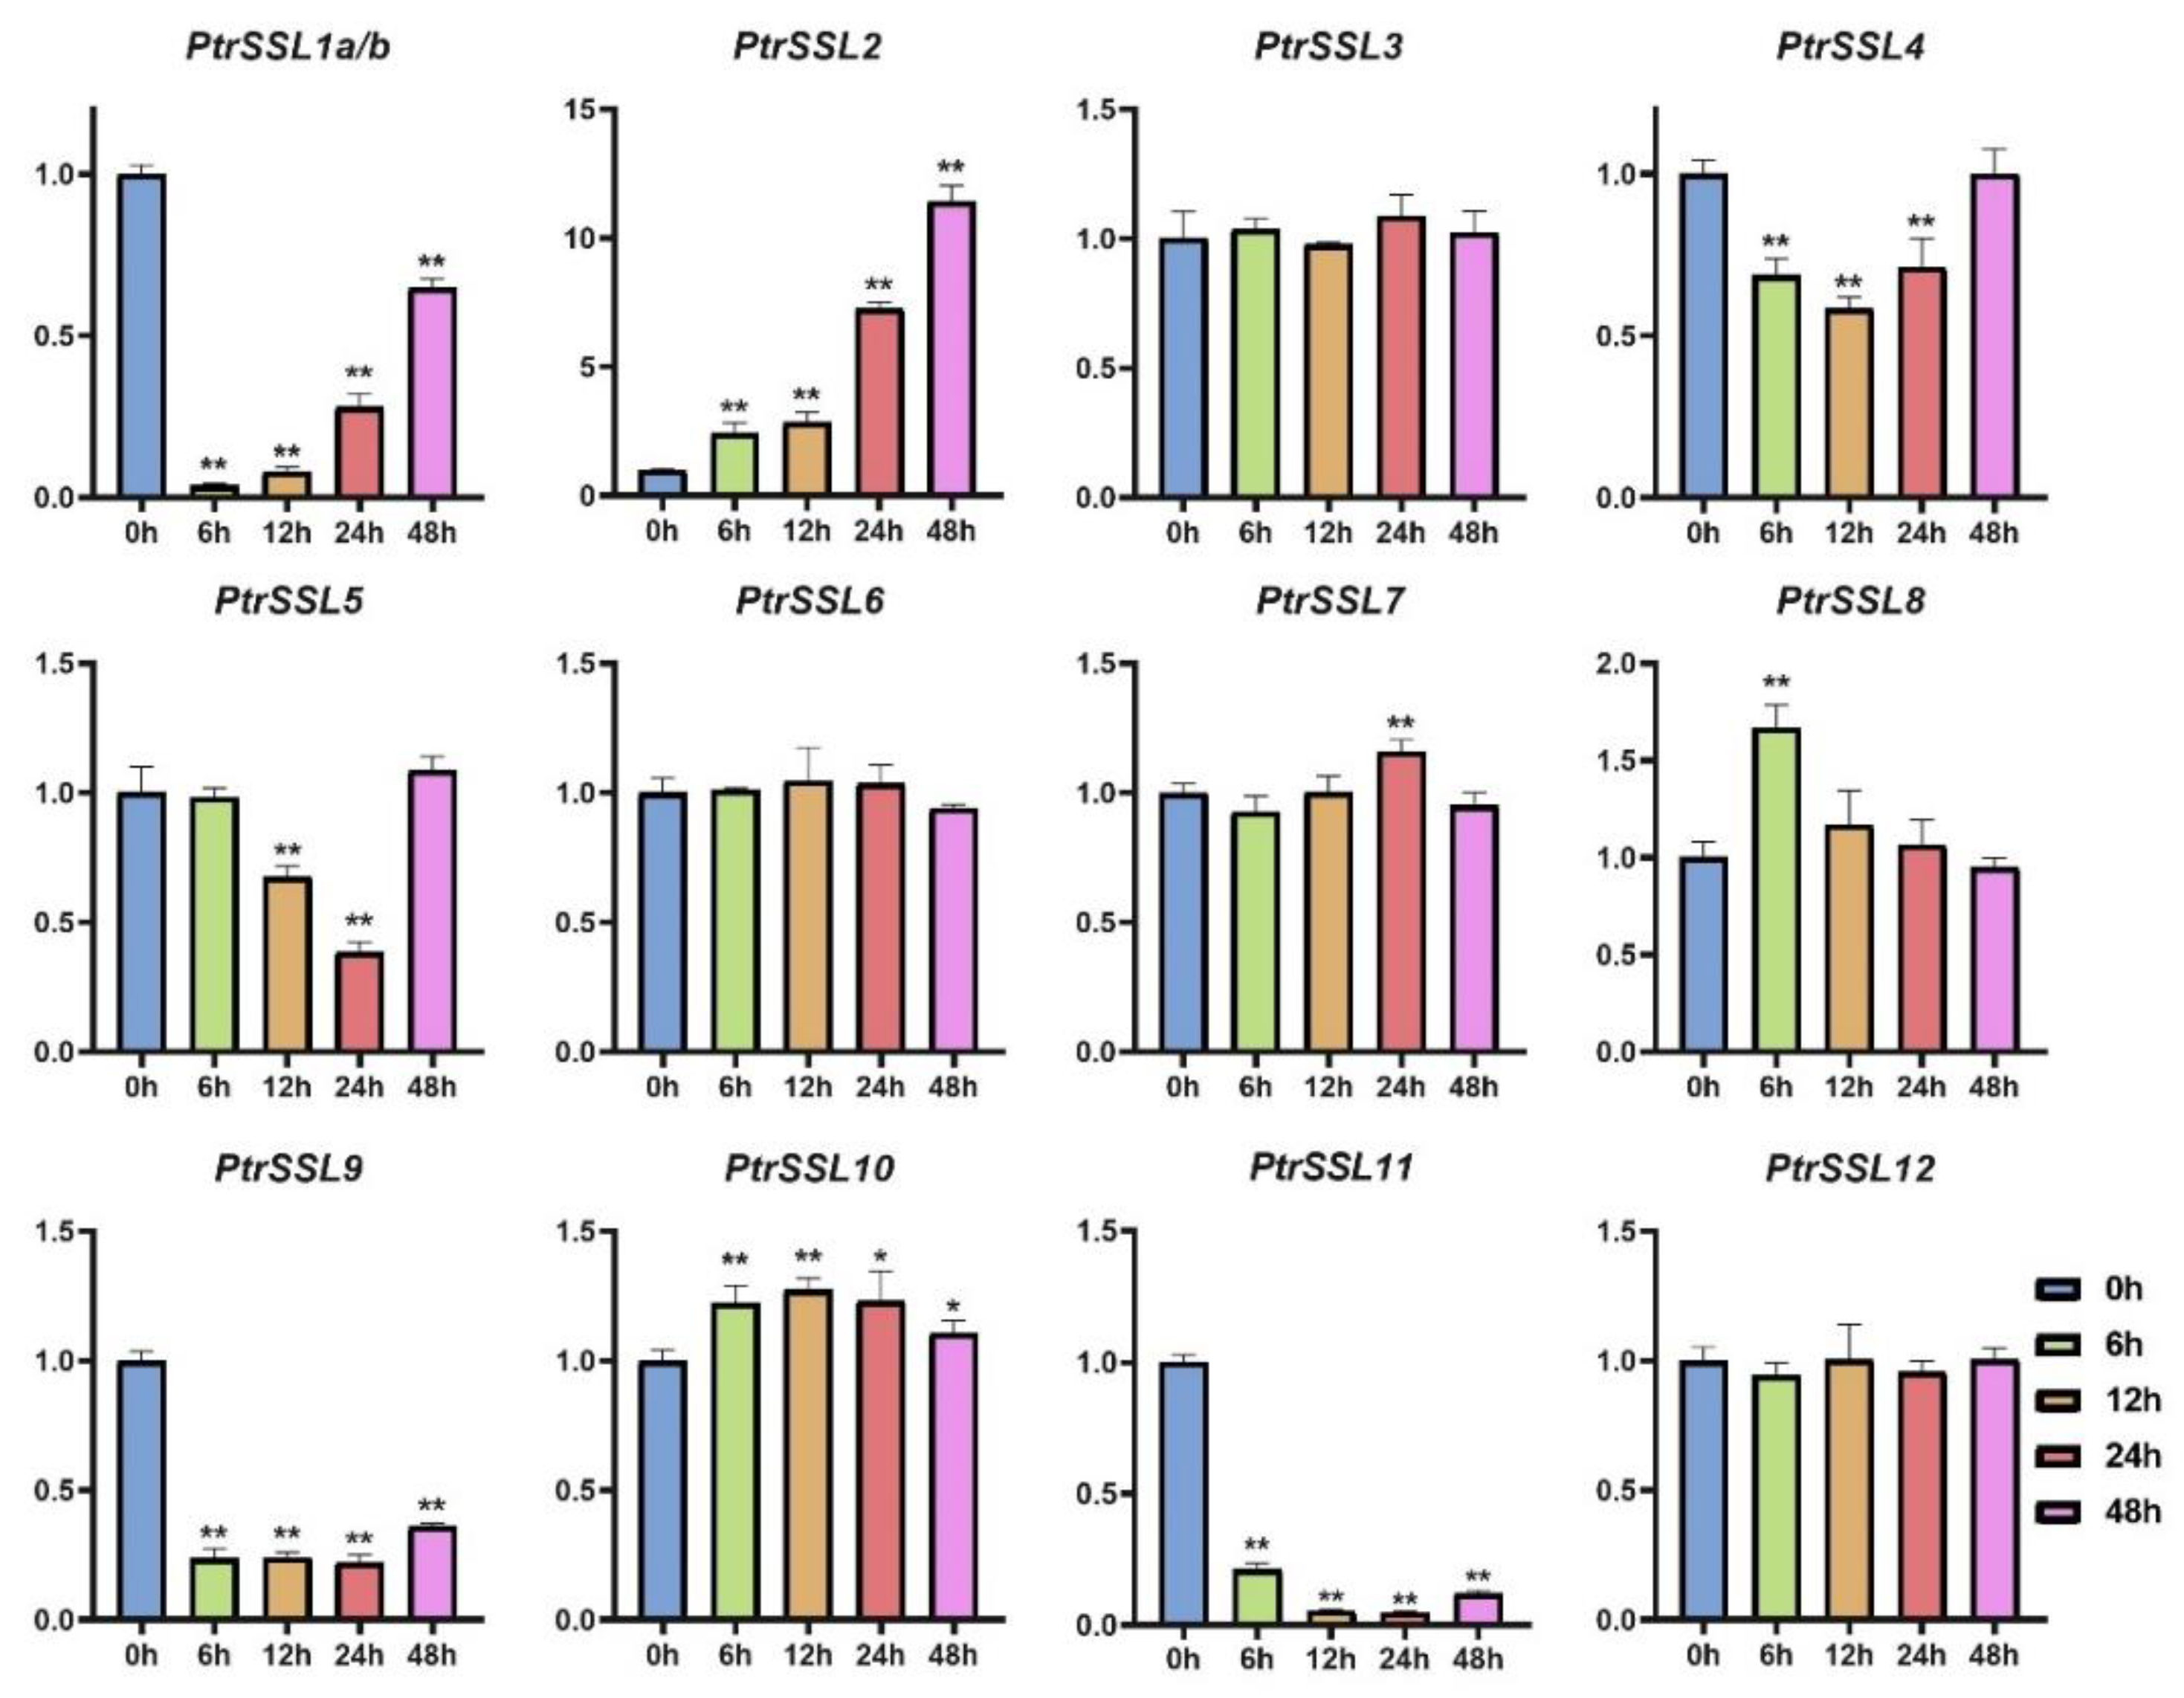
The results of the promoter analysis indicate that the promoter regions of PtrSSLs cover a large number of biotic/abiotic-stress-response elements, implying that they may have a positive response to biotic/abiotic stresses. To verify this, we subjected wild-type poplars to drought, salt, and leaf-blight stress and used RT-qPCR to quantify the expression patterns of PtrSSLs under different stresses (Supplementary Table S5). As shown in Figure 8, the expressions of six PtrSSLs were significantly upregulated in response to salt stress, namely PtrSSL2, PtrSSL6, PtrSSL8, PtrSSL10, PtrSSL11, and PtrSSL12. Four PtrSSLs were significantly downregulated after salt stress, namely PtrSSL1a/b, PtrSSL4, PtrSSL5, and PtrSSL9. Only the expression of PtrSSL3 and PtrSSL7 showed no significant change after salt stress. Then, as shown in Figure 9, only PtrSSL7 showed no significant change in expression following drought stress, with most PtrSSLs (nine genes) demonstrating significant upregulation of expression in response to drought and a few PtrSSLs (PtrSSL3 and PtrSSL11) showing significant downregulation of expression. The results after leaf-blight stress showed significant changes in the expression of most PtrSSLs (Figure 10), except for PtrSSL3, PtrSSL6, and PtrSSL12, which showed no response. Among them, PtrSSL2, PtrSSL7, PtrSSL8, and PtrSSL10 showed significant upregulation of expression, while PtrSSL1a/b, PtrSSL4, PtrSSL5, PtrSSL9, and PtrSSL11 were significantly downregulated. Overall, PtrSSLs have different expression patterns under different types of stress, and they may play important functions in plant resistance to biotic/abiotic stresses.

3. Discussion

Plants withstand complex and diverse environments by supervising a large number of stress-responsive and structural genes, engendering many physiological and metabolic processes [34]. The SSL gene family plays a key role in plant resistance to biotic/abiotic stresses, and although a growing number of SSL family members have been identified from a variety of plants, knowledge of their function is still restricted to a small number of plants, such as in Arabidopsis [31,32], Catharanthus roseus [14], and Solanum lycopersicum [19]. However, no relevant studies on the SSL family have been found in the poplar.
A total of 13, 15, and 22 SSL genes were obtained in Populus trichocarpa, Arabidopsis thaliana, and Salix purpurea, respectively, where the number of AtSSL genes that we obtained is consistent with previous reports [1,13], indicating that the results of our evolutionary analysis are stable. We found that Populus trichocarpa and Salix purpurea are more closely related evolutionarily than Arabidopsis by performing a phylogenetic analysis, probably because both are woody plants. The gene structure and motif analysis revealed that PtrSSLs in the same subgroup contained similar numbers of exons and motif species, which corroborated the phylogenetic tree distribution results. As we know, gene duplication, which is the main pattern of gene family expansion, includes tandem duplication and segmental duplication events [35,36,37]. The collinearity analysis and chromosome localization showed that most PtrSSLs were unevenly distributed across different chromosomes, with no tandem replication events occurring, while segmental replication events occurred in four pairs of PtrSSLs, suggesting that segmental replication plays an important role in the expansion of the poplar SSL family. The result of the cross-species collinearity analysis revealed that the largest number of PtrSSL collinear genes were present in S. purpurea and E. grandis probably because all three species are woody plants, implying that the evolution of SSLs may have diverged with the differentiation of herbaceous and woody plants. Overall, the bioinformatic analyses indicate that the PtrSSL gene family has similarities in phylogenetic and structural features to several species, suggesting that the function of SSL in these species may also be similar.
We found that the promoters of all PtrSSLs contained many biotic/abiotic-stress-response elements. Therefore, we subjected the plant material to different treatments, including salt, drought, and leaf blight fungus. The qPCR results for the three treatments showed that most PtrSSLs responded significantly to salt, drought, and leaf-blight stresses, suggesting that PtrSSLs may be key functional genes in the biotic/abiotic-stress-response pathway. By predicting the upstream TF regulatory network, we found that the response of PtrSSLs to stress may be induced by upstream TFs. For example, the qPCR results showed that PtrSSL2 was able to respond to drought, salt, and leaf blight and that its upstream regulator, RGA, was able to respond to drought and salt stress in Arabidopsis [31,32], while the regulators AGL20 [24], ATBPC1 [25], and ATMYB15 [26] were able to participate in drought, salt, and immunoregulatory processes in plants, respectively. It can hypothesize that the response of PtrSSL2 to drought, salt, and leaf blight is induced by RGA, AGL20, ATBPC1, and ATMYB15. Also regulated by ATBPC1 and AGL20 in the TF regulatory network is PtrSSL9, a gene whose response to drought and salt stress may be induced by ATBPC1 and AGL20. MYB46 has an important function in plants’ resistance to disease and salt stress [28,29], and the altered expression of its target gene, PtrSSL5, during salt and leaf-blight stresses may be regulated by it. The expression of PtrSSL12 was significantly upregulated in response to drought and salt stress, and it was regulated by RGA, ABI3 [22,23], and STOP1 [33] in the TF regulatory network; all three TFs were reported to be involved in drought- and salt-stress-related biological processes in plants [22,23,31,32,33], so the elevated expression of PtrSSL12 may be activated by RGA, ABI3, and STOP1. Also likely to be activated by ABI3 is PtrSSL8, whose expression was significantly increased in drought, salt, and leaf-blight stresses. It has been shown that WRKY65 plays an important role in the early stages of drought stress [30], and in our TF regulatory network, PtrSSL3 is predicted to be regulated by WRKY65, and the gene is significantly upregulated in expression after drought stress; this process may be induced by WRKY65. In conclusion, the results of our promoter analysis and gene expression following adversity stress indicate that the PtrSSL family may be one of the key functional gene families in the biotic/abiotic-stress-response pathway in plants.

4. Materials and Methods

4.1. Identification of SSLs in Poplar

Amino acid sequences of Populus trichocarpa (Populus trichocarpa v4.1), Arabidopsis thaliana (TAIR10), and Salix purpurea (Salix purpurea v5.1) SSLs were extracted from the Phytozome database (https://phytozome-next.jgi.doe.gov/, accessed on 12 March 2023), and the conserved structural domains Strictosidine synthase (PF03088) and Strictosidine synthase-like N-terminal (PF20067) were identified by Hidden Markov Model (HMM) profiling [38]. The two structured domains were obtained from the Pfam database (http://pfam.xfam.org/, 12 March 2023). The physical and chemical parameters of SSL proteins were calculated using the ExPASy website (http://web.expasy.org/protparam/, accessed on 12 March 2023).

4.2. Phylogenetic and Structural Analysis of PtrSSLs

Based on amino acid sequences from members of the Populus trichocarpa, Arabidopsis thaliana, and Salix purpurea SSL families, multiple sequence alignment was first performed using Clustal X [10]. Subsequently, MEGA X software [39,40] with the neighbor-joining method was used to construct a phylogenetic tree with the bootstrap value set to 10,000. MEME [41] was used to identify the motif compositions and distributions of PtrSSLs. All of those generated files were visualized using TBtools [42] and Itools software (https://itol.embl.de/, accessed on 13 March 2023).

4.3. Chromosomal Localization and Collinearity Analysis

Populus trichocarpa genomic data downloaded from the Phytozome database (Populus trichocarpa v4.1) were used to map each PtrSSL gene to its corresponding chromosomal location based on its positional information with TBtools [42]. MCScan X (Multicollinearity Scanning Toolkit) software [43] was used to determine their covariance relationships, which were visualized using TBtools v1.120 [42].

4.4. Cis-Acting Element Analysis

The sequence 2000 bp upstream of the transcription start site (TSS) of each PtrSSL was extracted from the Phytozome database. Cis-elements were predicted with PLACE [21] and visualized with TBtools.

4.5. Upstream TF Regulation Network Analysis

To predict the upstream regulators of PtrSSLs, we utilized the PlantRegMap website (http://plantregmap.gao-lab.org/go.php, accessed on 14 April 2023) and obtained the expression information of upstream genes from transcriptome data (SRP267437). We calculated the Pearson correlation coefficients between upstream genes and PtrSSLs and screened significantly related gene pairs, using a threshold of p ≤ 0.05. Finally, we plotted networks, using Cytoscape v3.3.0 [44].

4.6. Plant Treatments

The Populus trichocarpa clone Nisqually-1 was used in this study [45]. The plantlets were planted in humus soil and grown under a 16/8 h day/night photoperiod at 25 °C in the greenhouse. The different tissue samples were collected from 90-day-old poplar seedlings for a gene-expression analysis. To conduct the drought treatment, 90-day-old plants grown in the same environment were selected, and the water was withheld for varying durations. Similarly, 90-day-old plants were chosen for salt treatment and treated with a 200 mM NaCl solution for different periods, ranging from 0 to 72 h. Additionally, 90-day-old plants were sprayed with Alternaria alternata spore suspension (1.0 × 10⁷ spores mL−1). The fungus was prepared as previously described [46,47,48]. The third-to-eighth functional leaves were harvested for RNA isolation. Plants treated with water were used as controls for all stress treatments. All samples had three biological replicates.

4.7. qRT-PCR Analysis

Total RNA was extracted using the Qiagen RNeasy Plant Mini Kit (QIAGEN, Hilden, Germany), and first-strand cDNA was synthesized using the PrimeScript™ RT reagent Kit with gDNA Eraser (TaKaRa, Beijing, China). Gene-expression patterns were identified using THUNDERBIRD® Next SYBR® qPCR Mix (TOYOBO, Osaka, Japan), and PtrActin was used as a reference gene for normalization. The 2−ΔΔCT method was employed to analyze the relative expression changes of genes [49]. All of the qPCR reactions were conducted with three replicates. Standard errors and standard deviations were calculated from three replicates.

5. Conclusions

In this study, we identified 13 SSL genes from poplar, and the phylogenetic analysis revealed that these genes could be divided into four subgroups. The structure analysis and motif analysis showed that the gene structure and motif species of each subgroup member were similar. The results of the collinearity analysis indicated that PtrSSLs had more collinear genes in the woody plants Salix purpurea and Eucalyptus grandis, suggesting that the genes may have diverged, with the differentiation of herbaceous and woody plants. The chromosomal localization results revealed that the thirteen PtrSSL genes were unevenly distributed on seven chromosomes and one scaffold. Our analysis of cis-elements in promoters indicated that the promoters of PtrSSLs contain a large number of biotic/abiotic-stress-response elements and that these genes are likely to be involved in biotic/abiotic-stress responses. The RT-qPCR results indicated that 10, 11, and 9 PtrSSLs were able to respond to salt, drought, and leaf-blight stresses, respectively. In addition, we screened for multiple TF regulators in the upstream of PtrSSLs, such as ATMYB46, ATMYB15, AGL20, STOP1, ATWRKY65, and so on, which may act as activators/repressors of PtrSSLs in the process of plant resistance. This study provides a theoretical basis for the functional study of SSLs.

Supplementary Materials

The supporting information can be downloaded at https://www.mdpi.com/article/10.3390/ijms241210117/s1.

Author Contributions

T.J. and H.L.: designed research, acquired funding, and developed methodology; R.W., W.Z. and Y.W.: conducted the experiments and analyzed the data; R.W. and W.Y.: wrote the manuscript and cultured the plant material. All authors have read and agreed to the published version of the manuscript.

Funding

This study was supported by the Major Project of Agricultural Biological Breeding (2022ZD0401504) and The Innovation Project of State Key Laboratory of Tree Genetics and Breeding (Northeast Forestry University) (2015A02).

Institutional Review Board Statement

Not applicable.

Informed Consent Statement

Not applicable.

Data Availability Statement

Not applicable.

Conflicts of Interest

The authors declare no conflict of interest.

References

  1. Sohani, M.M.; Schenk, P.M.; Schultz, C.J.; Schmidt, O. Phylogenetic and transcriptional analysis of a strictosidine synthase-like gene family in Arabidopsis thaliana reveals involvement in plant defence responses. Plant Biol. 2009, 11, 105–117. [Google Scholar] [CrossRef] [PubMed]
  2. Takahashi, F.; Kuromori, T.; Sato, H.; Shinozaki, K. Regulatory Gene Networks in Drought Stress Responses and Resistance in Plants. Adv. Exp. Med. Biol. 2018, 1081, 189–214. [Google Scholar] [CrossRef] [PubMed]
  3. Deinlein, U.; Stephan, A.B.; Horie, T.; Luo, W.; Xu, G.; Schroeder, J.I. Plant salt-tolerance mechanisms. Trends Plant Sci. 2014, 19, 371–379. [Google Scholar] [CrossRef] [PubMed] [Green Version]
  4. Bashir, K.; Matsui, A.; Rasheed, S.; Seki, M. Recent advances in the characterization of plant transcriptomes in response to drought, salinity, heat, and cold stress. F1000Research 2019, 8, 658. [Google Scholar] [CrossRef] [Green Version]
  5. Wei, H.; Movahedi, A.; Liu, G.; Li, Y.; Liu, S.; Yu, C.; Chen, Y.; Zhong, F.; Zhang, J. Comprehensive Analysis of Carotenoid Cleavage Dioxygenases Gene Family and Its Expression in Response to Abiotic Stress in Poplar. Int. J. Mol. Sci. 2022, 23, 1418. [Google Scholar] [CrossRef]
  6. Chai, W.; Si, W.; Ji, W.; Qin, Q.; Zhao, M.; Jiang, H. Genome-Wide Investigation and Expression Profiling of HD-Zip Transcription Factors in Foxtail Millet (Setaria italica L.). BioMed Res. Int. 2018, 2018, 8457614. [Google Scholar] [CrossRef] [Green Version]
  7. Tounsi, S.; Jemli, S.; Feki, K.; Brini, F.; Najib Saïdi, M. Superoxide dismutase (SOD) family in durum wheat: Promising candidates for improving crop resilience. Protoplasma 2023, 260, 145–158. [Google Scholar] [CrossRef]
  8. Zeng, D.; Dai, L.J.; Li, X.; Li, W.; Qu, G.Z.; Li, S. Genome-Wide Identification of the ERF Transcription Factor Family for Structure Analysis, Expression Pattern, and Response to Drought Stress in Populus alba × Populus glandulosa. Int. J. Mol. Sci. 2023, 24, 3697. [Google Scholar] [CrossRef]
  9. Liu, R.; Wu, M.; Liu, H.L.; Gao, Y.M.; Chen, J.; Yan, H.W.; Xiang, Y. Genome-wide identification and expression analysis of the NF-Y transcription factor family in Populus. Physiol. Plant. 2021, 171, 309–327. [Google Scholar] [CrossRef]
  10. Wang, Y.; Wang, R.; Yu, Y.; Gu, Y.; Wang, S.; Liao, S.; Xu, X.; Jiang, T.; Yao, W. Genome-Wide Analysis of SIMILAR TO RCD ONE (SRO) Family Revealed Their Roles in Abiotic Stress in Poplar. Int. J. Mol. Sci. 2023, 24, 4146. [Google Scholar] [CrossRef]
  11. Wang, R.; Wang, Y.; Gu, Y.; Yan, P.; Zhao, W.; Jiang, T. Genome-Wide Identification of miR169 Family in Response to ABA and Salt Stress in Poplar. Forests 2023, 14, 961. [Google Scholar] [CrossRef]
  12. Fabbri, M.; Delp, G.; Schmidt, O.; Theopold, U. Animal and plant members of a gene family with similarity to alkaloid-synthesizing enzymes. Biochem. Biophys. Res. Commun. 2000, 271, 191–196. [Google Scholar] [CrossRef]
  13. Kibble, N.A.J.; Sohani, M.M.; Shirley, N.; Byrt, C.; Roessner, U.; Bacic, A.; Schmidt, O.; Schultz, C.J. Phylogenetic analysis and functional characterisation of strictosidine synthase-like genes in Arabidopsis thaliana. Funct. Plant Biol. FPB 2010, 36, 1098–1109. [Google Scholar] [CrossRef]
  14. Ali, E.F.; El-Shehawi, A.M.; Ibrahim, O.H.M.; Abdul-Hafeez, E.Y.; Moussa, M.M.; Hassan, F.A.S. A vital role of chitosan nanoparticles in improvisation the drought stress tolerance in Catharanthus roseus (L.) through biochemical and gene expression modulation. Plant Physiol. Biochem. PPB 2021, 161, 166–175. [Google Scholar] [CrossRef]
  15. Chen, L.; Meng, J.; Luan, Y. miR1916 plays a role as a negative regulator in drought stress resistance in tomato and tobacco. Biochem. Biophys. Res. Commun 2019, 508, 597–602. [Google Scholar] [CrossRef]
  16. Liu, Y.; Yang, H.; Wen, F.; Bao, L.; Zhao, Z.; Zhong, Z. Chitooligosaccharide-induced plant stress resistance. Carbohydr. Polym. 2023, 302, 120344. [Google Scholar] [CrossRef]
  17. Smith, D.L.; Praslickova, D.; Ilangumaran, G. Inter-organismal signaling and management of the phytomicrobiome. Front. Plant Sci. 2015, 6, 722. [Google Scholar] [CrossRef] [Green Version]
  18. Tang, W.; Liu, X.; He, Y.; Yang, F. Enhancement of Vindoline and Catharanthine Accumulation, Antioxidant Enzymes Activities, and Gene Expression Levels in Catharanthus roseus Leaves by Chitooligosaccharides Elicitation. Mar. Drugs 2022, 20, 188. [Google Scholar] [CrossRef]
  19. Chen, L.; Meng, J.; He, X.L.; Zhang, M.; Luan, Y.S. Solanum lycopersicum microRNA1916 targets multiple target genes and negatively regulates the immune response in tomato. Plant Cell Environ. 2019, 42, 1393–1407. [Google Scholar] [CrossRef]
  20. Tuskan, G.A.; Difazio, S.; Jansson, S.; Bohlmann, J.; Grigoriev, I.; Hellsten, U.; Putnam, N.; Ralph, S.; Rombauts, S.; Salamov, A.; et al. The genome of black cottonwood, Populus trichocarpa (Torr. & Gray). Science 2006, 313, 1596–1604. [Google Scholar] [CrossRef] [Green Version]
  21. Higo, K.; Ugawa, Y.; Iwamoto, M.; Korenaga, T. Plant cis-acting regulatory DNA elements (PLACE) database: 1999. Nucleic Acids Res. 1999, 27, 297–300. [Google Scholar] [CrossRef] [Green Version]
  22. Bedi, S.; Sengupta, S.; Ray, A.; Nag Chaudhuri, R. ABI3 mediates dehydration stress recovery response in Arabidopsis thaliana by regulating expression of downstream genes. Plant Sci. 2016, 250, 125–140. [Google Scholar] [CrossRef] [PubMed]
  23. Wang, S.; Guo, T.; Shen, Y.; Wang, Z.; Kang, J.; Zhang, J.; Yi, F.; Yang, Q.; Long, R. Overexpression of MtRAV3 enhances osmotic and salt tolerance and inhibits growth of Medicago truncatula. Plant Physiol. Biochem. 2021, 163, 154–165. [Google Scholar] [CrossRef] [PubMed]
  24. Barrero-Gil, J.; Mouriz, A.; Piqueras, R.; Salinas, J.; Jarillo, J.A.; Piñeiro, M. A MRG-operated chromatin switch at SOC1 attenuates abiotic stress responses during the floral transition. Plant Physiol. 2021, 187, 462–471. [Google Scholar] [CrossRef] [PubMed]
  25. Yan, J.; Liu, Y.; Yang, L.; He, H.; Huang, Y.; Fang, L.; Scheller, H.V.; Jiang, M.; Zhang, A. Cell wall β-1,4-galactan regulated by the BPC1/BPC2-GALS1 module aggravates salt sensitivity in Arabidopsis thaliana. Mol. Plant 2021, 14, 411–425. [Google Scholar] [CrossRef]
  26. Luo, Y.; Bai, R.; Li, J.; Yang, W.; Li, R.; Wang, Q.; Zhao, G.; Duan, D. The transcription factor MYB15 is essential for basal immunity (PTI) in Chinese wild grape. Planta 2019, 249, 1889–1902. [Google Scholar] [CrossRef]
  27. Agarwal, M.; Hao, Y.; Kapoor, A.; Dong, C.H.; Fujii, H.; Zheng, X.; Zhu, J.K. A R2R3 type MYB transcription factor is involved in the cold regulation of CBF genes and in acquired freezing tolerance. J. Biol. Chem. 2006, 281, 37636–37645. [Google Scholar] [CrossRef] [Green Version]
  28. Ramírez, V.; Agorio, A.; Coego, A.; García-Andrade, J.; Hernández, M.J.; Balaguer, B.; Ouwerkerk, P.B.; Zarra, I.; Vera, P. MYB46 modulates disease susceptibility to Botrytis cinerea in Arabidopsis. Plant Physiol. 2011, 155, 1920–1935. [Google Scholar] [CrossRef] [Green Version]
  29. Chen, K.; Song, M.; Guo, Y.; Liu, L.; Xue, H.; Dai, H.; Zhang, Z. MdMYB46 could enhance salt and osmotic stress tolerance in apple by directly activating stress-responsive signals. Plant Biotechnol. J. 2019, 17, 2341–2355. [Google Scholar] [CrossRef] [Green Version]
  30. Guerrero-Sánchez, V.M.; López-Hidalgo, C.; Rey, M.D.; Castillejo, M.; Jorrín-Novo, J.V.; Escandón, M. Multiomic Data Integration in the Analysis of Drought-Responsive Mechanisms in Quercus ilex Seedlings. Plants 2022, 11, 3067. [Google Scholar] [CrossRef]
  31. Jaiswal, V.; Kakkar, M.; Kumari, P.; Zinta, G.; Gahlaut, V.; Kumar, S. Multifaceted roles of GRAS transcription factors in growth and stress responses in plants. iScience 2022, 25, 105026. [Google Scholar] [CrossRef]
  32. Khan, Y.; Xiong, Z.; Zhang, H.; Liu, S.; Yaseen, T.; Hui, T. Expression and roles of GRAS gene family in plant growth, signal transduction, biotic and abiotic stress resistance and symbiosis formation—A review. Plant Biol. 2022, 24, 404–416. [Google Scholar] [CrossRef]
  33. Sadhukhan, A.; Kobayashi, Y.; Iuchi, S.; Koyama, H. Synergistic and antagonistic pleiotropy of STOP1 in stress tolerance. Trends Plant Sci 2021, 26, 1014–1022. [Google Scholar] [CrossRef]
  34. Qin, L.; Sun, L.; Wei, L.; Yuan, J.; Kong, F.; Zhang, Y.; Miao, X.; Xia, G.; Liu, S. Maize SRO1e represses anthocyanin synthesis through regulating the MBW complex in response to abiotic stress. Plant J. Cell Mol. Biol. 2021, 105, 1010–1025. [Google Scholar] [CrossRef]
  35. Cannon, S.B.; Mitra, A.; Baumgarten, A.; Young, N.D.; May, G. The roles of segmental and tandem gene duplication in the evolution of large gene families in Arabidopsis thaliana. BMC Plant Biol. 2004, 4, 10. [Google Scholar] [CrossRef] [Green Version]
  36. Hamel, L.P.; Sheen, J.; Séguin, A. Ancient signals: Comparative genomics of green plant CDPKs. Trends Plant Sci. 2014, 19, 79–89. [Google Scholar] [CrossRef] [Green Version]
  37. Hu, W.; Criscione, F.; Liang, S.; Tu, Z. MicroRNAs of two medically important mosquito species: Aedes aegypti and Anopheles stephensi. Insect Mol. Biol. 2015, 24, 240–252. [Google Scholar] [CrossRef] [Green Version]
  38. Potter, S.C.; Luciani, A.; Eddy, S.R.; Park, Y.; Lopez, R.; Finn, R.D. HMMER web server: 2018 update. Nucleic Acids Res. 2018, 46, W200–W204. [Google Scholar] [CrossRef] [Green Version]
  39. Kumar, S.; Stecher, G.; Li, M.; Knyaz, C.; Tamura, K. MEGA X: Molecular Evolutionary Genetics Analysis across Computing Platforms. Mol. Biol. Evol. 2018, 35, 1547–1549. [Google Scholar] [CrossRef]
  40. Kumar, S.; Stecher, G.; Tamura, K. MEGA7: Molecular Evolutionary Genetics Analysis Version 7.0 for Bigger Datasets. Mol. Biol. Evol. 2016, 33, 1870–1874. [Google Scholar] [CrossRef] [Green Version]
  41. Bailey, T.L.; Boden, M.; Buske, F.A.; Frith, M.; Grant, C.E.; Clementi, L.; Ren, J.; Li, W.W.; Noble, W.S. MEME SUITE: Tools for motif discovery and searching. Nucleic Acids Res. 2009, 37, W202–W208. [Google Scholar] [CrossRef] [PubMed]
  42. Chen, C.; Chen, H.; Zhang, Y.; Thomas, H.R.; Frank, M.H.; He, Y.; Xia, R. TBtools: An Integrative Toolkit Developed for Interactive Analyses of Big Biological Data. Mol. Plant 2020, 13, 1194–1202. [Google Scholar] [CrossRef] [PubMed]
  43. Wang, Y.; Tang, H.; Debarry, J.D.; Tan, X.; Li, J.; Wang, X.; Lee, T.H.; Jin, H.; Marler, B.; Guo, H.; et al. MCScanX: A toolkit for detection and evolutionary analysis of gene synteny and collinearity. Nucleic Acids Res. 2012, 40, e49. [Google Scholar] [CrossRef] [PubMed] [Green Version]
  44. Shannon, P.; Markiel, A.; Ozier, O.; Baliga, N.S.; Wang, J.T.; Ramage, D.; Amin, N.; Schwikowski, B.; Ideker, T. Cytoscape: A software environment for integrated models of biomolecular interaction networks. Genome Res. 2003, 13, 2498–2504. [Google Scholar] [CrossRef]
  45. Li, S.; Zhen, C.; Xu, W.; Wang, C.; Cheng, Y. Simple, rapid and efficient transformation of genotype Nisqually-1: A basic tool for the first sequenced model tree. Sci. Rep. 2017, 7, 2638. [Google Scholar] [CrossRef] [Green Version]
  46. Nemsa, I.; Hernández, M.A.; Lacasa, A.; Porras, I.; García-Lidón, A.; Cifuentes, D.; Bouzid, S.; Ortuño, A.; Del Río, J.A. Pathogenicity of Alternaria alternata on fruits and leaves of ‘Fortune’ mandarin (Citrus clementina × Citrus tangerina). Can. J. Plant Pathol. 2012, 34, 195–202. [Google Scholar] [CrossRef]
  47. Zhao, H.; Wang, S.; Chen, S.; Jiang, J.; Liu, G. Phylogenetic and stress-responsive expression analysis of 20 WRKY genes in Populus simonii × Populus nigra. Gene 2015, 565, 130–139. [Google Scholar] [CrossRef]
  48. Egusa, M.; Miwa, T.; Kaminaka, H.; Takano, Y.; Kodama, M. Nonhost resistance of Arabidopsis thaliana against Alternaria alternata involves both pre- and postinvasive defenses but is collapsed by AAL-toxin in the absence of LOH2. Phytopathology 2013, 103, 733–740. [Google Scholar] [CrossRef] [Green Version]
  49. Livak, K.J.; Schmittgen, T.D. Analysis of relative gene expression data using real-time quantitative PCR and the 2−ΔΔCT Method. Methods 2001, 25, 402–408. [Google Scholar] [CrossRef]
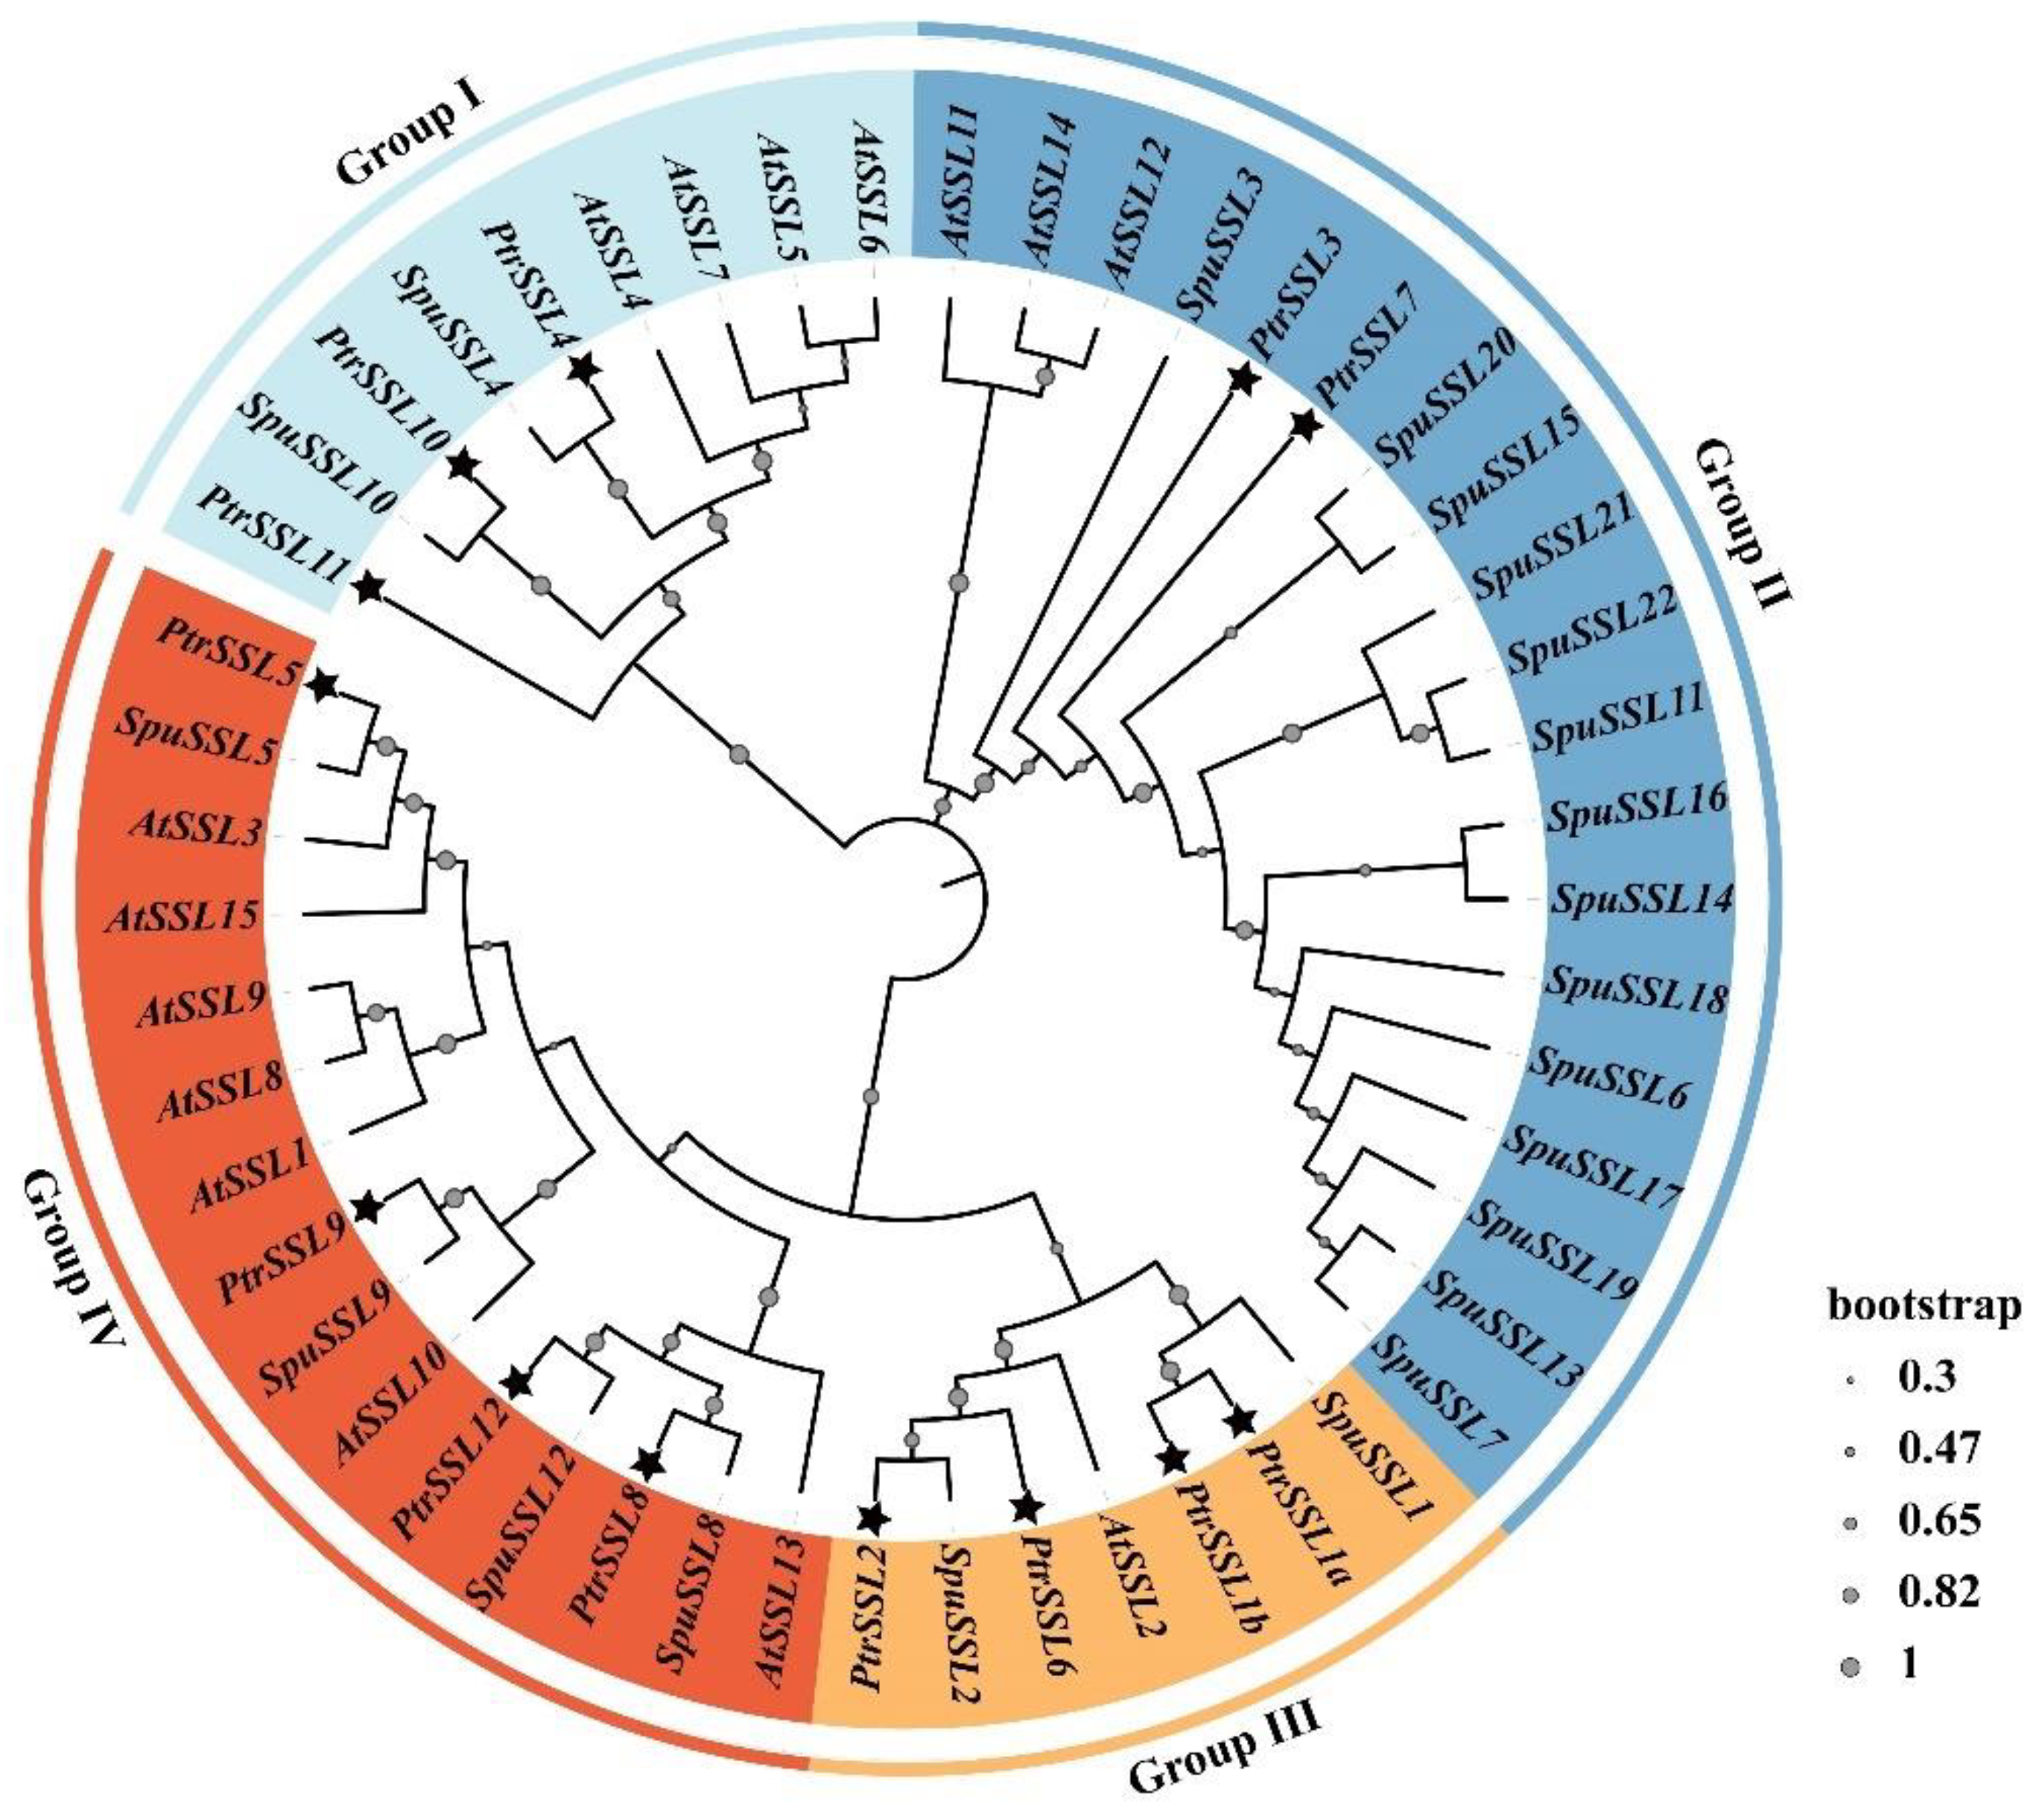
Figure 1. Phylogenetic analysis of SSLs in Populus trichocarpa (Ptr), Arabidopsis thaliana (At), and Salix purpurea (Sup). Neighbor-joining (NJ) method with 10,000 bootstrap replicates was applied to draw a phylogenetic tree by MEGA7 software. The tree was divided into four groups; each color represents one group. Black stars indicate PtrSSLs.
Ijms 24 10117 g001
Figure 2. Gene structure and protein motif of the SSL gene family in poplar. Colorful boxes delineate different motifs. The clustering was performed according to the phylogenetic analysis.
Ijms 24 10117 g002
Figure 3. Chromosomal localization and collinearity analysis of the PtrSSL family in poplar. Heatmap in the outer circles indicate gene density on chromosomes, with red and gray lines indicating duplication gene pairs of PtrSSLs and collinear gene pairs in the poplar genome, respectively.
Ijms 24 10117 g003
Figure 4. Collinearity analysis of the SSL genes from poplar and five other species. The SSL collinear genes are connected with a red line, while other collinear genes are connected with gray line.
Ijms 24 10117 g004
Figure 5. Cis-elements analysis of poplar SSL genes promoters. Different colors represent different genes. The element counts are shown in Supplementary Table S3.
Ijms 24 10117 g005
Figure 6. The expression patterns of PtrSSLs in roots, stems, and leaves. PtrActin was used as a reference gene. The expression of genes in root was set to 1. The data were processed using the 2−ΔΔCt method.
Ijms 24 10117 g006
Figure 7. Transcriptional regulatory networks involving PtrSSLs. Pink nodes represent PtrSSLs, and green nodes represent potential regulators of PtrSSLs upstream.
Ijms 24 10117 g007
Figure 8. Expression patterns of PtrSSLs in response to NaCl. X-axis shows stress treatment time points, and Y-axis represents the relative expression level. The data were processed using the 2−ΔΔCt method. Gene expression in 0 h was set to 1, and expression in the other time points was relative to it; t-test, * p < 0.05, and ** p < 0.01.
Ijms 24 10117 g008
Figure 9. Expression patterns of PtrSSLs in response to drought. X-axis shows stress treatment time points, and Y-axis represents the relative expression level. The data were processed using the 2−ΔΔCt method. Gene expression in 0 h was set to 1, and expression in the other time points was relative to it; t-test, * p < 0.05, and ** p < 0.01.
Ijms 24 10117 g009
Figure 10. Expression patterns of PtrSSLs in response to leaf blight (Alternaria alternata). X-axis shows stress treatment time points, and Y-axis represents the relative expression level. The data were processed using the 2−ΔΔCt method. Gene expression in 0 h was set to 1, and expression in the other time points was relative to it; t-test, * p < 0.05, and ** p < 0.01.
Ijms 24 10117 g010
Table 1. Basic information of SSL genes identified.
Gene IDSymbolLengthMolecular WeightTheoretical pIAliphatic
Index
GRAVY
Populus
trichocarpa
Potri.T015518PtrSSL1b35739,445.267.4989.52−0.015
Potri.017G027600PtrSSL1240945,895.726.1586.63−0.238
Potri.016G037900PtrSSL937741,011.227.0996.4−0.032
Potri.016G037800PtrSSL119810,878.465.5102.650.019
Potri.016G037700PtrSSL641045,566.977.1287.29−0.162
Potri.015G037700PtrSSL733536,270.259.1491.370.018
Potri.012G046200PtrSSL331534,126.719.486.10.037
Potri.008G109966PtrSSL1a35739,445.267.4989.52−0.015
Potri.007G130700PtrSSL840645,861.896.6889.26−0.193
Potri.006G140500PtrSSL1036540,733.895.7396.93−0.044
Potri.006G040900PtrSSL238842,747.899.3890.49−0.172
Potri.005G099400PtrSSL457062,550.886.1197.3−0.015
Potri.001G214500PtrSSL539143,983.396.4884.5−0.267
Arabidopsis
thaliana
AT5G22020AtSSL1539544,527.856.5286.08−0.159
AT3G59530AtSSL1340345,628.546.4184.86−0.227
AT3G57030AtSSL1037441,001.167.7195.670.009
AT3G57020AtSSL937041,457.86.5688.19−0.189
AT3G57010AtSSL837641,980.075.7883.62−0.164
AT3G51450AtSSL737141,124.395.4104.290.07
AT3G51440AtSSL637141,383.495.8396.680.011
AT3G51430AtSSL537141,641.96.295.36−0.02
AT3G51420AtSSL437041,595.675.6596.160.054
AT2G41300AtSSL139444,391.426.2175.2−0.403
AT2G41290AtSSL237641,475.266.283.96−0.145
AT1G74020AtSSL1233535,293.135.686.120.07
AT1G74010AtSSL1432534,184.18.2786.980.155
AT1G74000AtSSL1132934,666.89.6683.220.024
AT1G08470AtSSL339044,036.558.1184.95−0.239
Salix
purpurea
Sapur.T191900SpuSSL630433,213.888.9893.980.118
Sapur.T191200SpuSSL732434,854.577.5891.20.151
Sapur.T190300SpuSSL1126228,228.926.5894.160.029
Sapur.15ZG033100SpuSSL1332434,902.617.58900.148
Sapur.15WG054500SpuSSL1432435,060.816.3490.590.141
Sapur.15WG054100SpuSSL1528631,575.39.1696.430.173
Sapur.15WG052000SpuSSL1632434,932.647.58900.135
Sapur.15WG051300SpuSSL1728830,907.067.5887.050.115
Sapur.15WG051000SpuSSL1833536,203.248.6291.430.139
Sapur.15WG050600SpuSSL316217,593.194.6988.020.349
Sapur.15WG050400SpuSSL1932434,978.717.58900.158
Sapur.15WG050300SpuSSL2020022,144.369.894.65−0.148
Sapur.15WG049100SpuSSL2126228,296.158.7696.760.061
Sapur.15WG048500SpuSSL2227129,352.26.5893.540.029
Sapur.017G016600SpuSSL1240646,029.866.3386.13−0.234
Sapur.016G034000SpuSSL937440,947.066.5297.46−0.034
Sapur.008G088100SpuSSL135739,231.865.6393.89−0.023
Sapur.007G116200SpuSSL840645,795.786.6590.44−0.166
Sapur.006G115900SpuSSL1023926,500.285.0591.38−0.055
Sapur.006G030000SpuSSL234037,236.238.1680.65−0.222
Sapur.005G078900SpuSSL440945,329.695.7294.38−0.128
Sapur.004G165500SpuSSL539143,758.236.5685.5−0.204
Table 2. The Ka/Ks ratios of duplication for PtrSSLs.
Duplicated Gene PairsKaKsKa/KsThe Length of Homologous Fragment (bp)Homology/%Duplication Date (MYA)
PtrSSL1a-PtrSSL1b00010741000
PtrSSL2-PtrSSL60.098420.3467210.283861123386.9311.55735
PtrSSL3-PtrSSL70.1872720.4813730.389037100880.6516.04577
PtrSSL8-PtrSSL120.0327320.2659840.123062122192.388.866147
Disclaimer/Publisher’s Note: The statements, opinions and data contained in all publications are solely those of the individual author(s) and contributor(s) and not of MDPI and/or the editor(s). MDPI and/or the editor(s) disclaim responsibility for any injury to people or property resulting from any ideas, methods, instructions or products referred to in the content.