
Transcriptional Modulation Reveals Physiological Responses to Temperature Adaptation in Acrossocheilus fasciatus
Abstract
:1. Introduction
2. Results
2.1. Evaluation of Transcriptome Data
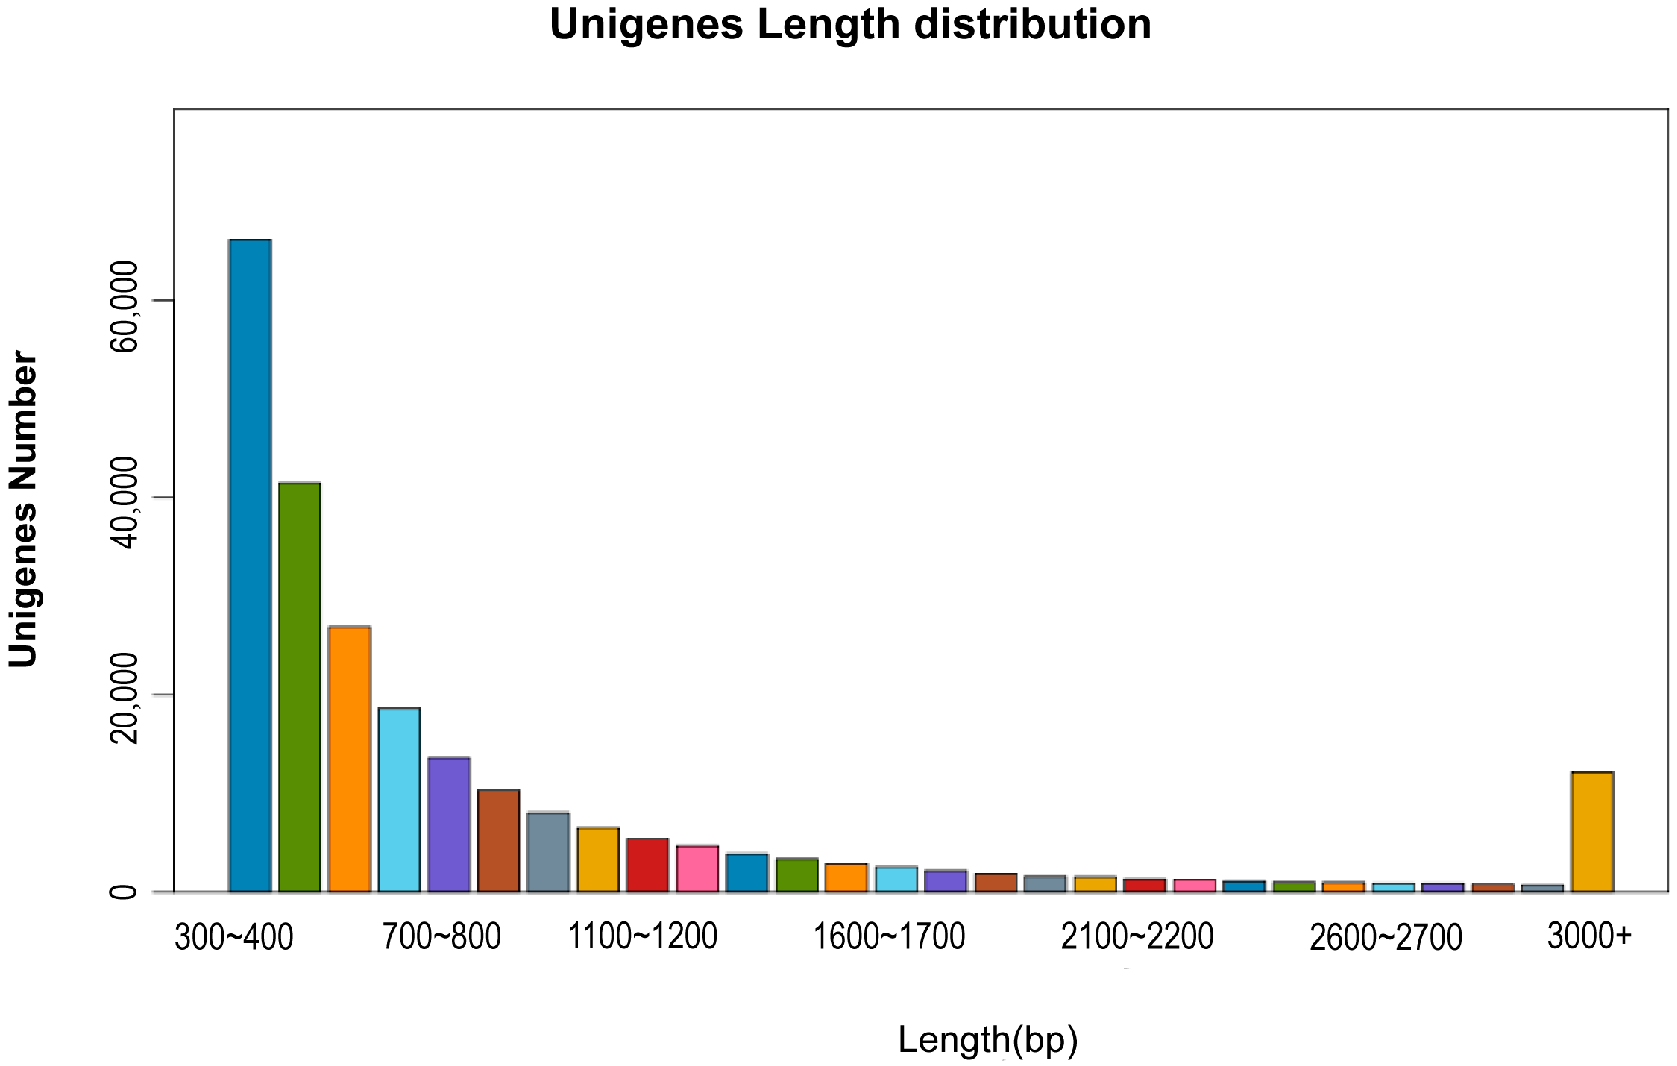
2.2. Functional Annotation of Unigene
2.3. Differential Gene Expression and Clustering Analysis
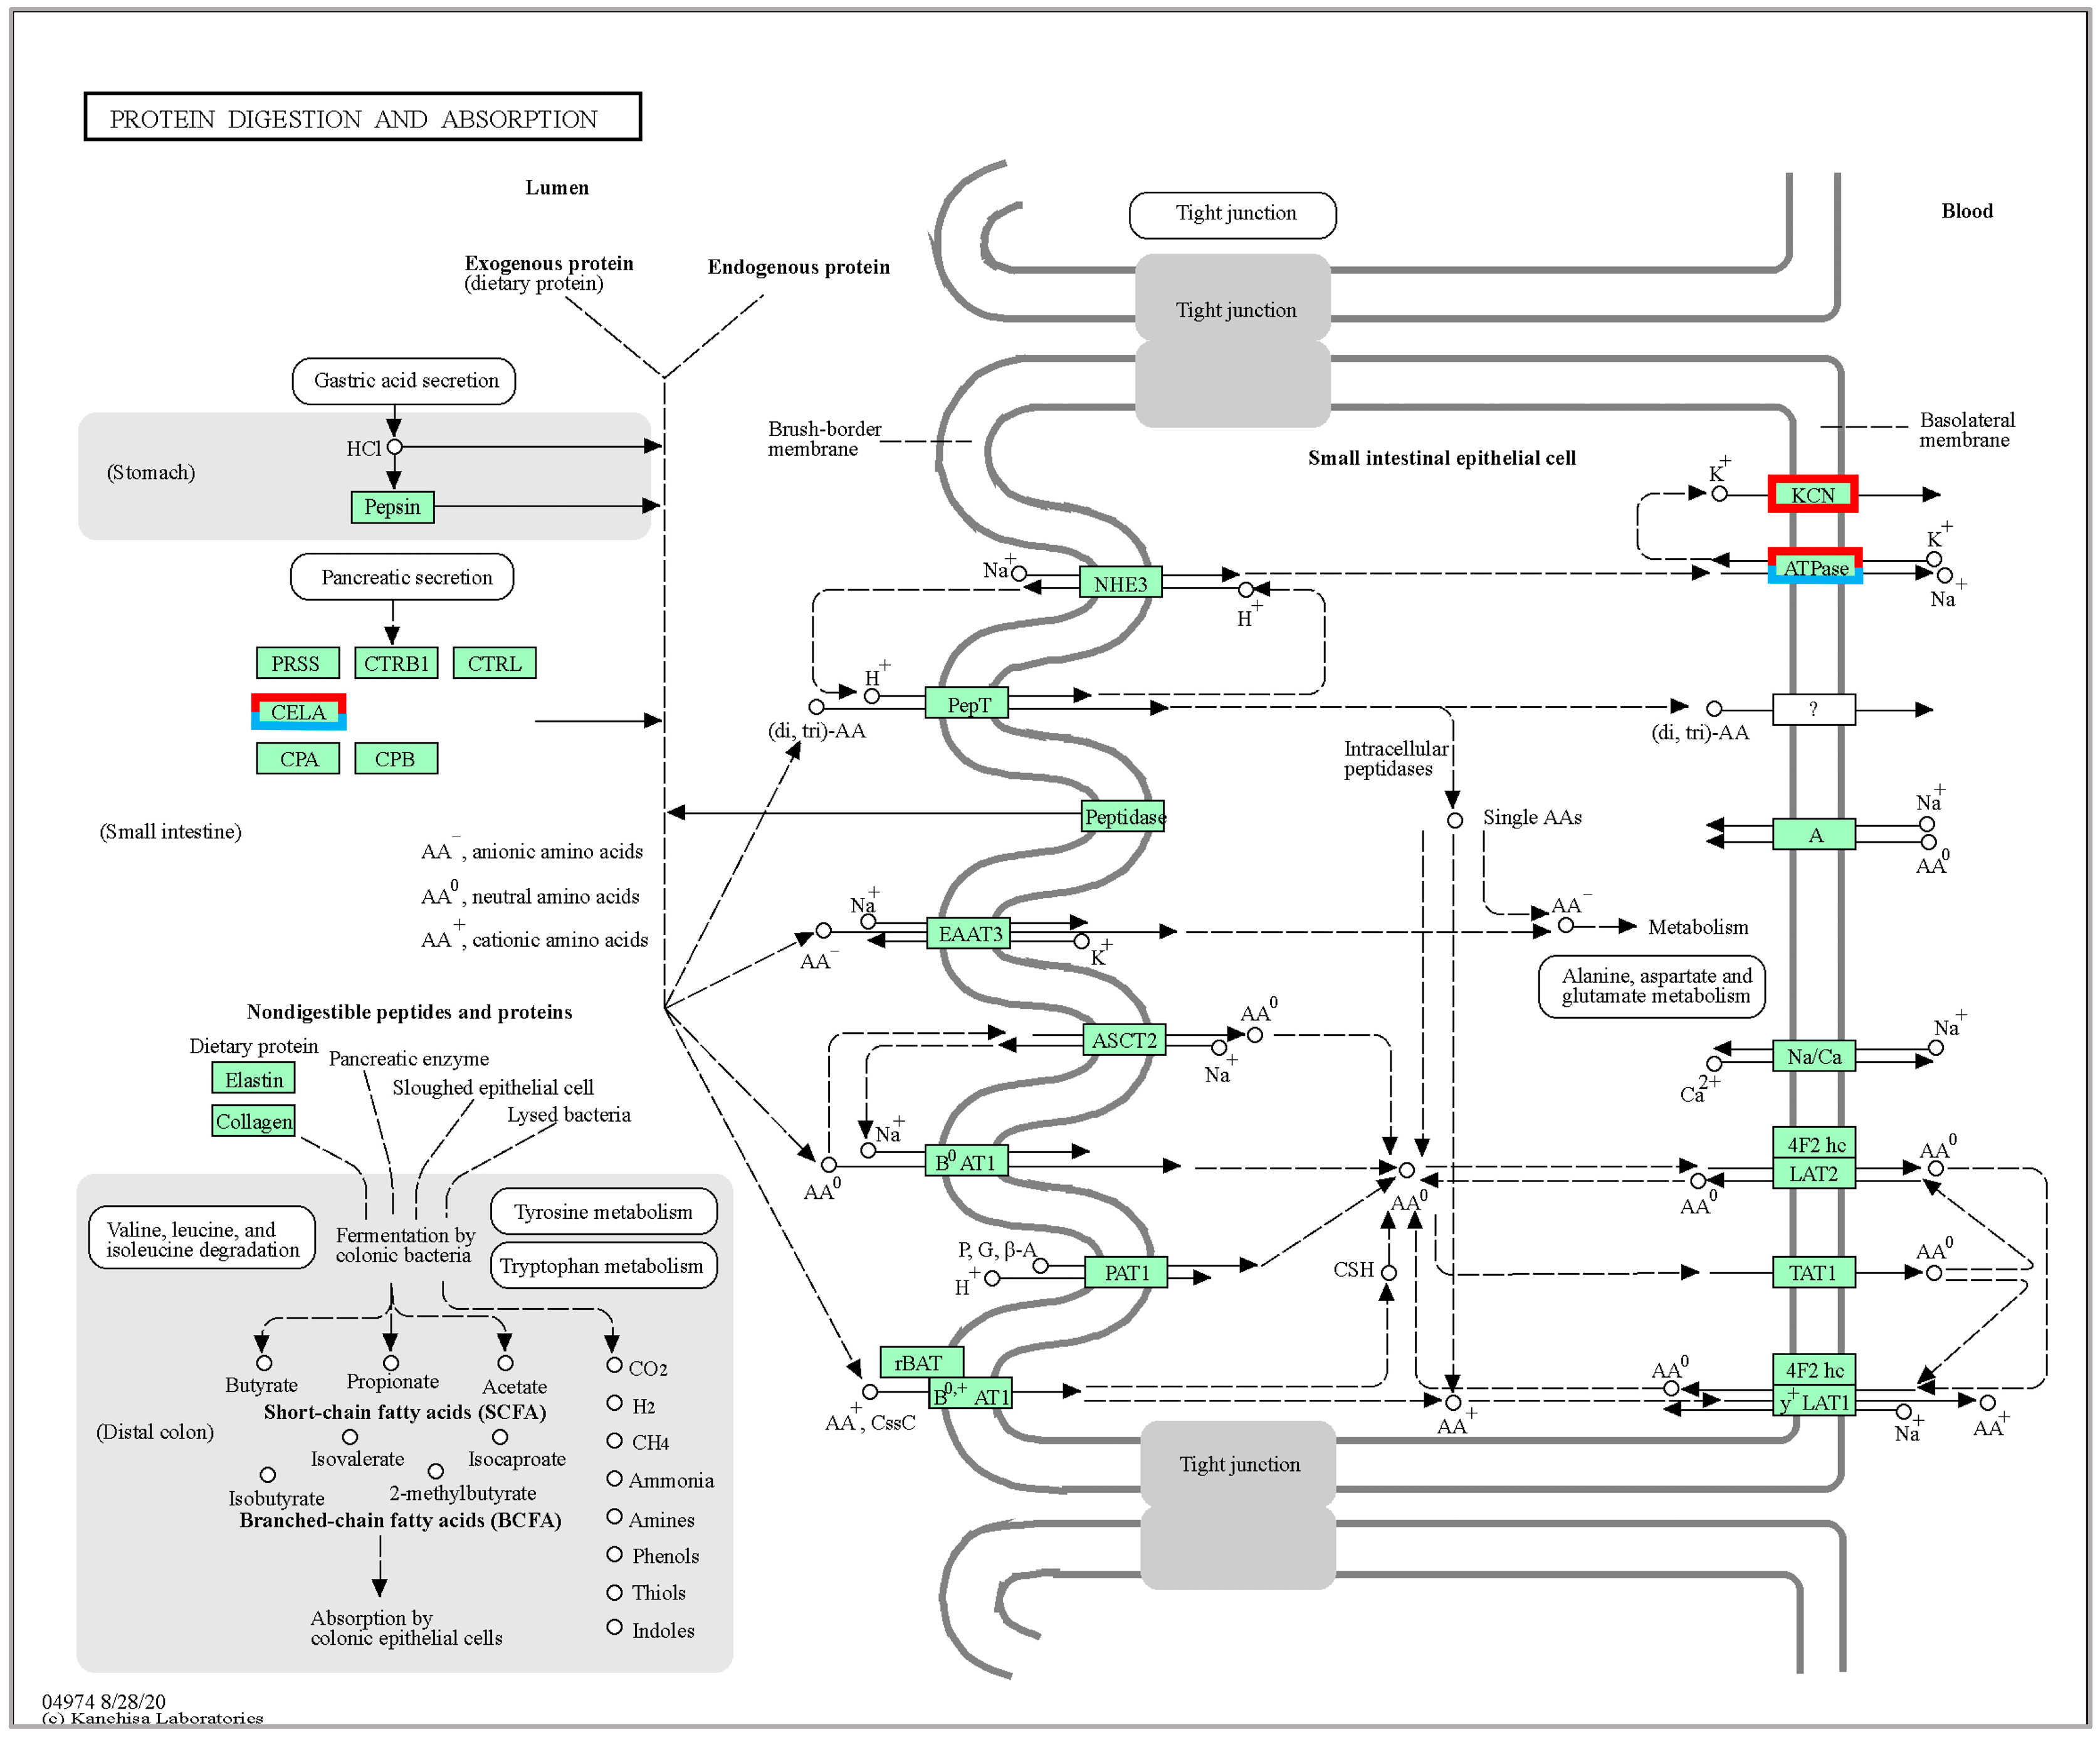
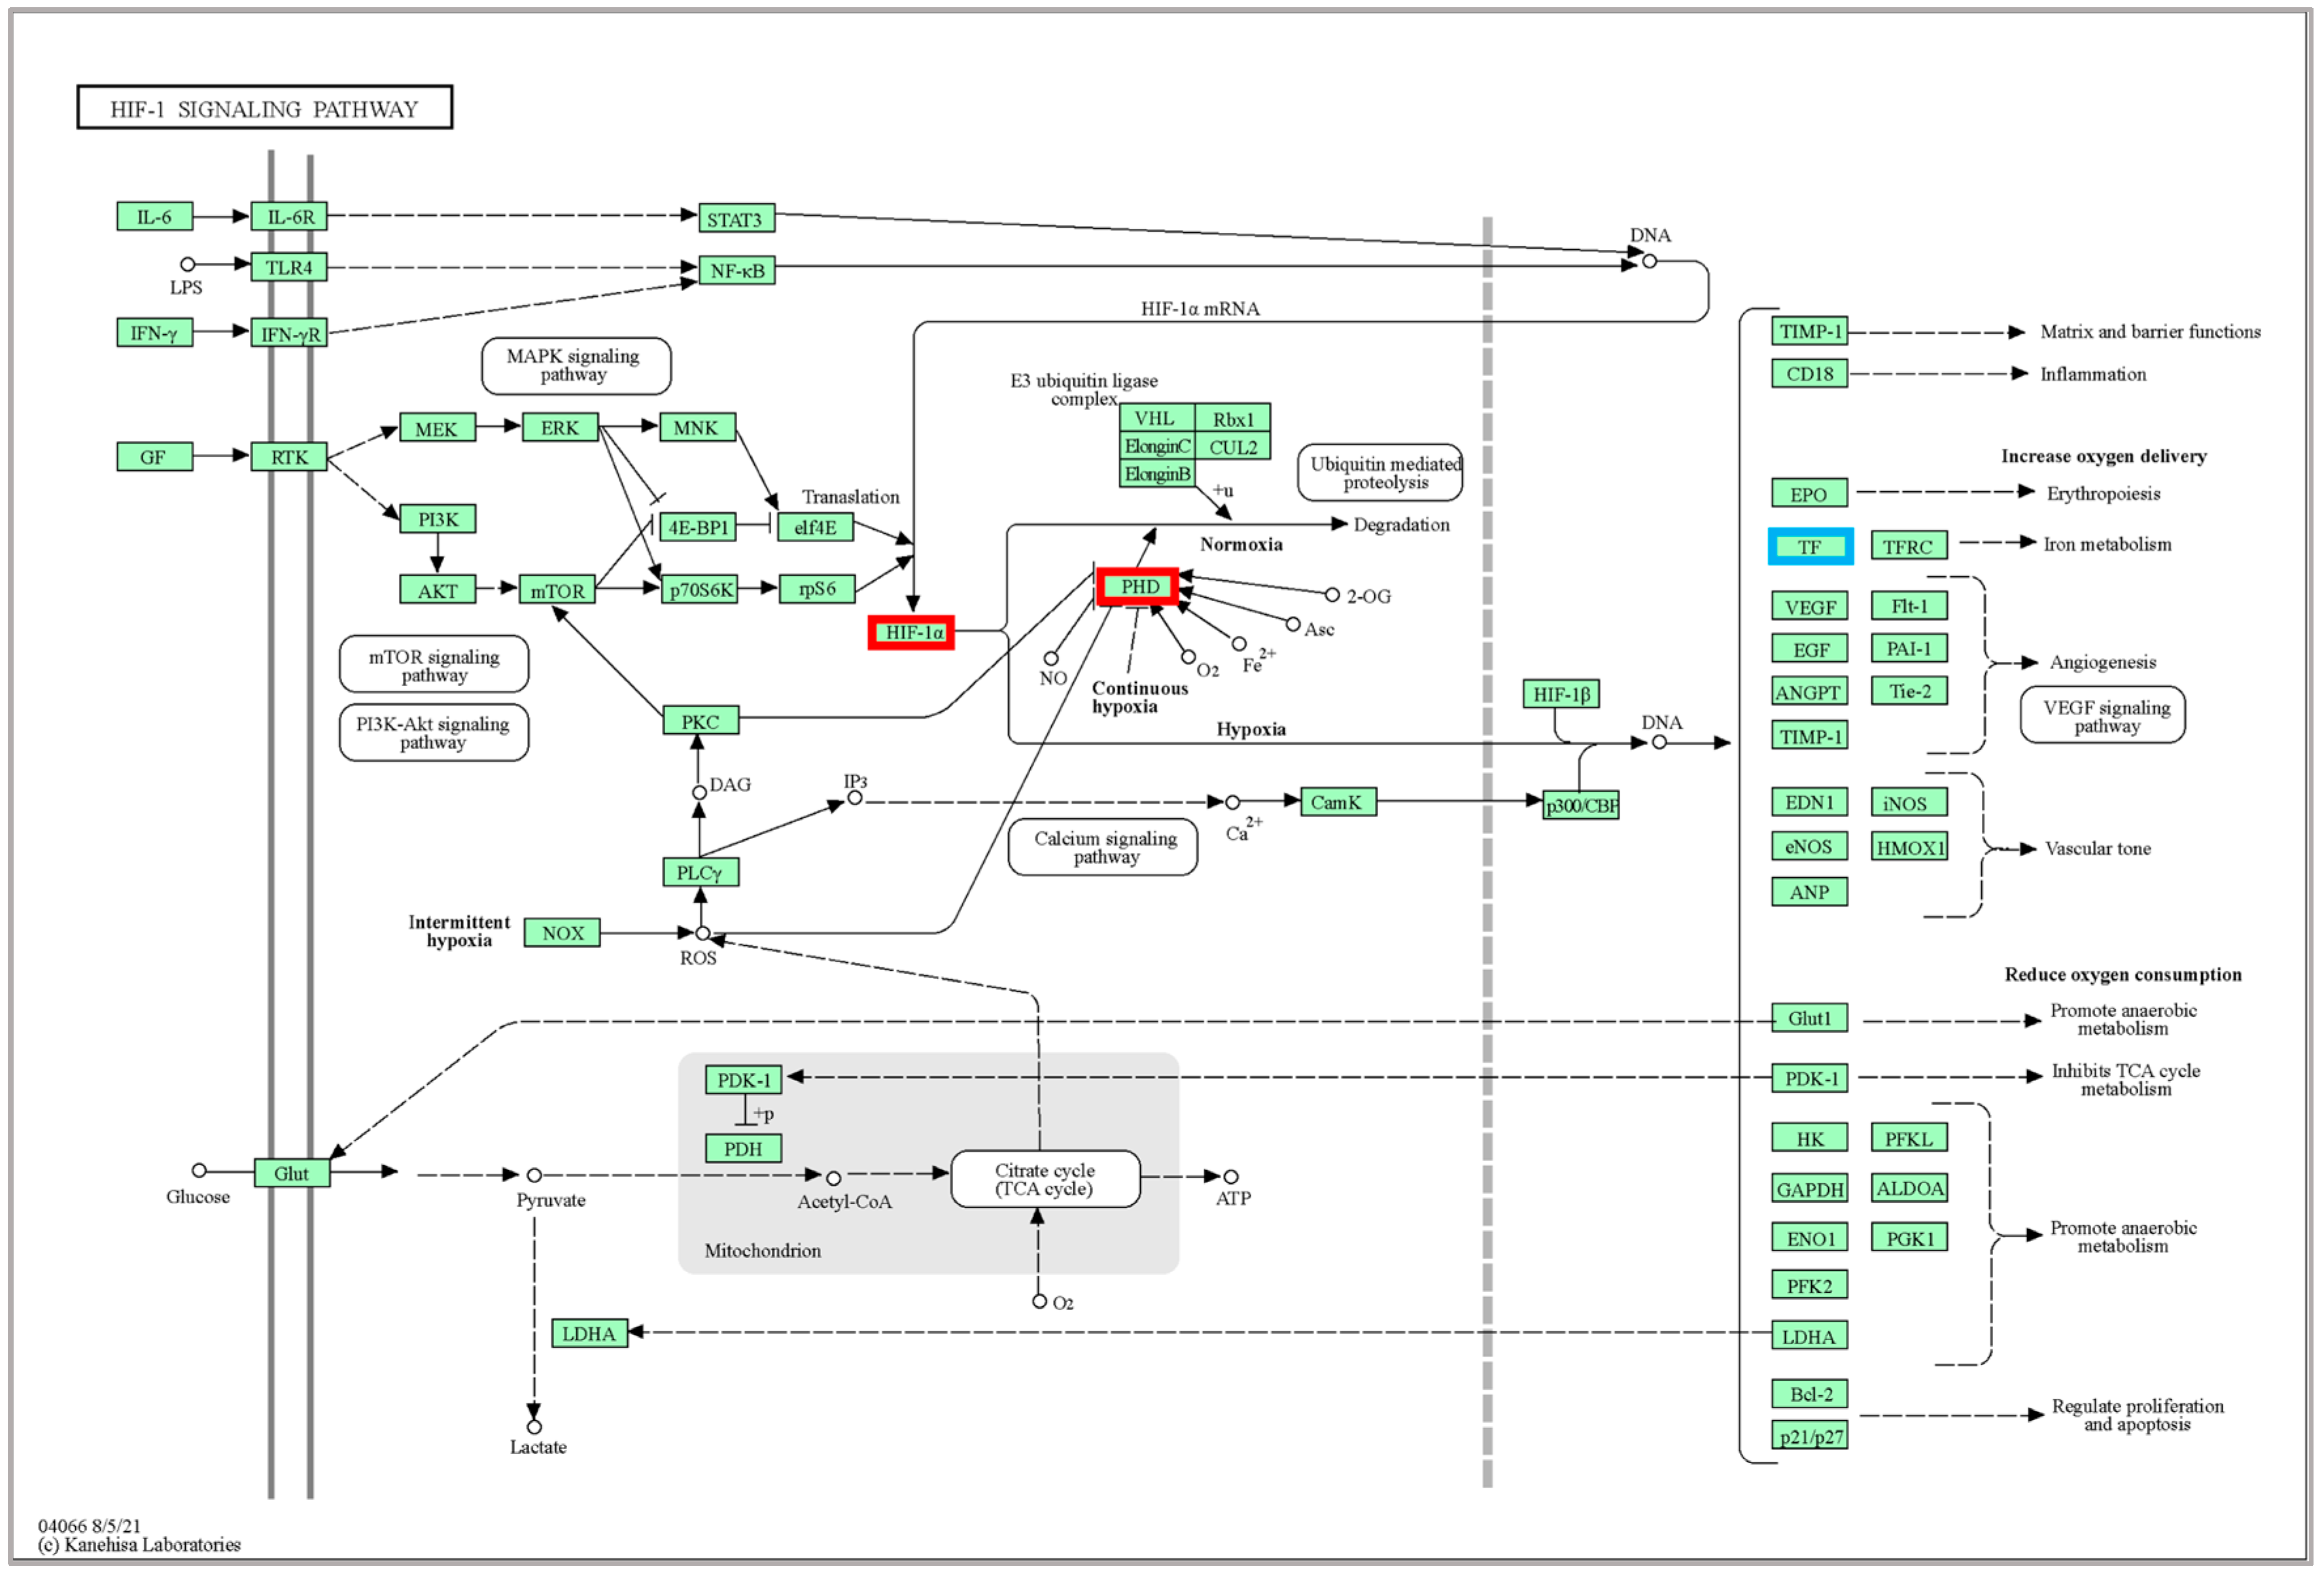
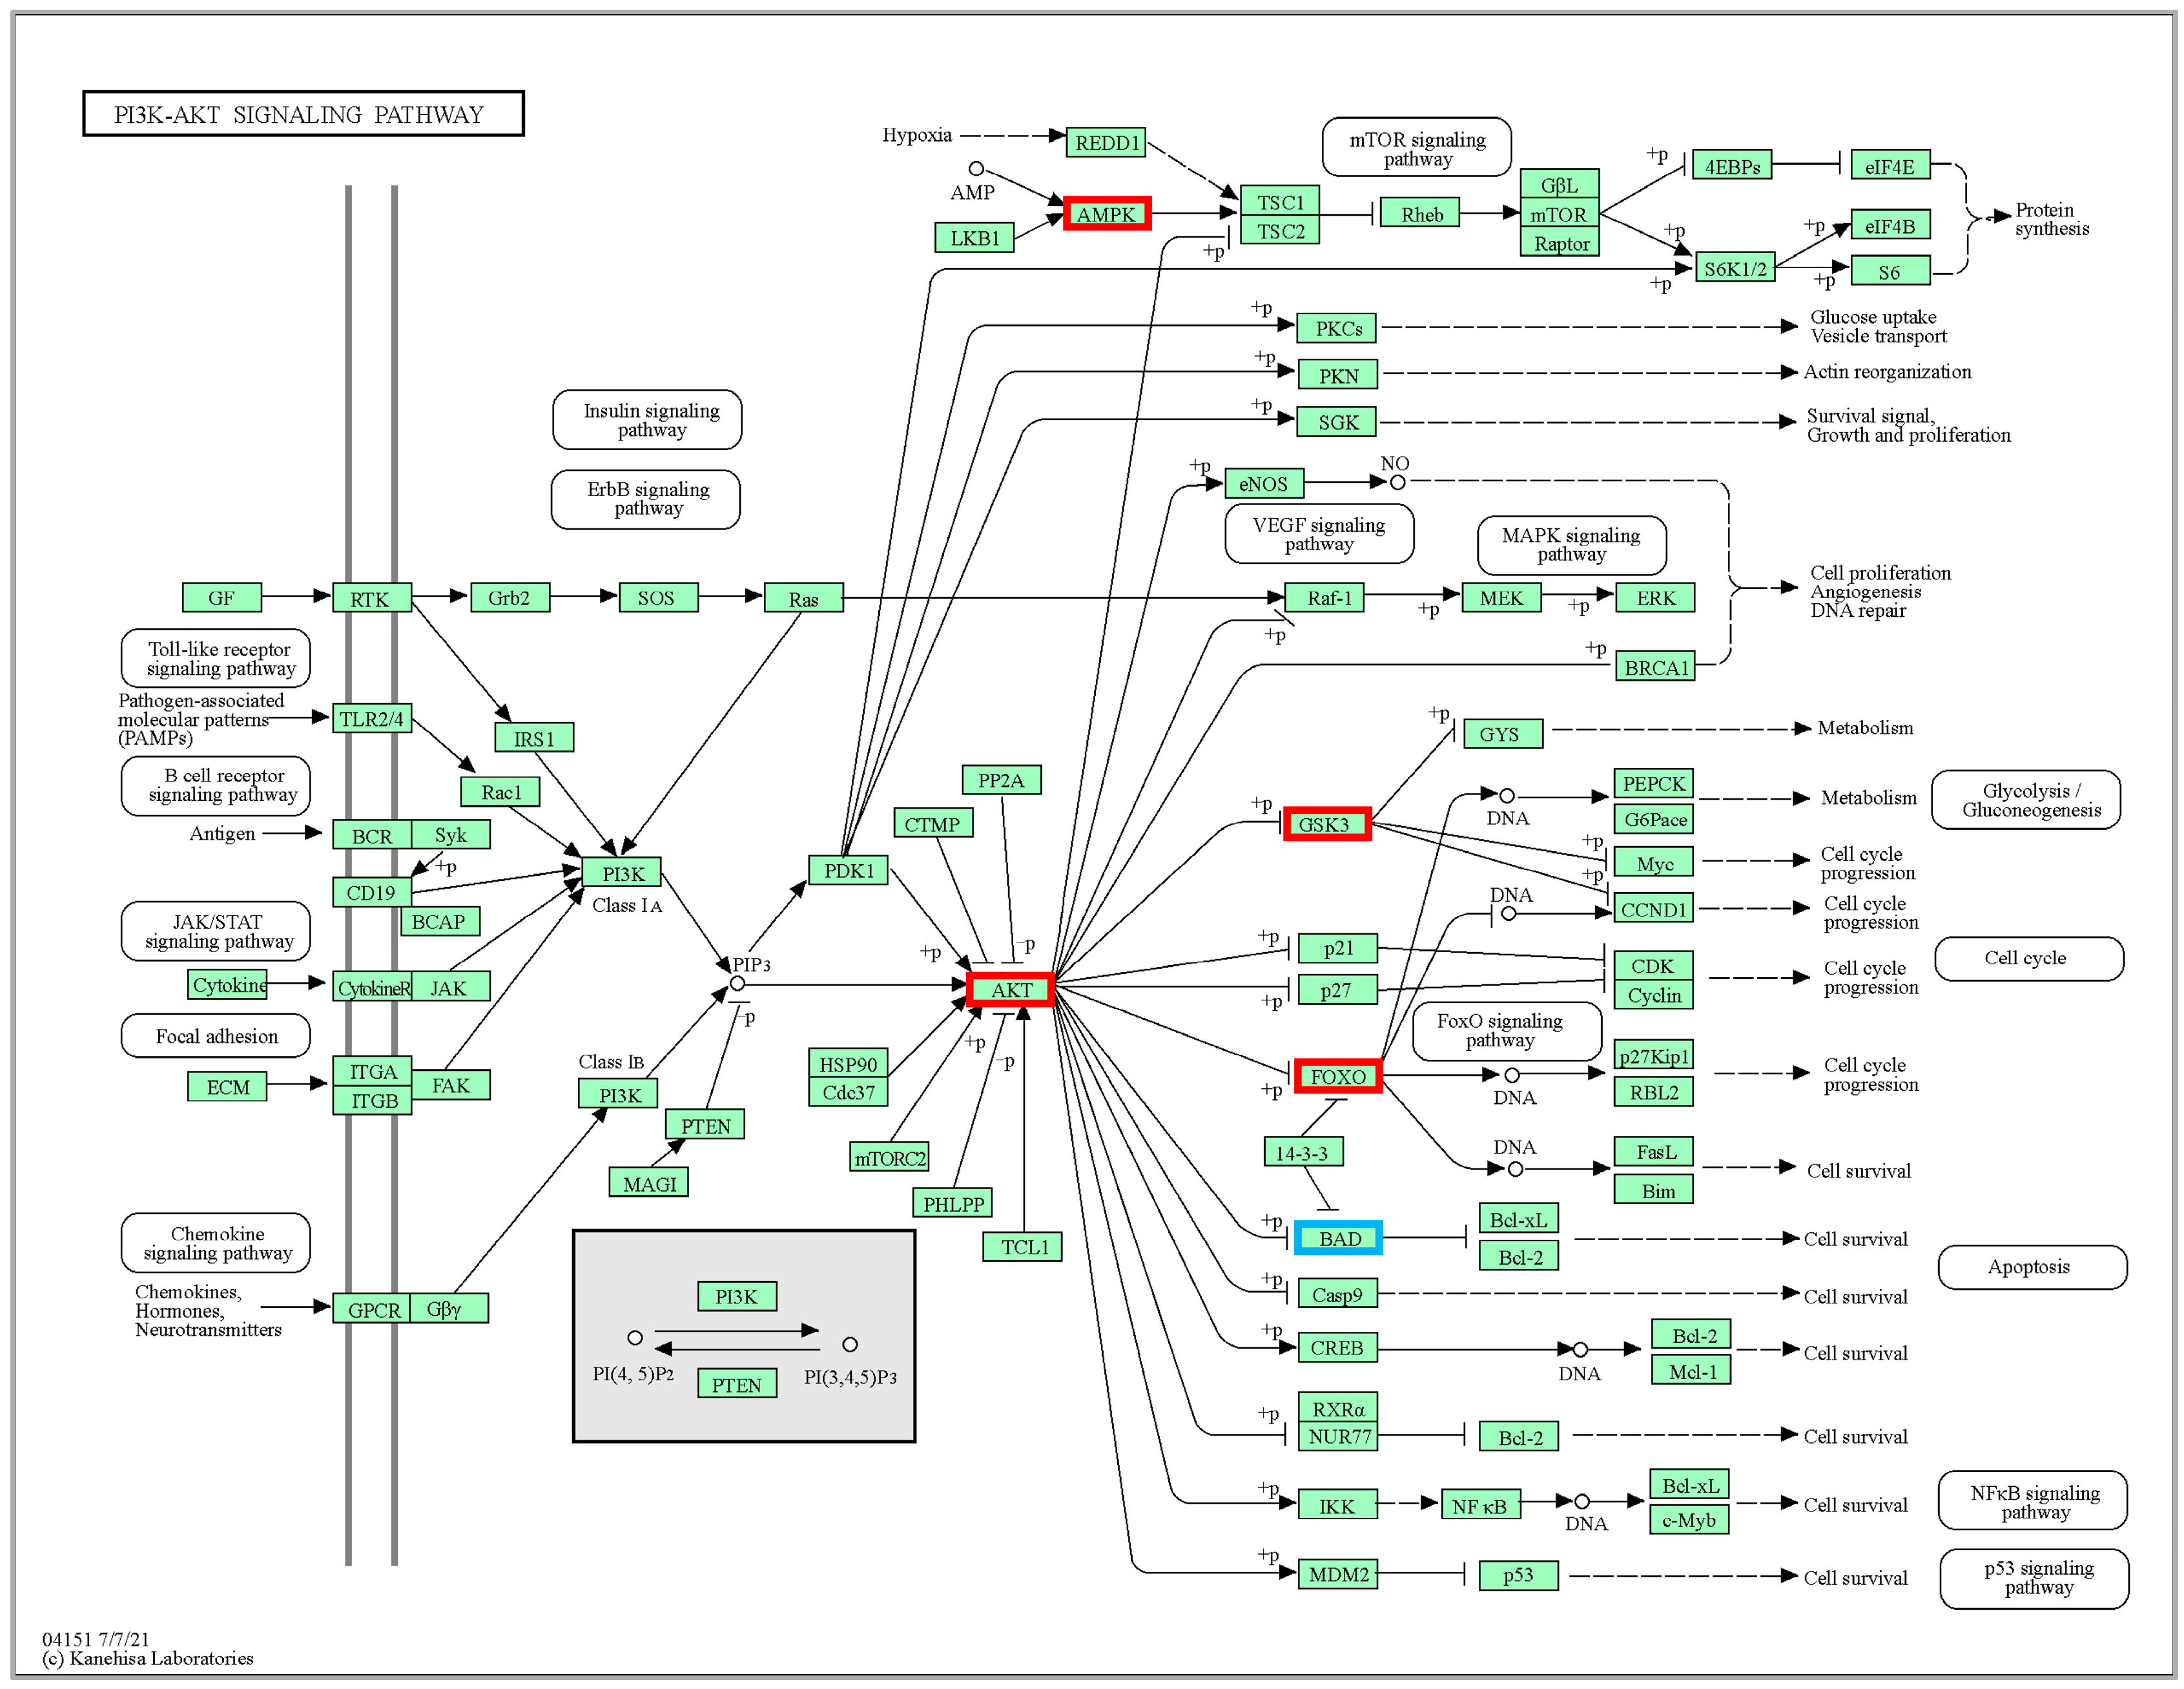
2.4. KEGG Pathway Enrichment Analyses
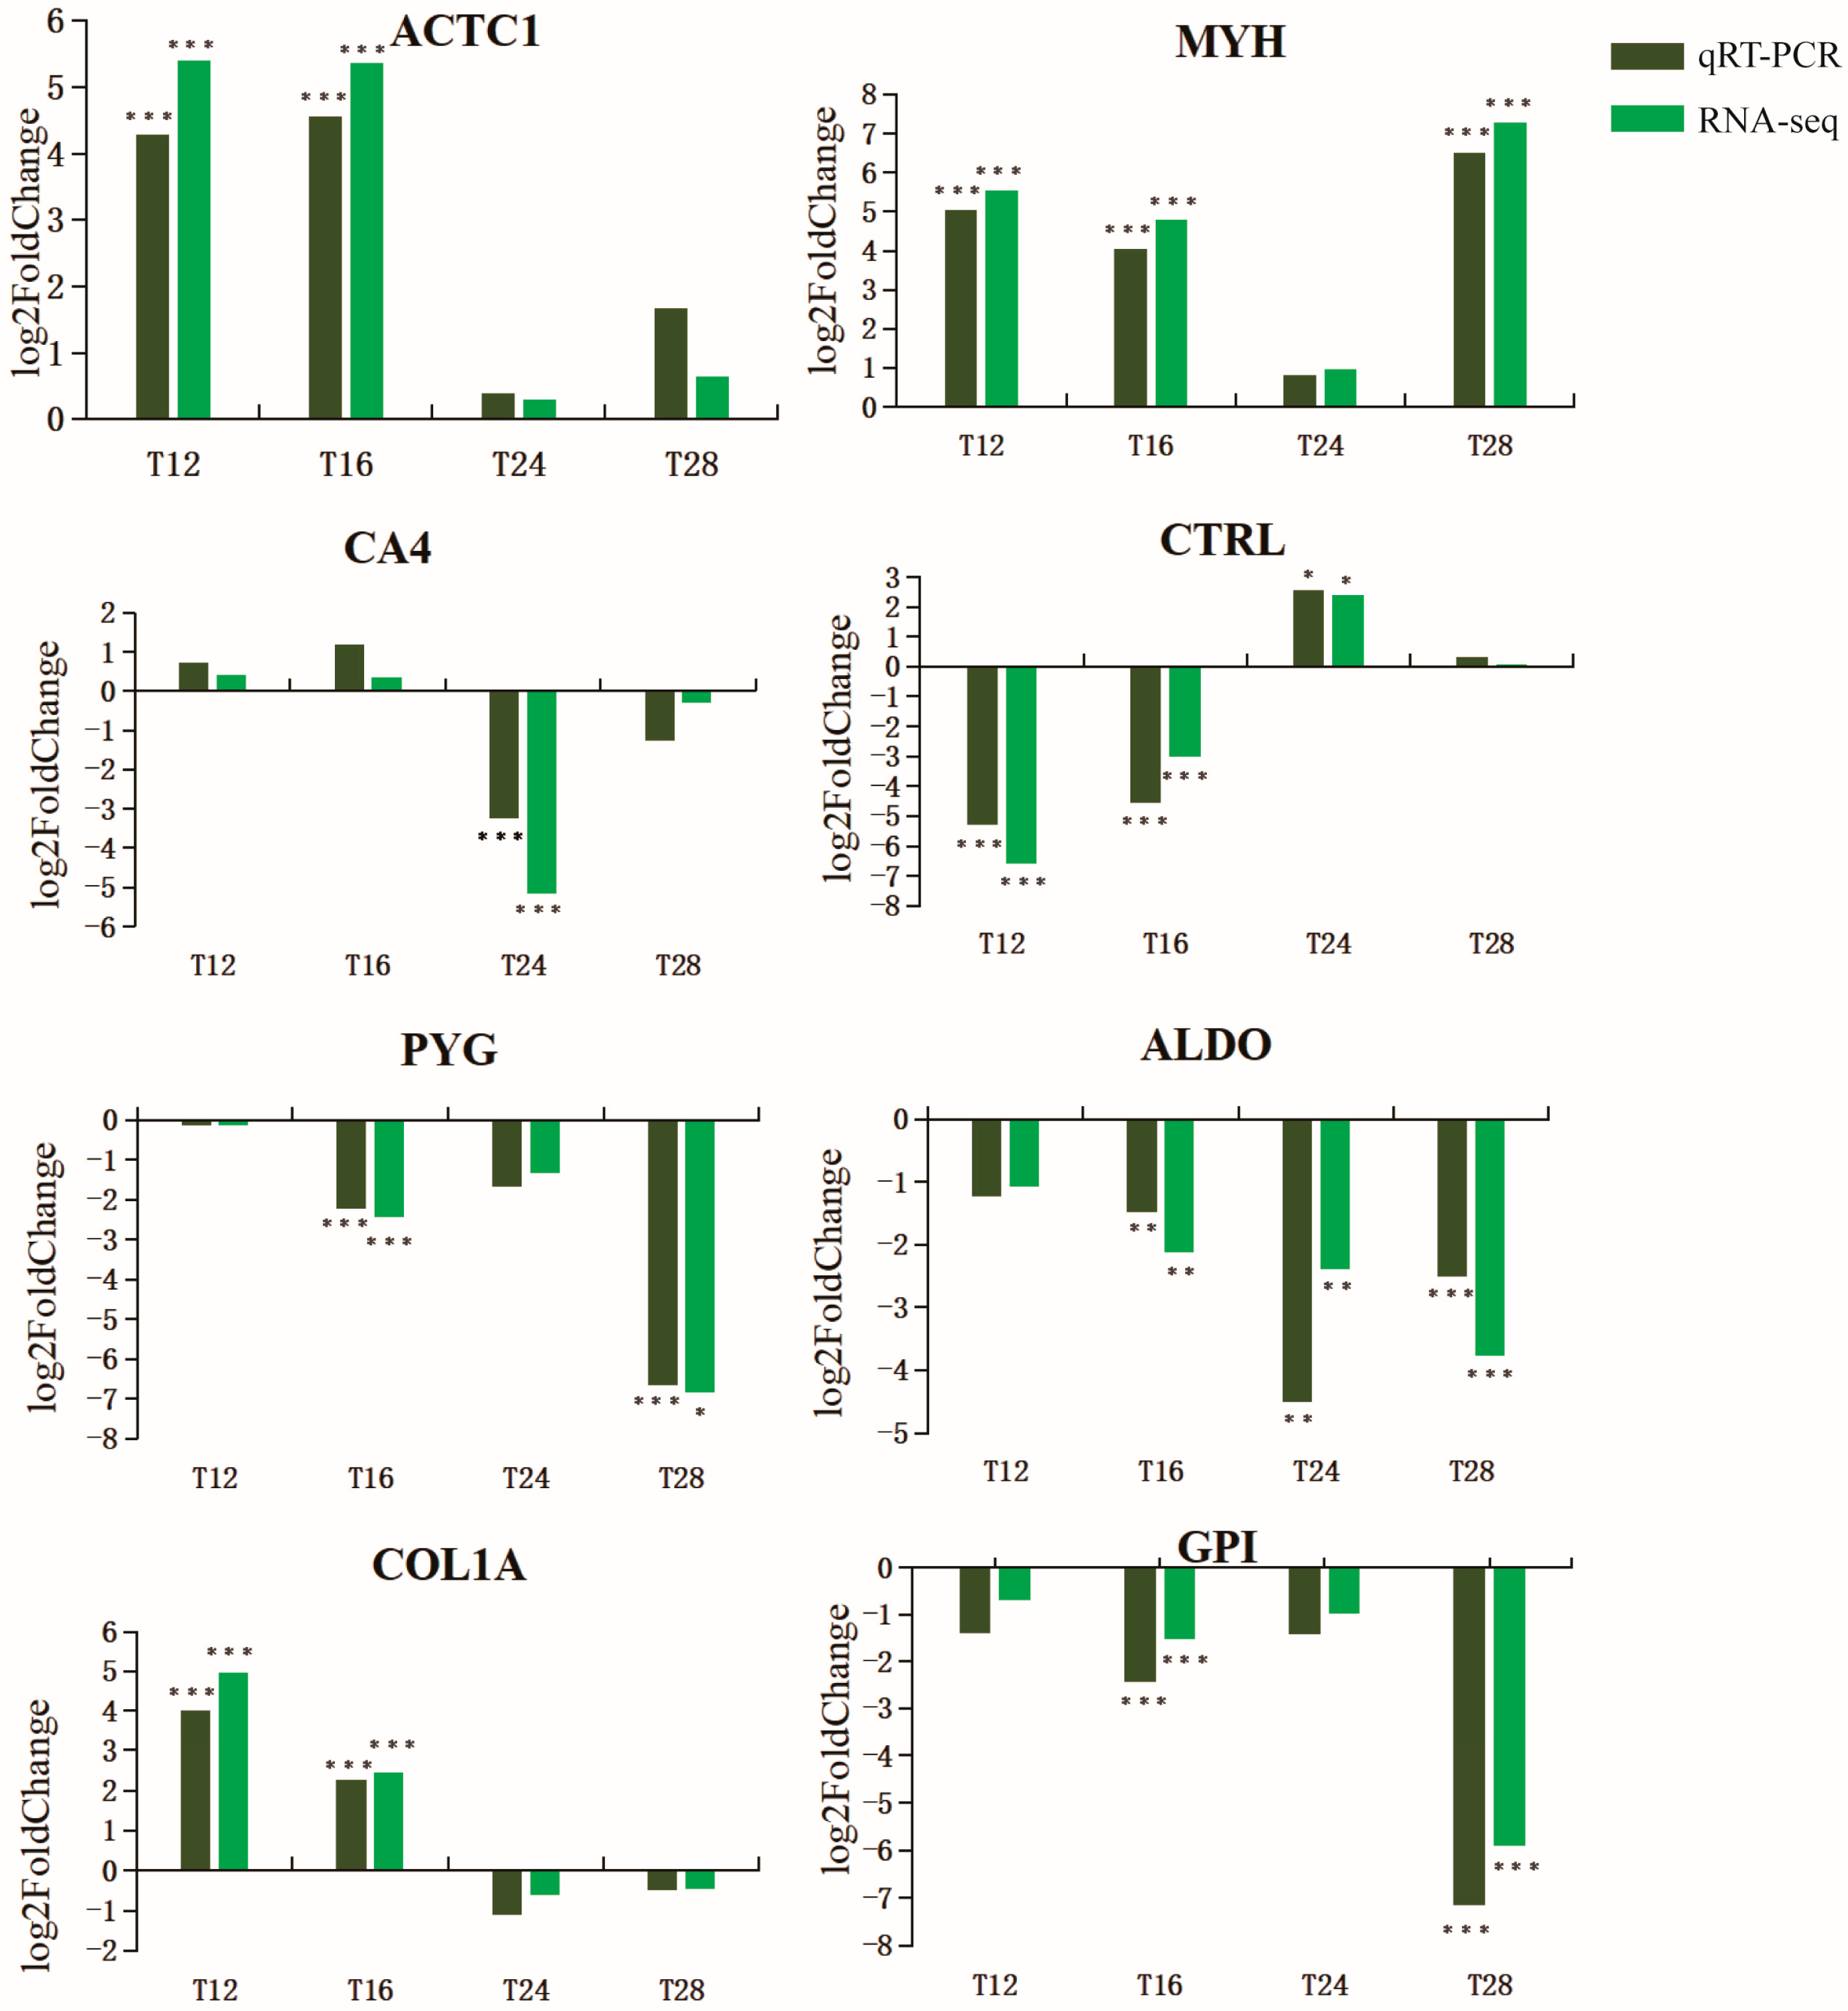
2.5. RT-qPCR Validation of Transcriptome Data
3. Discussion
3.1. Process and Pathway of DEG under Temperature Stress
3.2. Effects of Temperature Stress on Fish Metabolism
3.3. Effects of High-Temperature Stress on Fish Stress and Regulation of Major Pathways
3.4. Effects of Low-Temperature Stress on Fish Immunity and Regulation of Major Pathways
4. Materials and Methods
4.1. Experimental Animals
4.2. Temperature Stress Experiment
4.3. Total RNA Extraction and Illumina Sequencing
4.4. Sequencing Data Quality Control, Assembly, and Gene Function Annotation
4.5. Differentially Expressed Gene Analysis, Functional and Pathway Enrichment
4.6. Quantitative Real-Time PCR
5. Conclusions
Supplementary Materials
Author Contributions
Funding
Institutional Review Board Statement
Informed Consent Statement
Data Availability Statement
Conflicts of Interest
References
- Ren, Y.; Mu, Y.; Zhao, B.; Gao, Y.; Dai, X.; Chu, Z. dmrt3, nom1, abce1, and pkmyt1 play key roles in gonadal sex determination in Acrossocheilus fasciatus. Aquacult. Int. 2022, 31, 317–332. [Google Scholar] [CrossRef]
- Yan, Y.; Guo, L.; Xiang, X.; Xi, Y.; Chen, Y. Breeding strategy of Acrossocheilus fasciatus in the Puxi Stream of the Huangshan Mountain. Curr. Zool. 2009, 7, 350–356. [Google Scholar] [CrossRef]
- Gan, C.; Lin, Y. Countermeasures for the control of Ichthyophthiriasis in flow—Farmed Acrossocheilus fasciatus. Sci. Fish Farming 2015, 7, 56–57. (In Chinese) [Google Scholar] [CrossRef]
- Almroth, B.C.; Asker, N.; Wassmur, B.; Rosengren, M.; Jutfelt, F.; Gräns, A.; Sundell, K.; Axelsson, M.; Sturve, J. Warmer water temperature results in oxidative damage in an Antarctic fish, the bald notothen. J. Exp. Mar. Biol. Ecol. 2015, 468, 130–137. [Google Scholar] [CrossRef]
- Mahanty, A.; Mohanty, S.; Mohanty, B.P. Dietary supplementation of curcumin augments heat stress tolerance through upregulation of nrf-2-mediated antioxidative enzymes and hsps in Puntius sophore. Fish Physiol. Biochem. 2017, 43, 1131–1141. [Google Scholar] [CrossRef] [PubMed]
- Liu, F.; Wang, D.; Fu, J.; Sun, G.; Shen, Y.; Dong, L.; Zhang, B.; Hu, S.; Li, J. Identification of immune-relevant genes by expressed sequence tag analysis of head kidney from grass carp (Ctenopharyngodon idella). Comp. Biochem. Physiol. Part D Genom. Proteom. 2010, 5, 116–123. [Google Scholar] [CrossRef]
- Orioles, M.; Galeotti, M.; Sacca, E.; Bulfoni, M.; Corazzin, M.; Bianchi, S.; Torge, D.; Macchiarelli, G.; Magi, G.E.; Schmidt, J.G. Effect of temperature on transfer of Midichloria-like organism and development of red mark syndrome in rainbow trout (Oncorhynchus mykiss). Aquaculture 2022, 560, 738577. [Google Scholar] [CrossRef]
- Abram, Q.H.; Dixon, B.; Katzenback, B.A. Impacts of Low Temperature on the Teleost Immune System. Biology 2017, 6, 39. [Google Scholar] [CrossRef] [Green Version]
- Forgati, M.; Kandalski, P.K.; Herrerias, T.; Zaleski, T.; Machado, C.; Souza, M.R.D.P.; Donatti, L. Effects of heat stress on the renal and branchial carbohydrate metabolism and antioxidant system of Antarctic fish. J. Comp. Physiol. B 2017, 187, 1137–1154. [Google Scholar] [CrossRef]
- Johansen, J.L.; Nadler, L.E.; Habary, A.; Bowden, A.J.; Rummer, J. Thermal acclimation of tropical coral reef fishes to global heat waves. eLife 2021, 10, e59162. [Google Scholar] [CrossRef] [PubMed]
- Windisch, H.S.; Lucassen, M.; Frickenhaus, S. Evolutionary force in confamiliar marine vertebrates of different temperature realms: Adaptive trends in zoarcid fish transcriptomes. BMC Genom. 2012, 13, 549. [Google Scholar] [CrossRef] [PubMed]
- Johnston, I.A.; Dunn, J. Temperature acclimation and metabolism in ectotherms with particular reference to teleost fish. Symp. Soc. Exp. Biol. 1987, 41, 67–93. [Google Scholar]
- Van Dijk, P.L.; Tesch, C.; Hardewig, I.I.; Pörtner, H.O. Physiological disturbances at critically high temperatures: A comparison between stenothermal antarctic and eurythermal temperate eelpouts (Zoarcidae). J. Exp. Biol. 1999, 202, 3611–3621. [Google Scholar] [CrossRef] [PubMed]
- Umminger, B.L. The role of hormones in the acclimation of fish to low temperatures. Naturwissenschaften 1978, 65, 144–150. [Google Scholar] [CrossRef]
- Sangwan, R.S.; Tripathi, S.; Singh, J.; Narnoliya, L.K.; Sangwan, N.S. De novo sequencing and assembly of Centella asiatica leaf transcriptome for mapping of structural, functional and regulatory genes with special reference to secondary metabolism. Gene 2013, 525, 58–76. [Google Scholar] [CrossRef] [PubMed]
- Wang, L.; Wang, B.; Hu, C.; Wang, C.; Gao, C.; Jiang, H.; Yan, Y. Influences of chronic copper exposure on intestinal histology, antioxidative and immune status, and transcriptomic response in freshwater grouper (Acrossocheilus fasciatus). Fish Shellfish Immunol. 2023, 139, 108861. [Google Scholar] [CrossRef]
- D’Agostino, N.; Li, W.; Wang, D. High-throughput transcriptomics. Sci. Rep. 2022, 12, 20313. [Google Scholar] [CrossRef]
- Wentworth, S.A.; Thede, K.; Aravindabose, V.; Monroe, I.; Thompson, A.W.; Molyneaux, N.; Owen, C.L.; Burns, J.R.; Gonzalez-Vicente, A.; Garvin, J.L.; et al. Transcriptomic analysis of changes in gene expression of immune proteins of gill tissue in response to low environmental temperature in fathead minnows (Pimephales promelas). Comp. Biochem. Physiol. Part. D Genom. Proteom. 2018, 25, 109–117. [Google Scholar] [CrossRef]
- Zhang, W.; Xu, X.; Li, J.; Shen, Y. Transcriptomic Analysis of the Liver and Brain in Grass Carp (Ctenopharyngodon idella) Under Heat Stress. Mar. Biotechnol. 2022, 24, 856–870. [Google Scholar] [CrossRef]
- Logan, C.A.; Buckley, B.A. Transcriptomic responses to environmental temperature in eurythermal and stenothermal fishes. J. Exp. Biol. 2015, 218 Pt 12, 1915–1924. [Google Scholar] [CrossRef] [Green Version]
- Beitinger, T.L.; Bennett, W.A.; McCauley, R.W. Temperature Tolerances of North American Freshwater Fishes Exposed to Dynamic Changes in Temperature. Environ. Biol. Fishes 2000, 58, 237–275. [Google Scholar] [CrossRef]
- Van Tienderen, P.H. Generalists, Specialists, and the Evolution of Phenotypic Plasticity in Sympatric Populations of Distinct Species. Evolution 1997, 51, 1372–1380. [Google Scholar] [CrossRef] [PubMed]
- Vergauwen, L.; Knapen, D.; Hagenaars, A.; De Boeck, G.; Blust, R. Assessing the impact of thermal acclimation on physiological condition in the zebrafish model. J. Comp. Physiol. B 2013, 183, 109–121. [Google Scholar] [CrossRef] [PubMed]
- Malek, R.L.; Sajadi, H.; Abraham, J.; Grundy, M.A.; Gerhard, G.S. The effects of temperature reduction on gene expression and oxidative stress in skeletal muscle from adult zebrafish. Comp. Biochem. Physiol. C Toxicol. Pharmacol. 2004, 138, 363–373. [Google Scholar] [CrossRef]
- Yang, C.; Jiang, M.; Wen, H.; Tian, J.; Liu, W.; Wu, F.; Gou, G. Analysis of differential gene expression under low-temperature stress in Nile tilapia (Oreochromis niloticus) using digital gene expression. Gene 2015, 564, 134–140. [Google Scholar] [CrossRef]
- Zhao, X.; Sun, Z.; Xu, H.; Song, N.; Gao, T. Transcriptome and co-expression network analyses reveal the regulatory pathways and key genes associated with temperature adaptability in the yellow drum (Nibea albiflora). J. Therm. Biol. 2021, 100, 103071. [Google Scholar] [CrossRef]
- Somero, G.N. The physiology of climate change: How potentials for acclimatization and genetic adaptation will determine ‘winners’ and ‘losers’. J. Exp. Biol. 2010, 213, 912–920. [Google Scholar] [CrossRef] [PubMed] [Green Version]
- Tone, T.; Nakayama, K.; Takatsu, H.; Shin, H.W. ATPase reaction cycle of P4-ATPases affects their transport from the endoplasmic reticulum. FEBS Lett. 2020, 594, 412–423. [Google Scholar] [CrossRef]
- Vestergaard, A.L.; Coleman, J.A.; Lemmin, T.; Mikkelsen, S.A.; Molday, L.L.; Vilsen, B.; Molday, R.S.; Dal Peraro, M.; Andersen, J.P. Critical roles of isoleucine-364 and adjacent residues in a hydrophobic gate control of phospholipid transport by the mammalian P4-ATPase ATP8A2. Proc. Natl. Acad. Sci. USA 2014, 111, E1334–E1343. [Google Scholar] [CrossRef]
- Toncheva, D.; Mihailova-Hristova, M.; Vazharova, R.; Staneva, R.; Karachanak, S.; Dimitrov, P.; Simeonov, V.; Ivanov, S.; Balabanski, L.; Serbezov, D.; et al. NGS Nominated CELA1, HSPG2, and KCNK5 as Candidate Genes for Predisposition to Balkan Endemic Nephropathy. Biomed Res. Int. 2014, 2014, 920723. [Google Scholar] [CrossRef] [Green Version]
- Wen, X.; Zhang, X.; Hu, Y.; Xu, J.; Wang, T.; Yin, S. iTRAQ-based quantitative proteomic analysis of Takifugu fasciatus liver in response to low-temperature stress. J. Proteom. 2019, 201, 27–36. [Google Scholar] [CrossRef]
- Onyango, A.N. Cellular Stresses and Stress Responses in the Pathogenesis of Insulin Resistance. Oxid. Med. Cell. Longev. 2018, 2018, 4321714. [Google Scholar] [CrossRef] [Green Version]
- Joyce, W.; Perry, S.F. Hypoxia inducible factor-1α knockout does not impair acute thermal tolerance or heat hardening in zebrafish. Biol. Lett. 2020, 16, 20200292. [Google Scholar] [CrossRef]
- Huang, J.-S.; Amenyogbe, E.; Yang, L.-T.; Wang, Z.-L.; Chen, G.; Wang, W.-Z.; Zhang, J.-D. Cloning and expression analysis of hif-1α and downstream genes during hypoxic stress in cobia (Rachycentron canadum). Aquacult. Int. 2022, 30, 803–824. [Google Scholar] [CrossRef]
- Wang, P.; Long, M.; Zhang, S.; Cheng, Z.; Zhao, X.; He, F.; Liu, H.; Ming, L. Hypoxia inducible factor-1α regulates autophagy via the p27-E2F1 signaling pathway. Mol. Med. Rep. 2017, 16, 2107–2112. [Google Scholar] [CrossRef] [Green Version]
- Semenza, G.L.J.B.P. Signal transduction to hypoxia-inducible factor 1. Biochem. Pharmacol. 2002, 64, 993–998. [Google Scholar] [CrossRef]
- Badawi, Y.; Shi, H. Relative Contribution of Prolyl Hydroxylase-Dependent and -Independent Degradation of HIF-1alpha by Proteasomal Pathways in Cerebral Ischemia. Front. Neurosci. 2017, 11, 239. [Google Scholar] [CrossRef] [Green Version]
- Kindrat, I.; Dreval, K.; Shpyleva, S.; Tryndyak, V.; de Conti, A.; Mudalige, T.K.; Chen, T.; Erstenyuk, A.M.; Beland, F.A.; Pogribny, I.P. Effect of methapyrilene hydrochloride on hepatic intracellular iron metabolism in vivo and in vitro. Toxicol. Lett. 2017, 281, 65–73. [Google Scholar] [CrossRef]
- Buonocore, F.; Randelli, E.; Scala, V.; Belardinelli, M.C.; Casani, D.; Facchiano, A.M.; Costantini, S.; Scapigliati, G. Evolution of cell-mediated immune defences: Cloning and structural characterisation of the T cell receptor beta chain from the icefish Chionodraco hamatus (Perciformes: Channichthyidae). Ital. J. Zool. 2009, 76, 258–268. [Google Scholar] [CrossRef]
- Zhao, M.; Gao, J.; Cui, C.; Zhang, Y.; Jiang, X.; Cui, J. Inhibition of PTEN Ameliorates Secondary Hippocampal Injury and Cognitive Deficits after Intracerebral Hemorrhage: Involvement of AKT/FoxO3a/ATG-Mediated Autophagy. Oxid. Med. Cell. Longev. 2021, 2021, 5472605. [Google Scholar] [CrossRef]
- Wu, L.; Xiong, X.; Wu, X.; Ye, Y.; Jian, Z.; Zhi, Z.; Gu, L. Targeting Oxidative Stress and Inflammation to Prevent Ischemia-Reperfusion Injury. Front. Mol. Neurosci. 2020, 13, 28. [Google Scholar] [CrossRef] [PubMed] [Green Version]
- Peso, L.D.; González-Garcıa, M.; Page, C.; Herrera, R.; Nunez, G. Interleukin-3-Induced Phosphorylation of BAD Through the Protein Kinase Akt. Science 1997, 278, 687–689. [Google Scholar] [CrossRef] [PubMed]
- Sophia, J.; Kowshik, J.; Dwivedi, A.; Bhutia, S.K.; Manavathi, B.; Mishra, R.; Nagini, S. Nimbolide, a neem limonoid inhibits cytoprotective autophagy to activate apoptosis via modulation of the PI3K/Akt/GSK-3beta signalling pathway in oral cancer. Cell Death Dis. 2018, 9, 1087. [Google Scholar] [CrossRef] [Green Version]
- Sun, Q.; Jia, N.; Li, X.; Yang, J.; Chen, G.J.A. Grape seed proanthocyanidins ameliorate neuronal oxidative damage by inhibiting GSK-3β-dependent mitochondrial permeability transition pore opening in an experimental model of sporadic Alzheimer’s disease. Aging 2019, 11, 4107–4124. [Google Scholar] [CrossRef] [PubMed]
- Steinberg, G.R.; Hardie, D.G. New insights into activation and function of the AMPK. Nat. Rev. Mol. Cell Biol. 2023, 24, 255–272. [Google Scholar] [CrossRef]
- Bu, D.; Luo, H.; Huo, P.; Wang, Z.; Zhang, S.; He, Z.; Wu, Y.; Zhao, L.; Liu, J.; Guo, J.; et al. KOBAS-i: Intelligent prioritization and exploratory visualization of biological functions for gene enrichment analysis. Nucleic Acids Res. 2021, 49, W317–W325. [Google Scholar] [CrossRef] [PubMed]
- Ahern, K.; Primer Premier. Premier Primer Designs. Science 1999, 286, 433. [Google Scholar] [CrossRef]
- An, S.; Zhang, Y.; Chen, Z. Analysis of binary classification repeated measurement data with GEE and GLMMs using SPSS software. Nan Fang Yi Ke Da Xue Xue Bao 2012, 32, 1777–1780. [Google Scholar]


| Sample Name | Clean Reads | Clean Bases | Clean N (%) | Clean GC Ratio (%) | Clean Q20 Ratio (%) | Clean Q30 Ratio (%) |
|---|---|---|---|---|---|---|
| T12-1 | 24,316,773 | 7,295,031,900 | 0 | 46.73 | 97.86 | 94.10 |
| T12-2 | 25,410,326 | 7,623,097,800 | 0 | 47.24 | 97.86 | 94.11 |
| T12-3 | 24,898,312 | 7,469,493,600 | 0 | 46.87 | 97.98 | 94.48 |
| T16-1 | 32,794,432 | 9,838,329,600 | 0 | 46.70 | 97.83 | 94.22 |
| T16-2 | 23,386,950 | 7,016,085,000 | 0 | 46.77 | 97.77 | 94.20 |
| T16-3 | 21,114,837 | 6,334,451,100 | 0 | 47.95 | 97.96 | 94.38 |
| T20-1 | 27,319,993 | 8,195,997,900 | 0 | 47.89 | 97.97 | 94.48 |
| T20-2 | 24,386,348 | 7,315,904,400 | 0 | 48.50 | 98.04 | 94.47 |
| T20-3 | 30,775,172 | 9,232,551,600 | 0 | 48.19 | 98.14 | 94.67 |
| T24-1 | 24,653,640 | 7,396,092,000 | 0 | 48.31 | 97.82 | 94.15 |
| T24-2 | 25,124,451 | 7,537,335,300 | 0 | 48.24 | 98.12 | 94.73 |
| T24-3 | 24,181,637 | 7,254,491,100 | 0 | 48.76 | 97.70 | 93.92 |
| T28-1 | 26,557,598 | 7,967,279,400 | 0 | 48.81 | 97.72 | 93.61 |
| T28-2 | 22,807,447 | 6,842,234,100 | 0 | 47.76 | 97.60 | 93.34 |
| T28-3 | 24,392,064 | 7,317,619,200 | 0 | 48.05 | 97.68 | 93.61 |
| Unigene Total Number | Unigen Total Length/bp | N50 Length/bp | Mean Length/bp |
|---|---|---|---|
| 242,814 | 22,838,2225 | 1311 | 940.5644856 |
| Sample Name | Total Reads | Mapped Reads (Ratio%) |
|---|---|---|
| T12-1 | 48,633,546 | 38,867,266 (79.92%) |
| T12-2 | 50,820,652 | 41,480,416 (81.62%) |
| T12-3 | 49,796,624 | 40,270,714 (80.87%) |
| T16-1 | 65,588,864 | 52,932,638 (80.70%) |
| T16-2 | 46,773,900 | 37,384,300 (79.93%) |
| T16-3 | 42,229,674 | 34,927,104 (82.71%) |
| T20-1 | 54,639,986 | 43,569,030 (79.74%) |
| T20-2 | 48,772,696 | 40,317,360 (82.66%) |
| T20-3 | 61,550,344 | 50,379,846 (81.85%) |
| T24-1 | 49,307,280 | 39,098,918 (79.30%) |
| T24-2 | 50,248,902 | 40,699,492 (81.00%) |
| T24-3 | 48,363,274 | 38,236,040 (79.06%) |
| T28-1 | 53,115,196 | 43,490,240 (81.88%) |
| T28-2 | 45,614,894 | 36,763,338 (80.60%) |
| T28-3 | 48,784,128 | 39,258,654 (80.47%) |
| Anno_Database | Annotated_Number | Percentage/% |
|---|---|---|
| GO_Annotation | 26,807 | 11.04% |
| KEGG_Annotation | 16,660 | 6.86% |
| KOG_Annotation | 25,657 | 10.57% |
| NR_Annotation | 60,536 | 24.93% |
| NT_Annotation | 224,722 | 92.55% |
| Swissprot_Annotation | 34,157 | 14.07% |
| Total unigenes | 242,814 | 100.00% |
| Type | Total | Up | Down |
|---|---|---|---|
| T12 vs. T20 | 9202 | 4654 | 4548 |
| T16 vs. T20 | 4959 | 2983 | 1976 |
| T24 vs. T20 | 133 | 17 | 116 |
| T28 vs. T20 | 878 | 343 | 535 |
| Gene | Forward Primer Sequence | Reverse Primer Sequence |
|---|---|---|
| MYH | CTGTCAAGAGCATCAATGAC | CGACCTTCACTCTGGGGTAG |
| GPI | AGCCGCATCATGTGATTCATC | TCGTATGGTTCCTGCTGACTT |
| ALDO | GGTGATTAGTAGGCATGGTTGG | CATCTCCAGAACAACAGCAAGG |
| CTRL | CCACTGCTCTGTTGCGGTCA | AGGCTGGATGCTGATGGTTGAT |
| CA4 | CTGTTCCTTGCTGAGCGGTATG | CCTGGCACCAATGTAACACTGT |
| COL1A | GCAGCAACACAGCCTTCTTCA | GGTTCGGCGAGACCATCAATG |
| PYG | AAGAGCCTAACAAGCAGTGGA | TGGGAAGAGTTGAGCAGAACA |
| ACTC1 | ATGTGCGACGAGGAAGAGACC | CAGTTGGTGATGATGCCATGCT |
| β-actin | CCCAGAATCCTATTGTTACCC | CCTCGCATACATAGTGCCATT |
Disclaimer/Publisher’s Note: The statements, opinions and data contained in all publications are solely those of the individual author(s) and contributor(s) and not of MDPI and/or the editor(s). MDPI and/or the editor(s) disclaim responsibility for any injury to people or property resulting from any ideas, methods, instructions or products referred to in the content. |
© 2023 by the authors. Licensee MDPI, Basel, Switzerland. This article is an open access article distributed under the terms and conditions of the Creative Commons Attribution (CC BY) license (https://creativecommons.org/licenses/by/4.0/).
Share and Cite
Wei, Z.; Fang, Y.; Shi, W.; Chu, Z.; Zhao, B. Transcriptional Modulation Reveals Physiological Responses to Temperature Adaptation in Acrossocheilus fasciatus. Int. J. Mol. Sci. 2023, 24, 11622. https://doi.org/10.3390/ijms241411622
Wei Z, Fang Y, Shi W, Chu Z, Zhao B. Transcriptional Modulation Reveals Physiological Responses to Temperature Adaptation in Acrossocheilus fasciatus. International Journal of Molecular Sciences. 2023; 24(14):11622. https://doi.org/10.3390/ijms241411622
Chicago/Turabian StyleWei, Zhenzhu, Yi Fang, Wei Shi, Zhangjie Chu, and Bo Zhao. 2023. "Transcriptional Modulation Reveals Physiological Responses to Temperature Adaptation in Acrossocheilus fasciatus" International Journal of Molecular Sciences 24, no. 14: 11622. https://doi.org/10.3390/ijms241411622
APA StyleWei, Z., Fang, Y., Shi, W., Chu, Z., & Zhao, B. (2023). Transcriptional Modulation Reveals Physiological Responses to Temperature Adaptation in Acrossocheilus fasciatus. International Journal of Molecular Sciences, 24(14), 11622. https://doi.org/10.3390/ijms241411622