
Cell-Impermeable Inhibitors Confirm That Intracellular Human Transglutaminase 2 Is Responsible for the Transglutaminase-Associated Cancer Phenotype
 , , , ,
  ,
, 
Abstract
:1. Introduction
2. Results and Discussion
2.1. Design
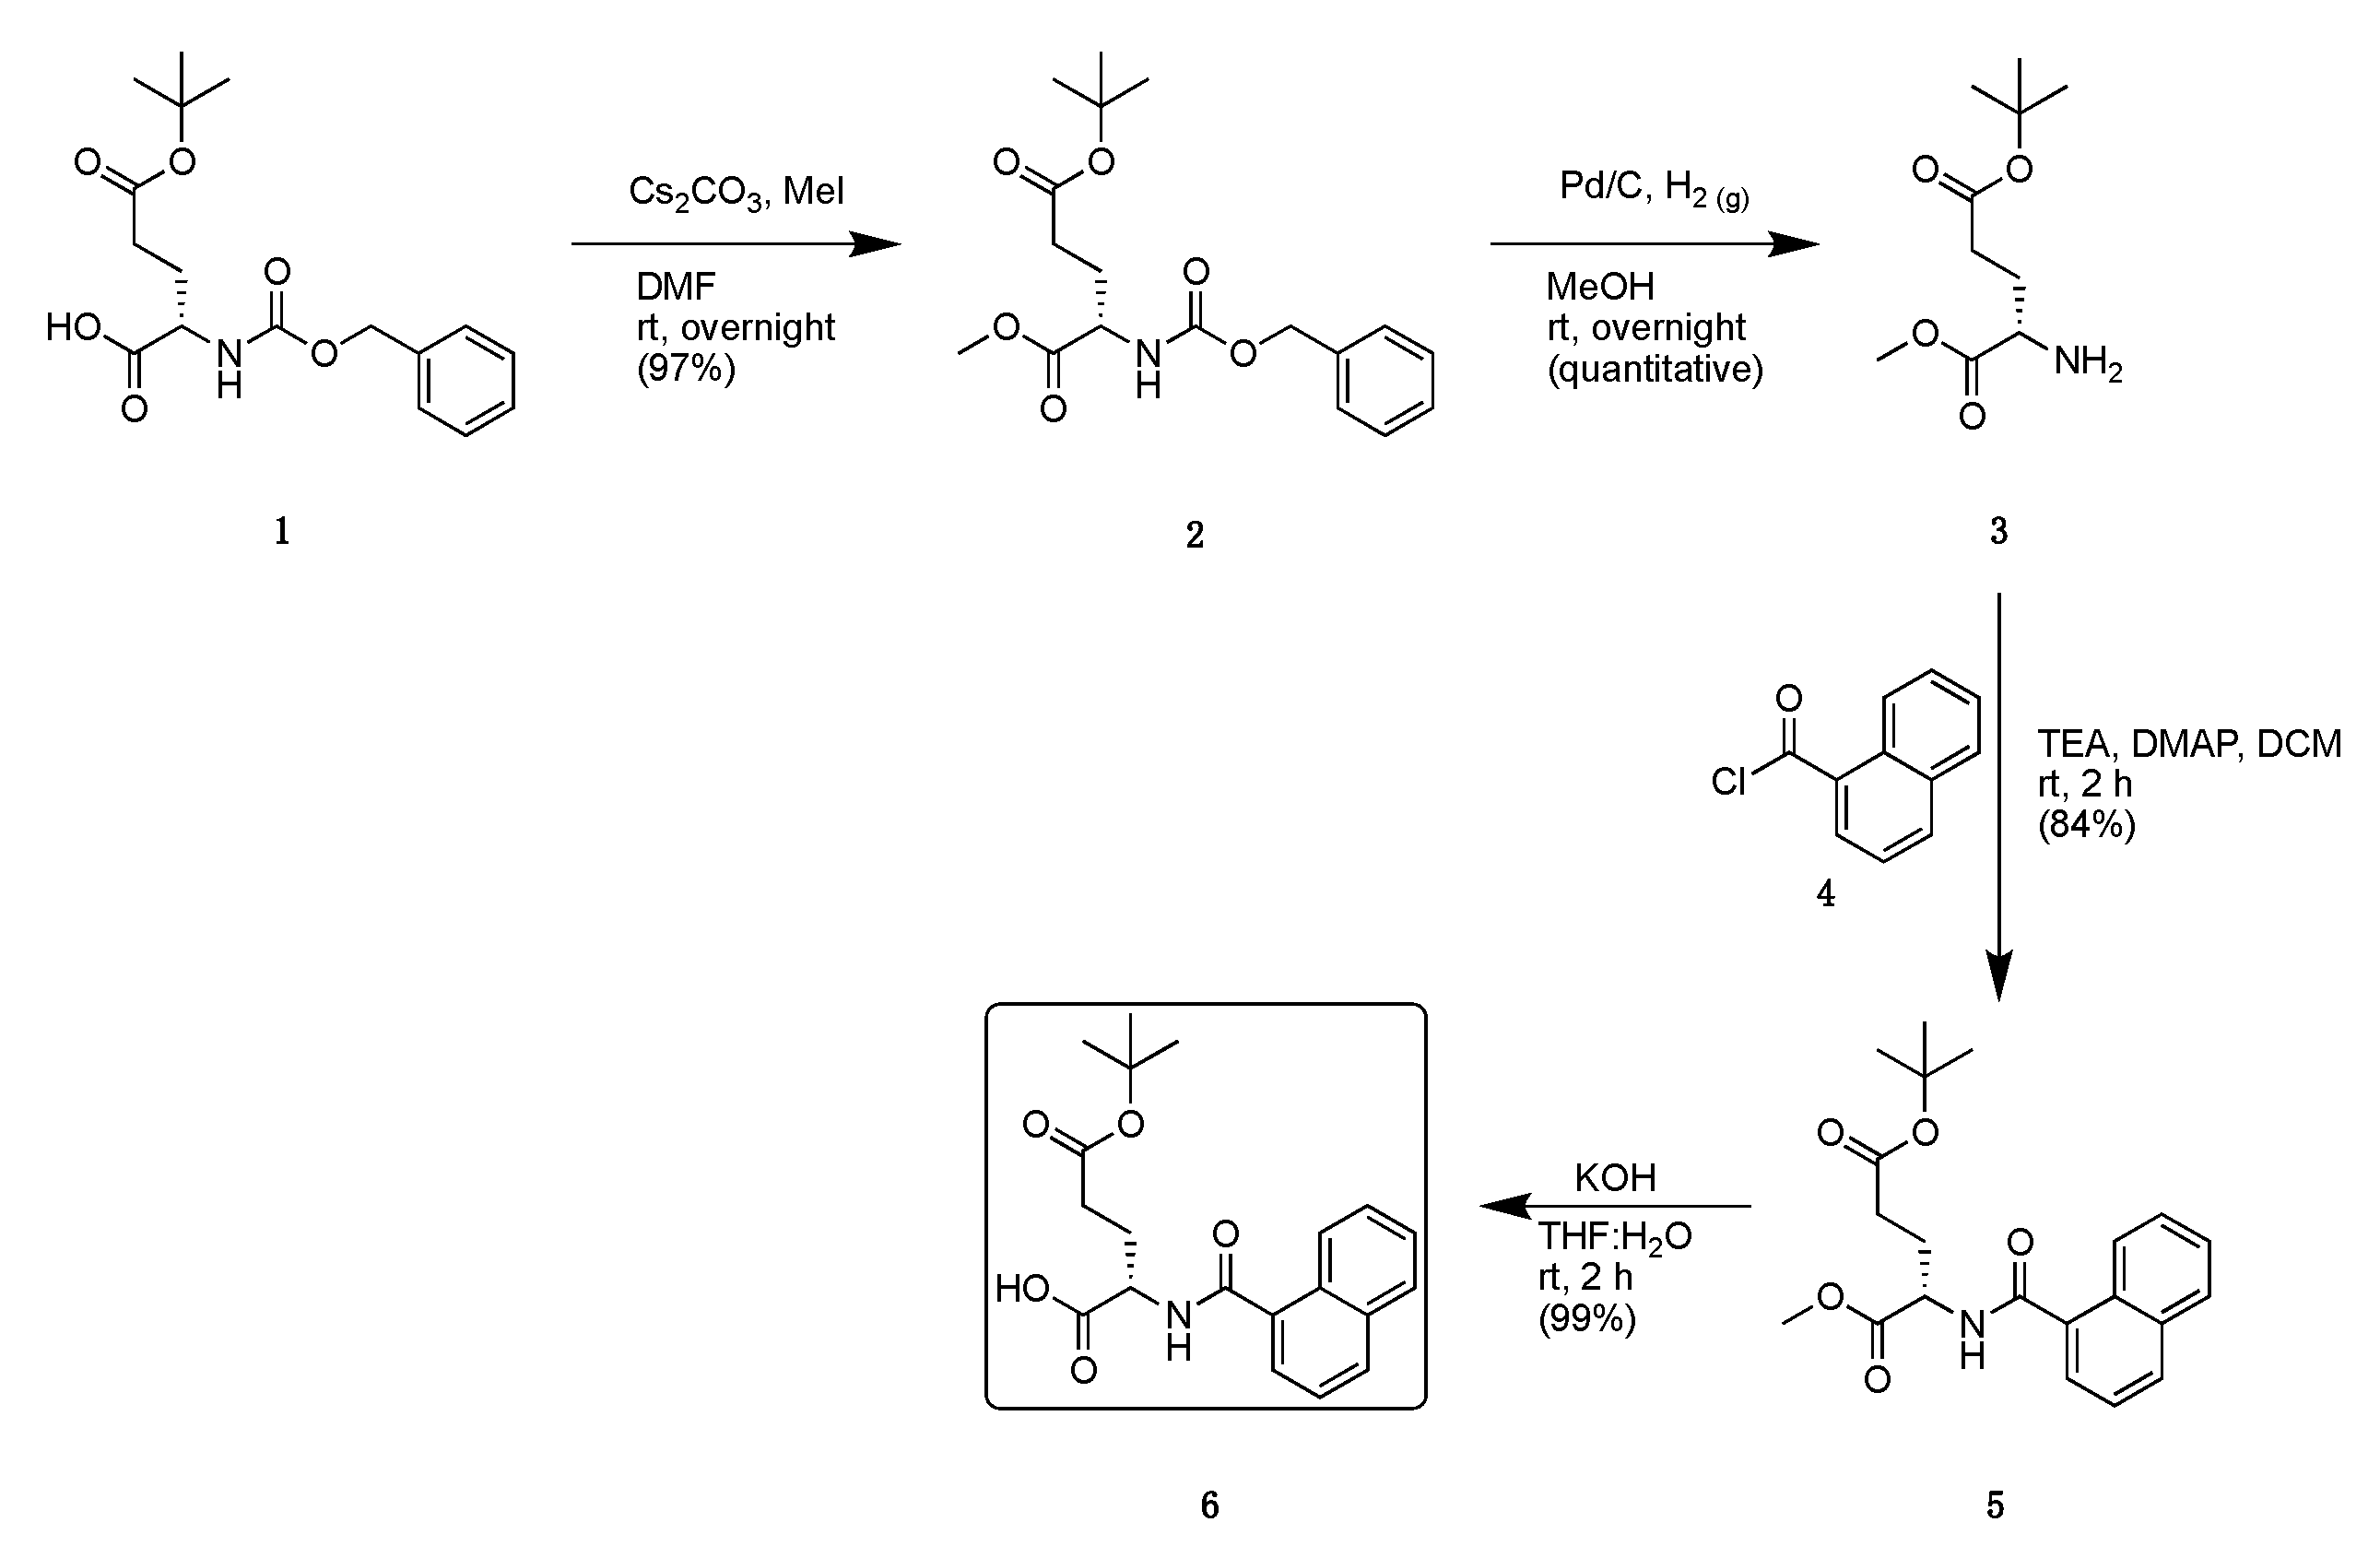
2.2. Synthesis
2.3. Kinetics
2.4. Isozyme Selectivity
2.5. Pharmacokinetic Properties
2.6. Fluorescent Labelling
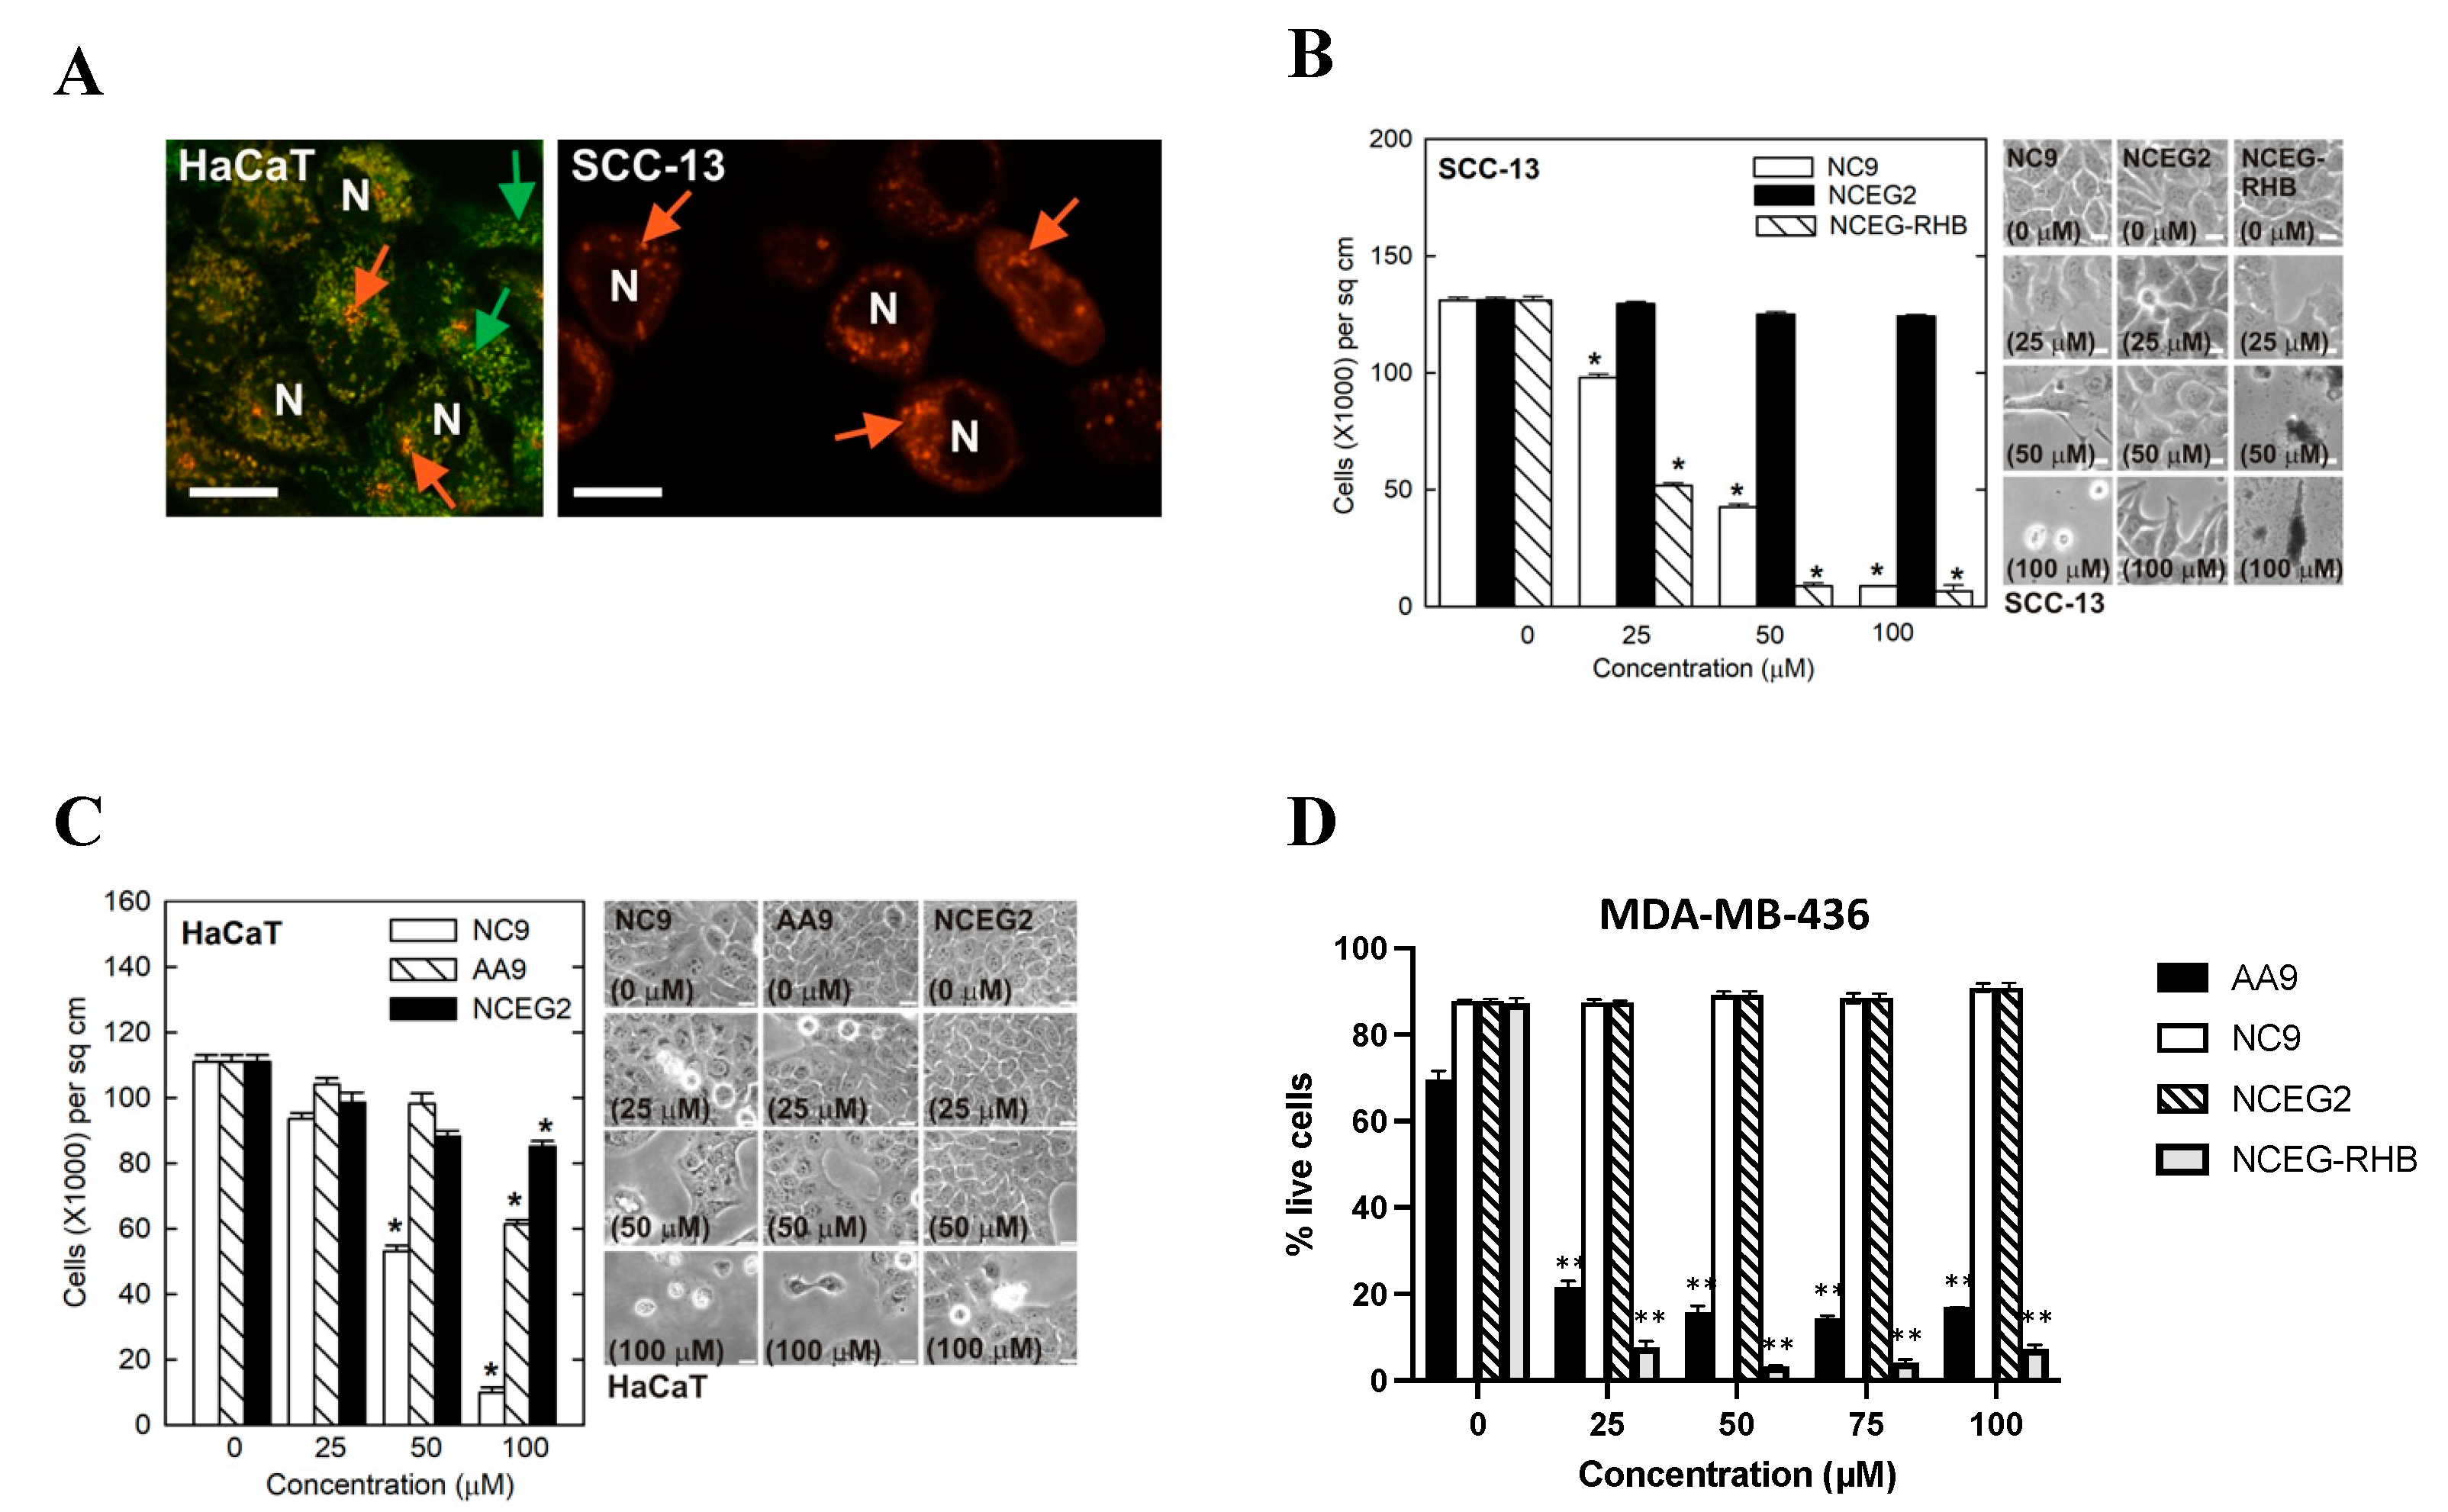
2.7. Evaluation of Cancer Cell Proliferation and Migration
2.8. Pull-Down of TG2 from E. coli Lysate
3. Materials and Methods
3.1. Chemical Synthesis
3.2. Molecular Docking of Compounds 16, 18, and 29 into TG2 Active Site
3.3. rhTG2 Inhibition Assay
3.4. TGase Isozyme Selectivity
3.5. Fluorescent Labelling of Purified rhTG2
3.6. SH-SY5Y Fluorescent Microscopy
3.7. Cell Proliferation Assay
3.8. Real-Time Cell Migration Assay
3.9. HaCaT and SCC-13 Cell Staining
3.10. Pull-Down of rhTG2 from E. coli Lysate
4. Conclusions
Supplementary Materials
Author Contributions
Funding
Institutional Review Board Statement
Informed Consent Statement
Data Availability Statement
Acknowledgments
Conflicts of Interest
References
- Lorand, L.; Graham, R.M. Transglutaminases: Crosslinking Enzymes with Pleiotropic Functions. Nat. Rev. Mol. Cell Biol. 2003, 4, 140–156. [Google Scholar] [CrossRef] [PubMed]
- Gundemir, S.; Colak, G.; Tucholski, J.; Johnson, G.V.W. Transglutaminase 2: A Molecular Swiss Army Knife. Biochim. Biophys. Acta Mol. Cell Res. 2012, 1823, 406–419. [Google Scholar] [CrossRef] [PubMed] [Green Version]
- Beninati, S.; Bergamini, C.M.; Piacentini, M. An Overview of the First 50 Years of Transglutaminase Research. Amino Acids 2009, 36, 591–598. [Google Scholar] [CrossRef] [Green Version]
- Keillor, J.W.; Clouthier, C.M.; Apperley, K.Y.P.; Akbar, A.; Mulani, A. Acyl Transfer Mechanisms of Tissue Transglutaminase. Bioorg. Chem. 2014, 57, 186–197. [Google Scholar] [CrossRef] [PubMed]
- Begg, G.E.; Holman, S.R.; Stokes, P.H.; Matthews, J.M.; Graham, R.M.; Iismaa, S.E. Mutation of a Critical Arginine in the GTP-Binding Site of Transglutaminase 2 Disinhibits Intracellular Cross-Linking Activity. J. Biol. Chem. 2006, 281, 12603–12609. [Google Scholar] [CrossRef] [Green Version]
- Pinkas, D.M.; Strop, P.; Brunger, A.T.; Khosla, C. Transglutaminase 2 Undergoes a Large Conformational Change upon Activation. PLoS Biol. 2007, 5, e327. [Google Scholar] [CrossRef]
- Jang, T.H.; Lee, D.S.; Choi, K.; Jeong, E.M.; Kim, I.G.; Kim, Y.W.; Chun, J.N.; Jeon, J.H.; Park, H.H. Crystal Structure of Transglutaminase 2 with GTP Complex and Amino Acid Sequence Evidence of Evolution of GTP Binding Site. PLoS ONE 2014, 9, e107005. [Google Scholar] [CrossRef] [Green Version]
- Keillor, J.W.; Johnson, G.V.W. Transglutaminase 2 as a Therapeutic Target for Neurological Conditions. Expert Opin. Ther. Targets 2021, 25, 721–731. [Google Scholar] [CrossRef]
- Siegel, M.; Strnad, P.; Watts, R.E.; Choi, K.; Jabri, B.; Omary, M.B.; Khosla, C. Extracellular Transglutaminase 2 Is Catalytically Inactive, but Is Transiently Activated upon Tissue Injury. PLoS ONE 2008, 3, e1861. [Google Scholar] [CrossRef] [Green Version]
- Tatsukawa, H.; Furutani, Y.; Hitomi, K.; Kojima, S. Transglutaminase 2 Has Opposing Roles in the Regulation of Cellular Functions as Well as Cell Growth and Death. Cell Death Dis. 2016, 7, e2244. [Google Scholar] [CrossRef] [Green Version]
- Nadalutti, C.; Viiri, K.M.; Kaukinen, K.; Mäki, M.; Lindfors, K. Extracellular Transglutaminase 2 Has a Role in Cell Adhesion, Whereas Intracellular Transglutaminase 2 Is Involved in Regulation of Endothelial Cell Proliferation and Apoptosis. Cell Prolif. 2011, 44, 49–58. [Google Scholar] [CrossRef] [PubMed]
- Piacentini, M.; D’Eletto, M.; Farrace, M.G.; Rodolfo, C.; Del Nonno, F.; Ippolito, G.; Falasca, L. Characterization of Distinct Sub-Cellular Location of Transglutaminase Type II: Changes in Intracellular Distribution in Physiological and Pathological States. Cell Tissue Res. 2014, 358, 793–805. [Google Scholar] [CrossRef] [PubMed] [Green Version]
- Upchurch, H.F.; Conway, E.; Patterson, M.K.; Maxwell, M.D. Localization of Cellular Transglutaminase on the Extracellular Matrix after Wounding: Characteristics of the Matrix Bound Enzyme. J. Cell. Physiol. 1991, 149, 375–382. [Google Scholar] [CrossRef]
- Fisher, M.L.; Keillor, J.W.; Xu, W.; Eckert, R.L.; Kerr, C. Transglutaminase Is Required for Epidermal Squamous Cell Carcinoma Stem Cell Survival. Mol. Cancer Res. 2015, 13, 1083–1094. [Google Scholar] [CrossRef] [Green Version]
- Olsen, K.C.; Sapinoro, R.E.; Kottmann, R.M.; Kulkarni, A.A.; Iismaa, S.E.; Johnson, G.V.W.; Thatcher, T.H.; Phipps, R.P.; Sime, P.J. Transglutaminase 2 and Its Role in Pulmonary Fibrosis. Am. J. Respir. Crit. Care Med. 2011, 184, 699–707. [Google Scholar] [CrossRef] [Green Version]
- Benn, M.C.; Weber, W.; Klotzsch, E.; Vogel, V.; Pot, S.A. Tissue Transglutaminase in Fibrosis—More than an Extracellular Matrix Cross-Linker. Curr. Opin. Biomed. Eng. 2019, 10, 156–164. [Google Scholar] [CrossRef]
- Dieterich, W.; Ehnis, T.; Bauer, M.; Donner, P.; Volta, U.; Riecken, E.O.; Schuppan, D. Identification of Tissue Transglutaminase as the Autoantigen of Celiac Disease. Nat. Med. 1997, 3, 797–801. [Google Scholar] [CrossRef] [PubMed]
- Huang, L.; Xu, A.M.; Liu, W. Transglutaminase 2 in Cancer. Am. J. Cancer Res. 2015, 5, 2756–2776. [Google Scholar]
- Tabolacci, C.; de Martino, A.; Mischiati, C.; Feriotto, G.; Beninati, S. The Role of Tissue Transglutaminase in Cancer Cell Initiation, Survival and Progression. Med. Sci. 2019, 7, 19. [Google Scholar] [CrossRef] [Green Version]
- Shweke, N.; Boulos, N.; Jouanneau, C.; Vandermeersch, S.; Melino, G.; Dussaule, J.C.; Chatziantoniou, C.; Ronco, P.; Boffa, J.J. Tissue Transglutaminase Contributes to Interstitial Renal Fibrosis by Favoring Accumulation of Fibrillar Collagen through TGF-β Activation and Cell Infiltration. Am. J. Pathol. 2008, 173, 631–642. [Google Scholar] [CrossRef] [Green Version]
- Daneshpour, N.; Griffin, M.; Collighan, R.; Perrie, Y. Targeted Delivery of a Novel Group of Site-Directed Transglutaminase Inhibitors to the Liver Using Liposomes: A New Approach for the Potential Treatment of Liver Fibrosis. J. Drug Target. 2011, 19, 624–631. [Google Scholar] [CrossRef] [PubMed]
- Schuppan, D.; Mäki, M.; Lundin, K.E.A.; Isola, J.; Friesing-Sosnik, T.; Taavela, J.; Popp, A.; Koskenpato, J.; Langhorst, J.; Hovde, Ø.; et al. A Randomized Trial of a Transglutaminase 2 Inhibitor for Celiac Disease. N. Engl. J. Med. 2021, 385, 35–45. [Google Scholar] [CrossRef] [PubMed]
- Büchold, C.; Hils, M.; Gerlach, U.; Weber, J.; Pelzer, C.; Heil, A.; Aeschlimann, D.; Pasternack, R. Features of ZED1227: The First-In-Class Tissue Transglutaminase Inhibitor Undergoing Clinical Evaluation for the Treatment of Celiac Disease. Cells 2022, 11, 1667. [Google Scholar] [CrossRef] [PubMed]
- Fisher, M.L.; Kerr, C.; Adhikary, G.; Grun, D.; Xu, W.; Keillor, J.W.; Eckert, R.L. Transglutaminase Interaction with A6/Β4-Integrin Stimulates YAP1-Dependent ΔNp63α Stabilization and Leads to Enhanced Cancer Stem Cell Survival and Tumor Formation. Cancer Res. 2016, 76, 7265–7276. [Google Scholar] [CrossRef] [PubMed] [Green Version]
- Fisher, M.L.; Adhikary, G.; Xu, W.; Kerr, C.; Keillor, J.W.; Eckert, R.L. Type II Transglutaminase Stimulates Epidermal Cancer Stem Cell Epithelial-Mesenchymal Transition. Oncotarget 2015, 6, 20525–20539. [Google Scholar] [CrossRef] [Green Version]
- Akbar, A.; McNeil, N.M.R.; Albert, M.R.; Ta, V.; Adhikary, G.; Bourgeois, K.; Eckert, R.L.; Keillor, J.W. Structure-Activity Relationships of Potent, Targeted Covalent Inhibitors That Abolish Both the Transamidation and GTP Binding Activities of Human Tissue Transglutaminase. J. Med. Chem. 2017, 60, 7910–7927. [Google Scholar] [CrossRef]
- McNeil, N.M.R.; Gates, E.W.J.; Firoozi, N.; Cundy, N.J.; Leccese, J.; Eisinga, S.; Tyndall, J.D.A.; Adhikary, G.; Eckert, R.L.; Keillor, J.W. Structure-Activity Relationships of N-Terminal Variants of Peptidomimetic Tissue Transglutaminase Inhibitors. Eur. J. Med. Chem. 2022, 232, 114172–114196. [Google Scholar] [CrossRef]
- Rorke, E.A.; Adhikary, G.; Szmacinski, H.; Lakowicz, J.R.; Weber, D.J.; Godoy-Ruiz, R.; Puranik, P.; Keillor, J.W.; Gates, E.W.J.; Eckert, R.L. Sulforaphane Covalently Interacts with the Transglutaminase 2 Cancer Maintenance Protein to Alter Its Structure and Suppress Its Activity. Mol. Carcinog. 2022, 61, 19–32. [Google Scholar] [CrossRef]
- Sima, L.E.; Matei, D.; Condello, S. The Outside-In Journey of Tissue Transglutaminase in Cancer. Cells 2022, 11, 1779. [Google Scholar] [CrossRef]
- Yakubov, B.; Chelladurai, B.; Schmitt, J.; Emerson, R.; Turchi, J.J.; Matei, D. Extracellular Tissue Transglutaminase Activates Noncanonical NF-ΚB Signaling and Promotes Metastasis in Ovarian Cancer. Neoplasia 2013, 15, 609–619. [Google Scholar] [CrossRef] [Green Version]
- Belkin, A.M. Extracellular TG2: Emerging Functions and Regulation. FEBS J. 2011, 278, 4704–4716. [Google Scholar] [CrossRef] [PubMed] [Green Version]
- Cundy, N.J.; Arciszewski, J.; Gates, E.W.J.; Acton, S.L.; Passley, K.D.; Awoonor-Williams, E.; Boyd, E.K.; Xu, N.; Pierson, É.; Fernandez-Ansieta, C.; et al. Novel Irreversible Peptidic Inhibitors of Transglutaminase 2. RSC Med. Chem. 2023, 14, 378–385. [Google Scholar] [CrossRef] [PubMed]
- Kerr, C.; Szmacinski, H.; Fisher, M.L.; Nance, B.; Lakowicz, J.R.; Akbar, A.; Keillor, J.W.; Lok Wong, T.; Godoy-Ruiz, R.; Toth, E.A.; et al. Transamidase Site-Targeted Agents Alter the Conformation of the Transglutaminase Cancer Stem Cell Survival Protein to Reduce GTP Binding Activity and Cancer Stem Cell Survival. Oncogene 2017, 36, 2981–2990. [Google Scholar] [CrossRef] [PubMed] [Green Version]
- Caron, N.S.; Munsie, L.N.; Keillor, J.W.; Truant, R. Using FLIM-FRET to Measure Conformational Changes of Transglutaminase Type 2 in Live Cells. PLoS ONE 2012, 7, e44159. [Google Scholar] [CrossRef]
- Clouthier, C.M.; Mironov, G.G.; Okhonin, V.; Berezovski, M.V.; Keillor, J.W. Real-Time Monitoring of Protein Conformational Dynamics in Solution Using Kinetic Capillary Electrophoresis. Angew. Chem. Int. Ed. 2012, 51, 12464–12468. [Google Scholar] [CrossRef]
- Mironov, G.G.; Clouthier, C.M.; Akbar, A.; Keillor, J.W.; Berezovski, M.V. Simultaneous Analysis of Enzyme Structure and Activity by Kinetic Capillary Electrophoresis-MS. Nat. Chem. Biol. 2016, 12, 918–922. [Google Scholar] [CrossRef]
- Kitz, R.; Wilson, I.B. Esters of Methanesulfonic Acid as Irreversible Inhibitors of Acetylcholinesterase. J. Biol. Chem. 1962, 237, 3245–3249. [Google Scholar] [CrossRef]
- Leblanc, A.; Gravel, C.; Labelle, J.; Keillor, J.W. Kinetic Studies of Guinea Pig Liver Transglutaminase Reveal a General-Base-Catalyzed Deacylation Mechanism. Biochemistry 2001, 40, 8335–8342. [Google Scholar] [CrossRef]
- Rangaswamy, A.M.M.; Navals, P.; Gates, E.W.J.; Shad, S.; Watt, S.K.I.; Keillor, J.W. Structure–Activity Relationships of Hydrophobic Alkyl Acrylamides as Tissue Transglutaminase Inhibitors. RSC Med. Chem. 2022, 13, 413–428. [Google Scholar] [CrossRef]
- Keillor, J.W.; Apperley, K.Y.P. Transglutaminase Inhibitors: A Patent Review. Expert Opin. Ther. Pat. 2016, 26, 49–63. [Google Scholar] [CrossRef]
- Song, M.; Hwang, H.; Im, C.Y.; Kim, S.-Y. Recent Progress in the Development of Transglutaminase 2 (TGase2) Inhibitors. J. Med. Chem. 2016, 60, 554–567. [Google Scholar] [CrossRef]
- Oertel, K.; Hunfeld, A.; Specker, E.; Reiff, C.; Seitz, R.; Pasternack, R.; Dodt, J. A Highly Sensitive Fluorometric Assay for Determination of Human Coagulation Factor XIII in Plasma. Anal. Biochem. 2007, 367, 152–158. [Google Scholar] [CrossRef] [PubMed]
- Király, R.; Thangaraju, K.; Nagy, Z.; Collighan, R.; Nemes, Z.; Griffin, M.; Fésüs, L. Isopeptidase Activity of Human Transglutaminase 2: Disconnection from Transamidation and Characterization by Kinetic Parameters. Amino Acids 2016, 48, 31–40. [Google Scholar] [CrossRef] [PubMed] [Green Version]
- Lipinski, C.A. Drug-like Properties and the Causes of Poor Solubility and Poor Permeability. J. Pharmacol. Toxicol. Methods 2000, 44, 235–249. [Google Scholar] [CrossRef]
- Veber, D.F.; Johnson, S.R.; Cheng, H.Y.; Smith, B.R.; Ward, K.W.; Kopple, K.D. Molecular Properties That Influence the Oral Bioavailability of Drug Candidates. J. Med. Chem. 2002, 45, 2615–2623. [Google Scholar] [CrossRef] [PubMed]
- Daina, A.; Michielin, O.; Zoete, V. SwissADME: A Free Web Tool to Evaluate Pharmacokinetics, Drug-Likeness and Medicinal Chemistry Friendliness of Small Molecules. Sci. Rep. 2017, 7, 42717. [Google Scholar] [CrossRef] [Green Version]
- Roy, I.; Smith, O.; Clouthier, C.M.; Keillor, J.W. Expression, Purification and Kinetic Characterisation of Human Tissue Transglutaminase. Protein Expr. Purif. 2013, 87, 41–46. [Google Scholar] [CrossRef] [PubMed]
- Zhang, J.; Lesort, M.; Guttmann, R.P.; Johnson, G.V.W. Modulation of the in Situ Activity of Tissue Transglutaminase by Calcium and GTP. J. Biol. Chem. 1998, 273, 2288–2295. [Google Scholar] [CrossRef] [Green Version]
- Tucholski, J.; Lesort, M.; Johnson, G.V.W. Tissue Transglutaminase Is Essential for Neurite Outgrowth in Human Neuroblastoma SH-SY5Y Cells. Neuroscience 2001, 102, 481–491. [Google Scholar] [CrossRef]
- Singh, U.S.; Pan, J.; Kao, Y.L.; Joshi, S.; Young, K.L.; Baker, K.M. Tissue Transglutaminase Mediates Activation of RhoA and MAP Kinase Pathways during Retinoic Acid-Induced Neuronal Differentiation of SH-SY5Y Cells. J. Biol. Chem. 2003, 278, 391–399. [Google Scholar] [CrossRef] [Green Version]
- Lee, H.T.; Huang, C.H.; Chen, W.C.; Tsai, C.S.; Chao, Y.L.; Liu, S.H.; Chen, J.H.; Wu, Y.Y.; Lee, Y.J. Transglutaminase 2 Promotes Migration and Invasion of Lung Cancer Cells. Oncol. Res. 2018, 26, 1175–1182. [Google Scholar] [CrossRef] [PubMed]
- Sotiropoulou, G.; Zingkou, E.; Bisyris, E.; Pampalakis, G. Activity-Based Probes for Proteases Pave the Way to Theranostic Applications. Pharmaceutics 2022, 14, 977. [Google Scholar] [CrossRef] [PubMed]
- Hauser, S.; Sommerfeld, P.; Wodtke, J.; Hauser, C.; Schlitterlau, P.; Pietzsch, J.; Löser, R.; Pietsch, M.; Wodtke, R. Application of a Fluorescence Anisotropy-Based Assay to Quantify Transglutaminase 2 Activity in Cell Lysates. Int. J. Mol. Sci. 2022, 23, 4475. [Google Scholar] [CrossRef]
- Hirsch, J.D.; Eslamizar, L.; Filanoski, B.J.; Malekzadeh, N.; Haugland, R.P.; Beechem, J.M.; Haugland, R.P. Easily Reversible Desthiobiotin Binding to Streptavidin, Avidin, and Other Biotin-Binding Proteins: Uses for Protein Labeling, Detection, and Isolation. Anal. Biochem. 2002, 308, 343–357. [Google Scholar] [CrossRef] [PubMed]
- Atherton, E.; Logan, C.J.; Sheppard, R.C. Peptide Synthesis. Part 2. Procedures for Solid-Phase Synthesis Using Nα-Fluorenylmethoxycarbonylamino-Acids on Polyamide Supports. Synthesis of Substance P and of Acyl Carrier Protein 65-74 Decapeptide. J. Chem. Soc. Perkin Trans. 1 1981, 12, 538–546. [Google Scholar] [CrossRef]
- Gude, M.; Ryf, J.; White, P.D. An Accurate Method for the Quantitation of Fmoc-Derivatized Solid Phase Supports. Lett. Pept. Sci. 2002, 9, 203–206. [Google Scholar] [CrossRef]
- Stone, S.R.; Hofsteenge, J. Specificity of Activated Human Protein C. Biochem. J. 1985, 230, 497–502. [Google Scholar] [CrossRef] [PubMed] [Green Version]
- Bianchi, N.; Brugnoli, F.; Grassilli, S.; Bourgeois, K.; Keillor, J.W.; Bergamini, C.M.; Aguiari, G.; Volinia, S.; Bertagnolo, V. The Motility and Mesenchymal Features of Breast Cancer Cells Correlate with the Levels and Intracellular Localization of Transglutaminase Type 2. Cells 2021, 10, 3059. [Google Scholar] [CrossRef]
- Rheinwald, J.G.; Beckett, M.A. Tumorigenic Keratinocyte Lines Requiring Anchorage and Fibroblast Support Cultured from Human Squamous Cell Carcinomas. Cancer Res. 1981, 41, 1657–1663. [Google Scholar]
- Boukamp, P.; Petrussevska, R.T.; Breitkreutz, D.; Hornung, J.; Markham, A.; Fusenig, N.E. Normal Keratinization in a Spontaneously Immortalized Aneuploid Human Keratinocyte Cell Line. J. Cell Biol. 1988, 106, 761–771. [Google Scholar] [CrossRef] [Green Version]


| Compound | R | KI (µM) | kinact (min−1) | kinact/KI (×103 M−1 min−1) |
|---|---|---|---|---|
| 17 * |  | 1.0 ± 0.3 | 0.39 ± 0.10 | 409 ± 22 |
| 18 (NCEG2) * |  | 4.1 ± 2.1 | 2.33 ± 1.12 | 563 ± 13 |
| 22 |  | 1.3 ± 1.1 | 0.24 ± 0.07 | 188 ± 167 |
| 23 |  | n.d. | n.d. | 1186 ± 91 ** |
| 29 (NCEG-RHB) |  | n.d. | n.d. | 223 ± 3 ** |
| 31 * |  | 0.9 ± 0.5 | 0.46 ± 0.26 | 497 ± 33 |
| Compound | 17 | 18 (NCEG2) |
|---|---|---|
| cLog P * | 0.94 | −1.19 |
| Log D | <−2.73 | <−2.63 |
| −Log Pe | >9.02 | >8.79 |
| Papp(A-B) (10−6, cm/s) | 0.31 | 0.47 |
| Papp(B-A) (10−6, cm/s) | 0.42 | 0.56 |
| Efflux Ratio | 1.39 | 1.18 |
| Papp(A-B) (10−6, cm/s) + Pgp Inh. | 0.33 | 0.57 |
| Papp(B-A) (10−6, cm/s) + Pgp Inh. | 0.35 | 0.36 |
| Efflux Ratio + Pgp Inh. | 1.04 | 0.66 |
Disclaimer/Publisher’s Note: The statements, opinions and data contained in all publications are solely those of the individual author(s) and contributor(s) and not of MDPI and/or the editor(s). MDPI and/or the editor(s) disclaim responsibility for any injury to people or property resulting from any ideas, methods, instructions or products referred to in the content. |
© 2023 by the authors. Licensee MDPI, Basel, Switzerland. This article is an open access article distributed under the terms and conditions of the Creative Commons Attribution (CC BY) license (https://creativecommons.org/licenses/by/4.0/).
Share and Cite
Gates, E.W.J.; Calvert, N.D.; Cundy, N.J.; Brugnoli, F.; Navals, P.; Kirby, A.; Bianchi, N.; Adhikary, G.; Shuhendler, A.J.; Eckert, R.L.; et al. Cell-Impermeable Inhibitors Confirm That Intracellular Human Transglutaminase 2 Is Responsible for the Transglutaminase-Associated Cancer Phenotype. Int. J. Mol. Sci. 2023, 24, 12546. https://doi.org/10.3390/ijms241612546
Gates EWJ, Calvert ND, Cundy NJ, Brugnoli F, Navals P, Kirby A, Bianchi N, Adhikary G, Shuhendler AJ, Eckert RL, et al. Cell-Impermeable Inhibitors Confirm That Intracellular Human Transglutaminase 2 Is Responsible for the Transglutaminase-Associated Cancer Phenotype. International Journal of Molecular Sciences. 2023; 24(16):12546. https://doi.org/10.3390/ijms241612546
Chicago/Turabian StyleGates, Eric W. J., Nicholas D. Calvert, Nicholas J. Cundy, Federica Brugnoli, Pauline Navals, Alexia Kirby, Nicoletta Bianchi, Gautam Adhikary, Adam J. Shuhendler, Richard L. Eckert, and et al. 2023. "Cell-Impermeable Inhibitors Confirm That Intracellular Human Transglutaminase 2 Is Responsible for the Transglutaminase-Associated Cancer Phenotype" International Journal of Molecular Sciences 24, no. 16: 12546. https://doi.org/10.3390/ijms241612546
APA StyleGates, E. W. J., Calvert, N. D., Cundy, N. J., Brugnoli, F., Navals, P., Kirby, A., Bianchi, N., Adhikary, G., Shuhendler, A. J., Eckert, R. L., & Keillor, J. W. (2023). Cell-Impermeable Inhibitors Confirm That Intracellular Human Transglutaminase 2 Is Responsible for the Transglutaminase-Associated Cancer Phenotype. International Journal of Molecular Sciences, 24(16), 12546. https://doi.org/10.3390/ijms241612546