1. Introduction
Nonalcoholic fatty liver disease (NAFLD) covers a spectrum ranging from nonalcoholic fatty liver (NAFL) to nonalcoholic steatohepatitis (NASH). NAFL shows simple steatosis alone with a benign prognosis in general. However, NASH, characterized by steatosis, ballooning degeneration, inflammation, and fibrosis, is a potentially progressive liver disease that can progress to liver cirrhosis and hepatocellular carcinoma (HCC) [
1]. The progression of NAFL to NASH is explained by the “multiple hit” hypothesis. Increased hepatic fat and insulin resistance at the onset of NAFL represent a “first hit” and other “hits” are required for NAFL to progress into NASH [
2]. Among these hits, platelets (PLTs) are now known to have novel roles, especially in hepatic inflammation [
3], and are considered potent mediators of innate immunity and inflammation [
4]. A decrease in PLT count and an increase in mean PLT volume reflect the severity of NASH in patients and are regarded as risk and prognostic factors for NASH. The changes in these values indicate augmentation of PLT activation and PLT consumption in NASH [
5,
6]. Recently, anti-PLT therapy has been suggested as a promising therapeutic target for NASH and subsequent HCC [
7,
8].
The roles of PLTs in the pathogenesis of atherosclerosis have been well established. Monocytes recruited to blood vessels differentiate into macrophages and turn into foam cells while phagocytosing low-density lipoprotein. Activated PLTs facilitate monocyte recruitment and introduce an inflammatory milieu. In advanced atherosclerotic plaques, however, intraplaque hemorrhage occurs and augments erythrophagocytosis [
9]. The cholesterol content of the RBC membrane leads to lipid deposition in the plaque. Moreover, hemoglobin and its metabolites (heme, iron) possess proinflammatory and pro-oxidative abilities with consequent macrophage ferroptosis, eventually falling into a vicious cycle throughout the progression of atherosclerosis [
10]. The roles of macrophages, PLTs, and erythrocytes in NASH are thought to be comparable to their roles in atherosclerosis. Activated PLTs contribute to activating Kupffer cells and progressing NASH to HCC [
8]. Activated PLTs also induce phosphatidylserine (PS) exposure on the red blood cell (RBC) membrane with resultant erythrophagocytosis [
11]. In physiologic states, erythrophagocytosis and iron recycling mainly occur in the spleen. However, when the requirement for the removal of PS-positive erythrocytes increases, the primary organ of erythrophagocytosis shifts from the spleen to the liver [
12]. Increased erythrophagocytosis in the NASH liver causes iron deposition in the liver, with each promoting the other, consequently accelerating ferroptosis and NASH progression [
13,
14,
15].
Cilostazol is an anti-PLT drug that inhibits phosphodiesterase 3A (PDE3A) and phosphodiesterase 3B (PDE3B). PDE3A is mainly expressed in PLTs, cardiac ventricular myocytes, and vascular smooth muscle myocytes, whereas PDE3B is abundant in hepatocytes and adipocytes [
16]. PDE3A inhibition by cilostazol blocks the PLT activation cascade by increasing the level of cAMP, which reduces intracellular calcium levels and induces protein kinase A (PKA) activity [
17]. Cilostazol also shows lipid-lowering effects in many reports, including in vivo and human studies. Decreased levels of triglyceride, cholesterol, and remnant lipoprotein and increased levels of high-density lipoprotein were observed in the blood, liver, and atherosclerotic plaques [
18]. It is thought that elevated PKA levels caused by PDE3B inhibition result in the upregulation of lipoprotein lipase in adipose tissue and the downregulation of lipogenesis in the liver. In addition, PKA-mediated activation of cAMP-response-element-binding-protein (CREB) by cilostazol shows anti-inflammatory effects, including downregulation of NF-κB and TNF-α and upregulation of IL-10. Cilostazol dampens ROS production by suppressing CYP2E1. Additionally, cilostazol has anti-apoptotic effects by inhibiting the activation of BAX and caspase-3 and the formation of the death-inducing signaling complex (DISC) initiated by FasR-FasL binding [
16].
In the present study, we observed that PLT and erythrophagocytosis impact NASH progression and that cilostazol prevents ectopic erythrophagocytosis and mitigates hepatic iron overload (HIO)-mediated ferroptosis, alleviating NASH progression.
3. Discussion
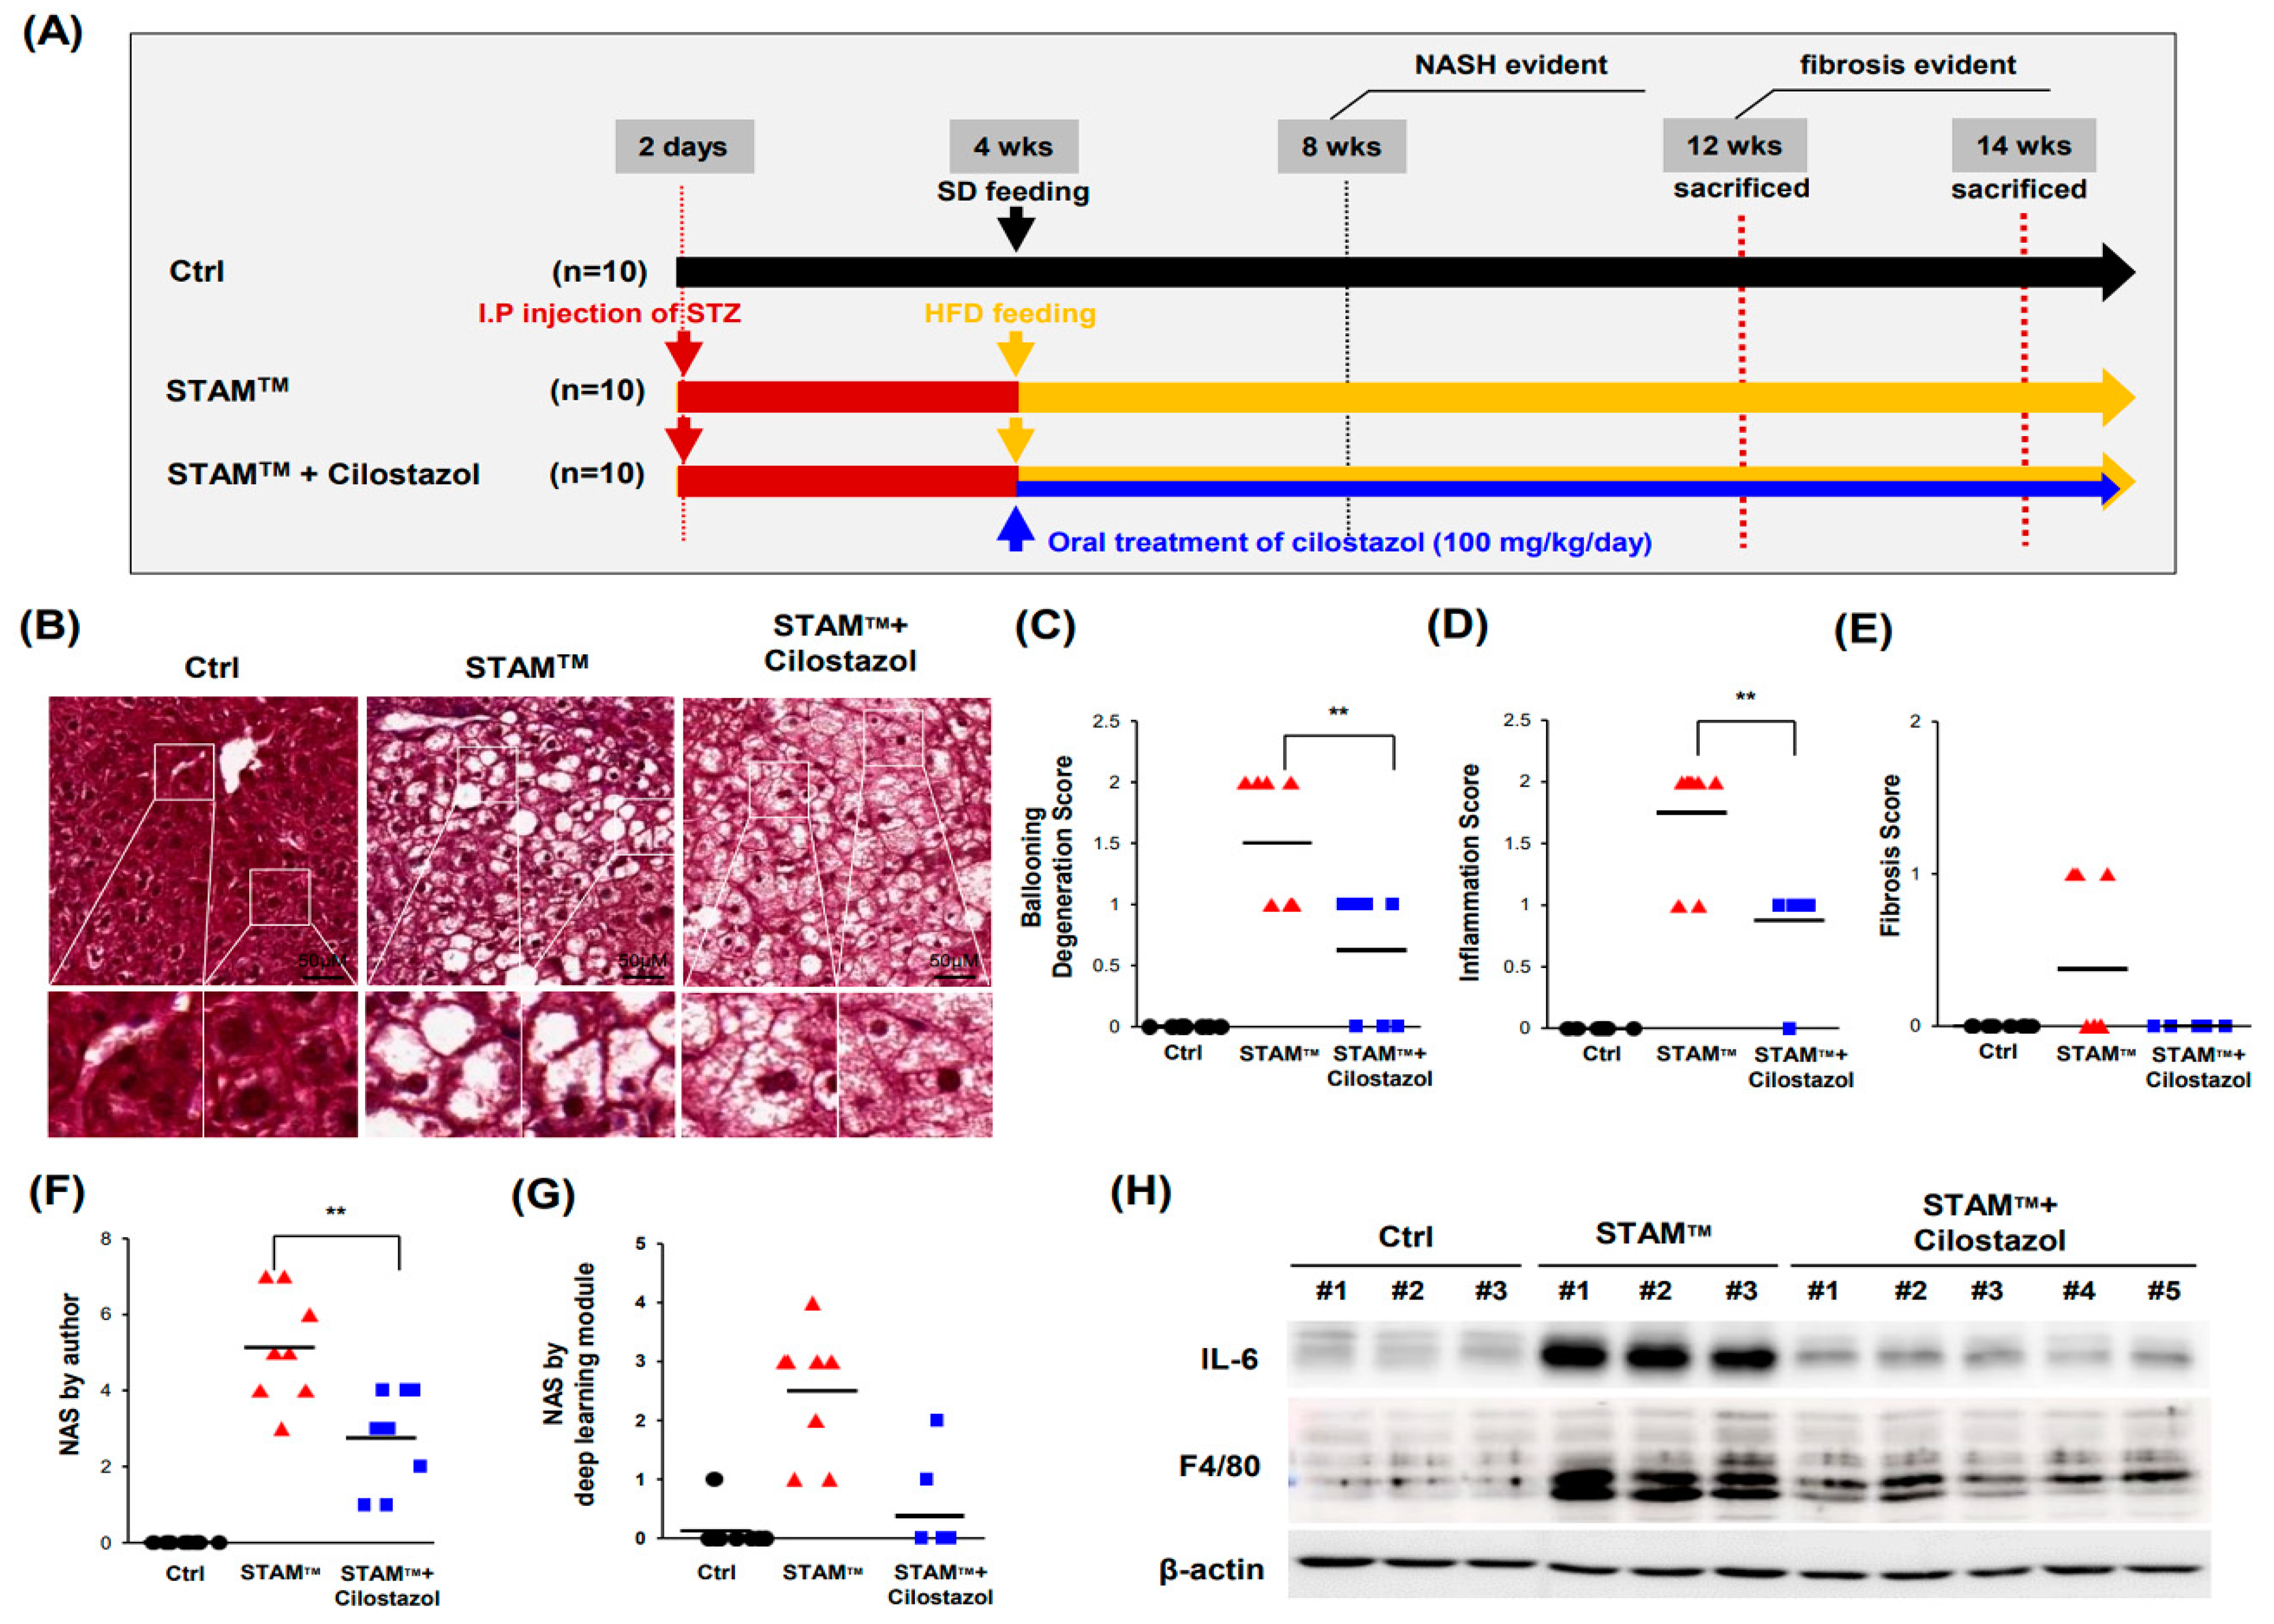
The present study demonstrated that cilostazol has potential therapeutic effects in ameliorating the pathological progression of NASH. The STAM
TM NASH mice model used in this study offers the advantage of monitoring the natural progression from simple hepatic steatosis to NASH and fibrosis in a relatively controllable manner. It defines the onset of NASH and fibrosis as occurring between 6–8 weeks and 9–12 weeks respectively. We previously illustrated that cilostazol ameliorates HFD-induced hepatic steatosis by lowering blood lipids through an energy sensor, AMPK [
17]. However cilostazol ameliorated ballooning degeneration and inflammation in NASH livers, it did not improve lipid or glucose profiles. These findings suggest that the efficacy of cilostazol in the amelioration of NASH appears by different mechanisms from previous studies.
There is accumulating evidence for the involvement of hepatic (programmed) cell death including apoptosis and necroptosis in the pathogenesis of NASH. Thus, the cytokeratin 18 (CK18) fragment and receptor-interacting serine/threonine-protein kinase 3 (RIPK3) or mixed lineage kinase domain-like protein (MLKL) are often used as the diagnostic biomarkers in NASH because CK18 is released from apoptotic hepatocytes and RIPK3 and MLKL, are upregulated in necroptosis [
24,
25]. On the other hand, ferroptosis is a recently identified programmed necrosis, which is characterized by excess iron accumulation and lipid peroxidation [
23]. Peroxidation of accumulated lipids may play an important role in the pathogenesis of NASH because it is considered to trigger hepatocellular injury, hepatic fibrogenesis, and the carcinogenesis of hepatocytes. In contrast to strictly controlled apoptosis, cells undergoing ferroptosis release proinflammatory factors, such as damage-associated molecular pattern molecules called DAMPs [
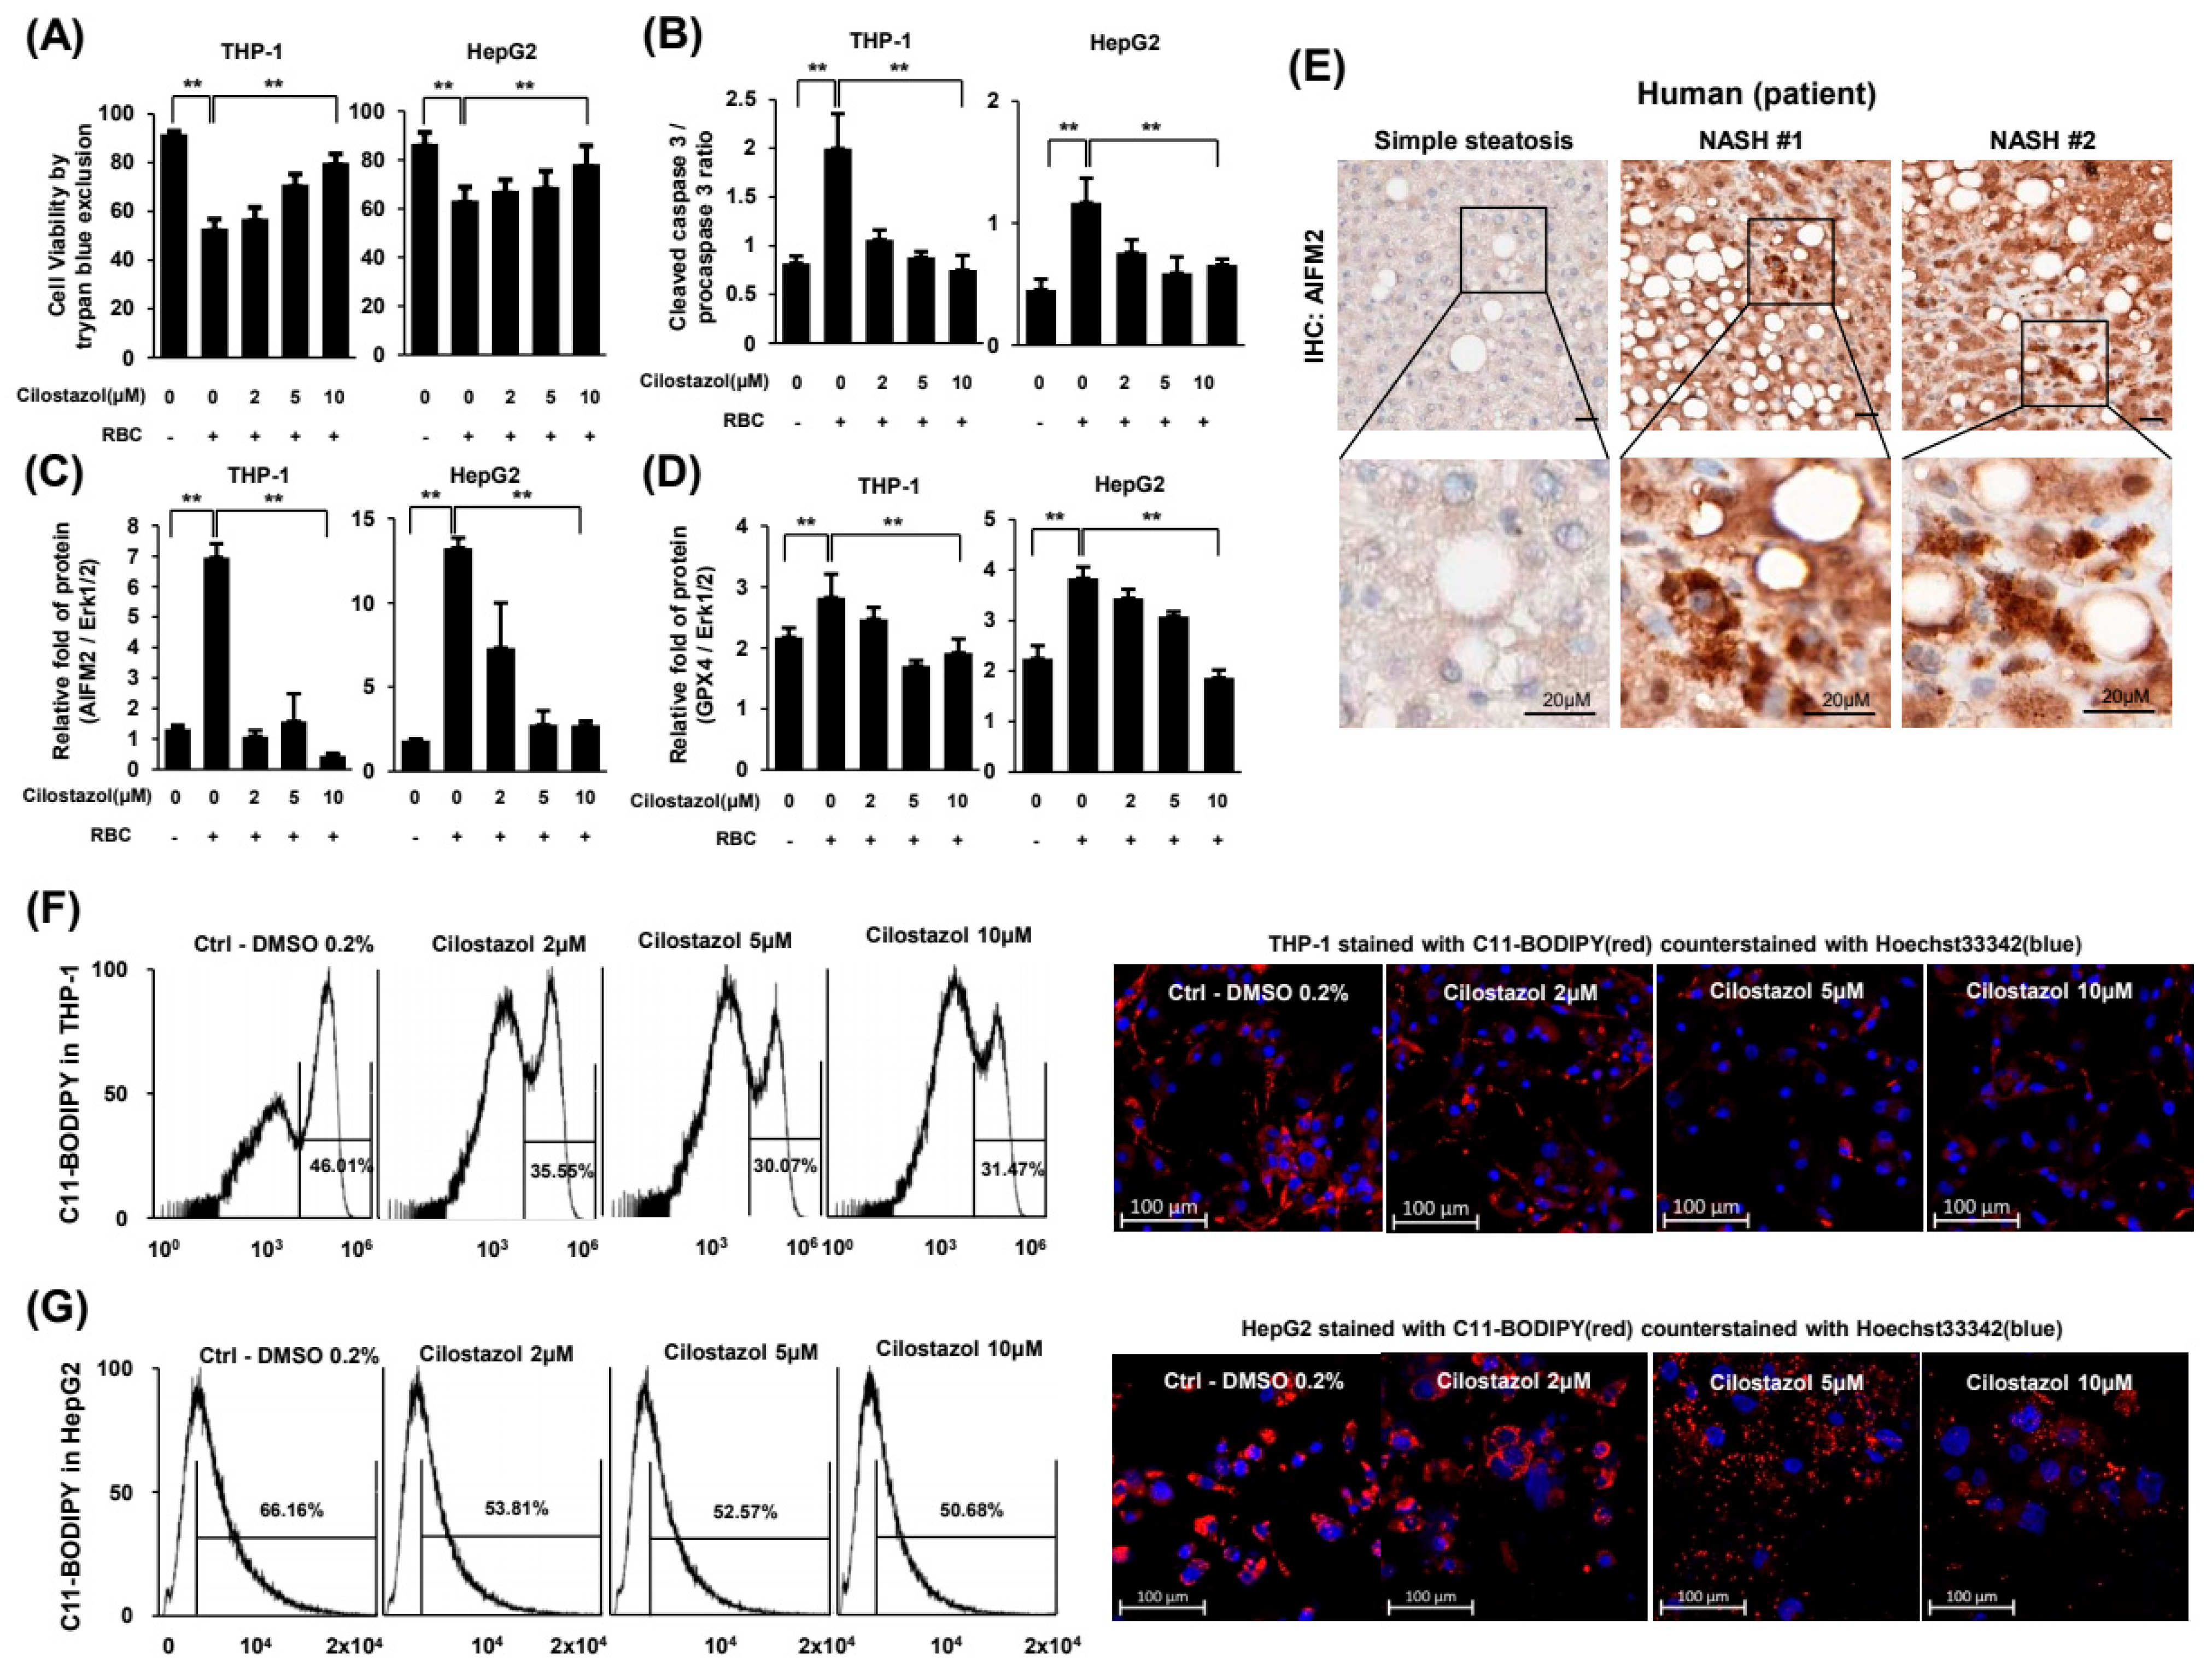
26]. The released DAMPs damage neighboring cells and eventually induce ferroptosis, generating a vicious cycle. In coculture experiments with HepG2 and THP-1 cells, GPX4 and AIFM2, which are markers of ferroptosis, were upregulated when THP-1 cells phagocytosed RBCs. Our findings indicate that ferroptosis underlies hepatic damage induction in NASH. Another important marker of ferroptosis, lipid peroxide, was also exacerbated in NASH in vitro.
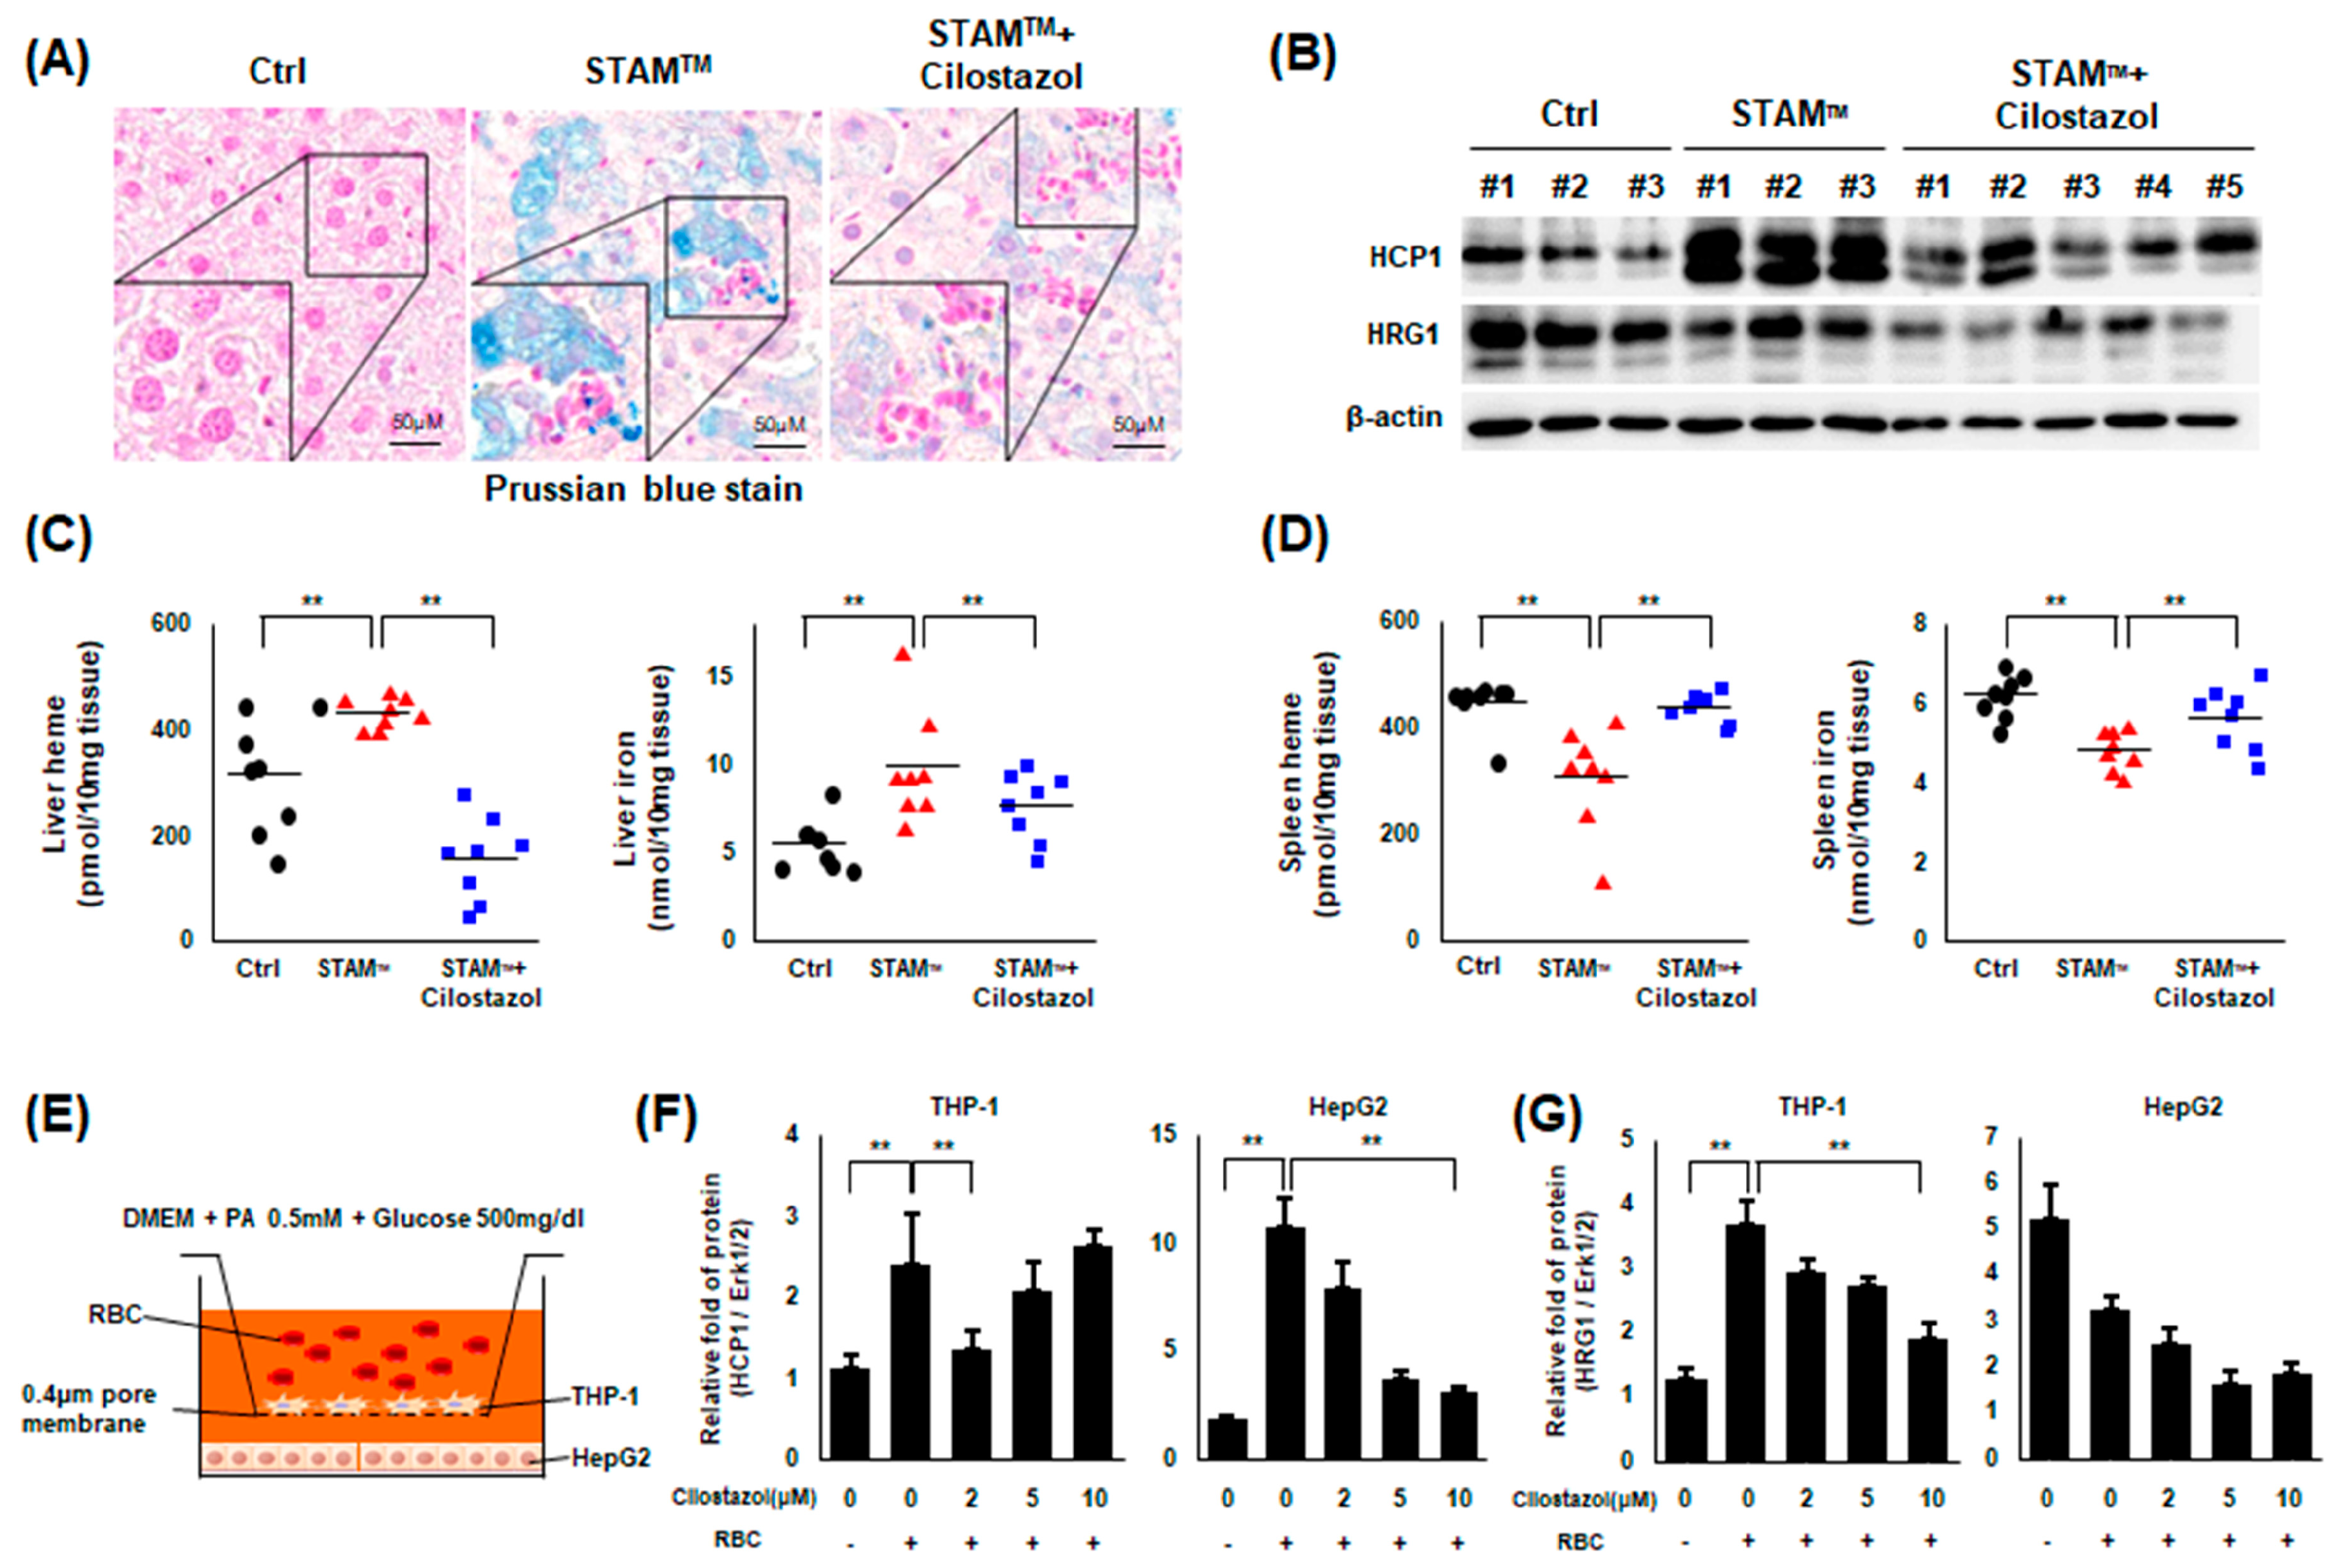
HIO is an emerging issue commonly found in NAFLD and an exacerbating factor of NAFLD itself [
14,
15]. HIO is a frequent finding in the NAFLD population and is an aggravating factor for NAFLD. Some groups even suggest phlebotomy as a treatment option for NAFLD with HIO [
27]. We previously reported that iron accumulates in NAFLD patients and in in vitro and in vivo NAFLD models and that recombinant fibroblast growth factor 21 (FGF21) ameliorates NAFLD by attenuating HIO [
14]. In the present study, we observed an increase in hepatic iron input through upregulated erythrophagocytosis in NASH livers, indicating that increased erythrophagocytosis is a major mechanism of HIO in NASH. Iron overload in the NASH liver is an aggravating factor for NASH itself because iron acts as a generator of ROS, which is a major pathogen of NASH. To date, the origin of iron in NASH liver remains unclear, but our findings suggest that hepatic erythrophagocytosis may be a significant iron source in the livers of patients with NASH. Cilostazol seems to ameliorate NASH by reducing HIO.
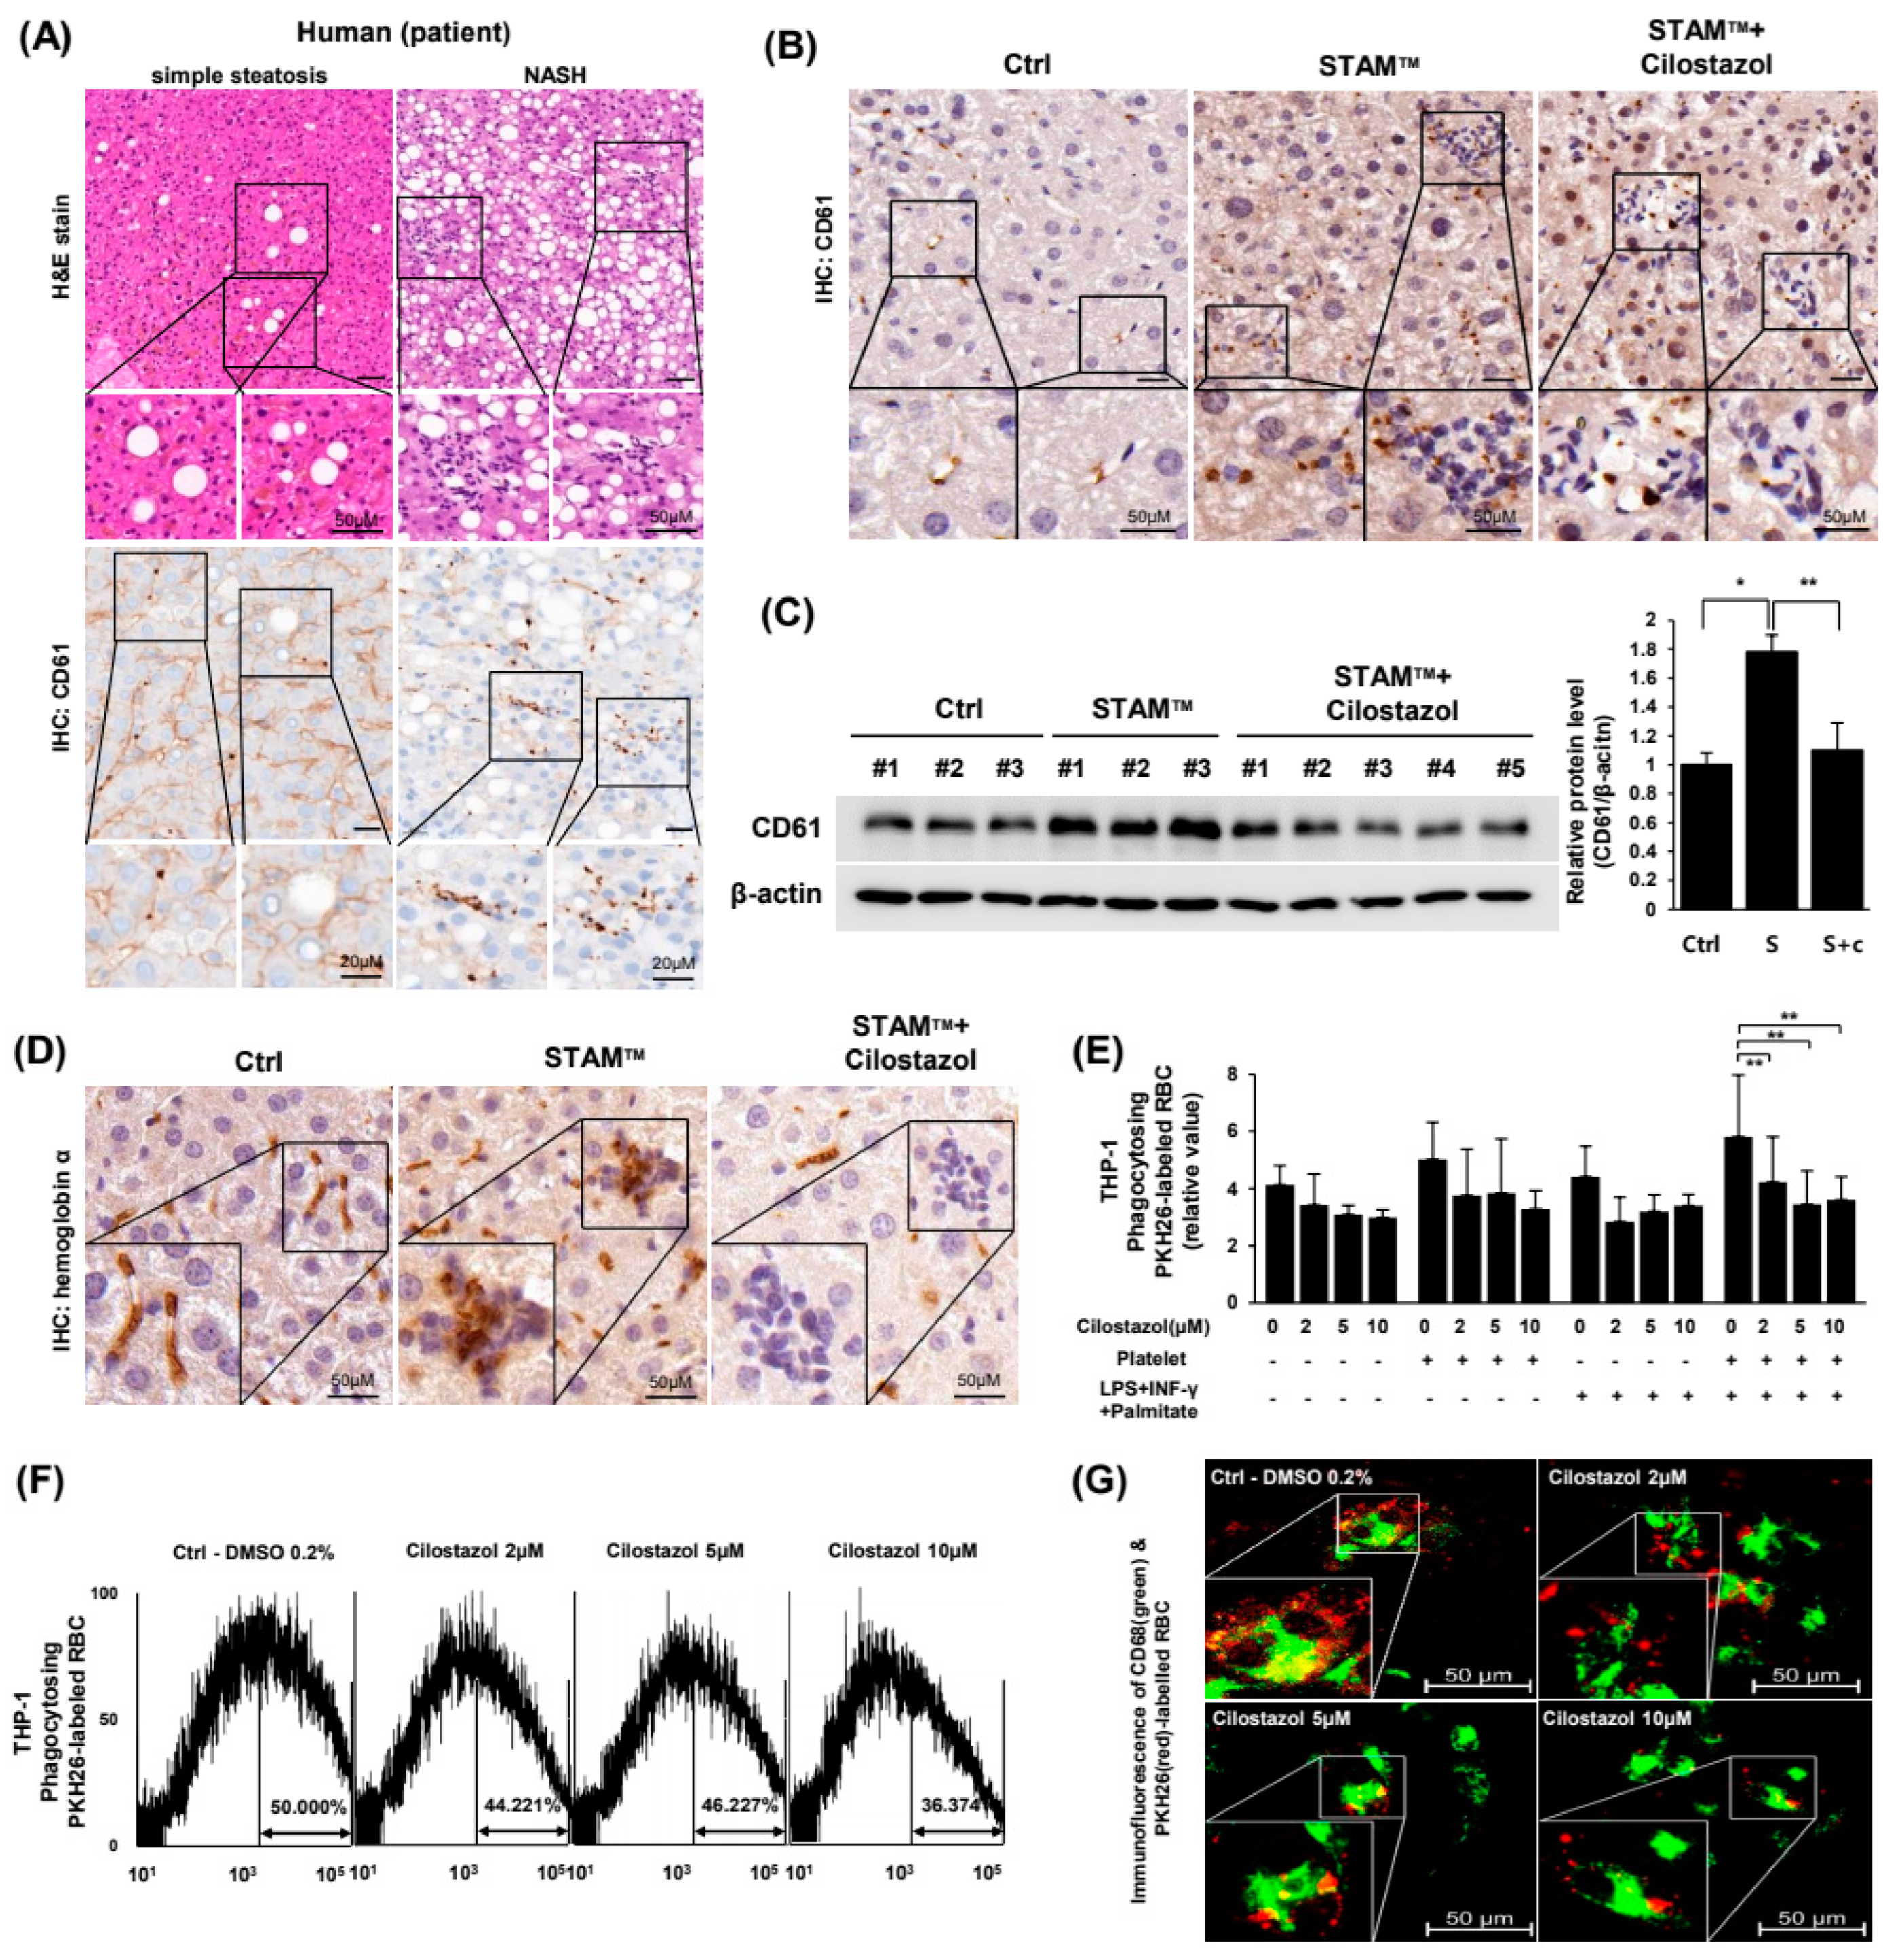
Erythrophagocytosis in NAFLD liver is thought to be increased by activation of Kupffer cells and reduction of RBC lifespan. Recent studies of NAFLD/NASH highlight the roles of PLTs in provoking and aggravating NAFLD. The known roles of PLTs in NAFLD are mostly associated with proinflammatory effects in the liver, which may eventually lead to NASH-cirrhosis-HCC progression [
3]. A report showed that PLTs activate membrane-bound FasL to induce apoptosis in other cells [
28]. Another study reported that phosphatidylserine externalization at the RBC membrane is the result of the PLT-RBC interaction caused by FasL-FasR binding and that gene deletion of either FasL or FasR reduces phosphatidylserine exposure of RBCs and PLTs [
11]. Overall, the data suggest that the role of PLTs in inducing HIO is the result of erythrophagocytosis induction in the liver and proinflammatory effects. We, in the present study, observed PLT-RBC binding and hepatic iron accumulation in NASH models.
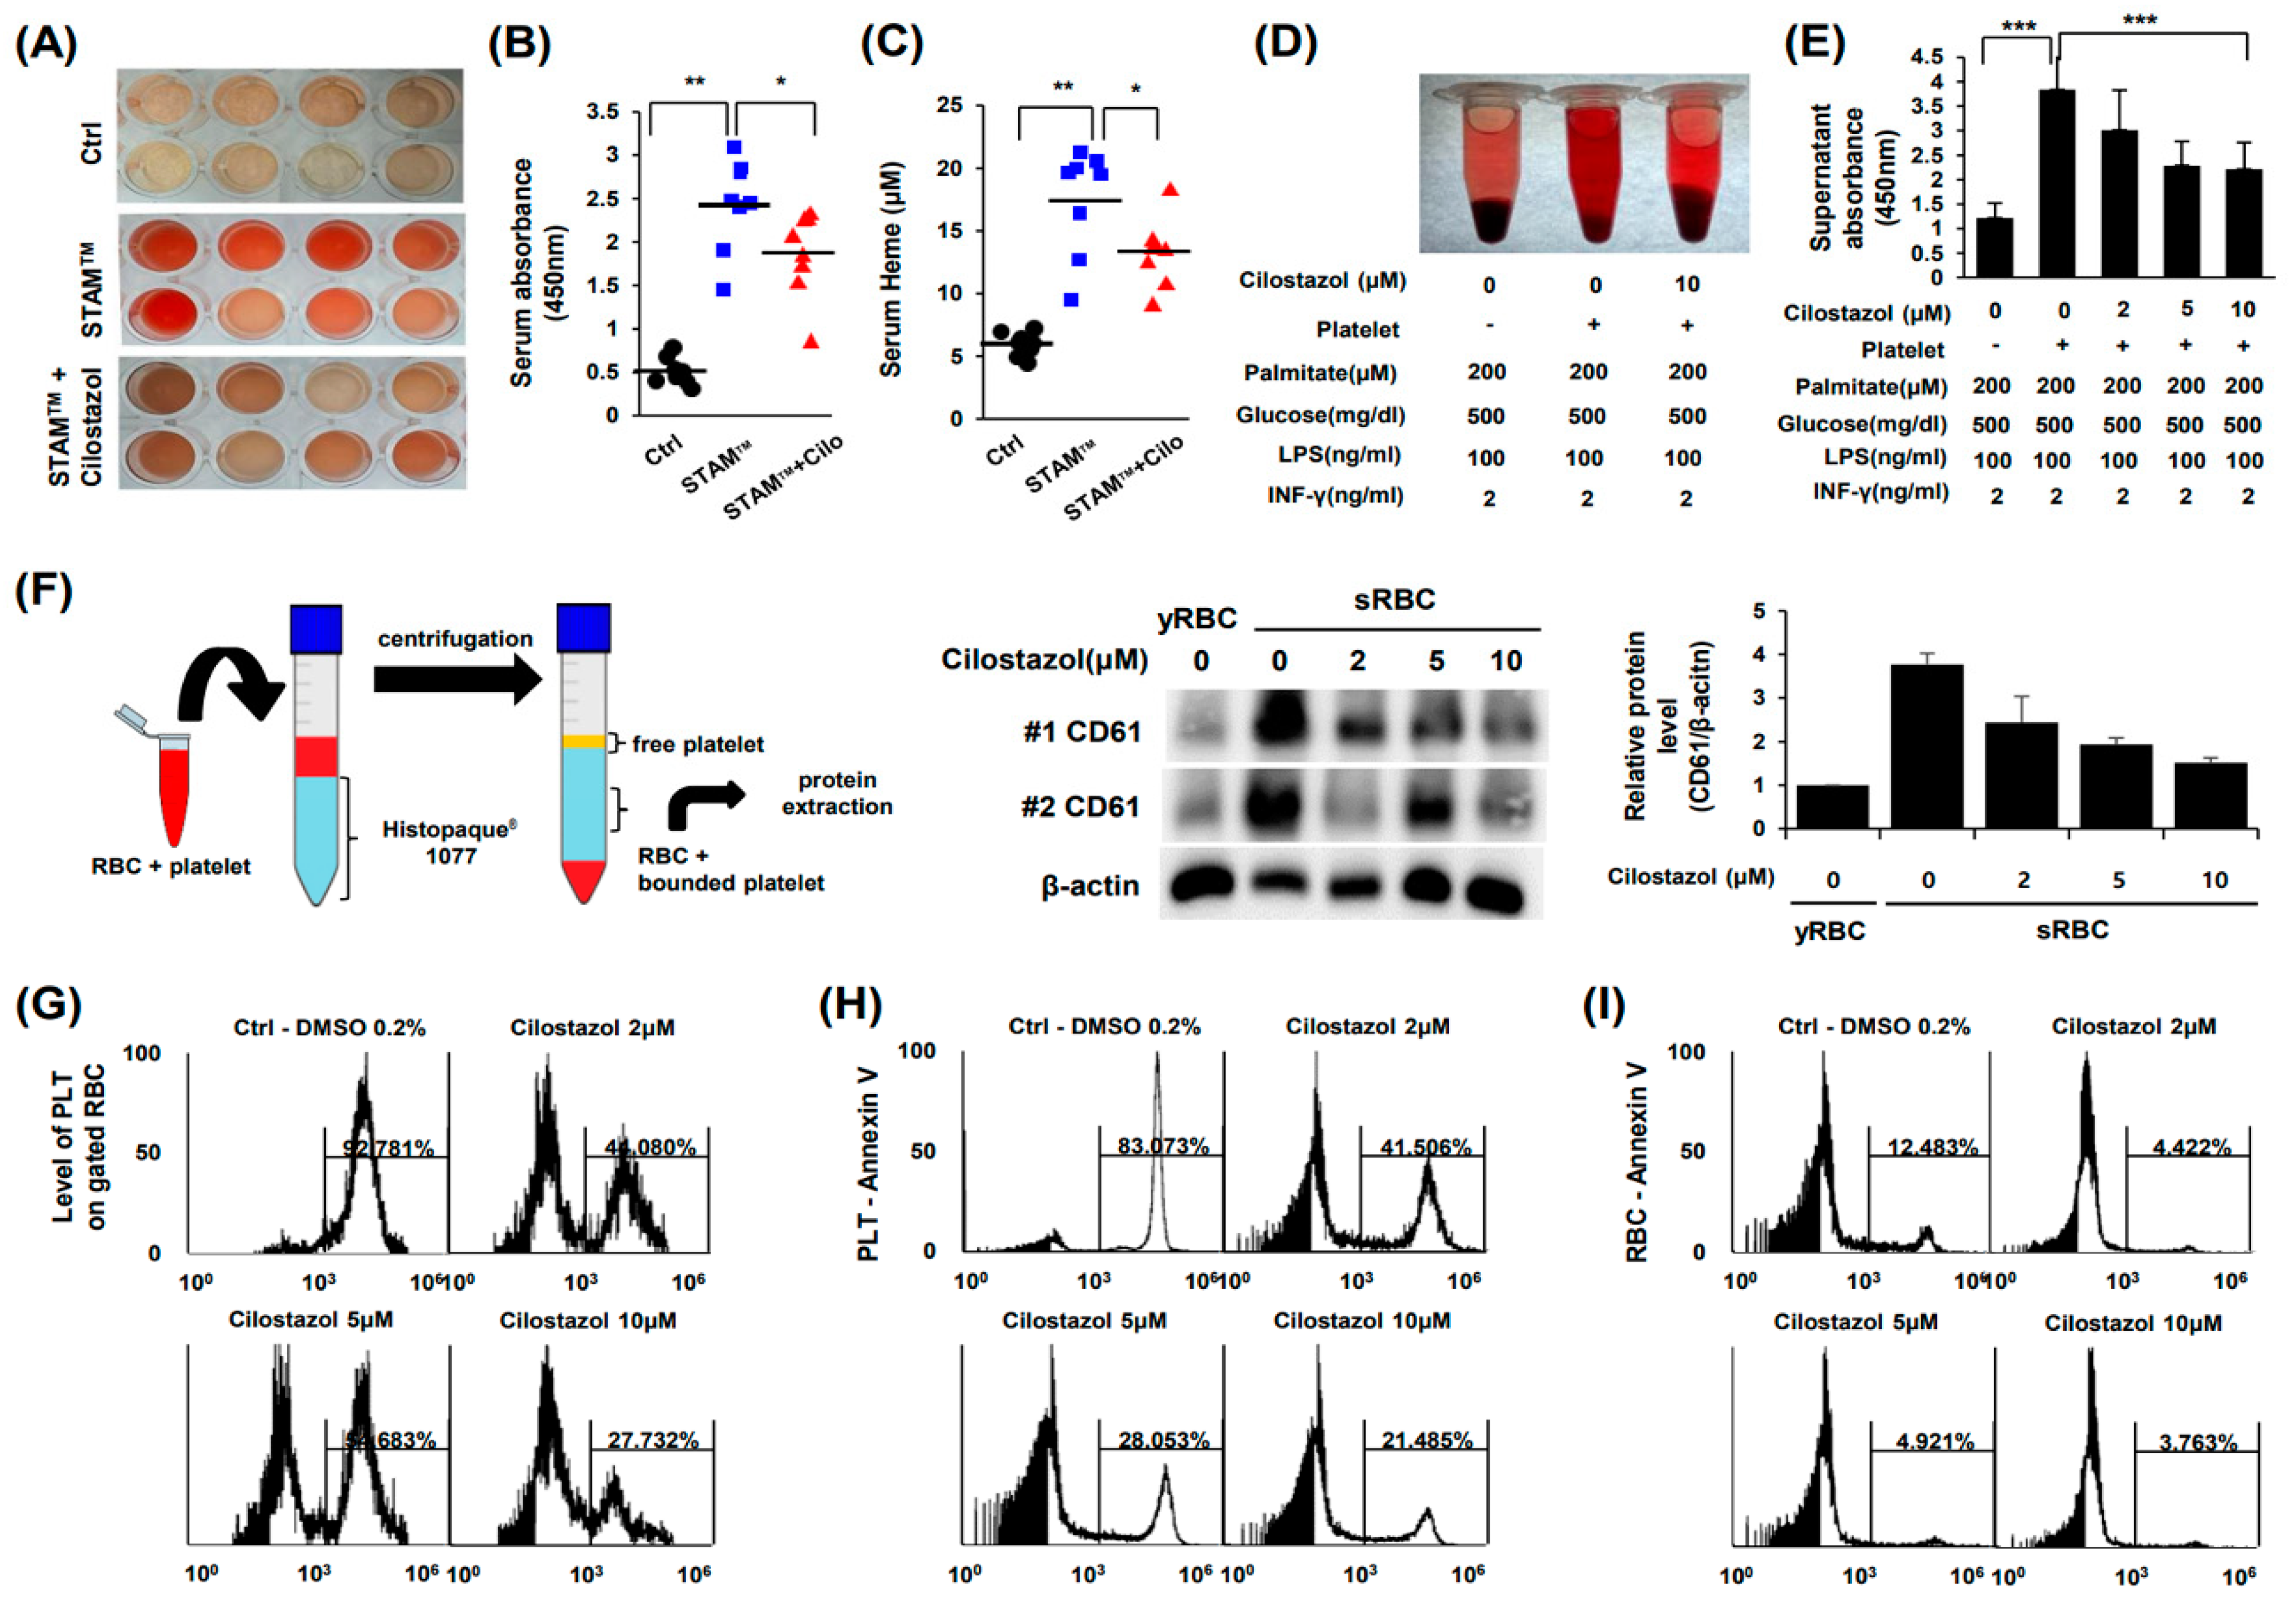
Cilostazol is an anti-PLT drug. There is a report suggesting that aspirin and clopidogrel did not suppress PLT-mediated induction of phosphatidylserine exposure in RBCs [
11]. In the present study, we found that cilostazol inhibited the interaction between PLTs and RBCs and consequently inhibited phosphatidylserine exposure in RBCs. Although RBCs can undergo apoptosis in certain circumstances, such as sepsis and malaria, this pathway is limited because RBCs are anucleate cells [
29,
30]. The disposal of RBCs largely depends on erythrophagocytosis by splenic macrophages. However, when the demand for RBC disposal is excessive, hepatic macrophages perform erythrophagocytosis in the liver [
12]. We found that hepatic erythrophagocytosis is exacerbated by activated PLTs, and cilostazol treatment alleviated this hepatic erythrophagocytosis in NASH, which mainly depends on the inhibition of PLT-mediated phosphatidylserine exposure of the RBC membrane.
Taken together, the NASH liver seems to fall into a vicious cycle through the following successive mechanisms: PLT activation—RBC fragility—intrahepatic erythrophagocytosis—heme-induced iron overload—ferroptosis. Cilostazol has therapeutic potential through the suppression of this vicious cycle. We further evaluated liver tissue to examine the effect of cilostazol on the progression of NASH, focusing on tumorigenesis. Fourteen-week-old STAM
TM mice showed a well-circumscribed mass composed of cells with nuclear atypia forming the trabecular pattern, histologically consistent with well-differentiated hepatocellular carcinoma. In contrast, cilostazol-administered 14-week-old STAM
TM mice exhibited no definite mass-like lesion (
Figure S2). These results support our hypothesis that cilostazol prevents progression to HCC by inhibiting NASH. Further studies are needed to explore the molecular pathway of cilostazol’s effects on erythrophagocytosis.
In conclusion, this study elucidates the pivotal role of cilostazol in understanding and treating the complex pathological process of NASH. We have identified that cilostazol mitigates NASH through a sequential mechanism involving the suppression of PLT activation, RBC fragility, intrahepatic erythrophagocytosis, heme-induced iron overload, and ferroptosis. These findings suggest a significant therapeutic potential for cilostazol in the treatment strategy for NASH patients, particularly focusing on the pathology related to iron overload. The results contribute to the development of therapeutic approaches targeting the intricate interplay of these factors. However, it must be noted that this study was conducted in specific animal models, and further research is required to broaden our understanding of cilostazol’s effects and apply them in a clinical context. Specifically, a deeper understanding of cilostazol’s long-term effects, safety, and interactions with other NASH-related factors is imperative. The insights gained from this study pave the way for future investigations into the molecular pathways of cilostazol’s effects on erythrophagocytosis, offering a promising avenue for the prevention and management of NASH and potentially halting its progression to more severe liver conditions such as HCC.
4. Materials and Methods
4.1. Human Pathology Samples
This study included 5 unrelated subjects who had undergone a liver biopsy at the Dong-A University Medical Center (Busan, Republic of Korea). Five subjects were proven to have NAFLD histopathologically. NAFLD patients consisted of two cases of simple steatosis and three NASH cases. Patients with secondary causes of steatosis, including alcohol abuse, liver diseases other than NAFLD, total parenteral nutrition, and the use of drugs known to precipitate steatosis, were excluded. The study was approved by the Institutional Review Board of Dong–A University Medical Center (2-1040709-AB-N-01-202202-BR-001-02).
4.2. Animal Model
Male C57BL/6J mice were purchased from Samtako, Inc. (Osan, Republic of Korea). The NASH model named STAM
TM was induced according to the method used by Fujii et al. [
19]. and consisted of a single subcutaneous injection of 200 µg streptozotocin on the second day after birth and feeding with a high-fat diet (5.1 kcal/g, with 60% of calories from fat, 20% from protein and 20% from carbohydrate) starting from 4 weeks of age. The cilostazol group was fed a high-fat diet containing 0.1% cilostazol (Pletaal, Korea Otsuka Pharmaceutical Co., Seoul, Republic of Korea) ad libitum at approximately 100 mg/kg per day. Mice were sampled at 12 weeks of age. All mouse procedures were approved by the Committee on Animal Investigation at Dong-A University (DIACUC-18-7).
4.3. Analysis of Lipid Metabolites
Plasma total cholesterol (TC), triglyceride (TG), and nonesterified fatty acids (NEFA) were measured using an enzymatic, colorimetric test kit (Asan Pharmaceutical Co., Seoul, Republic of Korea).
4.4. Intraperitoneal Glucose Tolerance Tests (GTTs) and Insulin Tolerance Tests (ITTs)
Mice were fasted for 6 h. Plasma glucose concentrations were measured in tail blood using a GlucoDr Blood Glucose Test Strip (Hasuco, Seoul, Republic of Korea) prior to and 15, 30, 60, 90, and 120 min after intraperitoneally injecting a bolus of glucose (3 mg/g) for the GTT and at the same time points after intraperitoneally injecting 0.75 U/kg body weight insulin for the ITT.
4.5. Histology
Liver tissues were fixed in 4% paraformaldehyde, embedded in paraffin, and sectioned to a thickness of 4 μm. Microscopic analysis of whole slides was performed using a Pannoramic MIDI-II Scanner (3D Histech, Budapest, Hungary). Trichrome staining (Polysciences, Inc., Warrington, PA, USA, #25088-1) was scored by the authors according to Kleiner’s NAS system and by a deep-learning module established by Heinemann et al. [
19,
20] High magnification tiles (299 × 299 px
2 at 0.44 μm/px) were obtained to analyze ballooning degeneration, inflammation and steatosis, and low magnification tiles (299 × 299 px
2 at 1.32 μm/px) were generated to analyze fibrosis.
4.6. Immunohistochemistry
Immunohistochemistry was performed with primary antibody at 4 °C overnight and then with a matching biotinylated secondary antibody for 1 h at RT. 3,3′-diaminobenzidine (Sigma, St. Louis, MO, USA) was used as chromogen for 2–5 min with hydrogen peroxide substrate following counterstain with hematoxylin. The antibodies used in the above experiment are against anti-hemoglobin α (Abcam, Cambridge, MA, USA, ab92492), and CD61 (Cell signaling, Danvers, MA, USA, #13166) was performed manufacturer’s instruction.
4.7. Preparation of RBCs and PLTs
Fresh blood from healthy volunteers was collected in acid citrate dextrose tubes (ACD-A, BD Vacutainer®, Becton, Dickinson and Company, Franklin Lakes, NJ, USA) and centrifuged at 900× g and 16 °C for 5 min. All procedures with blood sampling were approved by the Institutional Review Board of Dong-A University (2-1040709-AB-N-01-202202-BR-001-02). The lower 1/3rd volume of plasma was centrifuged at 1000× g and 16 °C for 10 min. The platelet pellet was suspended in Ca2+-free PBS. RBCs were obtained from the red pellet following the first centrifugation and washed 3 times with Ca2+-free PBS. Senescent RBCs were prepared by incubating RBCs at 42 °C for 2 h. RBCs and PLTs were stored at 4 °C.
4.8. Cell Culture
THP-1 human monocytic cells obtained from Korean Cell Line Bank were maintained in Roswell Park Memorial Institute medium (RPMI 1640, Gibco, Gaithersburg, MD, USA) containing 10% (v/v) heat-inactivated FBS, 50 mg/mL streptomycin, 50 U/mL penicillin (Gibco) and 0.05 uM 2-mercaptoethanol (Sigma) at 37 °C in a humid atmosphere of 5% CO2. THP-1 cells were differentiated to M1 phenotype with 150 nM PMA for 24 h and subsequently incubated with 100 ng/mL LPS and 2 ng/mL INF-γ for 24 h. HepG2 cells obtained from the American Type Culture Collection were maintained in Dulbecco’s Modified Eagle’s Medium with 10% (v/v) heat-inactivated FBS, 50 mg/mL streptomycin, 50 U/mL penicillin (Gibco) at 37 °C in a humid atmosphere of 5% CO2. SPLInsertTM hanging type was used to co-culture HepG2 and THP-1.
4.9. Coculture System
To create a coculture system of HepG2 and THP-1 cells, we used the SPLInsertTM hanging type. Two plates were separated with a 0.4 μm porous membrane. HepG2 cells were seeded in 6-well plates, and THP-1 cells were seeded and differentiated in the inner plate, which was also a 6-well plate. THP-1 cells were incubated with 150 nM PMA for 24 h to induce differentiation into the M1 phenotype and subsequently incubated with 100 ng/mL LPS and 2 ng/mL INF-γ for 24 h. After the differentiation of THP-1 cells, the inner plate of THP-1 cells was relocated to a 6-well plate of HepG2 cells. The medium was replaced with fresh medium containing 0.2% (w/v) BSA-conjugated 500 μM palmitate, 100 ng/mL LPS, 2 ng/mL INF-γ, and cilostazol. Then, RBCs were treated only on the inner plate.
4.10. Hemolysis Analysis
Blood was gently collected with an 18G needle syringe and stored at room temperature for 1 h; then, serum was isolated by centrifugation at 1000× g for 10 min. To evaluate hemolysis quantitatively, spectrophotometric absorbance of the serum at a wavelength of 450 nm, which indicates the amount of hemoglobin in the serum, was measured. Heme assays (Mybiosource, San Diego, CA, USA, #MBS841599) and analysis of the level of the heme scavenger protein hemopexin (Mybiosource, #MBS2704013) were performed according to the manufacturer’s instructions.
4.11. In Vitro Simulation of NASH and RBC-PLT Interaction Assay
To make RBCs senescent, RBCs were incubated at 42 °C for 2 h. To make comparable in vitro conditions to the in vivo NASH model, RBCs, and PLTs were suspended in Ca2+-free PBS with or without cilostazol and were subjected to metabolic stresses (0.2 mM palmitate and 500 mg/dL glucose) and inflammatory stresses (100 ng/mL LPS and 2 ng/mL INF-γ). Then, 10% (v/v) RBC suspension and 3% (v/v) platelet-rich plasma were added, and the cells were incubated for 6 h. The absorbance of the supernatant at 450 nm was measured to evaluate hemolysis. RBCs and RBC-bound PLTs were separated from PLTs by centrifugation at 1000× g for 10 min with Histopaque®-1077 media.
4.12. Erythrophagocytosis Assay
For the PLT-RBC interaction assay, RBCs and PLTs were labeled with PKH26 and PKH67 dyes (Sigma), respectively. For the erythrophagocytosis assay, RBCs were labeled as described above. THP-1 cells were incubated with CD68 (Cell Signaling, #76437) primary antibodies and then with goat anti-rabbit IgG Alexa Fluor® 488 conjugate (Invitrogen) secondary antibodies. BODIPYTM 581/591 C11 (Invitrogen, Carlsbad, CA, USA) was used to detect ROS in HepG2 and THP-1 cells with Hoechst 33342 counterstaining (Invitrogen). Flow cytometry was analyzed with AttuneTM NxT Cytometer (Invitrogen) equipped with a 488 nm excitation laser—530/30 nm emission filter and a 561 nm excitation laser—585/16 nm emission filter. Data from the AttuneTM NxT Cytometer were acquired and visualized by AttuneTM CytPixTM flow cytometers (Invitrogen). RBC and PLT contact was presented as the percentage of RBCs bound to PLTs to total RBCs. Fluorescence images were observed using an LSM 800 confocal microscope (Zeiss, Gottingen, Germany). For microplate fluorescence photometry, THP-1 cells seeded on plates were differentiated by 24 h of incubation with 150 nM PMA and 24 h of subsequent incubation with 100 ng/mL LPS and 2 ng/mL INF-γ. The medium containing RBCs, PLTs, 0.2% (w/v) BSA-conjugated 500 μM palmitate, 100 ng/mL LPS, and 2 ng/mL INF-γ was then replaced. The cell ratio of THP-1 cells/RBCs/PLTs was 1:10:10. After incubation for 1 h, the plates were washed and analyzed. A SpectraMax® M microplate reader (Molecular Devices, San Jose, CA, USA) was used to measure fluorescence intensity in 96-well plates. Except for 96-well-plate fluorescence, erythrophagocytosis assays were performed without platelets due to clotting control difficulties.
4.13. Ferroptosis Assay
Cell viability was determined by a trypan blue exclusion assay. The amount of cell death was quantified by the ratio of cleaved caspase-3 to procaspase-3. The expression levels of GPX4 and AIFM2, which have anti-lipid peroxidation activity and block cells from ferroptosis, were analyzed by western blot assay. To evaluate lipid peroxidation, a key feature of ferroptosis, HepG2 and THP-1 cells were stained with BODIPYTM 581/591 C11 (Invitrogen) to detect ROS with Hoechst 33342 counterstaining (Invitrogen). Flow cytometry and confocal microscopy were undertaken.
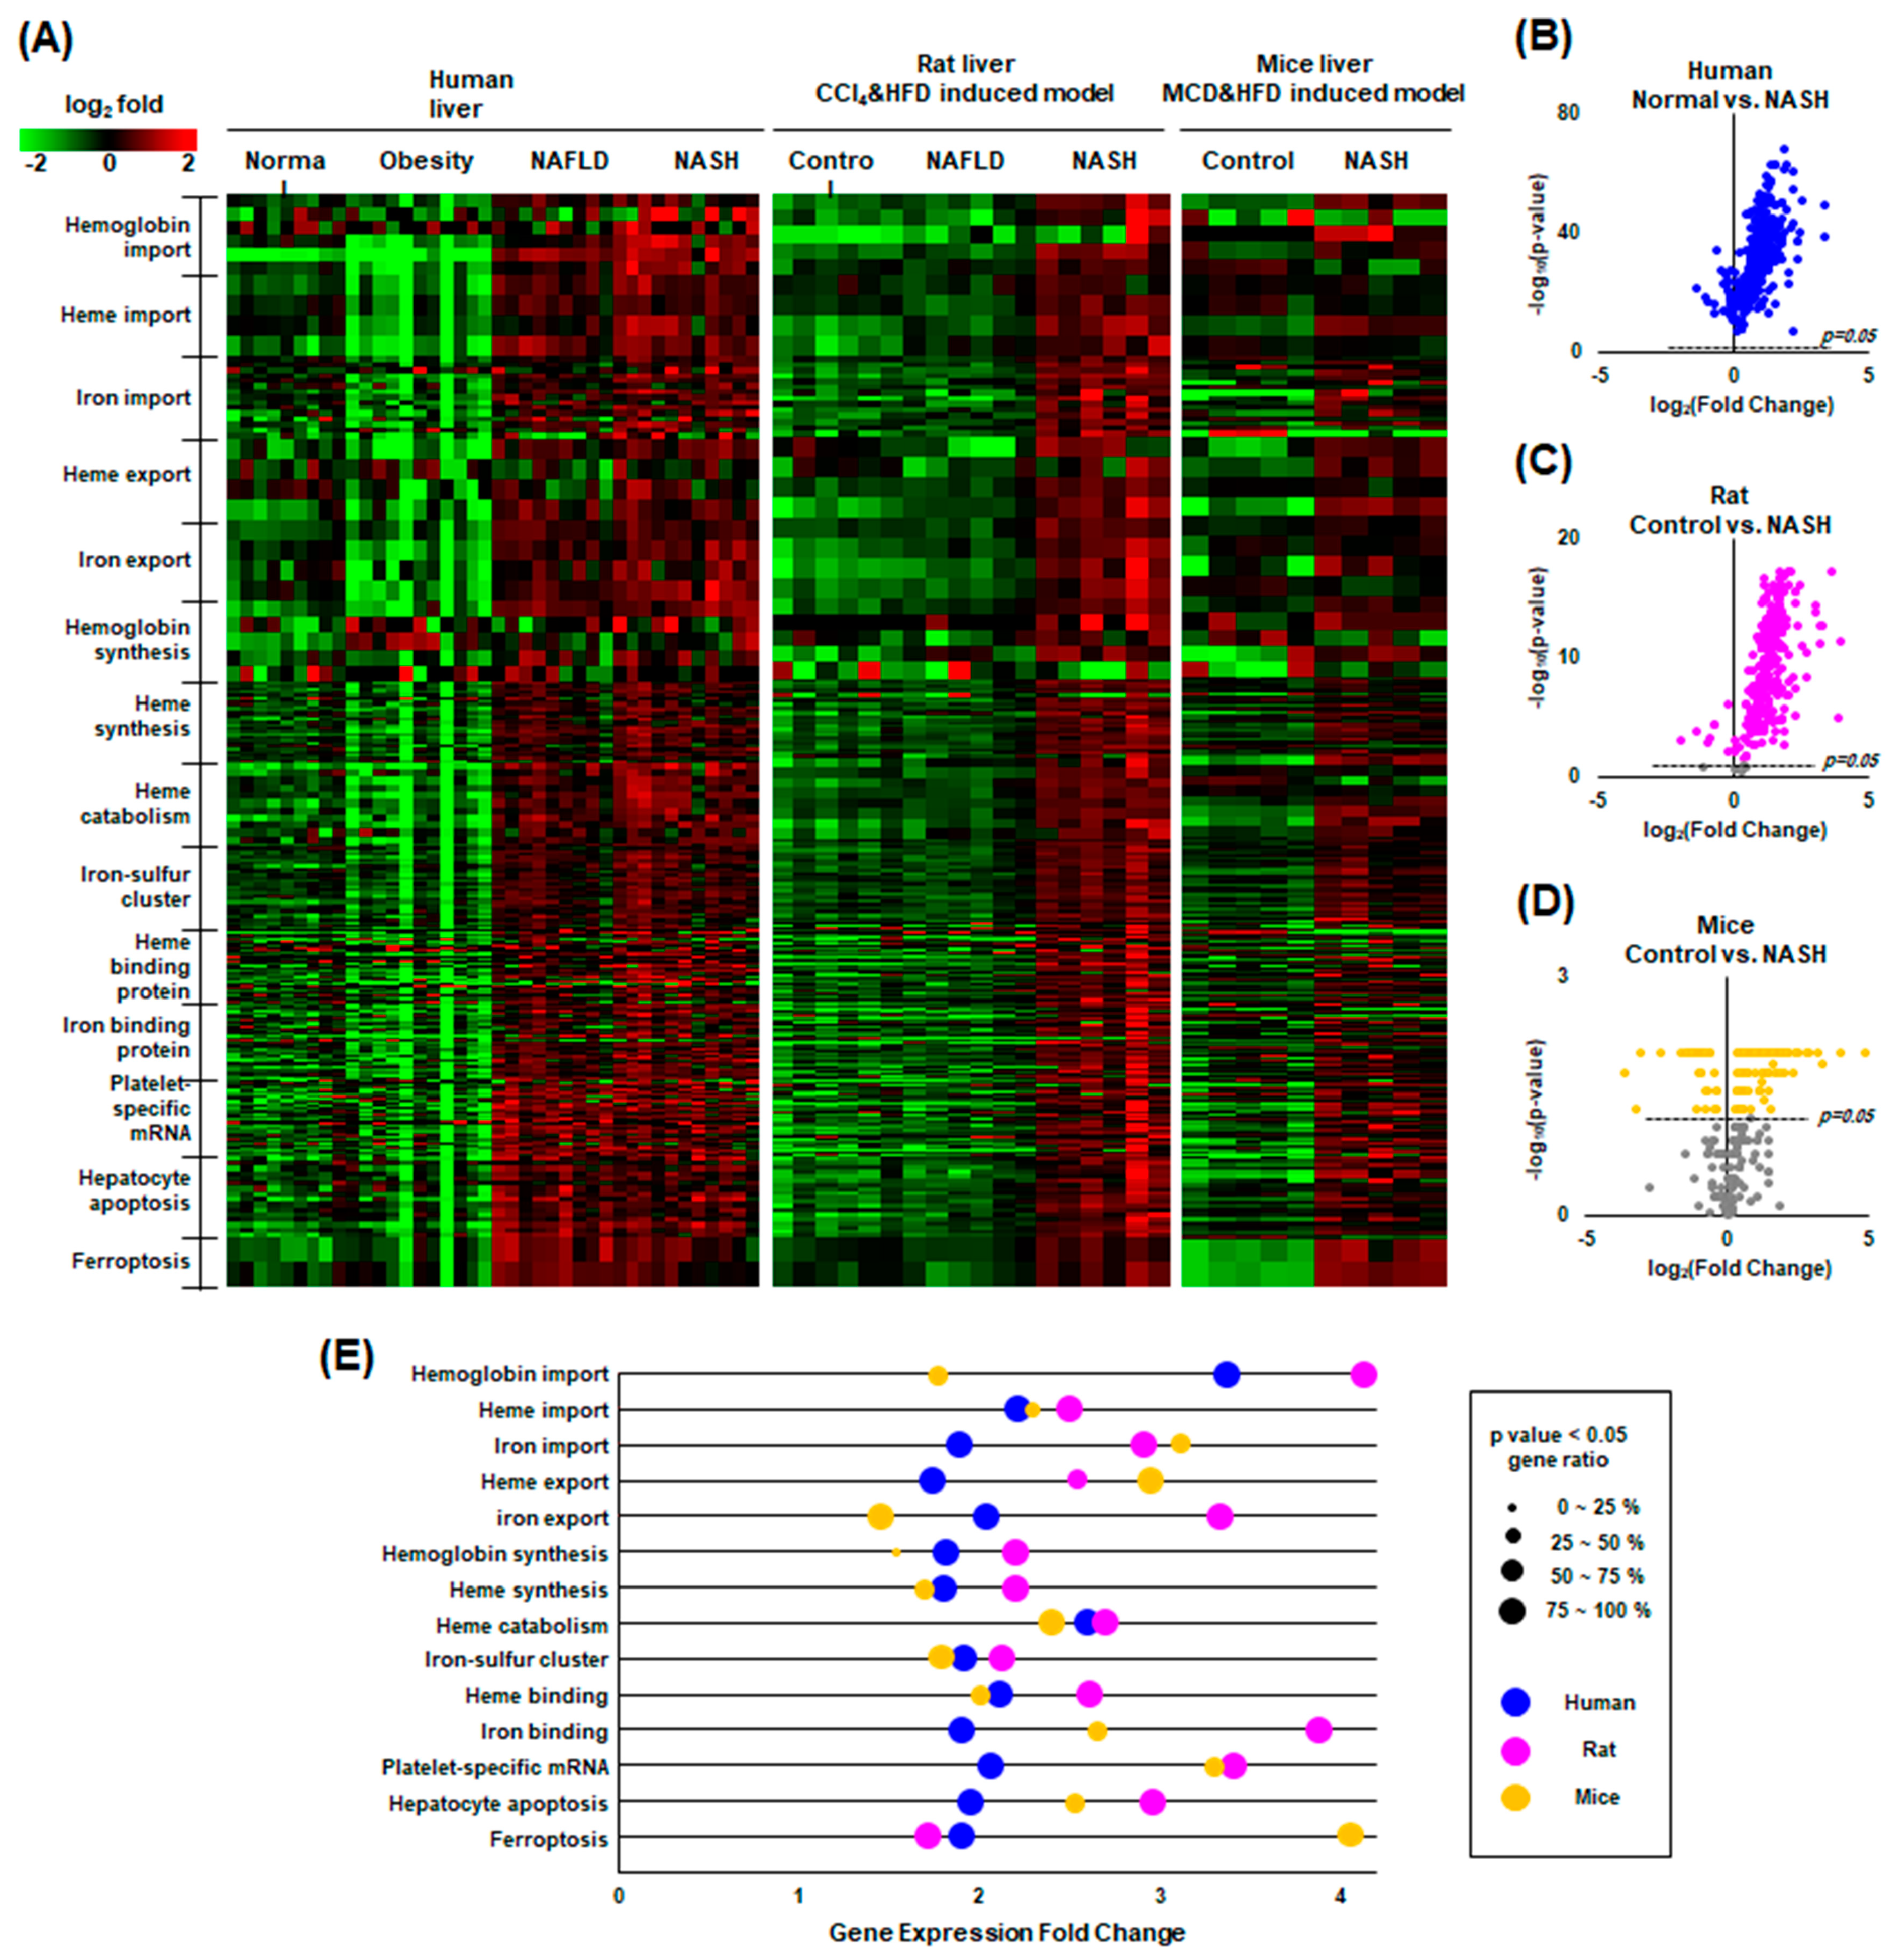
4.14. Gene Expression Omnibus (GEO) Data Collection and Analysis
We investigated mRNA expression in NAFLD liver tissue from GEO datasets using the NCBI Platform. A total of three original datasets were downloaded (GEO accession no. GSE126848 [
31], GSE129525 [
32], and GSE156918 [
33] arrayed from Homo sapiens, Rattus norvegicus and Mus musculus, respectively) in the format of a tab-separated values file. These datasets were selected based on the following criteria: (1) inclusion of a healthy control group and a NASH group; (2) exclusion of an underlying unrelated disease; (3) exclusion of genetically modified samples; and (4) inclusion of at least six samples per group. The 13 enriched gene ontology (GO) terms in the category of biological processes were all involved in the catabolism and anabolism of hemoglobin, heme iron, and ferroptosis. GSE126848 includes 4 groups: normal (n = 14), obesity (n = 12), NAFLD (n = 15), and NASH (n = 16). GSE129525 includes 3 groups: control (n = 6), NAFLD (n = 6), and NASH (n = 6). GSE156918 includes 2 groups: control (n = 5) and NASH (n = 5). The processing of gene expression data was conducted with Excel in Microsoft Office 365.
4.15. Statistical Analysis
There were 8 samples per group in the in vivo experiments. The statistical significance of the differences was determined using the Mann–Whitney U test. Three independent experiments were performed in triplicate in vitro. The results are expressed as the mean ± S.D. obtained from three experiments. The Shapiro–Wilk test was conducted to check the normality of the data, and Levene’s test was used to verify the homogeneity of variances before one-way analysis of variance (ANOVA). ANOVA followed by Scheffe’s test was used for the analysis of differences between each treated condition. p < 0.01 was considered statistically significant.

 ,
, 