4.1. Materials and Methods for All Experiments
4.1.1. Compound
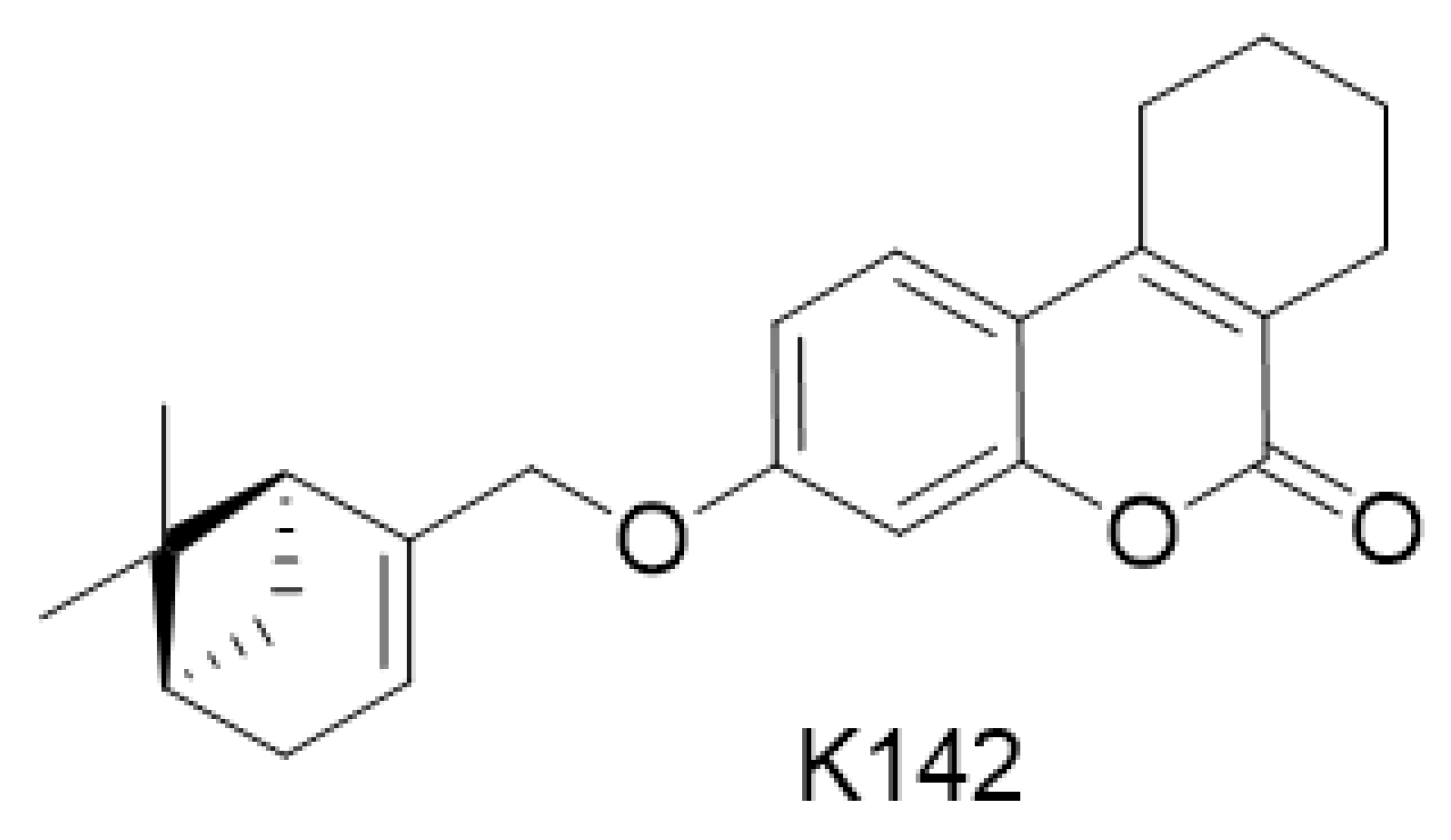
Compound under study, K142 ((3-(((1S,5R)-6,6-dimethylbicyclo [3.1.1]hept-2-en-2-yl)methoxy)-7,8,9,10-tetrahydro-6H -benzo[c]chromen-6-one)) was obtained from Vorozhtsov Novosibirsk Institute of Organic Chemistry, Siberian Branch of the Russian Academy of Sciences, Novosibirsk. Dosage form: substance. Storage conditions: at a temperature of +4 °C.
4.1.2. Virus
We utilized the A2 strain of the human RSV obtained from the laboratory of chemotherapy for viral infections at the Smorodintsev Influenza Research Institute. The strain was received on 4 January 2018 from the Laboratory for Biotechnology of Diagnostic Preparations. Subsequently, it was accumulated in a HEp-2 cell culture and stored in aliquots at a temperature of −80 °C.
4.1.3. Cell Culture
We employed the HEp-2 cell culture, derived from HeLa cells, as it is known to be highly sensitive and permissive to the RSV. The culture was obtained from the working collection of the Laboratory of Chemotherapy for Viral Infections at the Smorodintsev Influenza Research Institute.
4.1.4. Culture Medium
The culture medium consisted of 100 mL of DMEM medium (DMEM nutrient medium with a glucose concentration of 4.5 mg/mL (Biolot, St. Petersburg, Russia). Additionally, 1 mL of an antibiotic solution (penicillin-streptomycin), 2% of FBS serum, and 4 mM of L-glutamine were added to the medium.
4.1.5. Preliminary Assessment of Virus Titer in HEp-2 Cell Culture
The infectious activity of the virus was measured in a HEp-2 cell culture with 50–70% monolayer formation, 24 h after inoculation on the plates. A series of 10-fold dilutions (10−1–10−7) was prepared from a virus sample using DMEM medium with glutamine (Biolot, St. Petersburg, Russia) supplemented with 2% fetal bovine serum (Biolot, St. Petersburg, Russia) and 20 µg/mL ciprofloxacin (Sintez, Kurgan, Russia). These dilutions were then added to the wells of a 96-well plate with cells. The plates were incubated at 37 °C for 1 h in a 5% CO2 atmosphere. Afterward, the virus was washed off with 100 µL of supporting medium, and 100 µL of the same medium was added to each well. The plates were then incubated for 6 days until cytopathic effect (CPE) appeared in the control virus wells. Virus titers in the samples were determined by ELISA, as described below.
4.1.6. Cell-ELISA
The enzyme immunoassay, specifically the cell-ELISA, was performed on the cell culture. To start with, the cell culture was fixed by exposing it to cold 80% acetone for 15 min at −20 °C. Following this, the culture was thoroughly washed using phosphate-buffered saline (Biolot, St. Petersburg, Russia) with the addition of Tween 20 (Orgsintez, Nizhniy Novgorod, Russia), ensuring a concentration of 0.05%. Subsequently, a solution containing primary mouse antibodies obtained as described in [
13] targeting the RSV F protein was applied to the culture. The culture was then incubated for 2 h with continuous stirring at room temperature. After the incubation period, the cells were rinsed again with a buffer solution, and secondary anti-mouse antibodies were introduced. Another round of incubation for 2 h with continuous stirring followed this step. The remaining antibodies were washed off, and a substrate-chromogenic mixture containing tetramethylbenzidine was applied. The reaction was allowed to proceed for 5 min before halting it with 0.1 M sulfuric acid. To quantify the optical density of the resulting solution, measurements were taken at a wavelength of 450 nm. Wells with an absorbance value two or more times higher than that of the control cell wells were considered to be contaminated. Finally, the virus titer was determined using the Reed and Muench method.
4.2. Registration of the Viral Life Cycle in the Presence of K142 by Confocal Microscopy
Cells were cultured on glass slides in the wells of a 24-well plate (Rosmedbio, St. Petersburg, Russia) until they reached a subconfluent state. Each well was divided into three groups, with two slides per group:
- (1)
The first group served as a negative control, with cells not incubated with the virus.
- (2)
The second group served as a positive control, with cells incubated with the virus for the designated study time.
- (3)
The third group was an experimental group, where cells were pretreated with K142 for 1 h and then incubated with the virus for the same duration as the control group.
The compound was initially dissolved in DMSO and adjusted to a final concentration of 100 µg/mL. For the positive and negative control wells, a culture medium containing a similar concentration of DMSO was used instead of the compound.
After specific time intervals, the cell culture was fixed: first, after a 2-h period of virus penetration into the cells, and second, after a 3-day period of syncytium formation. The cells were washed with PBS and then fixed in a 10% buffered formalin solution with a pH of 7.4 for 24 h. Subsequently, they were washed with PBS solution, and any non-specific binding sites of antibodies were blocked by incubation in a 2% BSA (bovine serum albumin) solution in PBS for 20 min.
Next, the cells were stained with mouse primary antibodies against RSV (dilution of 1:200) obtained as described in [
13], washed three times with PBS, and incubated with a solution of rabbit secondary anti-mouse antibodies (dilution of 1:500) conjugated with a fluorescent label (Alexa 488). This step was followed by three washes with PBS and incubation with a Hoechst 33,342 solution (dilution of 1:500) to stain DNA (cell nuclei).
The coverslips with stained cells were then removed from the plate and mounted on slides using Fluoroshield™ containing triethylenediamine. The resulting preparations were analyzed using a Leica SP8 laser scanning confocal microscope equipped with a 60×/1.4 objective with oil immersion and a pinhole parameter of 1 AU. A 488 nm argon laser with a power parameter of 10% was used to excite Alexa 488 fluorescence.
To record Alexa 488 fluorescence, a signal was captured in the wavelength range of 490–550 nm, utilizing a detector voltage of 750 V. Hoechst 33,342 fluorescence was excited using a 405 nm diode laser at a power setting of 50%. The resulting fluorescence signal was then recorded in the range of 410–500 nm, with a detector voltage of 800 V.
To quantify the number of virus particles bound to the cells, confocal images of the cell culture were analyzed using the ImageJ program. The images had a resolution of 1024 × 1024 pixels (246.03 × 246.03 µm). Five random fields of view were selected from each preparation to ensure an even distribution of cell nuclei, with the optical section passing through the middle of most of the nuclei.
The acquired images (n = 10 in each group) were stored in separate channels corresponding to the staining for nuclei (blue) and viruses (green). The green channel images were converted to 8-bit format, and a background subtraction algorithm was applied using a “Rolling ball radius” parameter of 50 pixels. Subsequently, the average pixel intensity was estimated to determine the fluorescence intensity of the secondary antibodies (Alexa 488) associated with the primary antibodies specifically binding to the viral particles on the cell surface. Statistical analysis of the results was performed using the GraphPad Prism 8 software.
4.3. Materials and Methods for In Vivo Experiments
4.3.1. Reference drug (positive control)
Reference drug Ribavirin (positive control), Vertex, Russia. Ser #030222, reg. passport #896 from 08.04.2022. Dosage form: substance. Storage conditions: at a temperature of +4 °C.
4.3.2. Placebo (Negative Control)
Phosphate-buffered saline solution DPBS (Biolot, St. Petersburg, Russia). Dosage form: solution. Description: clear liquid. Packed in 450 mL plastic containers. Storage conditions: in the refrigerator at a temperature of +2 °C–+8 °C.
4.3.3. Experimental Animals
The study was conducted using 4–6-week-old Balb/c pure female mice. Each group consisted of 15 mice, with 10 animals used to determine viral load and changes in body weight in the lungs, and 5 animals used to study the histological picture of lung lesions. All experiments involving laboratory animals were approved by the Bioethics Commission of Smorodintsev Influenza Research Institute, St. Petersburg, Russia.
The mice were obtained from the nursery Stolbovaya of the Scientific Center of Biomedical Technologies, Moscow Region. They were kept under standard conditions, following the methodological documents used in the research.
4.3.4. Housing of Laboratory Animals
The mice were housed in polycarbonate cages (type T3A, S = 1200 cm2) from BENEX a.s., Czech Republic. They were kept in groups of 15 individuals on bedding made of wood pellets from Laboratorkorm LLC. The cages were covered with steel lattice covers with a stern recess.
The mice were provided with ad libitum access to granulated food from (Laboratorkorm, Moscow, Russia). Water purified by reverse osmosis using a Millipore RiOs 30 water treatment plant was also given ad libitum in standard drinking bowls with steel spouts. Wood pellets from (Laboratorkorm) were used as bedding material.
The mice were kept in separate rooms in the vivarium of the Smorodintsev Influenza Research Institute. The ambient conditions were controlled (18–24 °C and relative humidity of 50–80%), and the photoperiod was 12 h night–12 h day under artificial lighting with fluorescent lamps. The care and maintenance of the animals were carried out according to SOPs, adopted by the FSBI Smorodintsev Influenza Research Institute
Animals were randomly assigned to groups based on body weight, ensuring that each individual’s weight fell within ±10% of the mean value. Each animal in the group was assigned a unique number.
Euthanasia: After the completion of drug administration and non-invasive tests, planned euthanasia was conducted using CO2.
4.3.5. Administration Procedure
The studied compounds and controls were administered to animals in accordance with the treatment-and-prophylactic scheme. This involved administering the samples one day before infection, on the day of infection, and 1, 2, 3, 4, and 5 days after infection. The compound K142 was given orally using a gastric tube three times a day at a dosage of 50 mg/kg for Group 1. For Group 2, K142 was administered intranasally under light ether anesthesia in a volume of 15 μL at doses of 10 mg/kg, and, for Group 3—1 mg/kg.
To control the specificity of the pathological process, a reference drug, ribavirin, was used in Group 4. This was administered orally using a gastric tube in a volume of 0.2 mL at a dosage of 50 mg/kg. In Group 5, a negative control (Placebo), saline was administered orally in a volume of 0.2 mL.
For a clearer understanding of the experiment, please refer to
Table 2 which presents the general scheme.
4.3.6. Virus Introduction Procedure
Mice were intranasally infected with the RSV-A virus under light ether anesthesia. A volume of 50 μL, containing a viral titer of 5.5 lgTID50, was administrated. Following infection, the animals were observed for a period of 5 days.
4.3.7. Body Weight Control in Mice
To monitor the weight changes, mice were weighed daily, starting from day-1 (the day before infection). The weighing process was conducted during the midday, before the second drug injection.
4.3.8. Organ Harvesting and Preparation of Homogenates
On the 6th day after infection, all animals in each group were euthanized. The lungs were carefully extracted from the mice. In each group, 5 mouse lungs were fixed in formalin for future histological studies. The remaining 10 mouse lungs were placed in sterile, pre-weighed eppendorfs to determine their weight. The lungs were then homogenized in phosphate-buffered saline DPBS (Biolot, St. Petersburg, Russia) using a Tissue Lyser II device (Qiagen, Germantown, MD, USA) within the same eppendorfs. The resulting organ suspension was utilized for assessing the viral load through the application of sandwich ELISA.
4.3.9. Determination of Viral Load in the Lungs by Sandwich ELISA
The viral load present in the lungs was determined using a sandwich ELISA method. To carry out the enzyme immunoassay, Microlon High Binding 96-well plates (#655061, GreinerBio-One, Kremsmünster, Austria) and PST-60HL-4 thermoshaker plates (BioSan) were utilized.
In the first step, the capture monoclonal antibody 7B12 specific to RSV F protein [
13] was diluted in 1× phosphate monophosphate buffer solution (FMSB) and added to each well (100 µL) of the plate. The plate was then incubated overnight at +4 °C.
Afterward, any unbound antibodies were removed by washing the wells with a PBS-T solution (0.05% Tween-20). To prevent non-specific binding, the wells were blocked with a solution of 5% milk (Blotting-Grade Blocker, #1706404, Bio-Rad, Hercules, CA, USA) dissolved in PBS-T. The blocking step was carried out at 37 °C for 1 h.
Next, the analyzed samples, standards, or a negative control solution (PMSB-T) were added to the plate and incubated at 37 °C for 2 h. A standard suspension of RSV with a concentration range from 5000 to 80 ng/mL was used. The concentration of the viral suspension was determined using the Lowry method.
Following the sample incubation at 37 °C for 2 h, the plate was washed three times with the PMSB-T solution for 2 min each time. Subsequently, a conjugate of biotin isothiocyanate (BITC) tagged monoclonal antibodies (4F2) specific to RSV F protein was added (100 μL per well) and incubated at 37 °C for 1 h.
The presence of the biotinylated antibodies bound to the antigens was detected using a streptavidin-horseradish peroxidase conjugate (streptavidin-HRP) (R&D Systems, Wuhan, China), which was diluted 1:1000 in PMS-T. The plate was incubated at 37 °C for 30 min.
The peroxidase reaction was demonstrated by adding 100 µL of substrate mix containing 9 parts of Solution A and 1 part of Solution B from the TMB Peroxidase EIA Substrate Kit (#1721067, Bio-Rad, Hercules, CA, USA) to each well of the plate. After stopping the reaction by adding 100 µL of 1N sulfuric acid to each well of the plate, the absorbance was measured at 450 nm (OD450) and 655 nm (OD655) using a CLARIOstar multimodal microplate reader (BMG Labtech, Ortenberg, Germany).
A standard sample of the virus was cultivated on HEp-2 cell culture. Following virus accumulation, purification was accomplished through differential centrifugation in a sucrose gradient. The concentration of the virus (measured by total protein) was determined using the Lowry method.
4.3.10. Histological Examination of Lung Lesions
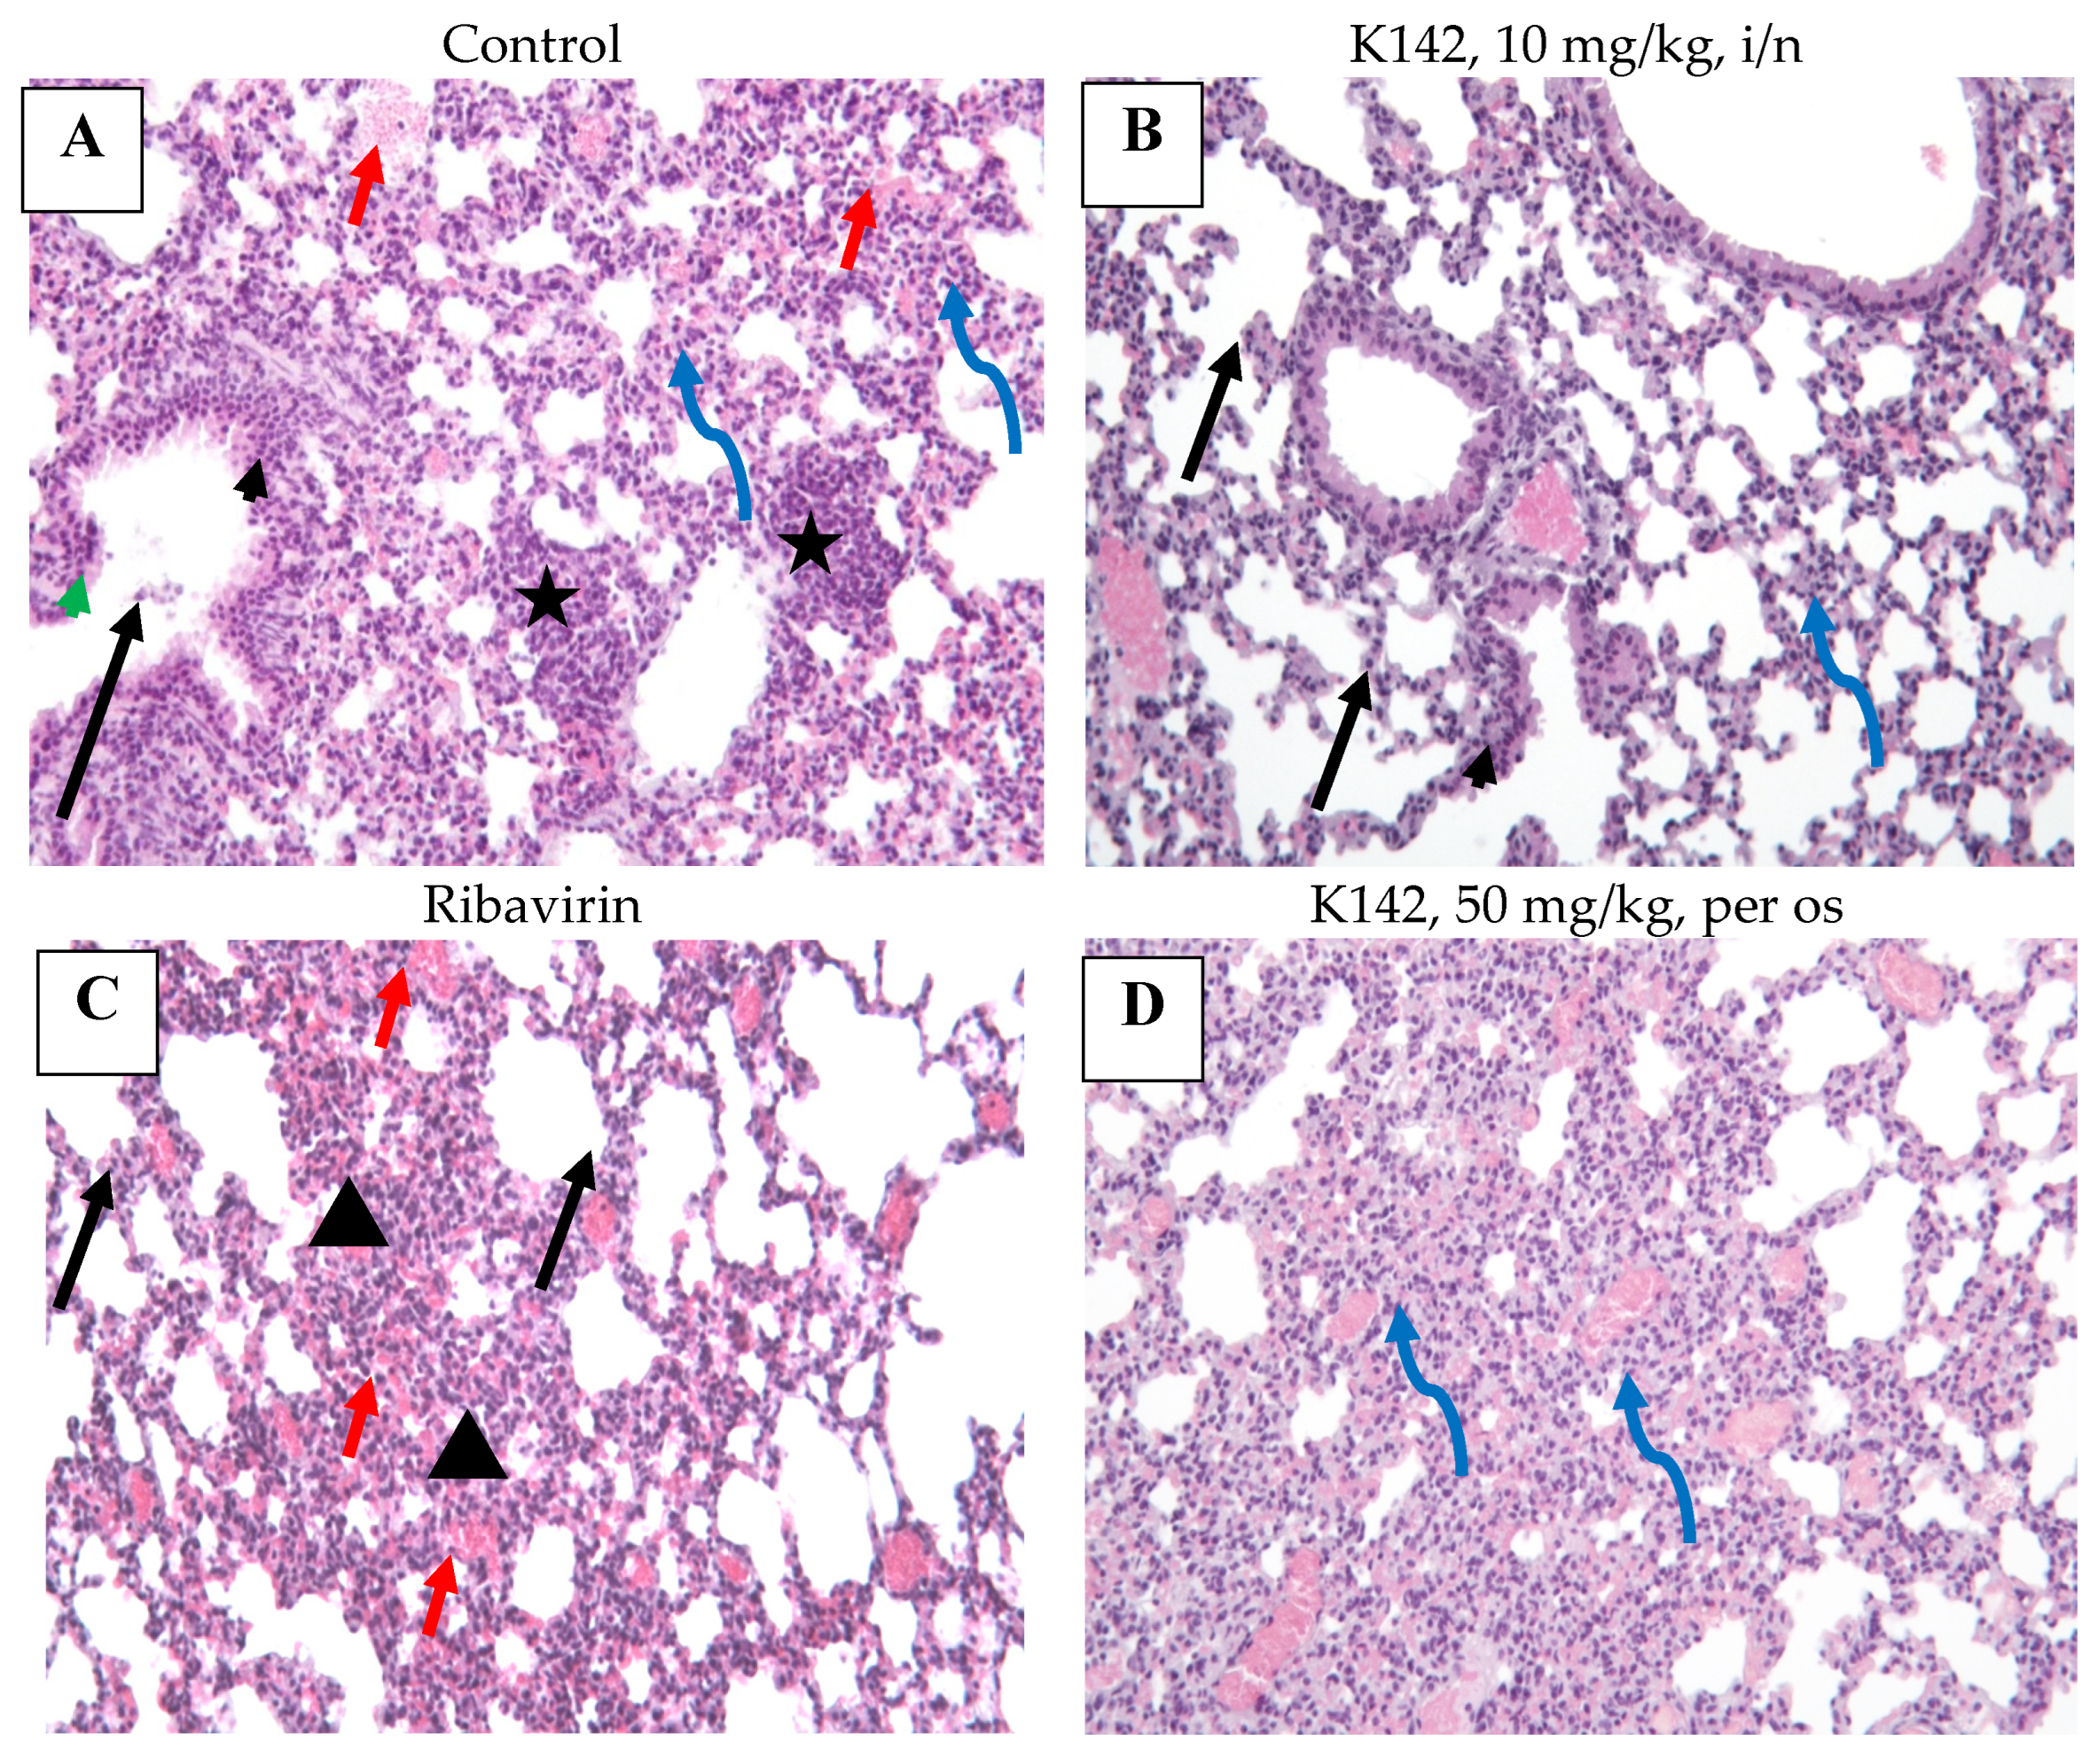
To prepare lung fragments for histological studies, they were fixed in a 10% buffered formalin solution with a pH of 7.4 for 48 h. After obtaining the required sections, routine histological processing was performed using a Histo-Tek VP1 histoprocessor (Sakura, Tokyo, Japan), followed by encapsulating the samples in paraffin blocks. The resulting 2 µm thick sections were stained using a hematoxylin and eosin solution. Microscopy analysis was conducted using a LEICA DM1000 light microscope. Measurements and image capture were carried out using the ADF Imager.
4.3.11. Evaluation of the Specific Pharmacological Activity of Samples In Vivo
The main criterion for evaluating antiviral activity is the reduction in viral load in the lung tissue of mice in the group treated with the drug in comparison with the placebo group. Secondary criteria for assessing antiviral activity: the influence of the studied drug on weight dynamics of infected animals—a decrease in weight indicators of the lungs of infected animals—reduction in signs of the infectious process in the lung tissue during histological examination
4.3.12. Analysis of Results
Evaluation of the specific pharmacological activity of samples in vivo involves assessing the antiviral activity by measuring the reduction in viral load in the lung tissue of mice treated with the drug compared to a placebo group. Additional criteria for evaluating antiviral activity include the impact of the drug on the weight dynamics of infected animals and a reduction in signs of the infectious process during histological examination of the lung tissue.
The analysis of the results was conducted using Microsoft Excel and GraphPad Prism 8.0 software. To visually represent the data on the relative drop in body weight, the percentage value of body weight relative to the weight on the day of infection (day 0) was calculated for each animal. The mean value for the group was determined, and a curve showing the dependence of the group mean on the days after infection was plotted.
For the analysis of Sandwich ELISA results, MARS Data Analysis, Microsoft Office Excel, and GraphPadPrism 8 programs were used. To account for the background signal, the difference between the corresponding optical density values (OD450 and OD655) was calculated for each well. The mean value of all negative controls, plus three standard deviations, was established as the threshold value.
To determine the significance of differences between group means, the one-way ANOVA analysis of variance was used for group comparison. Following this, the Dunnett test was applied for post hoc pairwise comparisons with the Placebo group.


 ,
, 


