

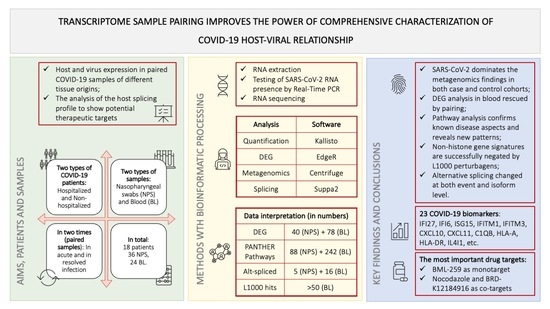
Transcriptome from Paired Samples Improves the Power of Comprehensive COVID-19 Host-Viral Characterization
 , , ,
, , ,
Abstract
:
1. Introduction
2. Results
2.1. SARS-CoV-2 Dominates the Metagenomics Findings in Both Case and Control Cohorts
2.2. DEG Analysis in Blood Rescued by Pairing
2.3. Pathway Analysis Confirms Known Disease Aspects and Reveals New Patterns
2.4. Non-Histone Gene Signatures Are Successfully Negated by L1000 Perturbagens
2.5. Alternative Splicing Changed at Both Event and Isoform Level
3. Discussion
4. Patients and Methods
4.1. COVID-19 Patients and Samples
4.2. RNA Extraction and Real-Time PCR
4.3. Sequencing
4.4. Bioinformatic Processing
Supplementary Materials
Author Contributions
Funding
Institutional Review Board Statement
Informed Consent Statement
Data Availability Statement
Acknowledgments
Conflicts of Interest
References
- Smith, N.; Goncalves, P.; Charbit, B.; Grzelak, L.; Beretta, M.; Planchais, C.; Bruel, T.; Rouilly, V.; Bondet, V.; Hadjadj, J.; et al. Distinct systemic and mucosal immune responses during acute SARS-CoV-2 infection. Nat. Immunol. 2021, 22, 1428–1439. [Google Scholar] [CrossRef] [PubMed]
- Proal, A.D.; VanElzakker, M.B. Long COVID or Post-acute Sequelae of COVID-19 (PASC): An Overview of Biological Factors That May Contribute to Persistent Symptoms. Front. Microbiol. 2021, 12, 698169. [Google Scholar] [CrossRef] [PubMed]
- Phetsouphanh, C.; Darley, D.R.; Wilson, D.B.; Howe, A.; Munier, C.M.L.; Patel, S.K.; Juno, J.A.; Burrell, L.M.; Kent, S.J.; Dore, G.J.; et al. Immunological dysfunction persists for 8 months following initial mild-to-moderate SARS-CoV-2 infection. Nat. Immunol. 2022, 23, 210–216. [Google Scholar] [CrossRef]
- Taefehshokr, N.; Taefehshokr, S.; Hemmat, N.; Heit, B. COVID-19: Perspectives on Innate Immune Evasion. Front. Immunol. 2020, 11, 580641. [Google Scholar] [CrossRef]
- Ribero, M.S.; Jouvenet, N.; Dreux, M.; Nisole, S. Interplay between SARS-CoV-2 and the type I interferon response. PLoS Pathog. 2020, 16, e1008737. [Google Scholar] [CrossRef] [PubMed]
- Chen, L.Y.C.; Quach, T.T.T. COVID-19 cytokine storm syndrome: A threshold concept. Lancet Microbe 2021, 2, e49–e50. [Google Scholar] [CrossRef] [PubMed]
- Fathi, N.; Rezaei, N. Lymphopenia in COVID-19: Therapeutic opportunities. Cell Biol. Int. 2020, 44, 1792–1797. [Google Scholar] [CrossRef]
- Joshee, S.; Vatti, N.; Chang, C. Long-Term Effects of COVID-19. Mayo Clin. Proc. 2022, 97, 579–599. [Google Scholar] [CrossRef]
- Proal, A.; Marshall, T. Myalgic Encephalomyelitis/Chronic Fatigue Syndrome in the Era of the Human Microbiome: Persistent Pathogens Drive Chronic Symptoms by Interfering with Host Metabolism, Gene Expression, and Immunity. Front. Pediatr. 2018, 6, 373. [Google Scholar] [CrossRef]
- Rajagopala, S.V.; Bakhoum, N.G.; Pakala, S.B.; Shilts, M.H.; Rosas-Salazar, C.; Mai, A.; Boone, H.H.; McHenry, R.; Yooseph, S.; Halasa, N.; et al. Metatranscriptomics to characterize respiratory virome, microbiome, and host response directly from clinical samples. Cell Rep. Methods 2021, 1, 100091. [Google Scholar] [CrossRef]
- Chiu, C.Y.; Miller, S.A. Clinical metagenomics. Nat. Rev. Genet. 2019, 20, 341–355. [Google Scholar] [CrossRef] [PubMed]
- Chu, C.-Y.; Qiu, X.; McCall, M.N.; Wang, L.; Corbett, A.; Holden-Wiltse, J.; Slaunwhite, C.; Grier, A.; Gill, S.R.; Pryhuber, G.S.; et al. Airway Gene Expression Correlates of Respiratory Syncytial Virus Disease Severity and Microbiome Composition in Infants. J. Infect. Dis. 2021, 223, 1639–1649. [Google Scholar] [CrossRef] [PubMed]
- Xiong, Y.; Liu, Y.; Cao, L.; Wang, D.; Guo, M.; Jiang, A.; Guo, D.; Hu, W.; Yang, J.; Tang, Z.; et al. Transcriptomic characteristics of bronchoalveolar lavage fluid and peripheral blood mononuclear cells in COVID-19 patients. Emerg. Microbes Infect. 2020, 9, 761–770. [Google Scholar] [CrossRef]
- Rivera, B.; Leyva, A.; Portela, M.M.; Moratorio, G.; Moreno, P.; Durán, R.; Lima, A. Quantitative proteomic dataset from oro- and naso-pharyngeal swabs used for COVID-19 diagnosis: Detection of viral proteins and host′s biological processes altered by the infection. Data Brief 2020, 32, 106121. [Google Scholar] [CrossRef] [PubMed]
- Akgun, E.; Tuzuner, M.B.; Sahin, B.; Kilercik, M.; Kulah, C.; Cakiroglu, H.N.; Serteser, M.; Unsal, I.; Baykal, A.T. Proteins associated with neutrophil degranulation are upregulated in nasopharyngeal swabs from SARS-CoV-2 patients. PLoS ONE 2020, 15, e0240012. [Google Scholar] [CrossRef]
- Maras, J.S.; Sharma, S.; Bhat, A.; Rooge, S.; Aggrawal, R.; Gupta, E.; Sarin, S.K. Multi-omics analysis of respiratory specimen characterizes baseline molecular determinants associated with SARS-CoV-2 outcome. iScience 2021, 24, 102823. [Google Scholar] [CrossRef]
- Biji, A.; Khatun, O.; Swaraj, S.; Narayan, R.; Rajmani, R.S.; Sardar, R.; Satish, D.; Mehta, S.; Bindhu, H.; Jeevan, M.; et al. Identification of COVID-19 prognostic markers and therapeutic targets through meta-analysis and validation of Omics data from nasopharyngeal samples. Ebiomedicine 2021, 70, 103525. [Google Scholar] [CrossRef]
- Zhou, Y.; Zhang, J.; Wang, D.; Wang, D.; Guan, W.; Qin, J.; Xu, X.; Fang, J.; Fu, B.; Zheng, X.; et al. Profiling of the immune repertoire in COVID-19 patients with mild, severe, convalescent, or retesting-positive status. J. Autoimmun. 2021, 118, 102596. [Google Scholar] [CrossRef]
- Aschenbrenner, A.C.; Mouktaroudi, M.; Krämer, B.; Oestreich, M.; Antonakos, N.; Nuesch-Germano, M.; Gkizeli, K.; Bonaguro, L.; Reusch, N.; Baßler, K.; et al. Disease severity-specific neutrophil signatures in blood transcriptomes stratify COVID-19 patients. Genome Med. 2021, 13, 7. [Google Scholar] [CrossRef]
- Stevens, J.R.; Herrick, J.S.; Wolff, R.K.; Slattery, M.L. Power in pairs: Assessing the statistical value of paired samples in tests for differential expression. BMC Genom. 2018, 19, 953. [Google Scholar] [CrossRef]
- Gómez-Carballa, A.; Rivero-Calle, I.; Pardo-Seco, J.; Gómez-Rial, J.; Rivero-Velasco, C.; Rodríguez-Núñez, N.; Barbeito-Castiñeiras, G.; Pérez-Freixo, H.; Cebey-López, M.; Barral-Arca, R.; et al. A multi-tissue study of immune gene expression profiling highlights the key role of the nasal epithelium in COVID-19 severity. Environ. Res. 2022, 210, 112890. [Google Scholar] [CrossRef] [PubMed]
- Huang, L.; Shi, Y.; Gong, B.; Jiang, L.; Zhang, Z.; Liu, X.; Yang, J.; He, Y.; Jiang, Z.; Zhong, L.; et al. Dynamic blood single-cell immune responses in patients with COVID-19. Signal Transduct. Target. Ther. 2021, 6, 110. [Google Scholar] [CrossRef] [PubMed]
- Kwan, P.K.W.; Cross, G.B.; Naftalin, C.M.; Ahidjo, B.A.; Mok, C.K.; Fanusi, F.; Sari, I.P.; Chia, S.C.; Kumar, S.K.; Alagha, R.; et al. A blood RNA transcriptome signature for COVID-19. BMC Med. Genom. 2021, 14, 155. [Google Scholar] [CrossRef] [PubMed]
- Najafloo, R.; Majidi, J.; Asghari, A.; Aleemardani, M.; Kamrava, S.K.; Simorgh, S.; Seifalian, A.; Bagher, Z.; Seifalian, A.M. Mechanism of Anosmia Caused by Symptoms of COVID-19 and Emerging Treatments. ACS Chem. Neurosci. 2021, 12, 3795–3805. [Google Scholar] [CrossRef]
- Karamali, K.; Elliott, M.; Hopkins, C. COVID-19 related olfactory dysfunction. Curr. Opin. Otolaryngol. Head Neck Surg. 2022, 30, 19–25. [Google Scholar] [CrossRef]
- Butowt, R.; Bilinska, K.; von Bartheld, C.S. Olfactory dysfunction in COVID-19: New insights into the underlying mechanisms. Trends Neurosci. 2022, 46, 75–90. [Google Scholar] [CrossRef]
- Karimian, A.; Behjati, M.; Karimian, M. Molecular mechanisms involved in anosmia induced by SARS-CoV-2, with a focus on the transmembrane serine protease TMPRSS2. Arch. Virol. 2022, 167, 1931–1946. [Google Scholar] [CrossRef]
- Finlay, J.B.; Brann, D.H.; Hachem, R.A.; Jang, D.W.; Oliva, A.D.; Ko, T.; Gupta, R.; Wellford, S.A.; Moseman, E.A.; Jang, S.S.; et al. Persistent post–COVID-19 smell loss is associated with immune cell infiltration and altered gene expression in olfactory epithelium. Sci. Transl. Med. 2022, 14, eadd0484. [Google Scholar] [CrossRef]
- Jimenez, R.C.; Casajuana-Martin, N.; García-Recio, A.; Alcántara, L.; Pardo, L.; Campillo, M.; Gonzalez, A. The mutational landscape of human olfactory G protein-coupled receptors. BMC Biol. 2021, 19, 21. [Google Scholar] [CrossRef]
- de Melo, G.D.; Lazarini, F.; Levallois, S.; Hautefort, C.; Michel, V.; Larrous, F.; Verillaud, B.; Aparicio, C.; Wagner, S.; Gheusi, G.; et al. COVID-19–related anosmia is associated with viral persistence and inflammation in human olfactory epithelium and brain infection in hamsters. Sci. Transl. Med. 2021, 13, eabf8396. [Google Scholar] [CrossRef]
- Hasankhani, A.; Bahrami, A.; Tavakoli-Far, B.; Iranshahi, S.; Ghaemi, F.; Akbarizadeh, M.R.; Amin, A.H.; Kiasari, B.A.; Shabestari, A.M. The role of peroxisome proliferator-activated receptors in the modulation of hyperinflammation induced by SARS-CoV-2 infection: A perspective for COVID-19 therapy. Front. Immunol. 2023, 14, 1127358. [Google Scholar] [CrossRef] [PubMed]
- Hasanvand, A. COVID-19 and the role of cytokines in this disease. Inflammopharmacology 2022, 30, 789–798. [Google Scholar] [CrossRef] [PubMed]
- Zanza, C.; Romenskaya, T.; Manetti, A.C.; Franceschi, F.; La Russa, R.; Bertozzi, G.; Maiese, A.; Savioli, G.; Volonnino, G.; Longhitano, Y. Cytokine Storm in COVID-19: Immunopathogenesis and Therapy. Medicina 2022, 58, 144. [Google Scholar] [CrossRef] [PubMed]
- Del Valle, D.M.; Kim-Schulze, S.; Huang, H.-H.; Beckmann, N.D.; Nirenberg, S.; Wang, B.; Lavin, Y.; Swartz, T.H.; Madduri, D.; Stock, A.; et al. An inflammatory cytokine signature predicts COVID-19 severity and survival. Nat. Med. 2020, 26, 1636–1643. [Google Scholar] [CrossRef] [PubMed]
- Shojaei, M.; Shamshirian, A.; Monkman, J.; Grice, L.; Tran, M.; Tan, C.W.; Teo, S.M.; Rossi, G.R.; McCulloch, T.R.; Nalos, M.; et al. IFI27 transcription is an early predictor for COVID-19 outcomes, a multi-cohort observational study. Front. Immunol. 2023, 13, 1060438. [Google Scholar] [CrossRef]
- Yagin, F.H.; Cicek, I.B.; Alkhateeb, A.; Yagin, B.; Colak, C.; Azzeh, M.; Akbulut, S. Explainable artificial intelligence model for identifying COVID-19 gene biomarkers. Comput. Biol. Med. 2023, 154, 106619. [Google Scholar] [CrossRef]
- Tang, B.M.; Shojaei, M.; Parnell, G.P.; Huang, S.; Nalos, M.; Teoh, S.; O’Connor, K.; Schibeci, S.; Phu, A.L.; Kumar, A.; et al. A novel immune biomarker IFI27 discriminates between influenza and bacteria in patients with suspected respiratory infection. Eur. Respir. J. 2017, 49, 1602098. [Google Scholar] [CrossRef]
- Palm, A.A.; Veerla, S.; Lindman, J.; Isberg, P.-E.; Johansson, E.; Biague, A.; Månsson, F.; Norrgren, H.; Esbjörnsson, J.; Medstrand, P.; et al. Interferon Alpha-Inducible Protein 27 Expression Is Linked to Disease Severity in Chronic Infection of Both HIV-1 and HIV-2. Front. A J. Women Stud. 2022, 2, 929053. [Google Scholar] [CrossRef]
- Sui, L.; Li, L.; Zhao, Y.; Zhao, Y.; Hao, P.; Guo, X.; Wang, W.; Wang, G.; Li, C.; Liu, Q. Host cell cycle checkpoint as antiviral target for SARS-CoV-2 revealed by integrative transcriptome and proteome analyses. Signal Transduct. Target. Ther. 2023, 8, 21. [Google Scholar] [CrossRef]
- Naik, R.R.; Shakya, A.K.; Aladwan, S.M.; El-Tanani, M. Kinase Inhibitors as Potential Therapeutic Agents in the Treatment of COVID-19. Front. Pharmacol. 2022, 13, 806568. [Google Scholar] [CrossRef]
- Yan, Y.; Tang, Y.; Zheng, C. When cyclin-dependent kinases meet viral infections, including SARS-CoV-2. J. Med. Virol. 2022, 94, 2962–2968. [Google Scholar] [CrossRef] [PubMed]
- Baumgartner, M.; Tardieux, I.; Ohayon, H.; Gounon, P.; Langsley, G. The use of nocodazole in cell cycle analysis and parasite purification from Theileria parva-infected B cells. Microbes Infect. 1999, 1, 1181–1188. [Google Scholar] [CrossRef] [PubMed]
- Hunsperger, E.A.; Roehrig, J.T. Nocodazole delays viral entry into the brain following footpad inoculation with West Nile virus in mice. J. Neurovirol. 2009, 15, 211–218. [Google Scholar] [CrossRef] [PubMed]
- Cohen, T.; Schwarz, T.M.; Vigant, F.; Gardner, T.J.; Hernandez, R.E.; Lee, B.; Tortorella, D. The Microtubule Inhibitor Podofilox Inhibits an Early Entry Step of Human Cytomegalovirus. Viruses 2016, 8, 295. [Google Scholar] [CrossRef]
- Xing, J.; Paithankar, S.; Liu, K.; Uhl, K.; Li, X.; Ko, M.; Kim, S.; Haskins, J.; Chen, B. Published anti-SARS-CoV-2 in vitro hits share common mechanisms of action that synergize with antivirals. Briefings Bioinform. 2021, 22, bbab249. [Google Scholar] [CrossRef]
- Uva, P.; Bosco, M.C.; Eva, A.; Conte, M.; Garaventa, A.; Amoroso, L.; Cangelosi, D. Connectivity Map Analysis Indicates PI3K/Akt/mTOR Inhibitors as Potential Anti-Hypoxia Drugs in Neuroblastoma. Cancers 2021, 13, 2809. [Google Scholar] [CrossRef]
- Mannick, J.B.; Teo, G.; Bernardo, P.; Quinn, D.; Russell, K.; Klickstein, L.; Marshall, W.; Shergill, S. Targeting the biology of ageing with mTOR inhibitors to improve immune function in older adults: Phase 2b and phase 3 randomised trials. Lancet Healthy Longev. 2021, 2, e250–e262. [Google Scholar] [CrossRef]
- Xing, J.; Shankar, R.; Drelich, A.; Paithankar, S.; Chekalin, E.; Dexheimer, T.; Chua, M.S.; Rajasekaran, S.; Tseng, C.T.K.; Chen, B. Analysis of Infected Host Gene Expression Reveals Repurposed Drug Candidates and Time-Dependent Host Response Dynamics for COVID-19. BioRxiv 2020, preprint. [Google Scholar]
- Bray, N.L.; Pimentel, H.; Melsted, P.; Pachter, L. Near-optimal probabilistic RNA-seq quantification. Nat. Biotechnol. 2016, 34, 525–527. [Google Scholar] [CrossRef]
- Frankish, A.; Diekhans, M.; Ferreira, A.M.; Johnson, R.; Jungreis, I.; Loveland, J.; Mudge, J.M.; Sisu, C.; Wright, J.; Armstrong, J.; et al. GENCODE reference annotation for the human and mouse genomes. Nucleic Acids Res. 2018, 47, D766–D773. [Google Scholar] [CrossRef]
- Leek, J.T.; Johnson, W.E.; Parker, H.S.; Fertig, E.J.; Jaffe, A.E.; Zhang, Y.; Storey, J.D.; Torres, L.C. sva: Surrogate Variable Analysis, R package version 3.48.0. 2023.
- Robinson, M.D.; McCarthy, D.J.; Smyth, G.K. EdgeR: A Bioconductor package for differential expression analysis of digital gene expression data. Bioinformatics 2010, 26, 139–140. [Google Scholar] [CrossRef] [PubMed]
- Trincado, J.L.; Entizne, J.C.; Hysenaj, G.; Singh, B.; Skalic, M.; Elliott, D.J.; Eyras, E. SUPPA2: Fast, accurate, and uncertainty-aware differential splicing analysis across multiple conditions. Genome Biol. 2018, 19, 40. [Google Scholar] [CrossRef] [PubMed]

| Gene_Name | logFC | logCPM | LR | p-Value | FDR | Ensembl_ID |
|---|---|---|---|---|---|---|
| IFI27 | 4.48 | 6.73 | 136.83 | 1.31 × 10⁻³¹ | 7.47 × 10⁻²⁷ | ENSG00000165949.12 |
| SFT2D3 | −7.48 | 0.76 | 64.85 | 8.07 × 10⁻¹⁶ | 2.30 × 10⁻¹¹ | ENSG00000173349.6 |
| IGLC1 | 2.91 | 3.08 | 40.56 | 1.91 × 10⁻¹⁰ | 2.90 × 10⁻⁶ | ENSG00000211675.2 |
| IGKV4-1 | 2.14 | 3.49 | 40.43 | 2.04 × 10⁻¹⁰ | 2.90 × 10⁻⁶ | ENSG00000211598.2 |
| JCHAIN | 2.42 | 6.87 | 36.21 | 1.77 × 10⁻⁹ | 1.64 × 10⁻⁵ | ENSG00000132465.12 |
| H3C3 | 1.64 | 2.81 | 36.11 | 1.87 × 10⁻⁹ | 1.64 × 10⁻⁵ | ENSG00000287080.2 |
| AC118281.1 | −4.66 | 0.03 | 35.96 | 2.02 × 10⁻⁹ | 1.64 × 10⁻⁵ | ENSG00000288380.1 |
| AC020656.1 | 6.68 | 0.55 | 35.55 | 2.48 × 10⁻⁹ | 1.77 × 10⁻⁵ | ENSG00000257764.2 |
| IGLV3-19 | 3.92 | 3.72 | 33.73 | 6.33 × 10⁻⁹ | 4.01 × 10⁻⁵ | ENSG00000211663.2 |
| HIST1H2BO | 1.72 | 2.89 | 33 | 9.24 × 10⁻⁹ | 5.26 × 10⁻⁵ | ENSG00000274641.2 |
| HIST1H2BH | 1.56 | 3.61 | 31.66 | 1.83 × 10⁻⁸ | 9.50 × 10⁻⁵ | ENSG00000275713.2 |
| IGKV1-5 | 1.81 | 3.37 | 31.37 | 2.13 × 10⁻⁸ | 1.01 × 10⁻⁴ | ENSG00000243466.1 |
| IGLC3 | 2.56 | 5.26 | 30.42 | 3.48 × 10⁻⁸ | 1.53 × 10⁻⁴ | ENSG00000211679.2 |
| HIST1H2AJ | 1.69 | 3.44 | 29.37 | 5.99 × 10⁻⁸ | 2.28 × 10⁻⁴ | ENSG00000276368.2 |
| IGKV3-20 | 1.96 | 3.94 | 29.36 | 6.00 × 10⁻⁸ | 2.28 × 10⁻⁴ | ENSG00000239951.1 |
| AC114546.3 | −5.71 | −0.81 | 28.95 | 7.44 × 10⁻⁸ | 2.62 × 10⁻⁴ | ENSG00000279364.1 |
| IGHV3-30 | 2.03 | 4.03 | 28.83 | 7.88 × 10⁻⁸ | 2.62 × 10⁻⁴ | ENSG00000270550.1 |
| IGHV4-34 | 2.77 | 3.72 | 28.74 | 8.29 × 10⁻⁸ | 2.62 × 10⁻⁴ | ENSG00000211956.2 |
| IGKC | 2.06 | 7.21 | 28.02 | 1.20 × 10⁻⁷ | 3.60 × 10⁻⁴ | ENSG00000211592.8 |
| HIST1H3F | 1.48 | 3.1 | 27.61 | 1.49 × 10⁻⁷ | 4.22 × 10⁻⁴ | ENSG00000277775.2 |
| IGLC2 | 2.56 | 6.3 | 27.52 | 1.56 × 10⁻⁷ | 4.22 × 10⁻⁴ | ENSG00000211677.2 |
| IGKV3-15 | 1.54 | 2.4 | 27.2 | 1.84 × 10⁻⁷ | 4.75 × 10⁻⁴ | ENSG00000244437.1 |
| IGHA1 | 1.77 | 6.28 | 26.75 | 2.32 × 10⁻⁷ | 5.74 × 10⁻⁴ | ENSG00000211895.5 |
| IGLV1-40 | 2.56 | 1.93 | 25.53 | 4.36 × 10⁻⁷ | 1.03 × 10⁻³ | ENSG00000211653.2 |
| HIST1H2BE | 1.21 | 3.94 | 25.02 | 5.68 × 10⁻⁷ | 1.29 × 10⁻³ | ENSG00000274290.3 |
| PVRIG2P | −5.22 | −1.02 | 24.62 | 7.00 × 10⁻⁷ | 1.53 × 10⁻³ | ENSG00000235333.3 |
| IGLV3-21 | 2.28 | 2.7 | 24.23 | 8.54 × 10⁻⁷ | 1.80 × 10⁻³ | ENSG00000211662.2 |
| IGHV3-23 | 1.53 | 3.26 | 24.03 | 9.48 × 10⁻⁷ | 1.93 × 10⁻³ | ENSG00000211949.3 |
| TXNDC5 | 1.7 | 6.72 | 23.76 | 1.09 × 10⁻⁶ | 2.14 × 10⁻³ | ENSG00000239264.9 |
| HIST1H2BB | 1.61 | 1.59 | 23.39 | 1.32 × 10⁻⁶ | 2.51 × 10⁻³ | ENSG00000276410.4 |
| IGHV3-11 | 2.14 | 1.28 | 23.18 | 1.47 × 10⁻⁶ | 2.71 × 10⁻³ | ENSG00000211941.3 |
| HIST1H2BM | 1.24 | 2.42 | 22.22 | 2.43 × 10⁻⁶ | 4.32 × 10⁻³ | ENSG00000273703.2 |
| HIST1H2BI | 1.47 | 2.93 | 21.75 | 3.11 × 10⁻⁶ | 5.37 × 10⁻³ | ENSG00000278588.2 |
| EPSTI1 | 1.92 | 7.56 | 21.42 | 3.69 × 10⁻⁶ | 6.18 × 10⁻³ | ENSG00000133106.14 |
| TIGD3 | −1.19 | 2.79 | 21.23 | 4.08 × 10⁻⁶ | 6.57 × 10⁻³ | ENSG00000173825.7 |
| IGHG1 | 2.04 | 5.83 | 21.19 | 4.15 × 10⁻⁶ | 6.57 × 10⁻³ | ENSG00000211896.7 |
| IGHV3-21 | 1.71 | 2.49 | 21.06 | 4.44 × 10⁻⁶ | 6.83 × 10⁻³ | ENSG00000211947.2 |
| HIST1H3G | 1.3 | 3.63 | 20.9 | 4.84 × 10⁻⁶ | 7.25 × 10⁻³ | ENSG00000273983.1 |
| HIST1H4L | 1.2 | 1.95 | 20.58 | 5.72 × 10⁻⁶ | 8.35 × 10⁻³ | ENSG00000275126.2 |
| IGKV1D-39 | 1.67 | 3.07 | 20.43 | 6.18 × 10⁻⁶ | 8.79 × 10⁻³ | ENSG00000251546.1 |
| AC104837.2 | 2.18 | 0.84 | 20.28 | 6.68 × 10⁻⁶ | 9.20 × 10⁻³ | ENSG00000238015.2 |
| HIST1H1T | 1.54 | 1.27 | 20.25 | 6.78 × 10⁻⁶ | 9.20 × 10⁻³ | ENSG00000187475.6 |
| IGKV1-12 | 2.18 | 1.38 | 19.9 | 8.16 × 10⁻⁶ | 1.08 × 10⁻² | ENSG00000243290.3 |
| IGLV6-57 | 2.26 | 1.22 | 19.81 | 8.57 × 10⁻⁶ | 1.11 × 10⁻² | ENSG00000211640.4 |
| IGKV3-11 | 1.82 | 3.08 | 19.26 | 1.14 × 10⁻⁵ | 1.44 × 10⁻² | ENSG00000241351.3 |
| HIST1H1B | 1.42 | 5.57 | 18.96 | 1.33 × 10⁻⁵ | 1.65 × 10⁻² | ENSG00000184357.5 |
| AL031777.3 | 1.1 | 4.35 | 18.9 | 1.38 × 10⁻⁵ | 1.67 × 10⁻² | ENSG00000282988.2 |
| HIST1H4D | 1.32 | 3.92 | 18.73 | 1.51 × 10⁻⁵ | 1.79 × 10⁻² | ENSG00000277157.2 |
| IGHV3-64D | 2.31 | 0.26 | 18.57 | 1.64 × 10⁻⁵ | 1.90 × 10⁻² | ENSG00000282639.1 |
| IGLV2-8 | 1.96 | 2.03 | 18.53 | 1.67 × 10⁻⁵ | 1.90 × 10⁻² | ENSG00000278196.3 |
| TNFRSF17 | 1.55 | 1.62 | 18.48 | 1.72 × 10⁻⁵ | 1.92 × 10⁻² | ENSG00000048462.11 |
| AC093010.3 | −3.53 | 1.2 | 18.44 | 1.76 × 10⁻⁵ | 1.93 × 10⁻² | ENSG00000259976.3 |
| IGLV3-25 | 2.84 | 2.92 | 18.32 | 1.87 × 10⁻⁵ | 2.01 × 10⁻² | ENSG00000211659.2 |
| IGHV1-2 | 1.7 | 2.01 | 18.23 | 1.96 × 10⁻⁵ | 2.06 × 10⁻² | ENSG00000211934.3 |
| HIST1H2AB | 1.23 | 2.32 | 18.18 | 2.01 × 10⁻⁵ | 2.08 × 10⁻² | ENSG00000278463.2 |
| PDZK1IP1 | −1.62 | 4.52 | 17.91 | 2.32 × 10⁻⁵ | 2.36 × 10⁻² | ENSG00000162366.8 |
| JUP | 1.06 | 3.66 | 17.85 | 2.39 × 10⁻⁵ | 2.37 × 10⁻² | ENSG00000173801.17 |
| IGHV5-51 | 1.52 | 2.46 | 17.83 | 2.41 × 10⁻⁵ | 2.37 × 10⁻² | ENSG00000211966.2 |
| HIST1H2BD | 1.4 | 5.26 | 17.8 | 2.45 × 10⁻⁵ | 2.37 × 10⁻² | ENSG00000158373.8 |
| AC139495.1 | 1.16 | 4.12 | 17.47 | 2.92 × 10⁻⁵ | 2.77 × 10⁻² | ENSG00000248477.6 |
| IGHV4-59 | 1.63 | 3.15 | 17.2 | 3.36 × 10⁻⁵ | 3.14 × 10⁻² | ENSG00000224373.3 |
| IFI44L | 2.34 | 8.64 | 17.17 | 3.42 × 10⁻⁵ | 3.14 × 10⁻² | ENSG00000137959.16 |
| AC007556.1 | 1.95 | 0.23 | 16.98 | 3.78 × 10⁻⁵ | 3.42 × 10⁻² | ENSG00000235321.1 |
| HIST1H4I | 1.01 | 3.33 | 16.74 | 4.29 × 10⁻⁵ | 3.73 × 10⁻² | ENSG00000276180.1 |
| HIST1H1PS1 | 1.36 | 1.62 | 16.73 | 4.30 × 10⁻⁵ | 3.73 × 10⁻² | ENSG00000216331.2 |
| LY6E | 1.33 | 6.11 | 16.72 | 4.32 × 10⁻⁵ | 3.73 × 10⁻² | ENSG00000160932.11 |
| IGHV4-31 | 1.86 | 1.5 | 16.51 | 4.84 × 10⁻⁵ | 4.11 × 10⁻² | ENSG00000231475.3 |
| AC016993.1 | −4.03 | −1.48 | 16.47 | 4.93 × 10⁻⁵ | 4.11 × 10⁻² | ENSG00000258178.1 |
| HIST1H2BG | 1.23 | 4.05 | 16.42 | 5.07 × 10⁻⁵ | 4.11 × 10⁻² | ENSG00000273802.2 |
| HIST1H2AH | 1.21 | 3.21 | 16.41 | 5.10 × 10⁻⁵ | 4.11 × 10⁻² | ENSG00000274997.2 |
| IGLV2-14 | 1.29 | 3.45 | 16.4 | 5.13 × 10⁻⁵ | 4.11 × 10⁻² | ENSG00000211666.2 |
| IFI44 | 2.15 | 7.31 | 16.3 | 5.40 × 10⁻⁵ | 4.26 × 10⁻² | ENSG00000137965.11 |
| IGLV2-11 | 1.53 | 1.73 | 16.28 | 5.46 × 10⁻⁵ | 4.26 × 10⁻² | ENSG00000211668.2 |
| RF00019 | 1.38 | 1.59 | 16.23 | 5.61 × 10⁻⁵ | 4.30 × 10⁻² | ENSG00000207117.1 |
| SIGLEC1 | 2.52 | 6.38 | 16.21 | 5.66 × 10⁻⁵ | 4.30 × 10⁻² | ENSG00000088827.12 |
| HIST1H3J | 1.19 | 2.85 | 16.09 | 6.03 × 10⁻⁵ | 4.47 × 10⁻² | ENSG00000197153.5 |
| IGHG2 | 1.14 | 3.98 | 16.09 | 6.04 × 10⁻⁵ | 4.47 × 10⁻² | ENSG00000211893.4 |
| AC245128.3 | 4.59 | −1.21 | 15.98 | 6.40 × 10⁻⁵ | 4.67 × 10⁻² | ENSG00000268734.1 |
| Gene Name | logFC | logCPM | LR | p-Value | FDR | Ensembl_ID |
|---|---|---|---|---|---|---|
| ISG15 | 4.76 | 8.21 | 56.21 | 6.51 × 10⁻¹⁴ | 2.26 × 10⁻⁹ | ENSG00000187608.10 |
| IFITM1 | 4.21 | 7.00 | 48.81 | 2.83 × 10⁻¹² | 4.91 × 10⁻⁸ | ENSG00000185885.16 |
| IRF7 | 5.53 | 5.15 | 41.16 | 1.40 × 10⁻¹⁰ | 1.63 × 10⁻⁶ | ENSG00000185507.21 |
| CXCL11 | 7.02 | 4.02 | 40.48 | 1.99 × 10⁻¹⁰ | 1.73 × 10⁻⁶ | ENSG00000169248.13 |
| IFIT2 | 4.95 | 5.55 | 35.61 | 2.41 × 10⁻⁹ | 1.67 × 10⁻⁵ | ENSG00000119922.10 |
| C1QB | 5.26 | 4.40 | 28.84 | 7.85 × 10⁻⁸ | 4.55 × 10⁻⁴ | ENSG00000173369.17 |
| IFITM3 | 3.07 | 7.10 | 28.01 | 1.21 × 10⁻⁷ | 5.99 × 10⁻⁴ | ENSG00000142089.16 |
| CXCL10 | 6.01 | 4.70 | 27.17 | 1.86 × 10⁻⁷ | 8.09 × 10⁻⁴ | ENSG00000169245.6 |
| PSAP | 3.34 | 6.67 | 26.35 | 2.84 × 10⁻⁷ | 1.10 × 10−³ | ENSG00000197746.14 |
| IFI30 | 2.69 | 6.70 | 22.43 | 2.18 × 10⁻⁶ | 7.38 × 10−³ | ENSG00000216490.4 |
| IFI35 | 3.79 | 4.86 | 22.30 | 2.34 × 10⁻⁶ | 7.38 × 10−³ | ENSG00000068079.8 |
| EPSTI1 | 4.37 | 4.04 | 21.38 | 3.78 × 10⁻⁶ | 1.09 × 10⁻² | ENSG00000133106.14 |
| IL10RA | 5.83 | 3.15 | 21.11 | 4.33 × 10⁻⁶ | 1.16 × 10⁻² | ENSG00000110324.11 |
| FCGR3A | 4.93 | 3.61 | 20.73 | 5.28 × 10⁻⁶ | 1.31 × 10⁻² | ENSG00000203747.12 |
| IFIT1 | 2.72 | 6.27 | 20.50 | 5.97 × 10⁻⁶ | 1.38 × 10⁻² | ENSG00000185745.10 |
| LAG3 | 5.92 | 2.88 | 20.36 | 6.43 × 10⁻⁶ | 1.40 × 10⁻² | ENSG00000089692.9 |
| LAP3 | 3.14 | 5.75 | 20.04 | 7.58 × 10⁻⁶ | 1.55 × 10⁻² | ENSG00000002549.12 |
| HLA-B | 2.61 | 7.07 | 19.75 | 8.80 × 10⁻⁶ | 1.59 × 10⁻² | ENSG00000234745.11 |
| IFI6 | 2.37 | 7.08 | 19.67 | 9.20 × 10⁻⁶ | 1.59 × 10⁻² | ENSG00000126709.15 |
| BST2 | 3.17 | 5.49 | 19.60 | 9.55 × 10⁻⁶ | 1.59 × 10⁻² | ENSG00000130303.13 |
| AC020763.4 | 5.83 | 3.06 | 19.54 | 9.87 × 10⁻⁶ | 1.59 × 10⁻² | ENSG00000279569.1 |
| IFI27 | 2.46 | 7.93 | 19.48 | 1.01 × 10⁻⁵ | 1.59 × 10⁻² | ENSG00000165949.12 |
| DHX58 | 5.03 | 3.70 | 19.42 | 1.05 × 10⁻⁵ | 1.59 × 10⁻² | ENSG00000108771.13 |
| NAPSB | 4.43 | 3.74 | 19.30 | 1.12 × 10⁻⁵ | 1.62 × 10⁻² | ENSG00000131401.11 |
| OS9 | 3.61 | 4.86 | 19.06 | 1.27 × 10⁻⁵ | 1.77 × 10⁻² | ENSG00000135506.16 |
| MNDA | 3.80 | 4.90 | 18.58 | 1.63 × 10⁻⁵ | 1.96 × 10⁻² | ENSG00000163563.8 |
| HLA-DRA | 2.84 | 6.65 | 18.55 | 1.65 × 10⁻⁵ | 1.96 × 10⁻² | ENSG00000204287.14 |
| LY6E | 2.32 | 7.05 | 18.54 | 1.67 × 10⁻⁵ | 1.96 × 10⁻² | ENSG00000160932.11 |
| GADD45B | 3.46 | 4.94 | 18.47 | 1.72 × 10⁻⁵ | 1.96 × 10⁻² | ENSG00000099860.9 |
| ISG20 | 2.90 | 5.45 | 18.46 | 1.74 × 10⁻⁵ | 1.96 × 10⁻² | ENSG00000172183.15 |
| FOS | 2.91 | 5.60 | 18.45 | 1.75 × 10⁻⁵ | 1.96 × 10⁻² | ENSG00000170345.10 |
| MRPS34 | 3.77 | 4.84 | 18.25 | 1.93 × 10⁻⁵ | 2.10 × 10⁻² | ENSG00000074071.15 |
| HLA-A | 2.37 | 6.52 | 18.07 | 2.13 × 10⁻⁵ | 2.25 × 10⁻² | ENSG00000206503.13 |
| MT-ND6 | 2.44 | 11.17 | 17.79 | 2.47 × 10⁻⁵ | 2.52 × 10⁻² | ENSG00000198695.2 |
| ERP44 | 3.52 | 4.57 | 17.55 | 2.79 × 10⁻⁵ | 2.77 × 10⁻² | ENSG00000023318.8 |
| GZMB | 5.14 | 3.65 | 17.13 | 3.48 × 10⁻⁵ | 3.36 × 10⁻² | ENSG00000100453.13 |
| HLA-DPA1 | 2.93 | 5.63 | 16.68 | 4.41 × 10⁻⁵ | 4.15 × 10⁻² | ENSG00000231389.7 |
| TNFAIP6 | 5.38 | 2.27 | 16.59 | 4.63 × 10⁻⁵ | 4.23 × 10⁻² | ENSG00000123610.5 |
| IL4I1 | 3.84 | 3.94 | 16.26 | 5.52 × 10⁻⁵ | 4.92 × 10⁻² | ENSG00000104951.16 |
| CMPK2 | 4.18 | 4.17 | 16.20 | 5.69 × 10⁻⁵ | 4.95 × 10⁻² | ENSG00000134326.11 |
| GO Molecular Function Complete | Number | Over/Under | p-Value | FDR |
|---|---|---|---|---|
| immunoglobulin receptor binding (GO:0034987) | 72 | + | 0.00 | 0.00 |
| olfactory receptor activity (GO:0004984) | 369 | − | 0.00 | 0.00 |
| antigen binding (GO:0003823) | 127 | + | 0.00 | 0.00 |
| G protein-coupled receptor activity (GO:0004930) | 615 | − | 1.11 × 10⁻¹⁶ | 7.02 × 10⁻¹⁴ |
| transmembrane signaling receptor activity (GO:0004888) | 698 | − | 6.00 × 10⁻¹⁵ | 3.03 × 10⁻¹² |
| molecular transducer activity (GO:0060089) | 745 | − | 6.46 × 10⁻¹⁴ | 2.33 × 10⁻¹¹ |
| signaling receptor activity (GO:0038023) | 745 | − | 6.46 × 10⁻¹⁴ | 2.72 × 10⁻¹¹ |
| odorant binding (GO:0005549) | 102 | − | 2.78 × 10⁻¹¹ | 8.79 × 10⁻⁹ |
| RNA binding (GO:0003723) | 295 | + | 9.79 × 10⁻¹⁰ | 2.75 × 10⁻⁷ |
| structural constituent of chromatin (GO:0030527) | 54 | + | 2.92 × 10⁻⁹ | 7.39 × 10⁻⁷ |
| nucleic acid binding (GO:0003676) | 951 | + | 1.78 × 10⁻⁷ | 4.10 × 10⁻⁵ |
| structural constituent of ribosome (GO:0003735) | 45 | + | 2.27 × 10⁻⁶ | 4.79 × 10⁻⁴ |
| catalytic activity. acting on a nucleic acid (GO:0140640) | 91 | + | 3.31 × 10⁻⁶ | 6.44 × 10⁻⁴ |
| heterocyclic compound binding (GO:1901363) | 1311 | + | 5.85 × 10⁻⁶ | 1.06 × 10−³ |
| organic cyclic compound binding (GO:0097159) | 1332 | + | 9.36 × 10⁻⁶ | 1.58 × 10−³ |
| oxygen binding (GO:0019825) | 13 | − | 4.05 × 10⁻⁵ | 6.40 × 10−³ |
| heme binding (GO:0020037) | 36 | − | 1.17 × 10⁻⁴ | 1.75 × 10⁻² |
| catalytic activity. acting on RNA (GO:0140098) | 67 | + | 1.34 × 10⁻⁴ | 1.89 × 10⁻² |
| protein binding (GO:0005515) | 3412 | + | 1.84 × 10⁻⁴ | 2.45 × 10⁻² |
| oxygen carrier activity (GO:0005344) | 8 | − | 2.41 × 10⁻⁴ | 3.05 × 10⁻² |
| Rank | Score | Perturbation | Cell-Line | Dose | Time |
|---|---|---|---|---|---|
| 1 | 0.4706 | BML-259 | DV90 | 80.0 um | 6.0 h |
| 2 | 0.4118 | BRD-K12184916 | SNGM | 0.63 um | 6.0 h |
| 3 | 0.3529 | Dilazep dihydrochloride | A549 | 10.0 um | 6.0 h |
| 4 | 0.3529 | 16-HYDROXYTRIPTOLIDE | AGS | 0.08 um | 6.0 h |
| 5 | 0.3529 | TG101348 | DV90 | 11.1 um | 6.0 h |
| 6 | 0.3529 | HLI 373 | SNGM | 10.0 um | 6.0 h |
| 7 | 0.3529 | 528116.cdx | SNGM | 0.09 um | 6.0 h |
| 8 | 0.3529 | BRD-K68548958 | SNGM | 20.0 um | 6.0 h |
| 9 | 0.3529 | N9-isoproplyolomoucine | TYKNU | 122.55 um | 6.0 h |
| 10 | 0.3529 | BRD-K68756823 | VCAP | 10.0 um | 24.0 h |
| 11 | 0.3529 | vorinostat | HCC515 | 3.33 um | 24 h |
| 12 | 0.2941 | TG101348 | NCIH2073 | 11.1 um | 6.0 h |
| 13 | 0.2941 | 528116.cdx | NCIH2073 | 0.09 um | 6.0 h |
| 14 | 0.2941 | curcumin | SNGM | 48.0 um | 6.0 h |
| 15 | 0.2941 | MK-0591 | U937 | 80.0 um | 6.0 h |
| 16 | 0.2941 | chaetocin | VCAP | 0.08 um | 6.0 h |
| 17 | 0.2941 | NCGC00185090-03 | HEPG2 | 10.0 um | 6.0 h |
| 18 | 0.2941 | BRD-K23657553 | SKB | 10.0 um | 24.0 h |
| 19 | 0.2941 | BRD-K63945320 | ASC | 10.0 um | 24.0 h |
| 20 | 0.2941 | BRD-K11927976 | HEPG2 | 10.0 um | 6.0 h |
| 21 | 0.2941 | BRD-K48692744 | A549 | 10.0 um | 24.0 h |
| 22 | 0.2941 | BRD-K63606607 | MCF7 | 10.0 um | 6.0 h |
| 23 | 0.2941 | ZM-447439 | MCF7 | 3.33 um | 24 h |
| 24 | 0.2941 | PD-0325901 | HEPG2 | 10 um | 24 h |
| 25 | 0.2941 | GSK-461364 | HEPG2 | 0.12 um | 24 h |
| 26 | 0.2941 | KU-60019 | HEPG2 | 10 um | 24 h |
| 27 | 0.2941 | torin-2 | SKBR3 | 10 um | 24 h |
| 28 | 0.2941 | torin-2 | SKBR3 | 3.33 um | 24 h |
| 29 | 0.2941 | NU-7441 | SKBR3 | 10 um | 3 h |
| 30 | 0.2941 | torin-2 | SKBR3 | 10 um | 3 h |
| 31 | 0.2941 | GSK-2126458 | MCF7 | 3.33 um | 3 h |
| 32 | 0.2941 | QL-XII-47 | SKBR3 | 10 um | 24 h |
| 33 | 0.2941 | pazopanib | HCC515 | 3.33 um | 24 h |
| 34 | 0.2353 | NOCODAZOLE | HA1E | 10.0 um | 24.0 h |
| 35 | 0.2353 | CYCLOHEXIMIDE | VCAP | 10.0 um | 6.0 h |
| 36 | 0.2353 | CARBAMAZEPINE | VCAP | 10.0 um | 6.0 h |
| 37 | 0.2353 | CGS 15943 | MCF7 | 10.0 um | 6.0 h |
| 38 | 0.2353 | N9-isoproplyolomoucine | A549 | 122.55 um | 6.0 h |
| 39 | 0.2353 | PROSTAGLANDIN A1 | A673 | 1.0 um | 6.0 h |
| 40 | 0.2353 | PI 103 hydrochloride | A673 | 11.1 um | 6.0 h |
| 41 | 0.2353 | AG14361 | AGS | 25.0 um | 6.0 h |
| 42 | 0.2353 | COT-10b | AGS | 44.4 um | 6.0 h |
| 43 | 0.2353 | AG14361 | CORL23 | 25.0 um | 6.0 h |
| 44 | 0.2353 | Narciclasine | CORL23 | 10.0 um | 6.0 h |
| 45 | 0.2353 | 16-HYDROXYTRIPTOLIDE | DV90 | 0.08 um | 6.0 h |
| 46 | 0.2353 | QUINACRINE HYDROCHLORIDE | DV90 | 10.0 um | 6.0 h |
| 47 | 0.2353 | KU 0.060648 trihydrochloride | DV90 | 10.0 um | 6.0 h |
| 48 | 0.2353 | COT-10b | DV90 | 44.4 um | 6.0 h |
| 49 | 0.2353 | PNU 74654 | DV90 | 80.0 um | 6.0 h |
| 50 | 0.2353 | BRD-K68548958 | H1299 | 20.0 um | 6.0 h |
| Rank | Score | Combination | |
|---|---|---|---|
| 1 | 0.6471 | 2. BRD-K12184916 | 34. NOCODAZOLE |
| 2 | 0.5882 | 1. BML-259 | 2. BRD-K12184916 |
| 3 | 0.5882 | 1. BML-259 | 3. Dilazep dihydrochloride |
| 4 | 0.5882 | 1. BML-259 | 9. N9-isoproplyolomoucine |
| 5 | 0.5882 | 1. BML-259 | 19. BRD-K63945320 |
| 6 | 0.5882 | 3. Dilazep dihydrochloride | 34. NOCODAZOLE |
| 7 | 0.5882 | 4. 16-HYDROXYTRIPTOLIDE | 34. NOCODAZOLE |
| 8 | 0.5882 | 5. TG101348 | 34. NOCODAZOLE |
| 9 | 0.5882 | 6. HLI 373 | 34. NOCODAZOLE |
| 10 | 0.5882 | 7. 528116.cdx | 34. NOCODAZOLE |
| 11 | 0.5882 | 10. BRD-K68756823 | 34. NOCODAZOLE |
| 12 | 0.5882 | 11. vorinostat | 34. NOCODAZOLE |
| 13 | 0.5294 | 1. BML-259 | 4. 16-HYDROXYTRIPTOLIDE |
| 14 | 0.5294 | 1. BML-259 | 5. TG101348 |
| 15 | 0.5294 | 1. BML-259 | 6. HLI 373 |
| 16 | 0.5294 | 1. BML-259 | 7. 528116.cdx |
| 17 | 0.5294 | 1. BML-259 | 8. BRD-K68548958 |
| 18 | 0.5294 | 1. BML-259 | 10. BRD-K68756823 |
| 19 | 0.5294 | 1. BML-259 | 11. vorinostat |
| 20 | 0.5294 | 1. BML-259 | 12. TG101348 |
| 21 | 0.5294 | 1. BML-259 | 16. chaetocin |
| 22 | 0.5294 | 2. BRD-K12184916 | 17. NCGC00185090-03 |
| 23 | 0.5294 | 1. BML-259 | 18. BRD-K23657553 |
| 24 | 0.5294 | 2. BRD-K12184916 | 19. BRD-K63945320 |
| 25 | 0.5294 | 1. BML-259 | 20. BRD-K11927976 |
| 26 | 0.5294 | 2. BRD-K12184916 | 21. BRD-K48692744 |
| 27 | 0.5294 | 1. BML-259 | 23. ZM-447439 |
| 28 | 0.5294 | 2. BRD-K12184916 | 23. ZM-447439 |
| 29 | 0.5294 | 1. BML-259 | 24. PD-0325901 |
| 30 | 0.5294 | 2. BRD-K12184916 | 25. GSK-461364 |
| 31 | 0.5294 | 1. BML-259 | 26. KU-60019 |
| 32 | 0.5294 | 1. BML-259 | 27. torin-2 |
| 33 | 0.5294 | 1. BML-259 | 28. torin-2 |
| 34 | 0.5294 | 1. BML-259 | 30. torin-2 |
| 35 | 0.5294 | 1. BML-259 | 31. GSK-2126458 |
| 36 | 0.5294 | 1. BML-259 | 32. QL-XII-47 |
| 37 | 0.5294 | 1. BML-259 | 34. NOCODAZOLE |
| 38 | 0.5294 | 8. BRD-K68548958 | 34. NOCODAZOLE |
| 39 | 0.5294 | 9. N9-isoproplyolomoucine | 34. NOCODAZOLE |
| 40 | 0.5294 | 12. TG101348 | 34. NOCODAZOLE |
| 41 | 0.5294 | 13. 528116.cdx | 34. NOCODAZOLE |
| 42 | 0.5294 | 14. curcumin | 34. NOCODAZOLE |
| 43 | 0.5294 | 16. chaetocin | 34. NOCODAZOLE |
| 44 | 0.5294 | 18. BRD-K23657553 | 34. NOCODAZOLE |
| 45 | 0.5294 | 20. BRD-K11927976 | 34. NOCODAZOLE |
| 46 | 0.5294 | 22. BRD-K63606607 | 34. NOCODAZOLE |
| 47 | 0.5294 | 24. PD-0325901 | 34. NOCODAZOLE |
| 48 | 0.5294 | 26. KU-60019 | 34. NOCODAZOLE |
| 49 | 0.5294 | 27. torin-2 | 34. NOCODAZOLE |
| 50 | 0.5294 | 28. torin-2 | 34. NOCODAZOLE |
| Tissue | Type | ID | dPSI | p-Value | Gene |
|---|---|---|---|---|---|
| Nasal | Event | ENSG00000137502.10;SE:chr11:82987770-82994039:82994122-82997224:− | 0.2929 | 0.0475 | RAB30 |
| ENSG00000188215.10;AF:chr16:20862643-20868895:20868980:20862643-20900204:20900358:− | −0.0801 | 0.0490 | DCUN1D3 | ||
| ENSG00000198089.16;AF:chr22:31604314:31604404-31604869:31604569:31604671-31604869:+ | −0.1146 | 0.0485 | SFI1 | ||
| ENSG00000271503.6;SE:chr17:35872464-35875561:35875642-35878528:− | 0.2111 | 0.0470 | CCL5 | ||
| Isoform | ENST00000599180.2 | 0.0977 | 0.0345 | FFAR2 | |
| ENST00000601590.1 | −0.1032 | 0.0345 | FFAR2 | ||
| ENST00000324873.8 | −0.4075 | 0.0485 | NUPR1 | ||
| ENST00000395641.2 | 0.2033 | 0.0485 | NUPR1 | ||
| ENST00000567646.1 | 0.2043 | 0.0485 | NUPR1 | ||
| ENST00000324344.9 | 0.0801 | 0.0255 | DCUN1D3 | ||
| ENST00000563934.1 | −0.0801 | 0.0255 | DCUN1D3 | ||
| Blood | Event | ENSG00000115993.13;AF:chr2:201420706-201433464:201433554:201420706-201451350:201451458:− | 0.2195 | 0.0470 | TRAK2 |
| ENSG00000115993.13;AF:chr2:201420706-201433464:201433554:201420706-201451350:201451500:− | 0.2052 | 0.0470 | TRAK2 | ||
| ENSG00000205542.11;RI:chrX:12975110:12975168-12976246:12976361:+ | −0.0441 | 0.0435 | TMSB4X | ||
| ENSG00000251562.8;AF:chr11:65504519:65505019-65506386:65505207:65505662-65506386:+ | 0.1279 | 0.0130 | MALAT1 | ||
| Isoform | ENST00000379359.4 | 0.1200 | 0.0450 | RGCC | |
| ENST00000487837.1 | −0.1200 | 0.0450 | RGCC | ||
| ENST00000393085.4 | 0.1020 | 0.0470 | MTPN | ||
| ENST00000435723.1 | −0.1020 | 0.0470 | MTPN | ||
| ENST00000489359.1 | 0.2418 | 0.0400 | LIPA | ||
| ENST00000229595.6 | 0.1735 | 0.0435 | ASF1A | ||
| ENST00000511766.2 | −0.1735 | 0.0435 | ASF1A | ||
| ENST00000252818.5 | −0.0756 | 0.0490 | JUND | ||
| ENST00000600972.1 | 0.0756 | 0.0490 | JUND | ||
| ENST00000259456.7 | 0.2388 | 0.0115 | HEMGN | ||
| ENST00000616898.2 | −0.2388 | 0.0115 | HEMGN | ||
| ENST00000373474.9 | 0.1640 | 0.0405 | LMX1B | ||
| ENST00000526117.6 | −0.1889 | 0.0405 | LMX1B | ||
| ENST00000390539.2 | 0.3873 | 0.0325 | IGHA2 | ||
| ENST00000497872.4 | −0.3873 | 0.0325 | IGHA2 | ||
| ENST00000390559.6 | 0.1967 | 0.0070 | IGHM | ||
| ENST00000637539.2 | −0.1967 | 0.0070 | IGHM | ||
| ENST00000414005.1 | −0.1595 | 0.0380 | Lnc-TMEM121-3 | ||
| ENST00000418566.1 | 0.1595 | 0.0380 | Lnc-TMEM121-3 | ||
| ENST00000560255.2 | 0.1866 | 0.0445 | ST20-AS1 | ||
| ENST00000618735.1 | −0.1866 | 0.0445 | ST20-AS1 | ||
| ENST00000601040.1 | 0.1474 | 0.0410 | Lnc-TMEM38A-2 | ||
| ENST00000601687.1 | −0.1474 | 0.0410 | Lnc-TMEM38A-2 |
Disclaimer/Publisher’s Note: The statements, opinions and data contained in all publications are solely those of the individual author(s) and contributor(s) and not of MDPI and/or the editor(s). MDPI and/or the editor(s) disclaim responsibility for any injury to people or property resulting from any ideas, methods, instructions or products referred to in the content. |
© 2023 by the authors. Licensee MDPI, Basel, Switzerland. This article is an open access article distributed under the terms and conditions of the Creative Commons Attribution (CC BY) license (https://creativecommons.org/licenses/by/4.0/).
Share and Cite
Milicevic, O.; Loncar, A.; Abazovic, D.; Vukcevic, M.; Despot, D.; Djukic, T.; Djukic, V.; Milovanovic, A.; Panic, N.; Plecic, N.; et al. Transcriptome from Paired Samples Improves the Power of Comprehensive COVID-19 Host-Viral Characterization. Int. J. Mol. Sci. 2023, 24, 13125. https://doi.org/10.3390/ijms241713125
Milicevic O, Loncar A, Abazovic D, Vukcevic M, Despot D, Djukic T, Djukic V, Milovanovic A, Panic N, Plecic N, et al. Transcriptome from Paired Samples Improves the Power of Comprehensive COVID-19 Host-Viral Characterization. International Journal of Molecular Sciences. 2023; 24(17):13125. https://doi.org/10.3390/ijms241713125
Chicago/Turabian StyleMilicevic, Ognjen, Ana Loncar, Dzihan Abazovic, Marija Vukcevic, Dragana Despot, Tatjana Djukic, Vladimir Djukic, Andjela Milovanovic, Nikola Panic, Nemanja Plecic, and et al. 2023. "Transcriptome from Paired Samples Improves the Power of Comprehensive COVID-19 Host-Viral Characterization" International Journal of Molecular Sciences 24, no. 17: 13125. https://doi.org/10.3390/ijms241713125
APA StyleMilicevic, O., Loncar, A., Abazovic, D., Vukcevic, M., Despot, D., Djukic, T., Djukic, V., Milovanovic, A., Panic, N., Plecic, N., & Banko, A. (2023). Transcriptome from Paired Samples Improves the Power of Comprehensive COVID-19 Host-Viral Characterization. International Journal of Molecular Sciences, 24(17), 13125. https://doi.org/10.3390/ijms241713125