1. Introduction
Osteoarthritis (OA) is the most common age-related degenerative joint disease with chronic inflammation [
1]. The progressive destruction of articular cartilage is one of the hallmarks of OA, with loss of proteoglycan and collagen type II (two of the most prevalent components of normal hyaline cartilage), subchondral bone sclerosis, osteophyte formation, and synovial hyperplasia [
2,
3,
4,
5]. There remains a clinically unmet need to prevent, stop, or even restrain the progression of OA. Promising novel pharmacological or cell-related treatments are thus urgently important.
Inflammaging, chronic, sterile, and low-grade inflammation during aging, has been reported to contribute to the pathogenesis of age-related diseases [
6]. Moreover, senescent cells secrete matrix-degrading proteins and proinflammatory cytokines, called the “senescence-associated secretory phenotype (SASP)”. The SASP is associated with the production of proinflammatory cytokines (IL-6, IL-1α/β, etc.), chemokines (MCP-1, IL-8, etc.), growth factors (TGF-β, VEGF, etc.), and proteases (MMP-3, MMP13, etc.) [
7]. Although OA is a degenerative arthritis, low-grade inflammation appears during the OA process. The levels of several inflammatory mediators, such as IL6, IL1-β, and MCP1, were also observed to be higher in OA sera than in healthy sera [
8]. Accordingly, chondrocyte changes during OA progression are highly linked with inflammaging. Among the inflammatory mediators, IL-1β was found to be higher in the extracellular matrix of OA chondrocytes, especially surrounding the superficial zone [
9]. In addition, IL1-β was also demonstrated to drive chondrocytes toward a senescent phenotype and induce the secretion of SASP factors [
10]. Therefore, IL1-β-induced senescence in chondrocytes has been used as an in vitro OA-like cell model [
11].
Mesenchymal stem cells (MSCs), especially bone marrow MSCs (BMSCs) and adipose-derived MSCs (ADSCs), have been intensively investigated for cell-based treatment of cartilage lesions and OA in animal [
12,
13,
14] and human studies [
15,
16,
17]. Using ADSCs as the MSC source may be beneficial because a large number of ADSCs can be obtained from a relatively small amount of fat tissue [
18,
19], and the proliferation potential of ADSCs does not appear to decline with donor age [
20]. On the other hand, much evidence has shown that the efficacy of MSC therapy in OA does not result from the chondrogenesis of MSCs but relies on the paracrine effect of MSCs [
21]. The paracrine effect on tissue regeneration, immune regulation, and anti-inflammation may be from the secretome of MSCs, including growth factors, cytokines, and extracellular vesicles (EVs) [
22,
23,
24].
Exosomes are EVs with a size of approximately 40 to 160 nm that contain constituents from a cell, including DNA, RNA, lipids, metabolites, and cytosolic and cell-surface proteins [
25]. The function of exosomes is to mediate cell-to-cell communication by carrying various biologically active molecules [
26]. Studies have indicated that exosomal miRNAs play fundamental roles in cell-to-cell communication in both healthy and pathological conditions [
27,
28]. More importantly, recent studies indicated that MSC-derived exosomes could promote cartilage regeneration in OA animal studies [
29,
30]. However, it has not been well investigated whether ADSC-derived exosomes have an anti-inflammaging effect on articular chondrocytes.
Oxygen is an important component of the cellular microenvironment, serving as both a metabolic substrate and a signaling molecule. Usually, in vitro cell/tissue cultures are maintained at an atmospheric oxygen level of approximately 20% (160 mmHg); however, normal tissues exist in the body under physiological hypoxic conditions with approximately 2–9% O
2 (14–65 mmHg), which varies by location. Accordingly, MSCs exist in a physiological hypoxic environment in the body [
31,
32]. In addition, articular cartilage is avascular and receives nutrients and oxygen, mainly from the surrounding synovial fluid. The living environment of chondrocytes is approximately 6% O
2 (45 mm Hg) in the superficial zone and less than 1% O
2 (7.6 mm Hg) in the deep zone [
33]. Previous studies found that hypoxia pretreatment of human ADSCs led to better potential for chondrogenic differentiation [
34,
35]. Recent studies have shown that exosomes derived from hypoxia-cultured BMSCs can regenerate cartilage in OA animal models [
36]. However, whether hypoxia-cultured ADSC-secreted exosomes (hypoxia-ADSC-Exos) can suppress SASP and thus alleviate OA progression remains unclear. Accordingly, we hypothesize that hypoxia-ADSC-Exos have a beneficial effect on the normal functions of HACs, attenuate the SASP of OA-like HACs in vitro, and further suppress OA progression in rats. Another important issue is to search for effective molecular mechanisms of ADSC-Exos on articular chondrocytes. The miRNA profiles between hypoxia-ADSC-Exos and normoxia-ADSC-Exos will also be investigated.
3. Discussion
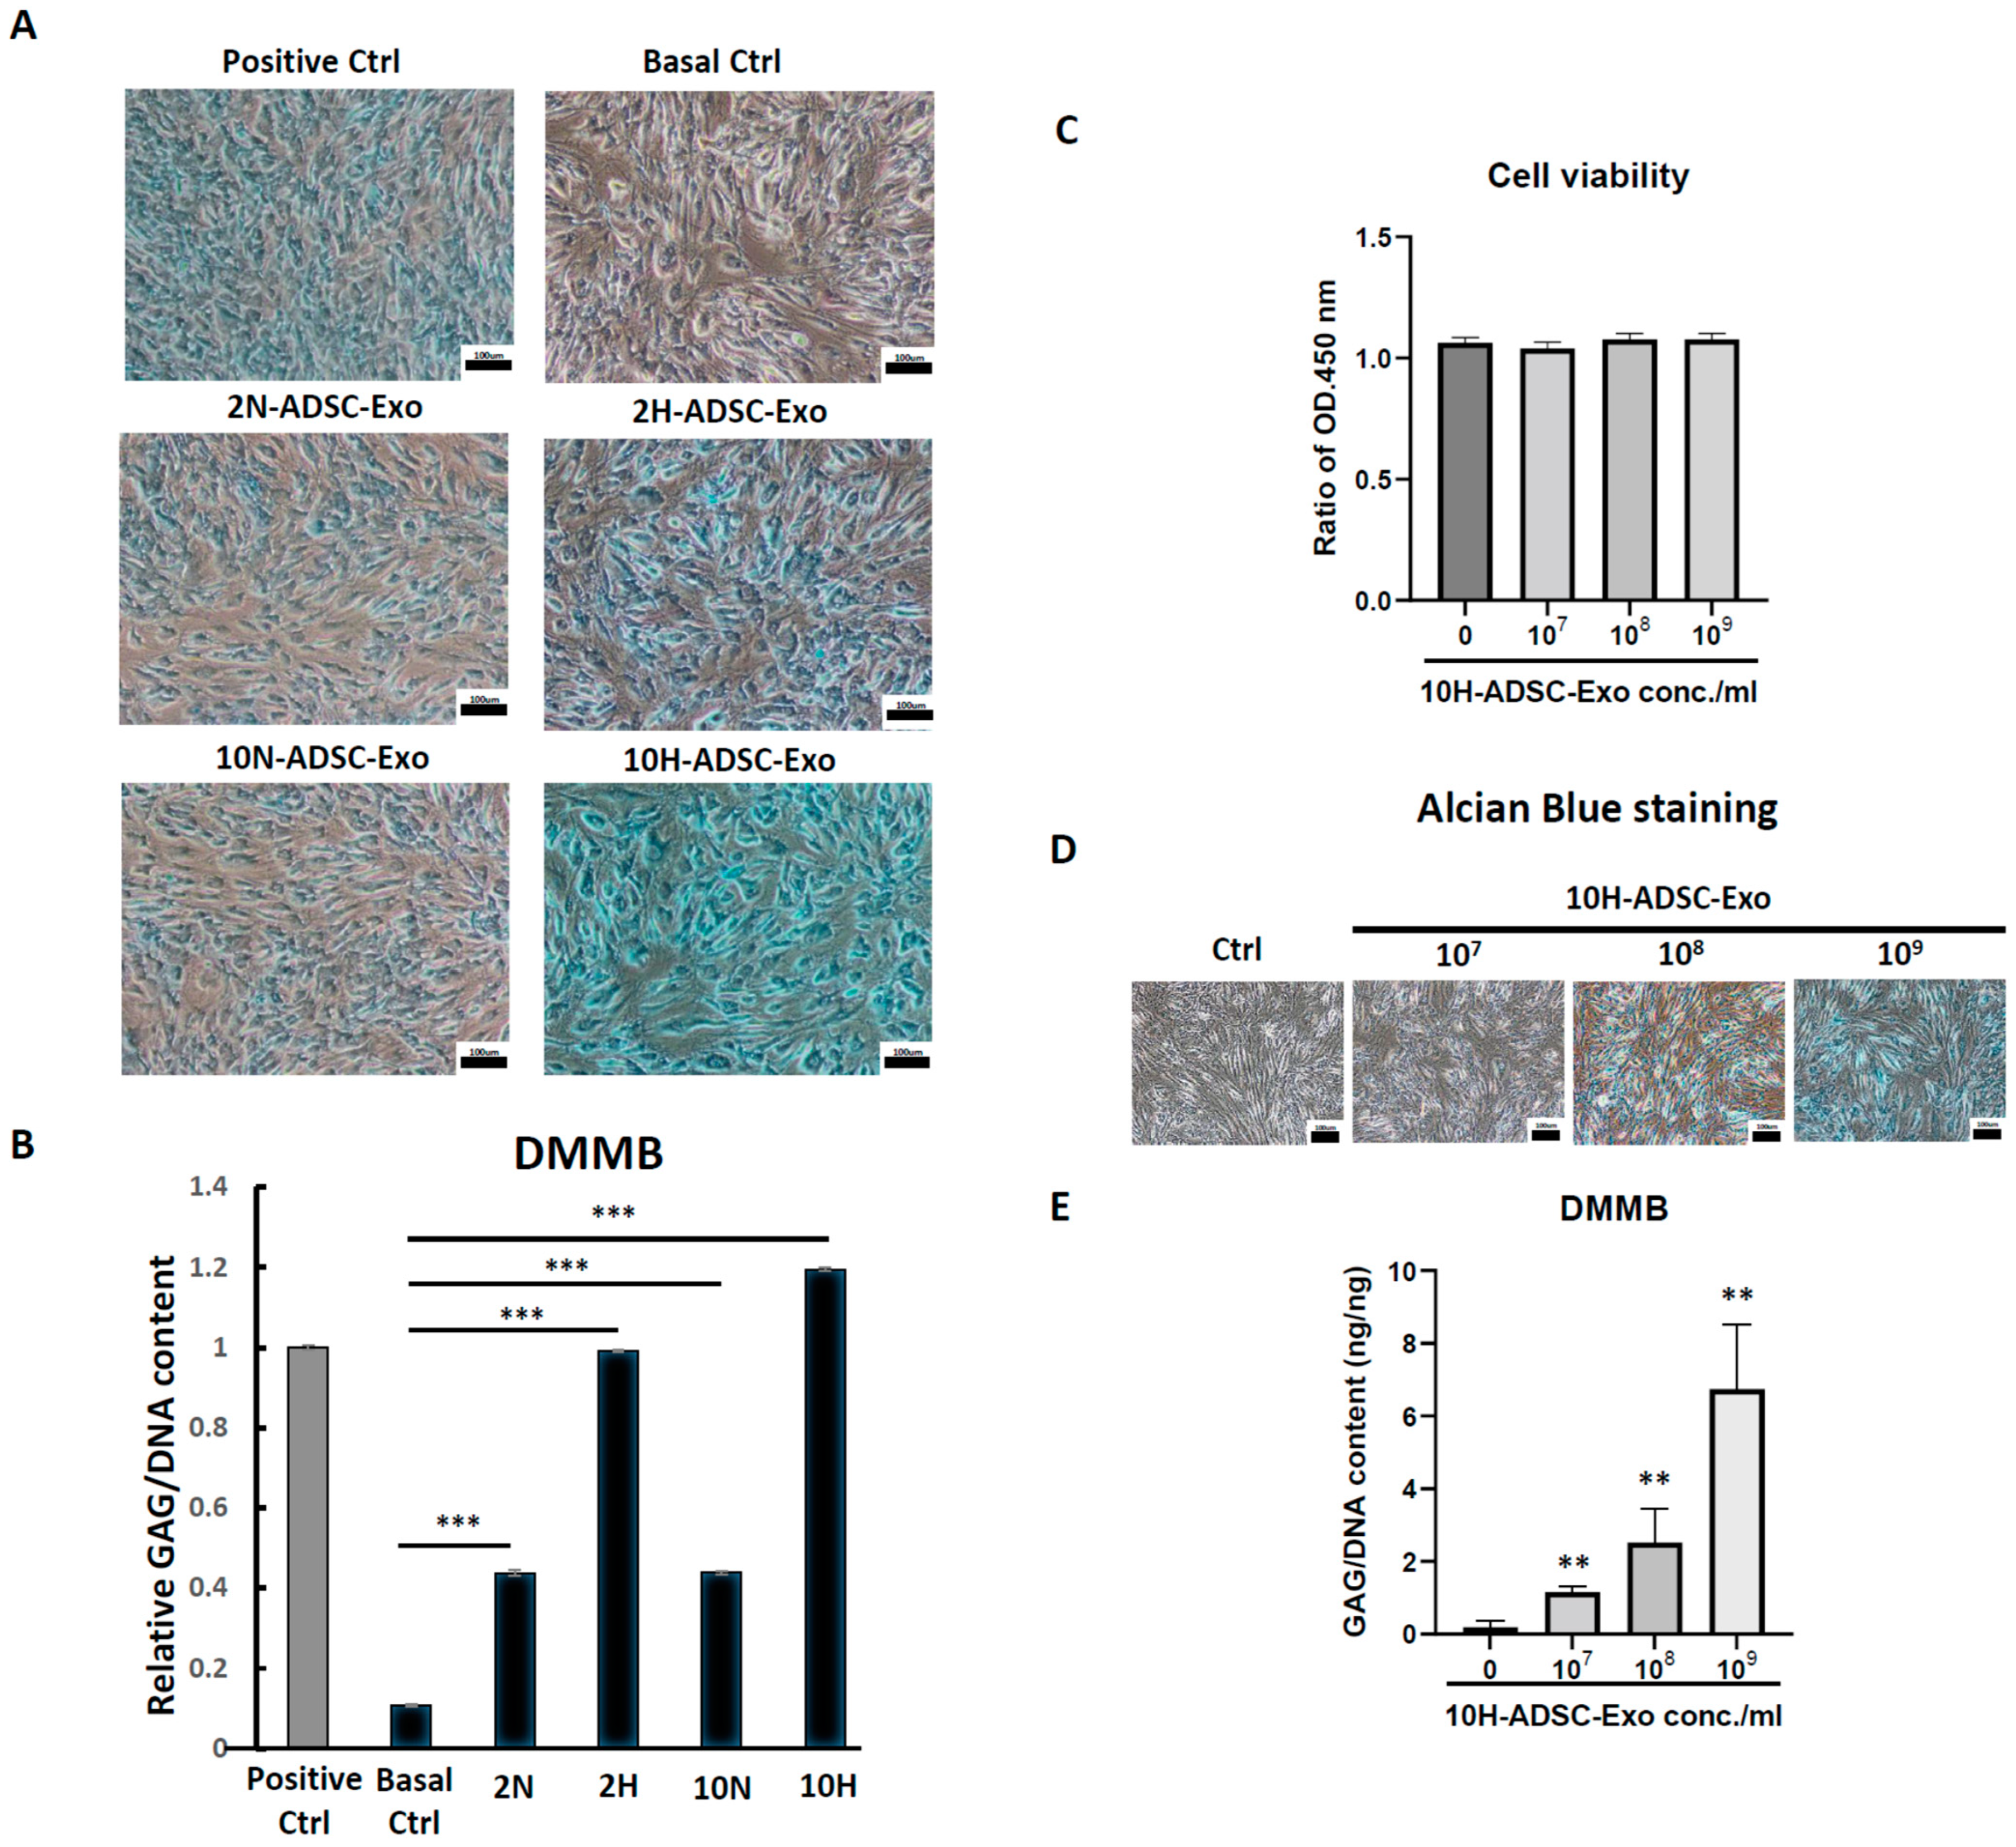
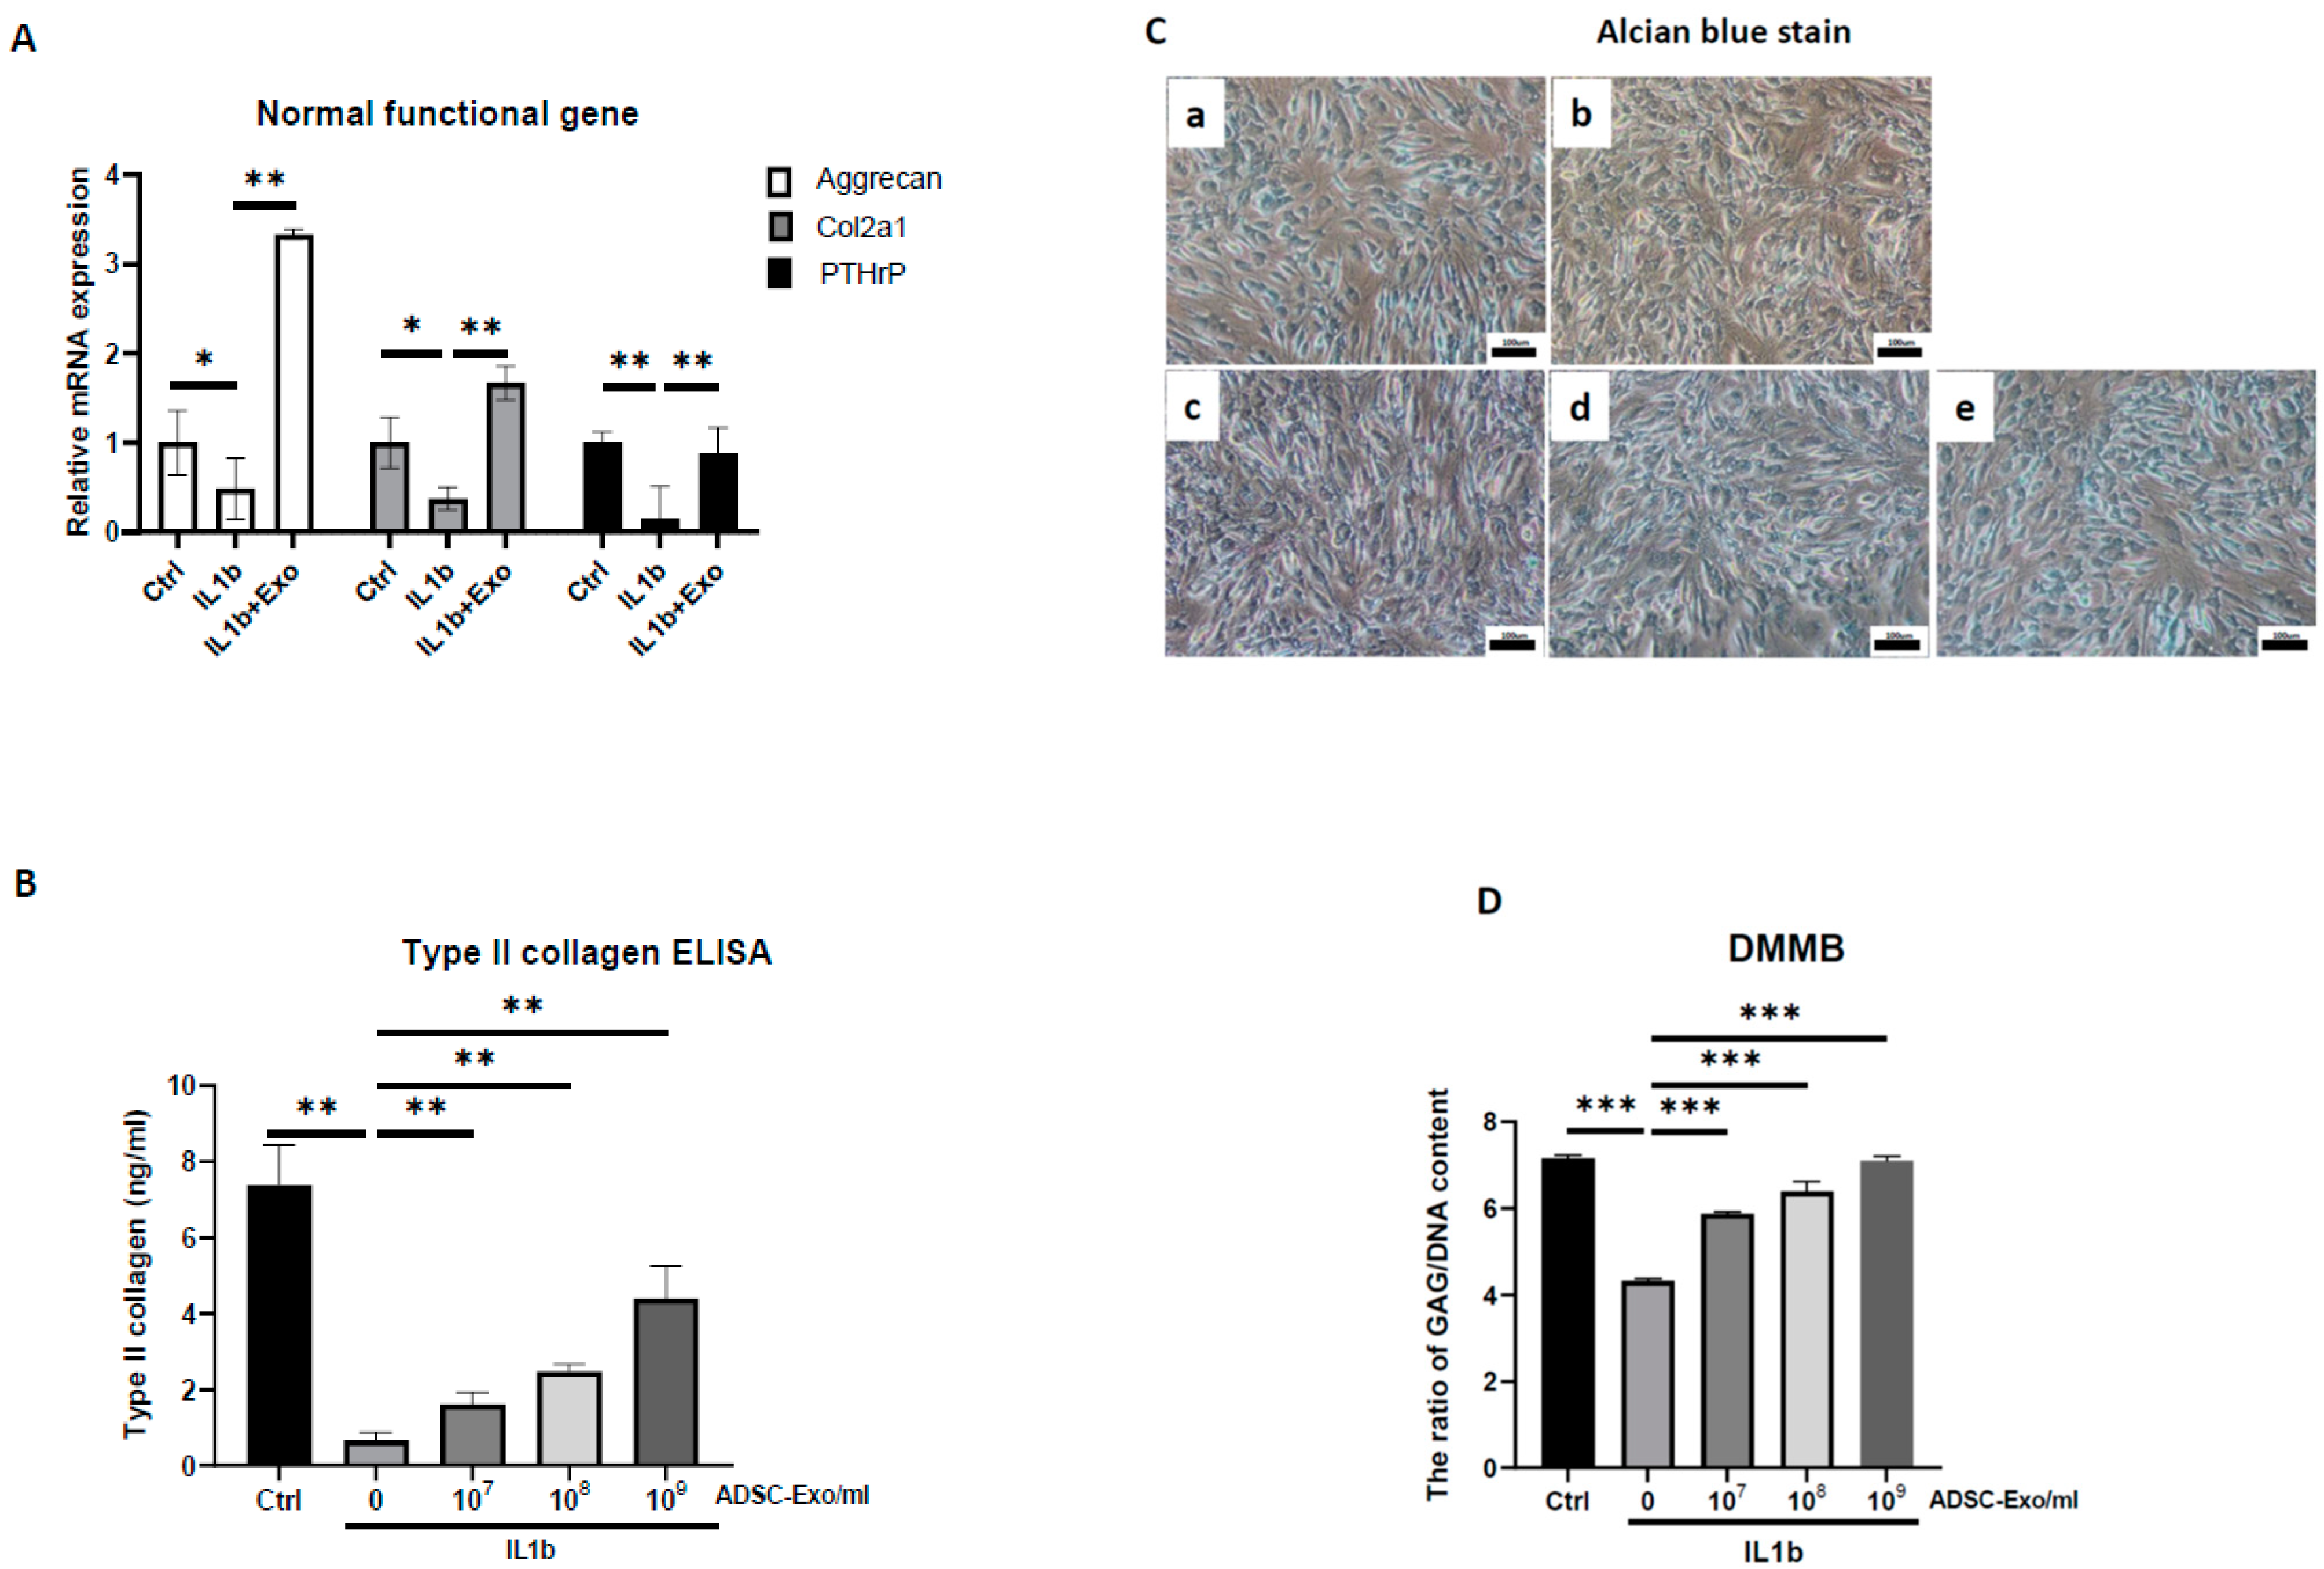
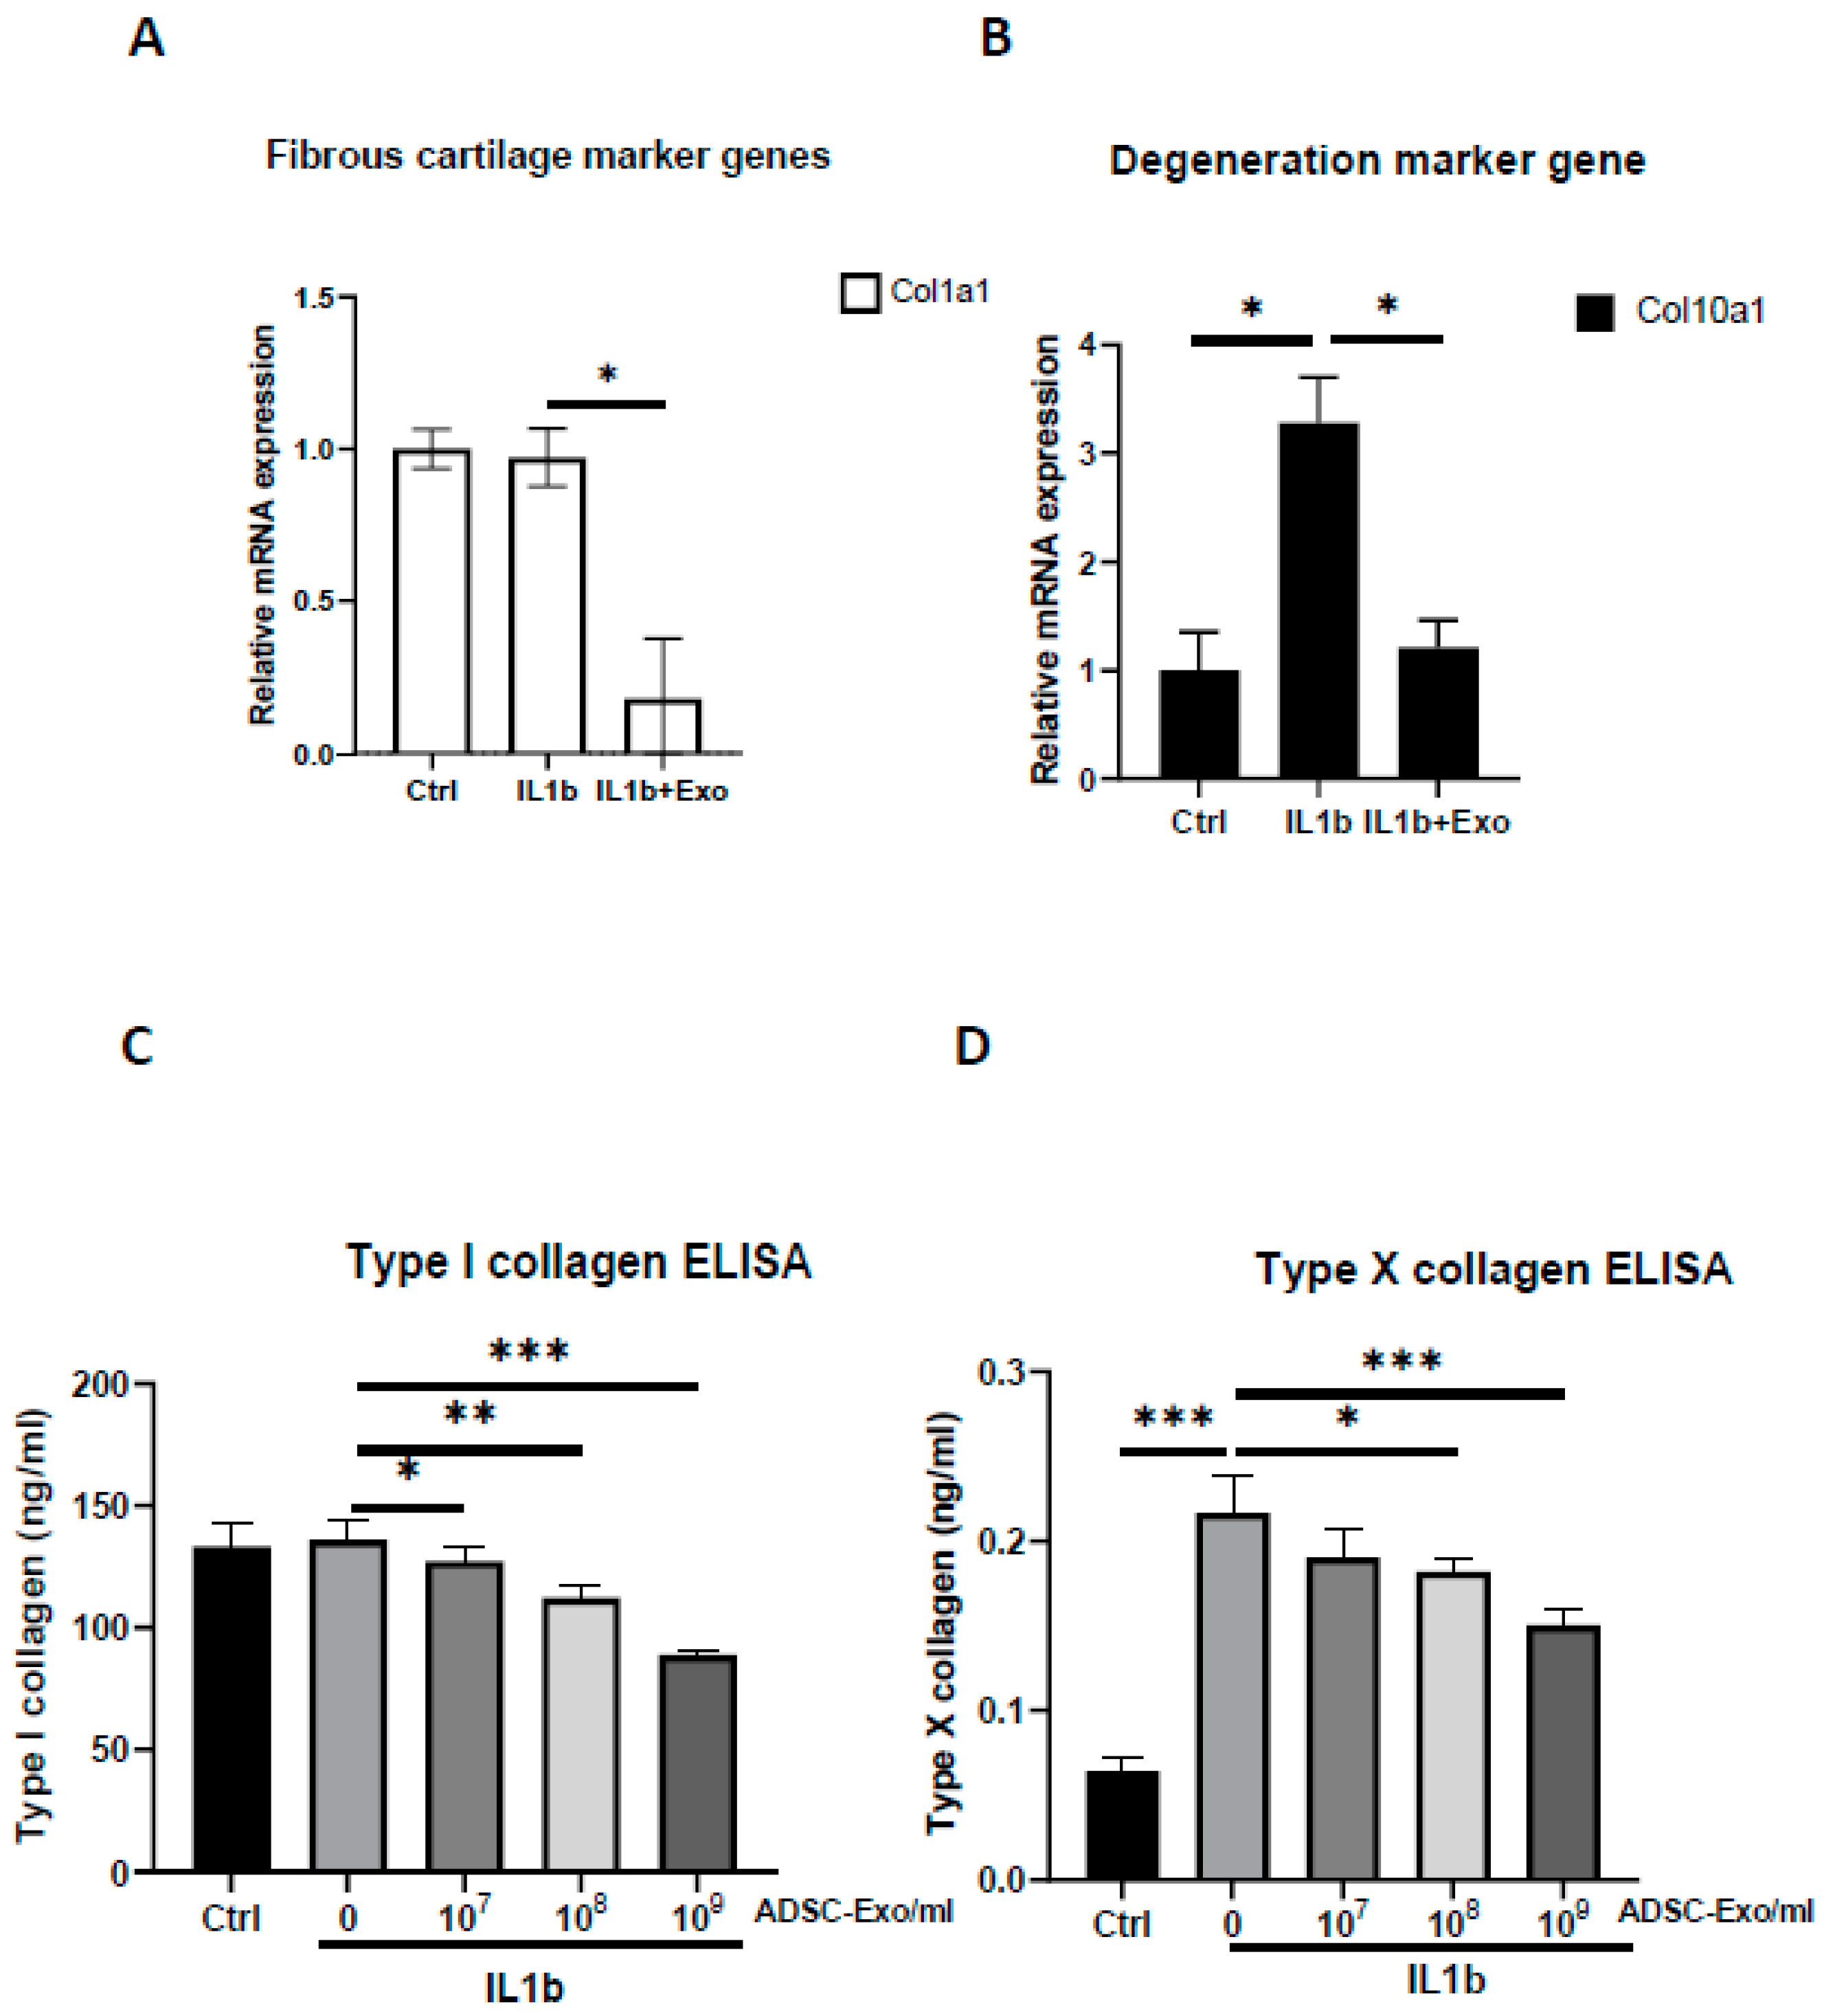
MSC-based OA treatment has become a new approach. Recently, MSC-derived exosomes have emerged as a prominent candidate. One of the most significant challenges is to obtain better quality exosomes for optimal efficacy in OA treatment. In this study, we demonstrated that exosomes derived from hypoxia (1% O2) and 10% de-Exo-FBS medium cultured ADSCs showed the best effect on HAC function compared to those cultured in normoxia or hypoxia plus 2% de-Exo-FBS. This result indicated that the culture conditions of ADSCs mimicking their physiological niche could release better quality ADSC-Exos. More importantly, we found that hypoxia-ADSC-Exos significantly suppressed the SASP, including degradation enzymes, inflammatory cytokines, and markers of degenerative cartilage, in IL-1β-induced OA-like HACs. This result indicated that hypoxia-ADSC-Exos alleviated the inflammaging of senescent articular chondrocytes. Furthermore, in this study, we first demonstrated that intra-articular treatment with hypoxia-ADSC-Exos alleviated OA progression in ACLT-OA rats, as evidenced by improved knee weight-bearing function, articular cartilage integrity, and normal matrix levels (collagen type II and GAG), as well as decreased matrix degradative enzymes (MMP13 and ADAMPs) and the inflammatory mediator IL-1β. The findings from this study demonstrated that ADSCs cultured in 1% O2 hypoxic conditions induced more effective exosomes that suppressed the inflammaging of senescent articular chondrocytes and thus alleviated OA progression in vivo.
MSCs are known to support differentiated cells in a tissue when needed. The microenvironment provides crucial niche factors for both cell types. One of the important niche factors is oxygen tension, which is much lower than that in the atmosphere. The physiological tissue oxygen tension, approximately 1–9%, is rather hypoxic compared to the 20% oxygen tension found in the atmosphere. Even though those MSCs are located close to vascular niches, their oxygen tension ranges from 1–8% [
39]. Therefore, it is proposed that MSCs require a hypoxic environment to maintain an undifferentiated status and a relative advantage. On the other hand, hypoxia-pretreated human MSCs showed a better effect on osteogenic or chondrogenic differentiation [
34,
35]. This result indicated that a hypoxic microenvironment is beneficial for MSCs by preventing destruction, maintaining stemness, and maintaining multipotent differentiation potential [
40]. Furthermore, it was also reported that stem cell-secreted bioactive molecules, trophic factors, or immunomodulatory factors may be transported by exosomes to help neighboring cells overcome stress or obtain beneficial properties [
41]. Another possible effect of hypoxia-MSCs may be to release a beneficial secretome for the surrounding differentiated cells to maintain normal function or even rescue senescence. In this study, we demonstrated that hypoxia-ADSC-derived exosomes had a better effect on maintaining the normal function of differentiated articular chondrocytes. More importantly, the hypoxia-ADSC-derived exosomes further significantly alleviated inflammaging in IL1β-induced senescent HACs by reducing their SASP.
Several clinical trials using intra-articular (IA) injections of MSCs to treat OA have achieved certain therapeutic effects; however, some studies have shown unsatisfactory results [
42]. Usually, MSC therapy uses only one IA injection. A previous study to trace IA-injected GFP-MSCs showed that only 1.6% of MSCs remained in the knee joint of OA mice [
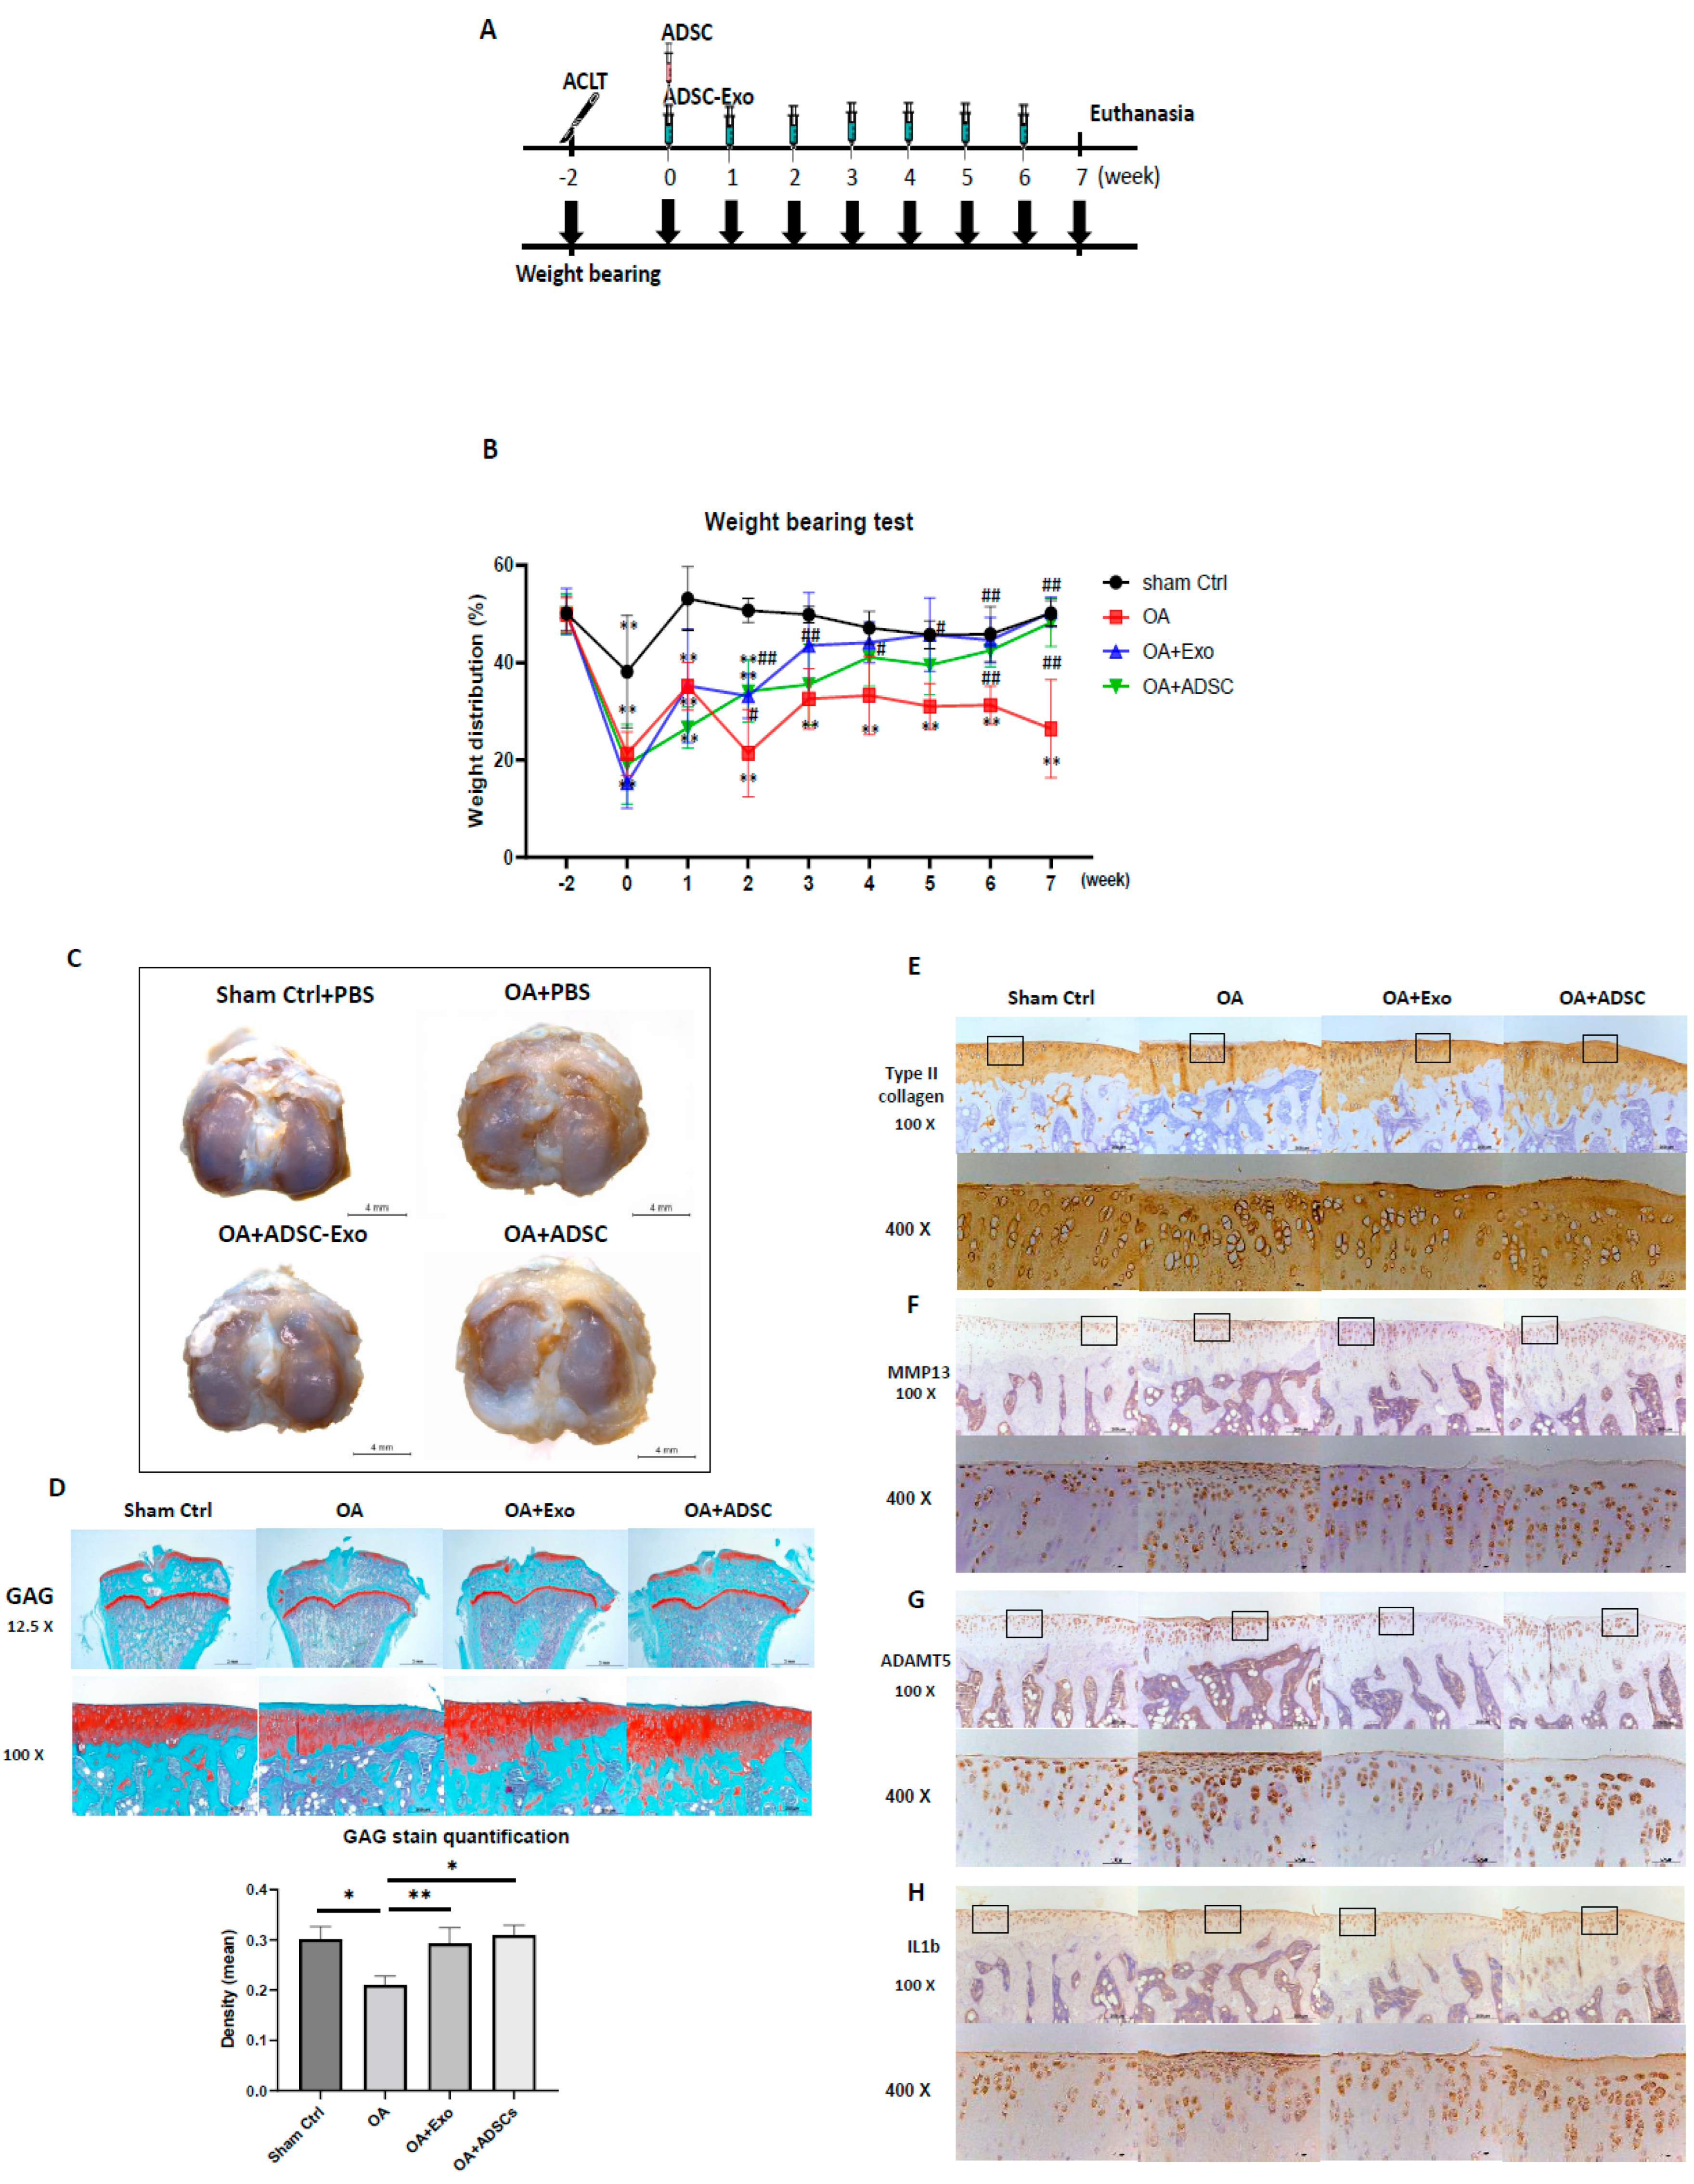
43]. Therefore, the efficacy of MSC therapy on OA may rely on MSC-secreted growth factors, cytokines, or exosomes to initiate the repair process but may not rely on MSC differentiation. Accordingly, in this study, we treated hypoxia-ADSC-exosomes with weekly IA injections seven times, mimicking the continuous secretion from ADSCs in joints, and compared the efficacy with the one-time IA injection of ADSCs simultaneously. The results revealed that both treatments of hypoxia-ADSC-exosomes and ADSCs have similar effects on the weight-bearing function, preserving the cartilage matrix of GAG and collagen type II, as well as decreasing matrix degradative enzymes (ADAMT5 for aggrecan and MMP13 for collagen type II) and the inflammatory mediator IL1β. The weight-bearing function recovered from ACLT surgery was slightly faster in the hypoxia-ADSC-exosome group than in the ADSC group (
Figure 6B). The appearance of the cartilage surface was smoother in the hypoxia-ADSC-exosome group (
Figure 6C). In cartilage, histological sections showed more superficial area lost lacunae and cells in the ADSC group (
Figure 6E–H). The findings from the OA animal study indicated that the efficacy of hypoxia-ADSC exosomes in improving OA symptoms may be similar to that of ADSC treatment, but the mechanism may not be the same. It is possible that the hypoxia-ADSC-exosomes carry more effective factors to preserve cartilage chondrocytes and matrix by suppressing SASPs.
Some limitations remained in the in vitro and in vivo OA models in this study. In vitro cell biological OA models only mimic chondrocytes responding to IL-1β; however, during OA progression, chondrocytes undergo terminal differentiation, receiving multiple signal changes from growth factors and inflammatory cytokines. Nevertheless, the IL-1β induction model was able to express SASPs and was further suppressed by hypoxia-ADSC-Exos. It is suggested to be used to test the effect of hypoxia-ADSC-Exos on OA-like HACs in vitro prior to subsequent in vivo study. For the ACLT-OA animal model, post-traumatic osteoarthritis (PT-OA) cannot represent spontaneous aging caused by OA. However, PT-OA is also very significant because it more frequently occurs in young people to accelerate cartilage degeneration. In this study, we demonstrated that the OA change in PT-OA cartilage is alleviated by hypoxia-ADSC-Exo treatment. The efficacy of the other causes of OA also needs to be further tested before clinical study. Additionally, the ACLT-OA rat experiment was stopped at 9 weeks after ACLT surgery, and the cartilage damage as well as synovium inflammation were still mild as in early-stage OA. More effects of hypoxia-ADSC-Exo treatment on cartilage and synovium in moderate or severe OA need to be examined in future animal studies.
Exosomal miRNAs have been indicated to be very important for transporting intercellular communication signals [
27,
28]. MSC-exosomes have been reported to improve cartilage regeneration in OA animals [
29,
30,
44]. Indeed, several specific miRNAs were found to be differentially expressed in normal and OA cartilage; however, whether they contribute to OA progression has not been investigated [
45]. A study indicated that hADSC-Exos are rich in several miRNAs (i.e., miR-199a, miR125b, miR-221, and miR92a) that may be related to inflammation in OA [
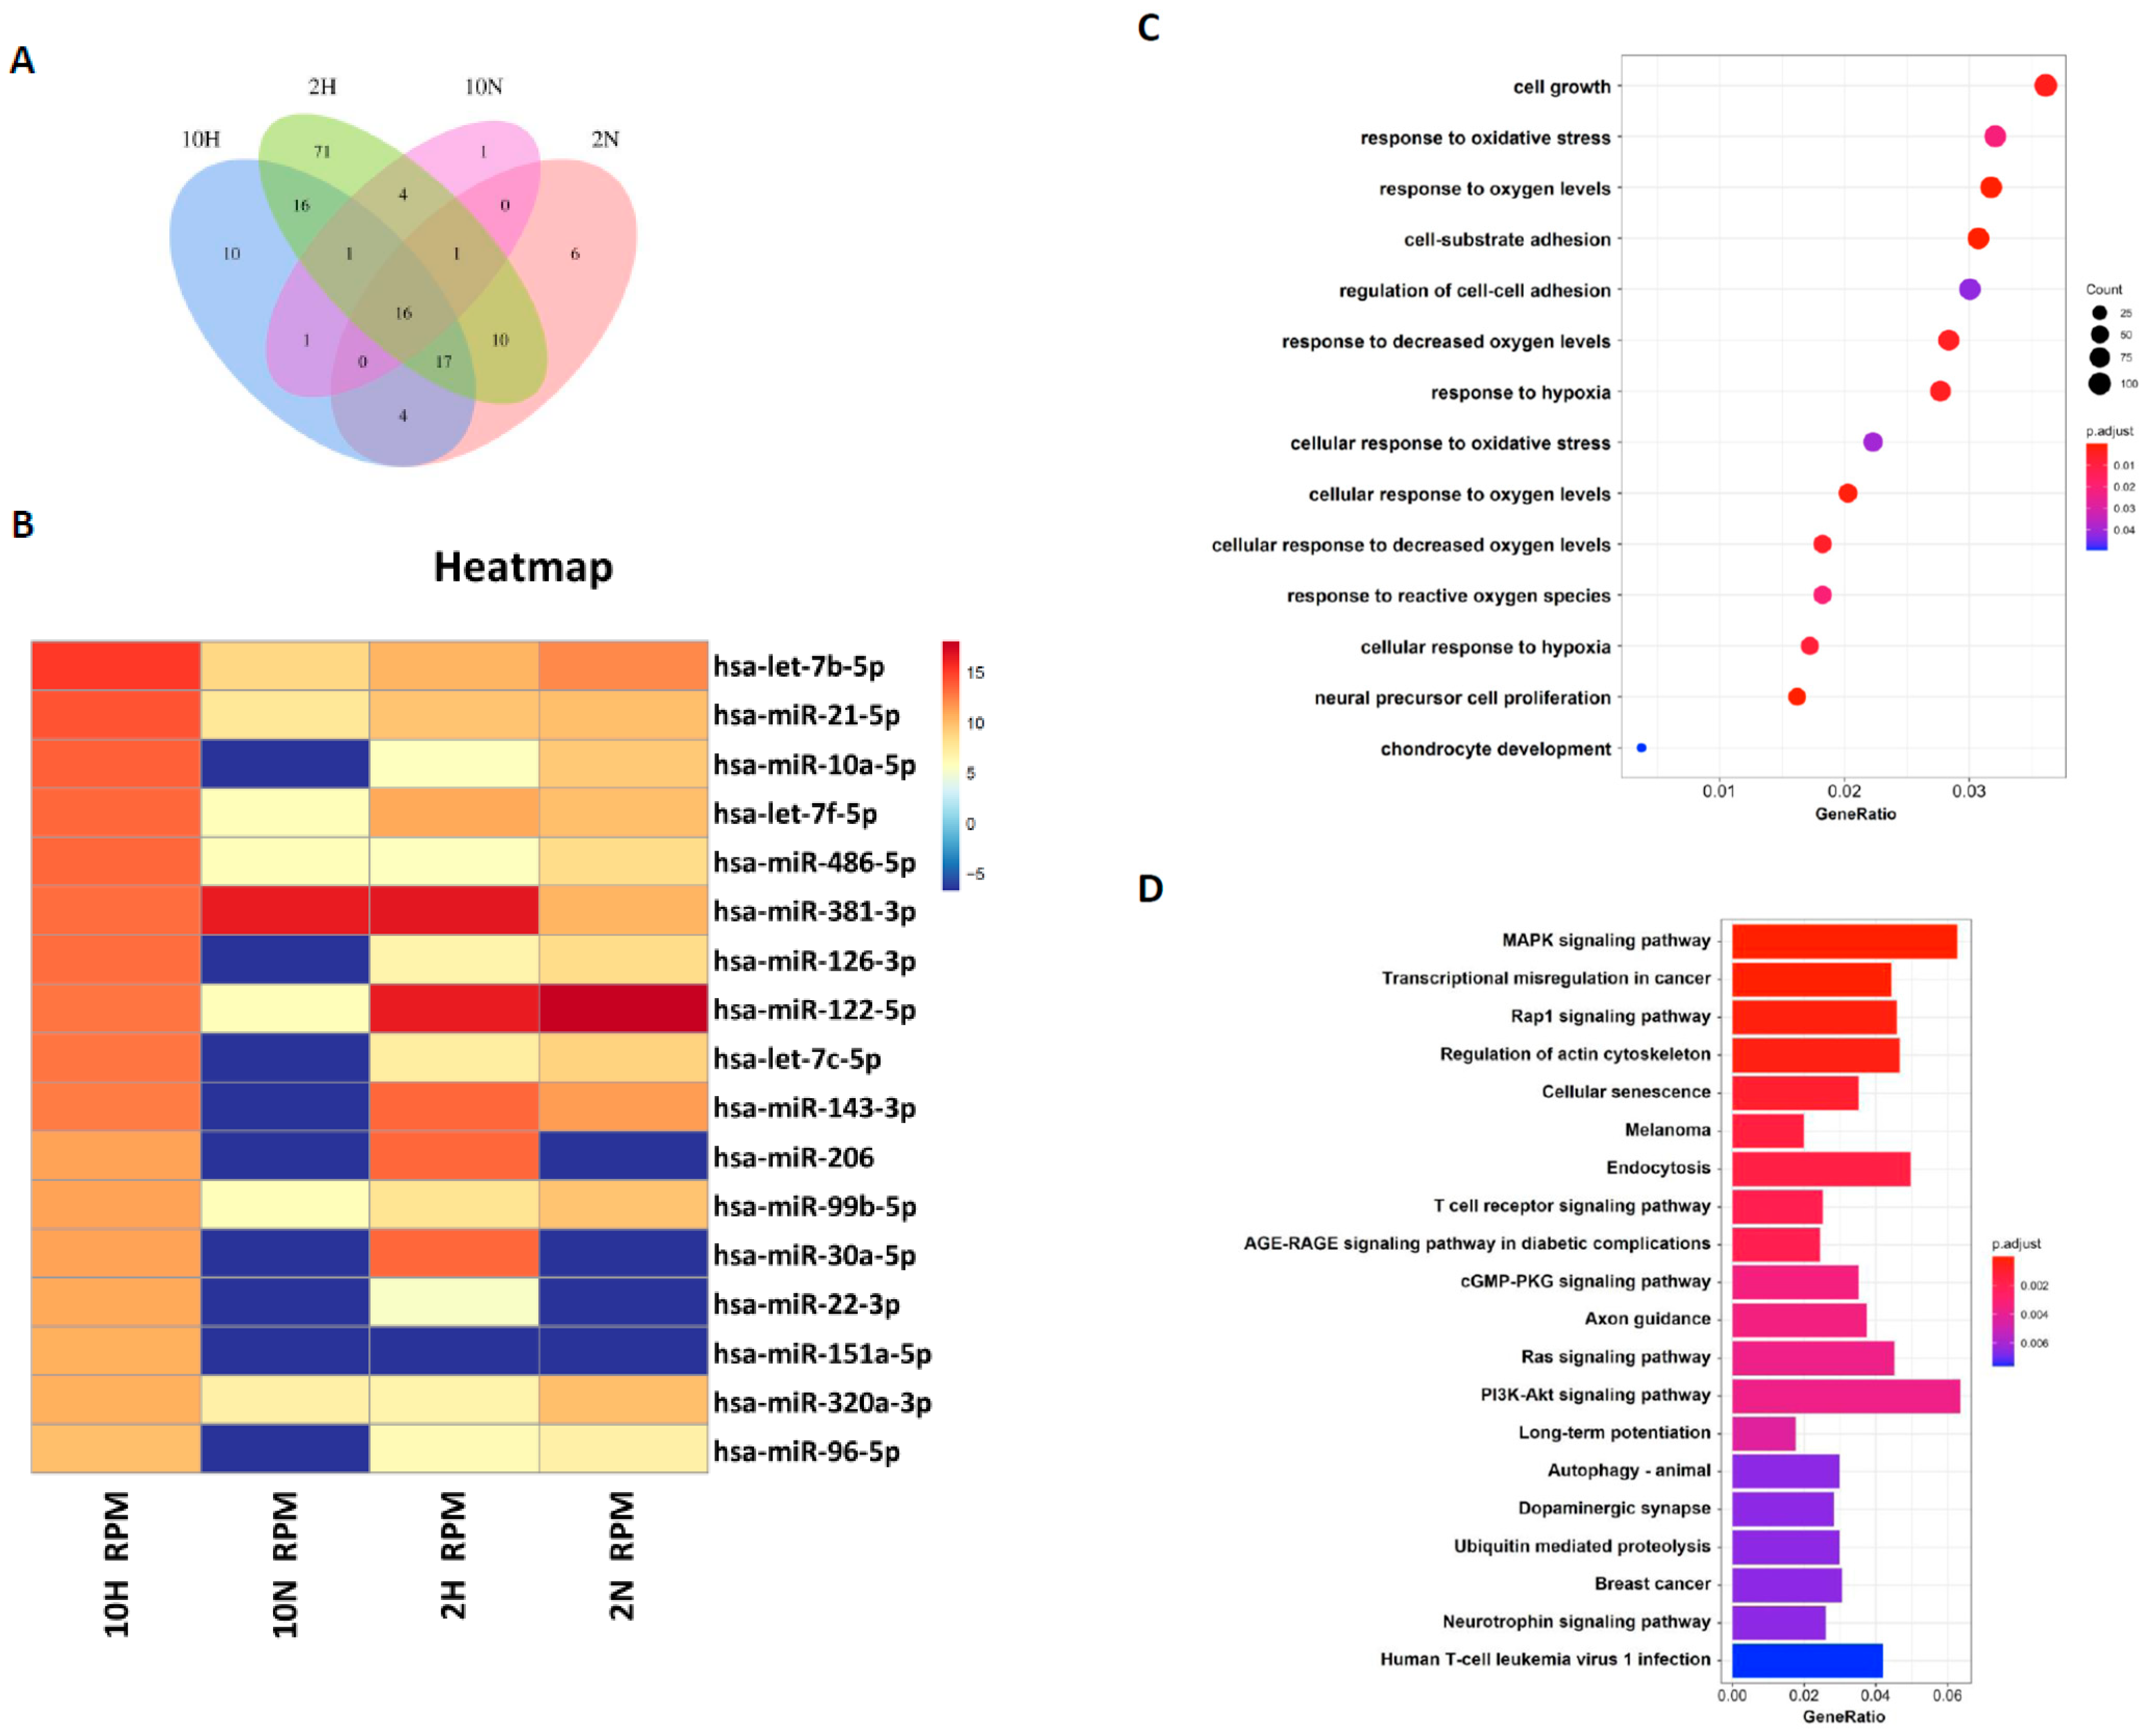
30]. How those exosomal miRNAs contribute to regenerating articular chondrocytes remains unclear. In this study, we compared the exosomal miRNA profiles of ADSC-Exos between normoxia and hypoxia and found that seven miRNAs, miR-381-3p, miR-122-5p, miR-143-3p, miR-206, miR-30a-5p, miR-22-3p, and miR-151a-5p, were more abundant in hypoxia-ADSC-Exos than in normoxia-ADSC-Exos. Further, GO and KEGG analysis showed that these target genes may be involved in cell growth, response to oxidative stress, cell-substrate adhesion, chondrocyte development, cellular senescence and immune signaling pathways.
Among these seven hypoxia-related miRNAs, a previous study has demonstrated that miR-30a protects aged cardiomyocytes from injury [
46]. The miR-206 was indicated to regulate several significant biological functions and play a key modulator role in skeletal muscle development and disease, such as promoting extracellular matrix accumulation by targeting DNMT3A [
47]. In addition, miR-22-3p was reported to target oxidative stress and mitochondrial dysfunction pathways to induce a protective role in acute kidney injury [
48]. The miRNA profiles in ADSC-exosomes and the difference between hypoxia-ADSC-Exos and normoxia-ADSC-Exos in this study, as well as those from previous studies, support very important information for further investigation of the molecular mechanism to clarify how hypoxia-ADSC-Exos alleviate the inflammaging of HACs and OA progression.
Looking back, traditional treatments for OA include the management of pain and inflammation by anti-inflammatory drugs or, in several cases, even corticosteroid injections. At the end-stage of OA, joints need replacing. In current OA treatments, despite the administration of NSAIDs, viscosupplementation, a treatment involving hyaluronan intra-articular injections, has also been used, but it is not effective for those with damaged articular cartilage [
49]. For mild to moderate OA, several treatment strategies of regenerative medicine are explored, such as using platelet-enriched plasma (PRP), cell-based therapy or acellular MSC exosomes. In the present study, we demonstrated that using hypoxia-ADSC-Exos can alleviate the degeneration of articular chondrocytes and eventually OA progression, which may be potentially a future treatment method for OA.
In summary, we demonstrated that hypoxia-ADSC-Exos not only improve normal HAC function but also alleviate HAC inflammaging and OA progression. The seven potential miRNAs carried by hypoxia-ADSC-Exos may contribute to executing the function. Hypoxia-ADSC-Exo treatment may offer another strategy for future OA therapy.
4. Materials and Methods
4.1. Isolation and Culture of Human Adipose-Derived Stem Cells (hADSCs)
For the isolation of ADSCs from humans, hADSCs were isolated from subcutaneous adipose tissue as previously described [
50]. Human adipose tissue was obtained from patients with approval from the ethical committee at the Kaohsiung Medical University Hospital (IRB number: KMUH-IRB-E(II)-20150193). After obtaining informed consent, subcutaneous adipose tissue from the gluteal area was taken from patients during plastic surgery. After 3 g of subcutaneous adipose tissue was isolated from humans, it was minced with scissors. The minced adipose tissues were digested with 1 mg/mL of type IA collagenase (125 units/mg) at 37 °C under 5% CO
2 for 24 h. The digested tissue was centrifuged at 1000 rpm for 5 min, and the pellet was washed twice with PBS. The K-NAC medium is composed of Keratinocyte-SFM Basal Medium (Gibco-BRL, Rockville, MD, USA) supplemented with 25 mg bovine pituitary extract (BPE) (Gibco-BRL, Rockville, MD, USA), 2.5 µg human recombinant epidermal growth factor (rEGF) (Gibco-BRL, Rockville, MD, USA), 2 mM N-acetyl-L-cysteine, 0.2 mM L-ascorbic acid 2-phosphate sesquimagnesium salt, and 5% fetal bovine serum (FBS) [
51]. The pellet was then resuspended in K-NAC medium and plated in a 100 mm culture dish. The K-NAC medium used in this study helped isolate and expand hADSCs, according to previous reports. In this study, we used hADSCs at passages 6–8 (P6–P8).
4.2. Induction and Isolation of hADSC-Derived Exosomes (ADSC-Exos)
To investigate the oxygen and serum concentration effects on the components and biological functions of ADSCs-Exo, four culture conditions were used to induce ADSCs-Exo, namely: (1) 10H: ADSC-Exos were induced under 20% O
2 (normoxia) + 10% de-Exo-FBS (Thermo Fisher Gibco™, Waltham, MA, USA); (2) 10N: ADSC-Exos were induced under 1% O
2 (hypoxia) + 10% de-Exo-FBS; (3) 2N: ADSC-Exos were induced under 20% O
2 (normoxia) + 2% de-Exo-FBS; and (4) 2H: ADSC-Exos were induced under 1% O
2 (hypoxia) + 2% de-Exo-FBS. For induction of ADSC-Exos, hADSCs were suspended in DMEM containing 1% penicillin/streptomycin and de-Exo-FBS (2% or 10%) and then plated in 100 mm culture dishes at a cell density of 1.415 × 10
4/cm
2 for 48 h. For hypoxic cell culture, ADSC-Exo was induced by placing hADSCs into a hypoxia incubator chamber (Catalog #27310, STEMCELL Technologies, Inc., Cambridge, UK) that was filled with a mixed gas composed of 1% O
2, 5% CO
2, and 94% N
2 and then transferred into a CO
2 incubator at 37 °C for 48 h. After 48 h, the conditioned medium (CM) in which the ADSC-Exos had been secreted was collected. ADSC-Exos were isolated from the CM by ultracentrifugation according to the protocol previously described [
52]. Briefly, the CM was centrifuged at 20,000×
g for 10 min at 4 °C to remove large cell fragments. The supernatant was then centrifuged at 50,000×
g for 1 h to remove residual organelles and nuclei. Subsequently, it was centrifuged at 180,000×
g for 1.5 h at 4 °C to pellet the ADSC-Exos. Thereafter, the supernatant was discarded, and the ADSC-Exos at the bottom of the centrifuge tube were resuspended in phosphate-buffered saline (PBS) to eliminate the contaminating proteins on the ADSC-Exos pellets and centrifuged at 180,000×
g for 1.5 h at 4 °C to acquire ADSC-Exos pellets [
38]. The ADSC-Exos were resuspended in 1 mL of sterilized PBS and stored at 4 °C until characterization or treatment [
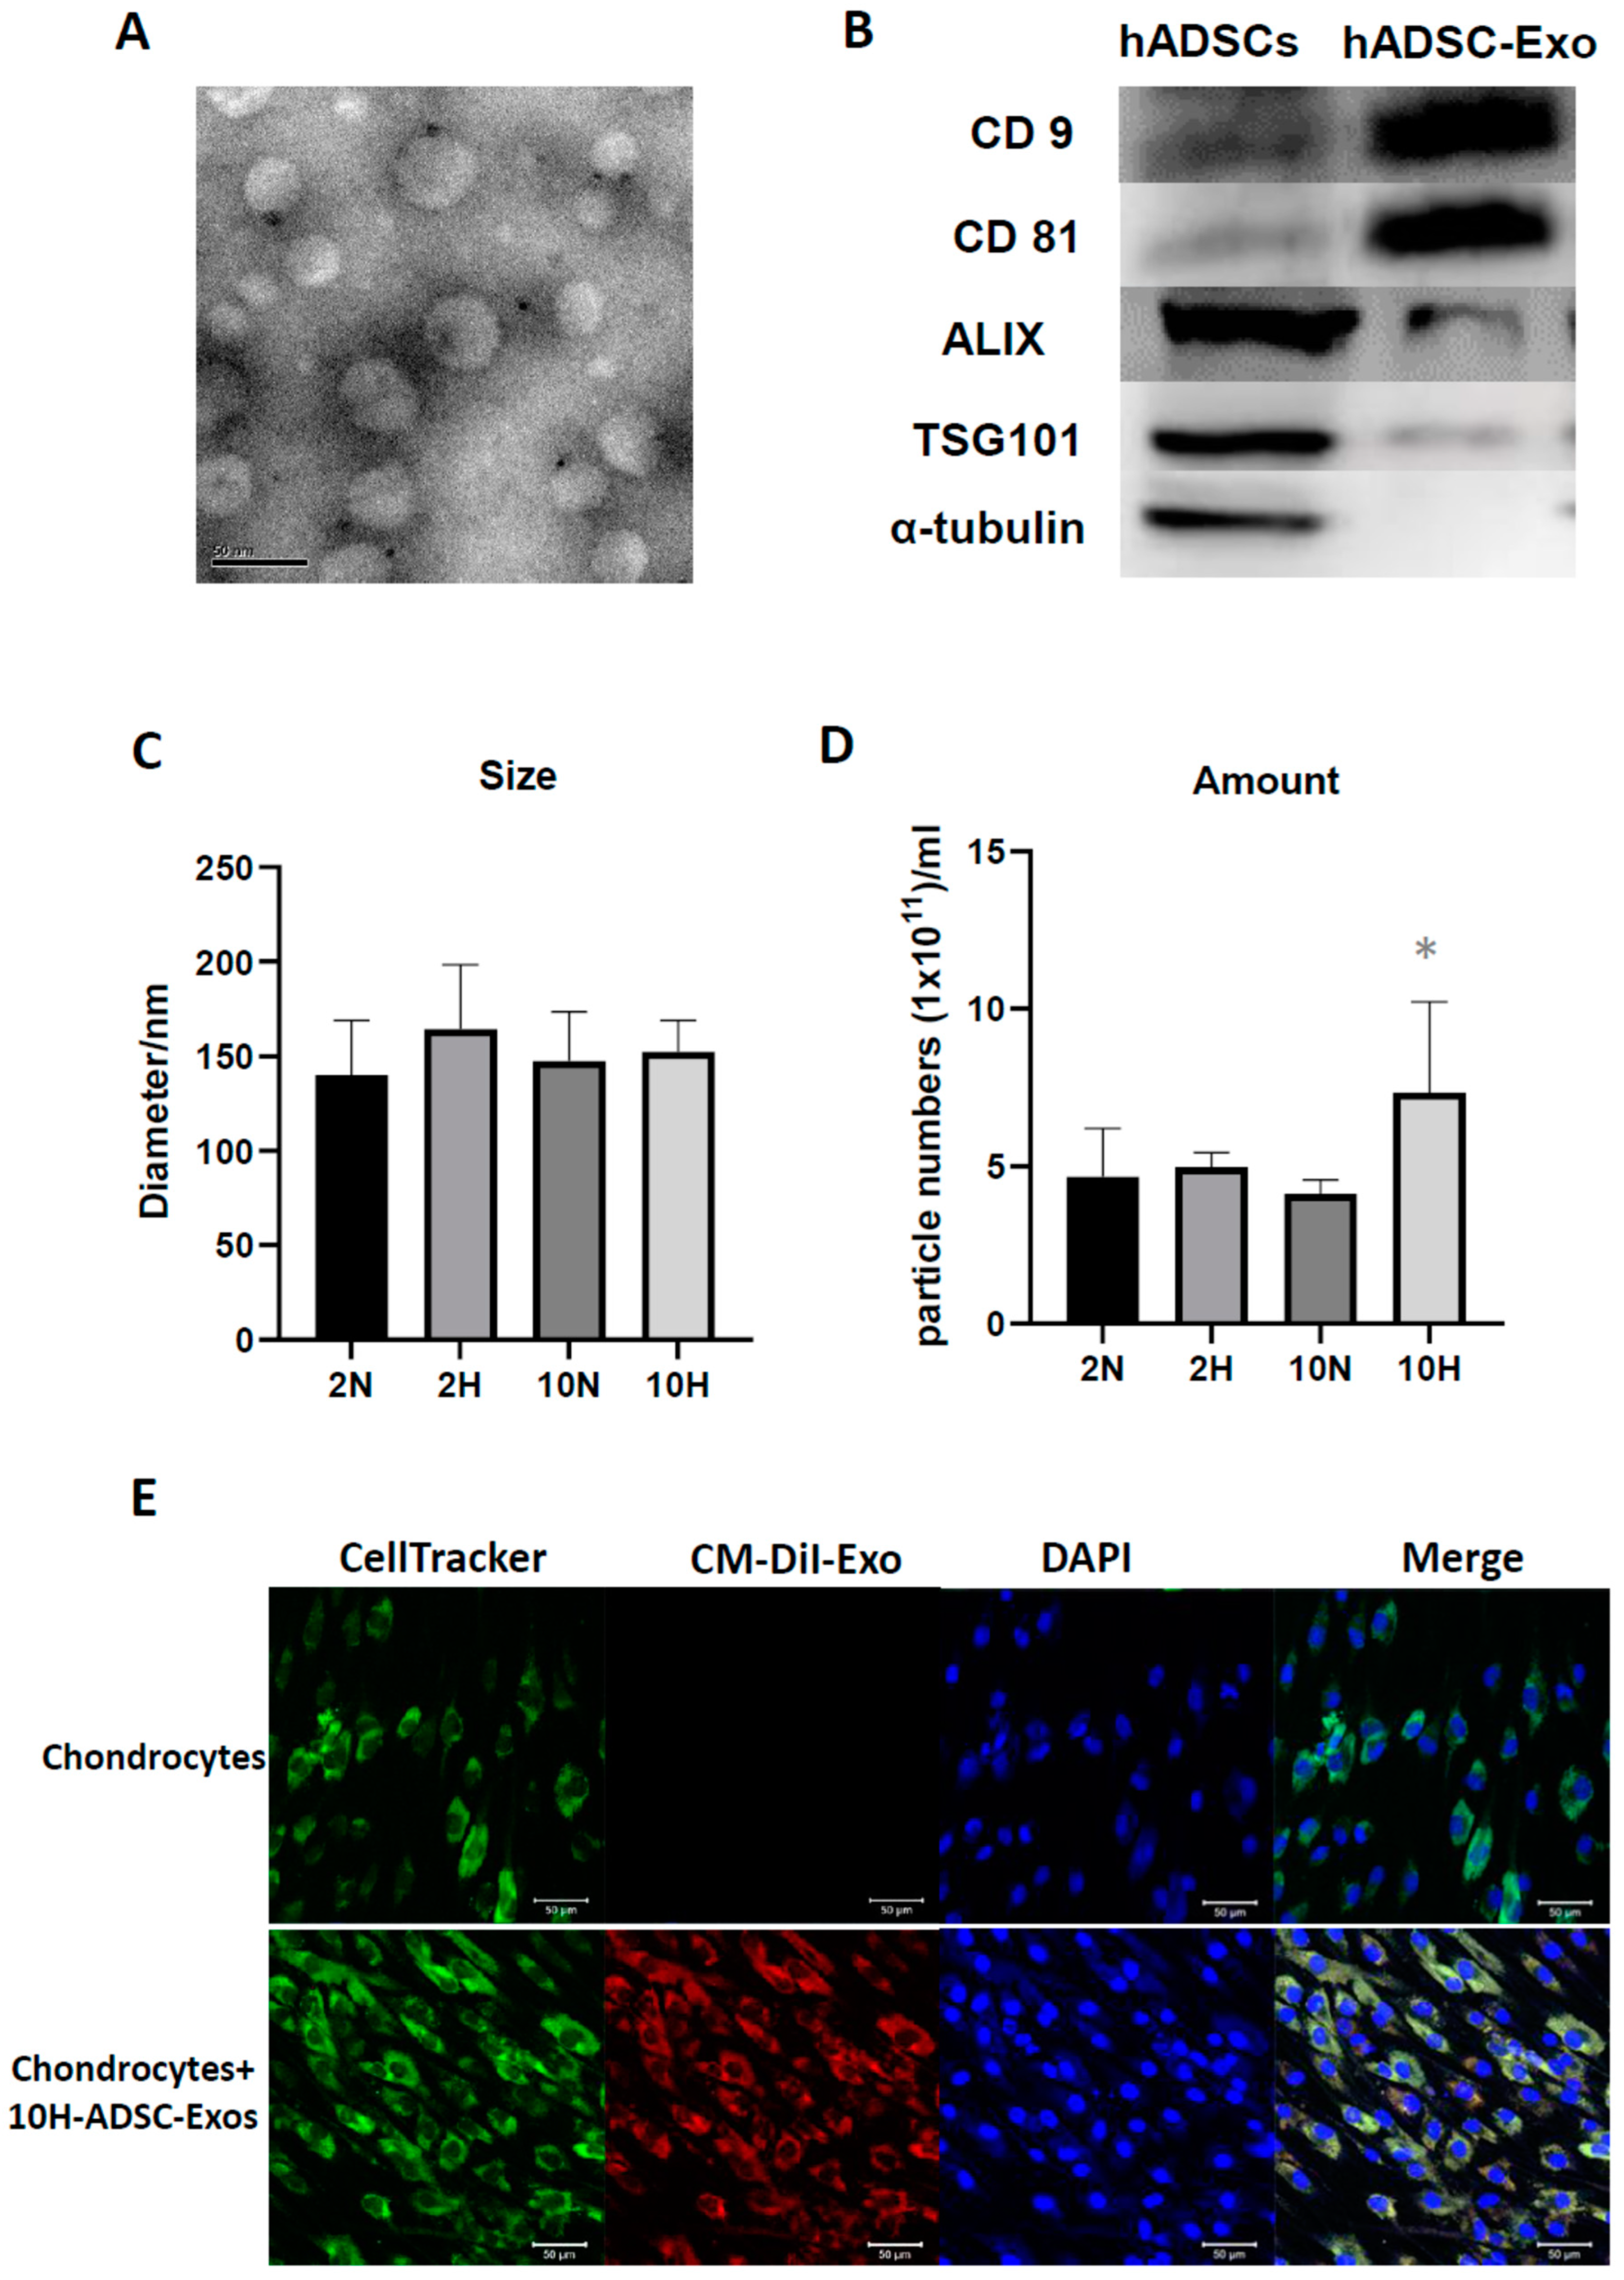
36]. The characterization of the ADSC-Exos involved analyses of their size, number, morphology, and protein composition [
52]. The isolated ADSC-Exos stored at 4 °C were used within 2 weeks.
4.3. Osteoarthritis (OA)-like Chondrocyte Model and ADSC-Exos Treatment
The HACs were purchased from CloneticsTM normal human chondrocytes-Knee (NHAC-kn) (Lonza, Walkersville, MD, USA). The HACs were cultured and expanded in Dulbecco’s modified Eagle’s medium (DMEM) containing 100 mg/mL ascorbic acid, 1% nonessential amino acids, 1% penicillin/streptomycin, 0.1% insulin, transferrin, and selenium (ITS) (Corning® MA, New York, MA, USA), and 10% fetal bovine serum. The chondrocytes used for the OA-like cell model were in passages 7–9 (P7–P9). For induction of the OA-like cell model, chondrocytes were treated with recombinant human interleukin-1 beta (IL-1β) (Cat. no.: Z02922-10, GenScript, Piscataway, NJ, USA) at concentrations of 1 to 10 ng/mL in the culture medium.
For ADSC-Exo treatment, the ADSC-Exo solution was diluted with basal medium containing DMEM with 1% penicillin/streptomycin immediately before the start of treatment. The ADSC-Exos concentrations used in the experiments were between 107 and 109 particles/mL. The HACs were treated with ADSC-Exos (107 to 109 particles/mL) for 12 days. Three groups were examined in the present study, namely, the Ctrl group, in which the HACs were cultured in the basal medium without ADSC-Exos treatment; the IL-1β group, in which the HACs were cultured in the basal medium and treated with IL-1β at concentrations of 10 ng/mL; and the IL-1β+Exo group in which the HACs were cultured in the basal medium and treated with IL-1β and ADSC-Exos at concentrations of 107 to 109 particles/mL. The medium was changed every 2 days. At specific time points, the HACs were collected for further experimental analysis.
4.4. Nanoparticle Tracking Analysis of ADSC-Exo Size and Number
Nanoparticle tracking analysis (NTA) was performed on a ZetaView ® BASIC NTA—Nanoparticle Tracking Video Microscope PMX120 (Particle Metrix GmbH, GER) equipped with a 532 nm green laser for determining the ADSC-Exos size and number. One microliter of isolated ADSC-Exos samples was diluted to 1000 µL with freshly filtered PBS (0.22 µm filter) and loaded into the detection chamber by syringe. The camera was manually set and kept the same for all samples with a slider shutter of 650 and slider gain of 50; 30 s videos were recorded, and the number of captures was 5. The detection threshold was set to 6, and blur and max jump distance were automatically set. The temperature was maintained at 25 °C. The data were processed by ZetaView software (version 8.05.14 SP7; Particle Metrix GmbH, GER).
4.5. Transmission Electron Microscopy (TEM)
To investigate the morphology of ADSC-Exos, transmission electron microscopy (TEM) was used. Briefly, the ADSC-Exos were dropped on a copper grid and dried in air. Then, the sample was fixed with 3% glutaraldehyde for 2 h and washed with PBS, followed by negative staining with 2% uranyl acetate for 30 s. The ADSC-Exos sample was observed using TEM (Hitachi®, Tokyo, Japan), and the images were captured using a digital camera (Olympus®, Tokyo, Japan).
4.6. Labeling of ADSC-Exos and Uptake by Chondrocytes
For labeling of ADSC-Exos, ADSCs were labeled with CM-DiI (V22888, Invitrogen, Carlsbad, CA, USA), and then ADSC-Exo release was induced. After 48 h of induction, the conditioned medium derived from ADSCs was collected, and CM-Dil-labeled ADSC-Exos were isolated using the protocol described in an earlier subsection through ultracentrifugation. For the uptake of ADSC-Exos by chondrocytes, the chondrocytes were seeded onto six-well plates. After 24 h, the chondrocytes were cultured for 5 days with a culture medium containing 109 particles/mL CM-DiI-labeled ADSC-Exos. The medium was changed every 2 days. At specific time points, the cells were fixed with 4% paraformaldehyde in PBS for 15 min. The chondrocytes were stained with CellTracker™ Green CMFDA Dye (5-chloromethylfluorescein diacetate) (C7025, Invitrogen) for cell tracing, and their cell nuclei were stained with 4′,6-diamidino-2-phenylindole (DAPI). The uptake of the CM-DiI-labeled ADSC-Exos by the chondrocytes was visualized through confocal laser scanning microscopy (Zeiss, Weimar, GER). Images were captured using a camera.
4.7. Quantitative Real-Time Polymerase Chain Reaction (qRT-PCR)
Total RNA from chondrocytes was isolated using the TOOLSmart RNA Extractor (TOOLS, Taiwan). First-strand complementary DNA (cDNA) was converted from 1 µg of RNA using the TOOLS Easy Fast RT Kit (TOOLS, TW). Levels of messenger RNA (mRNA) for
Col1a1,
Col2a1,
Col10a1,
aggrecan,
MMP13,
ADAMT5,
PTHrP,
CEBPB,
PTGS2,
IL6, and
TNFa were measured by quantitative real-time PCR with the Bio-Rad iQ5 real-time PCR detection system (Bio-Rad, Hercules, CA, USA) using the TOOLS 2X SYBR qPCR Mix (TOOLS, Taiwan). Reactions took place in a 20 µL mixture containing cDNA, specific primers (
Supplementar. Table S1) for each gene, and the TOOLS 2X SYBR qPCR Mix. The specific PCR products were detected with the double-stranded DNA binding fluorescence dye SYBR Green [
53]. Relative mRNA levels were calculated from the threshold cycle (Ct) value of each PCR product and normalized to that of GAPDH using the comparative Ct method [
54]. The relative quantity of each gene’s expression in the control cells was set to 1, and all others were transformed to a ratio. A dissociation (melting) curve was generated after each PCR to check its specificity. All PCR amplifications were performed in triplicate, and the experiments were repeated at least 3 times.
4.8. Western Blot Analysis
HACs were lysed in radioimmunoprecipitation assay buffer (Invitrogen) supplemented with protease inhibitor cocktails (mixtures) (Sigma-Aldrich). Following lysis, proteins were separated by a NuPAGE Novex 4–12% Bis-Tris Gel (Invitrogen) and transferred to polyvinylidene difluoride nylon membranes (Sigma-Aldrich). The membranes were blocked with 5% nonfat dry milk in Tris-buffered saline and incubated overnight at 4 °C with primary antibodies against CD9 (cat. no. 602321lg, Proteintech Group, Inc., Rosemont, IL, USA; 1:1000), CD63 (256821-AP, Proteintech Group, Inc.; 1:1000), CD81 (66866-1lg, Proteintech), ALIX (cat. no. 12422-1-AP, Proteintech Group, Inc.; 1:1000), TSG101 (282831-AP, Proteintech Group, Inc.; 1:1000), and α-tubulin (cat. no. 66009-1-lg; Proteintech Group, Inc.; 1:1000). Specific bands were detected by a horseradish peroxidase–conjugated secondary antibody and were read by an enhanced chemiluminescence Western blot system from Pierce (Rockford, IL, USA).
4.9. ELISA
ADSC-Exos-treated HACs and the culture supernatant were collected to quantify the concentrations of extracellular matrix (type I, II, and X collagen) and SASP-related cytokines (IL6, TNFα, MMP13) by ELISA. For each assay, 100 μL of the supernatant was added to a well of the 96-well ELISA plate from the Human IL6, TNFα, MMP13, type I, II, and X collagen Express ELISA kit (cat. no. E-EL-H149, Elabscience, Inc., Houston, TX, USA; cat. no. RK00030, ABclonal, Inc. Woburn, MA, USA; cat. no. KE00078, Proteintech, Inc.; cat. no. RK01149; cat. no. RK01152, ABclonal, Inc.; cat. no. MBS722660, MyBioSource, Inc., San Diego, CA, USA) and sequentially treated with detection antibodies and chromogenic substrate according to the manufacturer’s instructions. The optical density was read at 420 nm. These protein concentrations were determined based on a standard curve that was produced using the serially diluted reference samples provided in the ELISA kit and presented as pg/mL.
4.10. MTS Assay after ADSC-Exos Treatment
To test the cell viability and proliferation ability after ADSC-Exos treatment, the MTS assay was used. The cells were seeded at a low cell density (1 × 10⁴/well) in a 6-well plate, treated with or without ADSC-Exos for 5 days, and the medium was changed once every two days. On the harvested day, the culture medium was removed, and 2 mL of medium containing 10 v/v% MTS reagent (CellTiter 96® AQueous One Solution Cell Proliferation Assay, Promega, WI, USA) was added and allowed to react for 3.5 h. Finally, the reacted supernatant medium was collected, and 200 µL was added to a 96-well plate to measure the OD450.
4.11. Alcian Blue Staining
Alcian blue staining was performed using a previously described method (Luna 1960). Briefly, 1 × 10⁵ cells were seeded in a 6-well plate and cultured for 12 days. At the endpoint of culture, cells were fixed in 10% formaldehyde solution for 10 min and then washed with PBS, and 3% acetic acid solution was added for 30 min. Subsequently, cells were incubated with Alcian blue solution (pH = 2.5) (Sigma-Aldrich, Darmstadt, Germany) at RT for 24 h, and photographs were taken using a compound microscope under 100× magnification.
4.12. DMMB Assay to Detect Sulfated Glycosaminoglycan (sGAG) Synthesis
At every indicated time interval, HACs were collected and digested for 18 h at 60 °C using 300 μg/mL papain solution. DNA content and sulfated glycosaminoglycan (sGAG) accumulation by cells were quantified spectrofluorometrically using Hoechst 33258 dye and the Sulfate Blyscan Glycosaminoglycan Assay (Biocolor, County Antrim, UK), respectively [
11,
12]. The standard curve for the DMMB assay was generated using aqueous chondroitin sulfate C (Sigma-Aldrich, St. Louis, MO, USA) solution, with concentrations ranging from 0 to 25 µg/µL.
4.13. SA-β-Gal Staining
Senescence-associated β-galactosidase (SA-β-gal) staining was used to verify IL-1β-induced OA-like articular chondrocyte senescence. Cells were grown in six-well plates, washed, fixed, and stained with the SA-β-gal cellular senescence assay kit (Cell Biolabs) according to the manufacturer’s protocol and as previously described [
55]. The sections were examined under a microscope.
4.14. microRNA Extraction and Library Construction for Next-Generation Sequencing
MicroRNA was extracted from EVs enriched in a culture medium using an EV-miR Extraction Kit (Topgen Biotech., Kaohsiung City, Taiwan) following the manufacturer’s procedure and finally eluted in 20 µL of low TE buffer in each sample. The microRNA concentration was quantified by a Qubit microRNA Assay Kit on a Qubit Fluorometer (Thermo Fisher, Waltham, MA, USA). For microRNA library construction, briefly, a total of 7 µL microRNA for each sample was used to construct a microRNA library with a VAHTS Small RNA Library Prep Kit for Illumina and a VAHTS Small RNA Index Primer Kit for Illumina (Vazyme Biotech, Nanjing Shi, China) following the manufacturer’s instructions. The correct barcoding adapter-ligated library amplicon length was approximately 142 bp, and amplicons in the target region were excised from a 4% agarose gel and purified using a FastPure Gel DNA Extraction Mini Kit (Vazyme Biotech, Nanjing, China). All steps were performed according to the manufacturer’s instructions. Microfluidic electrophoresis was used to quantify the concentration and check the length distribution of the eluted barcoding adapter-ligated library (142 bp) with a DNA-2500 Kit on MultiNA MCE-202 (Shimadzu, Japan). The qualified pooled library (4 nM) was sequenced on an Illumina NextSeq 500 (single-end, 75 sequencing cycles) (Illumina, Diego, CA, USA). All steps followed the manufacturer’s user manual.
4.15. Bioinformatic Analysis
First, adapter sequences were removed from total reads by Clip (v1.0.3). Then, the correct insert size of approximately 15–30 bp for mature microRNAs was retained by fastp (v0.20.1) [
56]. The trimmed reads were mapped with the database of human microRNA v22.1 (miRbase.org), and mapped reads of each sample were assembled and quantified using the Linux command. The target genes of highly expressed microRNAs were predicted from TargetScan v7.2 (targetscan.org), miRanda (10 March 2023,
www.microrna.org), and miRDB (10 March 2023,
www.mirdb.org), and the miRNA-target gene network was built by Cytoscape [
57]. Finally, the union of target genes was then conducted by Gene Ontology (GO) and Kyoto Encyclopedia of Genes and Genomes (KEGG) pathway enrichment analysis by ClusterProfiler (v 3.18.1) (
p value < 0.05, q value < 0.05) [
58], and ggplot2 (v 3.3.3) was used to visualize the enrichment plots.
4.16. ACLT-OA Induction and ADSC/ADSC-Exo Treatment
The animal experiments were approved by the Animal Care and Use Committee of Kaohsiung Medical University (IACUC number 109242). Thirty 8-week-old male Sprague-Dawley rats were purchased from BioLASCO Taiwan and housed under standard laboratory conditions (24 °C, 12 h light-dark cycle) with food and water ad libitum. An anterior cruciate ligament transection (ACLT) model was induced as previously described [
59]. Briefly, rats were randomly and evenly assigned into four groups by body weight. The experimental design has four groups, with 7–8 animals in each group: the sham operation as Sham control group (intra-articular (IA) injection PBS (40 µL) per week, n = 7), the OA+PBS group (IA injection PBS (40 µL) per week, n = 7), the OA+Exo (IA injection ADSC-Exo 7.5 × 10
9 particles/mL in PBS (40 µL) per week, n = 8), and the OA+ADSCs (IA injection 1 × 10
6 ADSCs in PBS (40 µL) only in the first week, n = 8 group). Each rat was anesthetized with zoletil:rompun = 4:1, and after being shaved, the right knee joint was exposed through a medial parapatellar approach, and the left knee was used as the contralateral control. The patella was dislocated laterally, and the knee was placed in full flexion, followed by ACL transection with microscissors. After surgery, the joint capsule and skin were sutured using Vicryl 4-0 (UNIK, New Taipei City, Taiwan) nonabsorbable sutures. In sham-operated animals, wounds were closed after subluxation of the patella. All groups could move freely in plastic cages until they were euthanized by CO
2 gas overdose inhalation at 7 weeks post-surgery.
4.17. Weight-Bearing Distribution Test
The effect of joint damage on weight distribution through the rats’ knees was measured using a dual-channel weight average (Singa Technology, Taipei, Taiwan), which independently measured the weight-bearing ability of each hind paw. Changes in hind paw weight distribution between the right (OA) and left (contralateral control) limbs were utilized as an index of joint discomfort in the OA knee. Briefly, the weight-bearing tests were first performed before ACLT surgery and each week thereafter until the rat was euthanized. Rats were placed in an angled Plexiglas chamber positioned so that each hind paw rested on a separate force plate. The force exerted by each hind limb was averaged over a 5 s period, and each data point was the mean of three 5 s readings. The change in hind paw weight distribution was calculated by determining the percent difference in the amount of weight between the left and right limbs [
59].
4.18. Histology and Safranin O–Fast Green Staining
Rat tibial plateaus with articular cartilage were collected and fixed with 10% neutral buffered formalin prior to histologic preparation. The decalcified samples were paraffin embedded, and 5 µm microsections of the coronary plane were prepared. GAG was stained with Safranin O–fast green (1% Safranin O counterstained with 0.75% hematoxylin and then 1% fast green; Sigma-Aldrich), and the total and red-stained areas in the articular cartilage of each proximal tibia were measured using the Image-Pro Plus software, version 5.0. The ratio of the red-stained area to the total area (red:total) in each group was calculated.
4.19. Immunohistochemistry
For immunohistochemistry staining, the tibial articular sections were rehydrated, and endogenous peroxidase in the tissue was blocked with 3% hydrogen peroxide. Sections were then blocked with 10% FBS for 1 h and incubated with primary antibodies against type II collagen (1:2000; mouse monoclonal antibody; Chemi-Con, Temecula, CA, USA), IL1-β (1:500; rabbit polyclonal antibody; Merck, KGaA, Darmstadt, Germany), ADAMTS5 (1:1000; rabbit polyclonal antibody; Novus Biologicals, LLC, Centennial, CO, USA), and MMP13 (1:200; rabbit polyclonal antibody; Bioss, MA, USA) at 4 °C overnight. Then, the samples were incubated for 30 min with biotin-labeled goat anti-mouse/rabbit immunoglobulin and horseradish peroxidase-conjugated streptavidin (BioCare Medical, Pacheco, CA, USA) secondary antibodies. Staining with a 3,3′-diaminobenzidine solution (Dako) containing 0.01% hydrogen peroxide resulted in a brown color. Finally, sections were counterstained with hematoxylin and observed under a microscope. The relative density of immunostaining (density/area; mean ± SEM area 25.44 ± 2.77 mm2) was measured using the Image-Pro Plus software, version 5.0.
4.20. Statistical Analysis
Data are presented as the mean and SEM of results from the in vitro study and the in vivo study. All experiments were repeated at least 3 times. Statistical significance was evaluated by a one-way analysis of variance, and multiple comparisons were performed using Scheffe’s test. p values less than 0.05 were considered significant.


 ,
, 


