
Anti-Inflammatory Activities of 8-Benzylaminoxanthines Showing High Adenosine A2A and Dual A1/A2A Receptor Affinity

 , , , , , , , and
Abstract
:1. Introduction
2. Results and Discussion
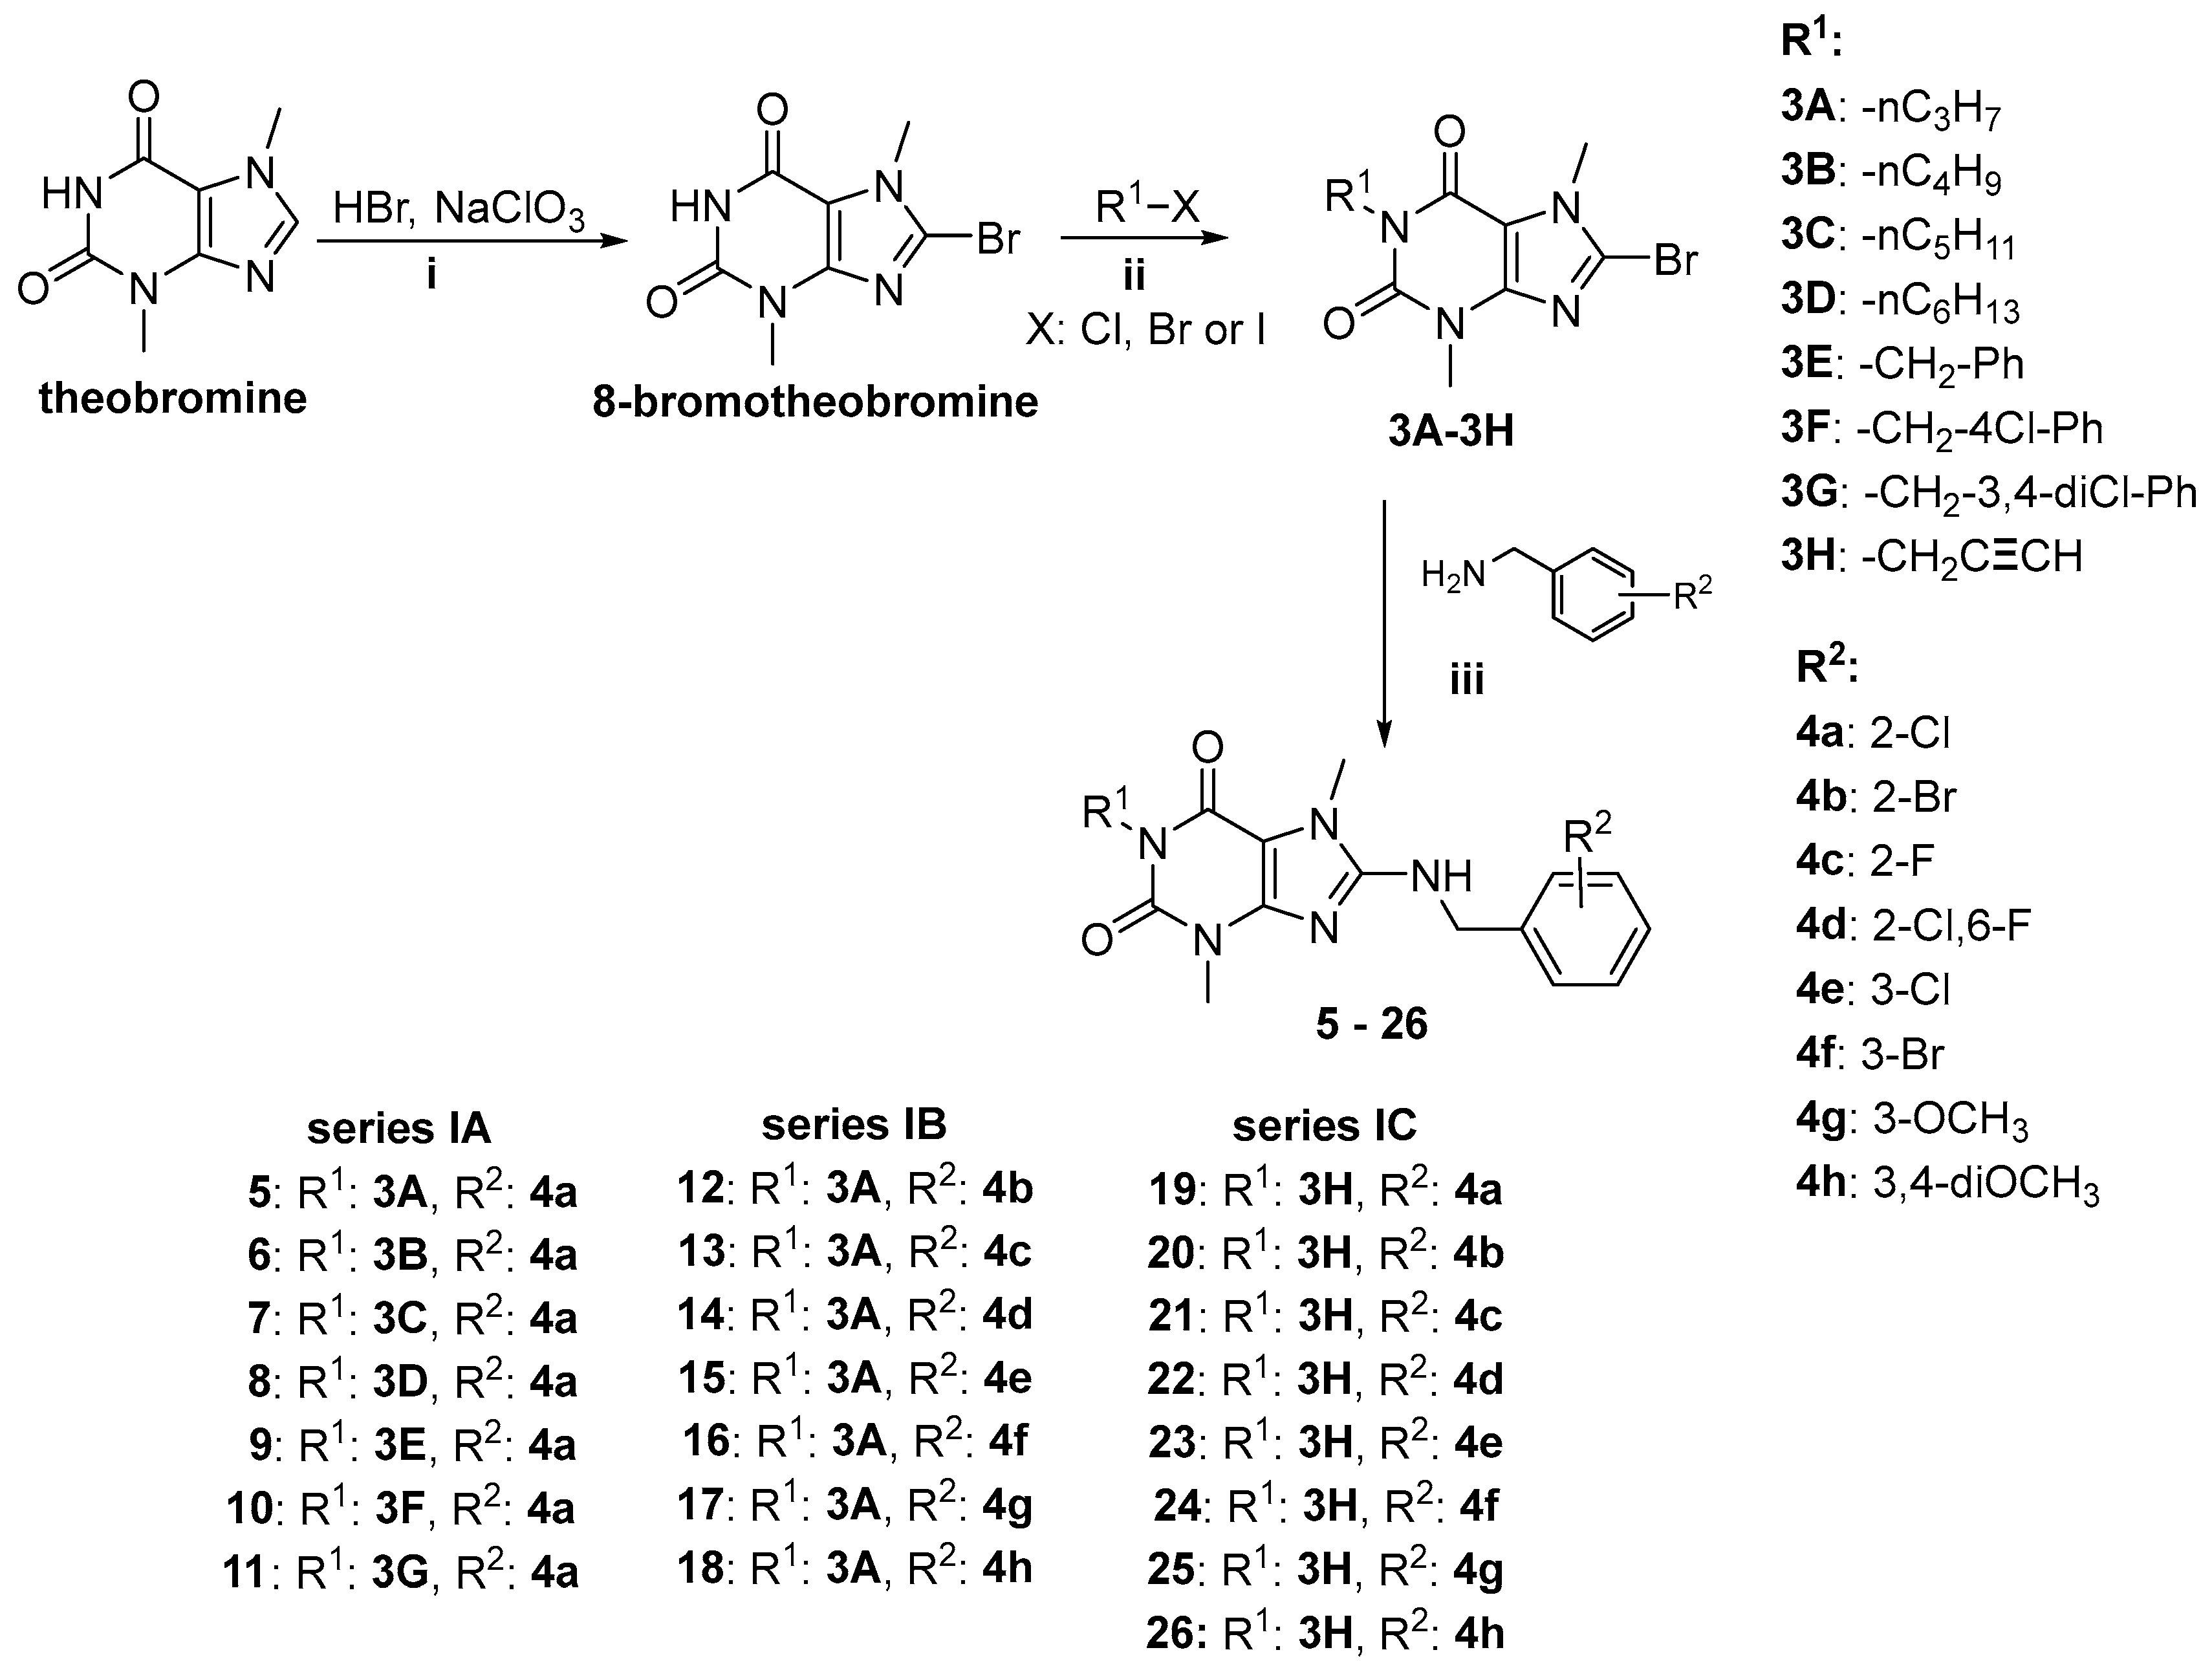
2.1. Synthesis of Target Compounds
2.2. Pharmacological Activity In Vitro
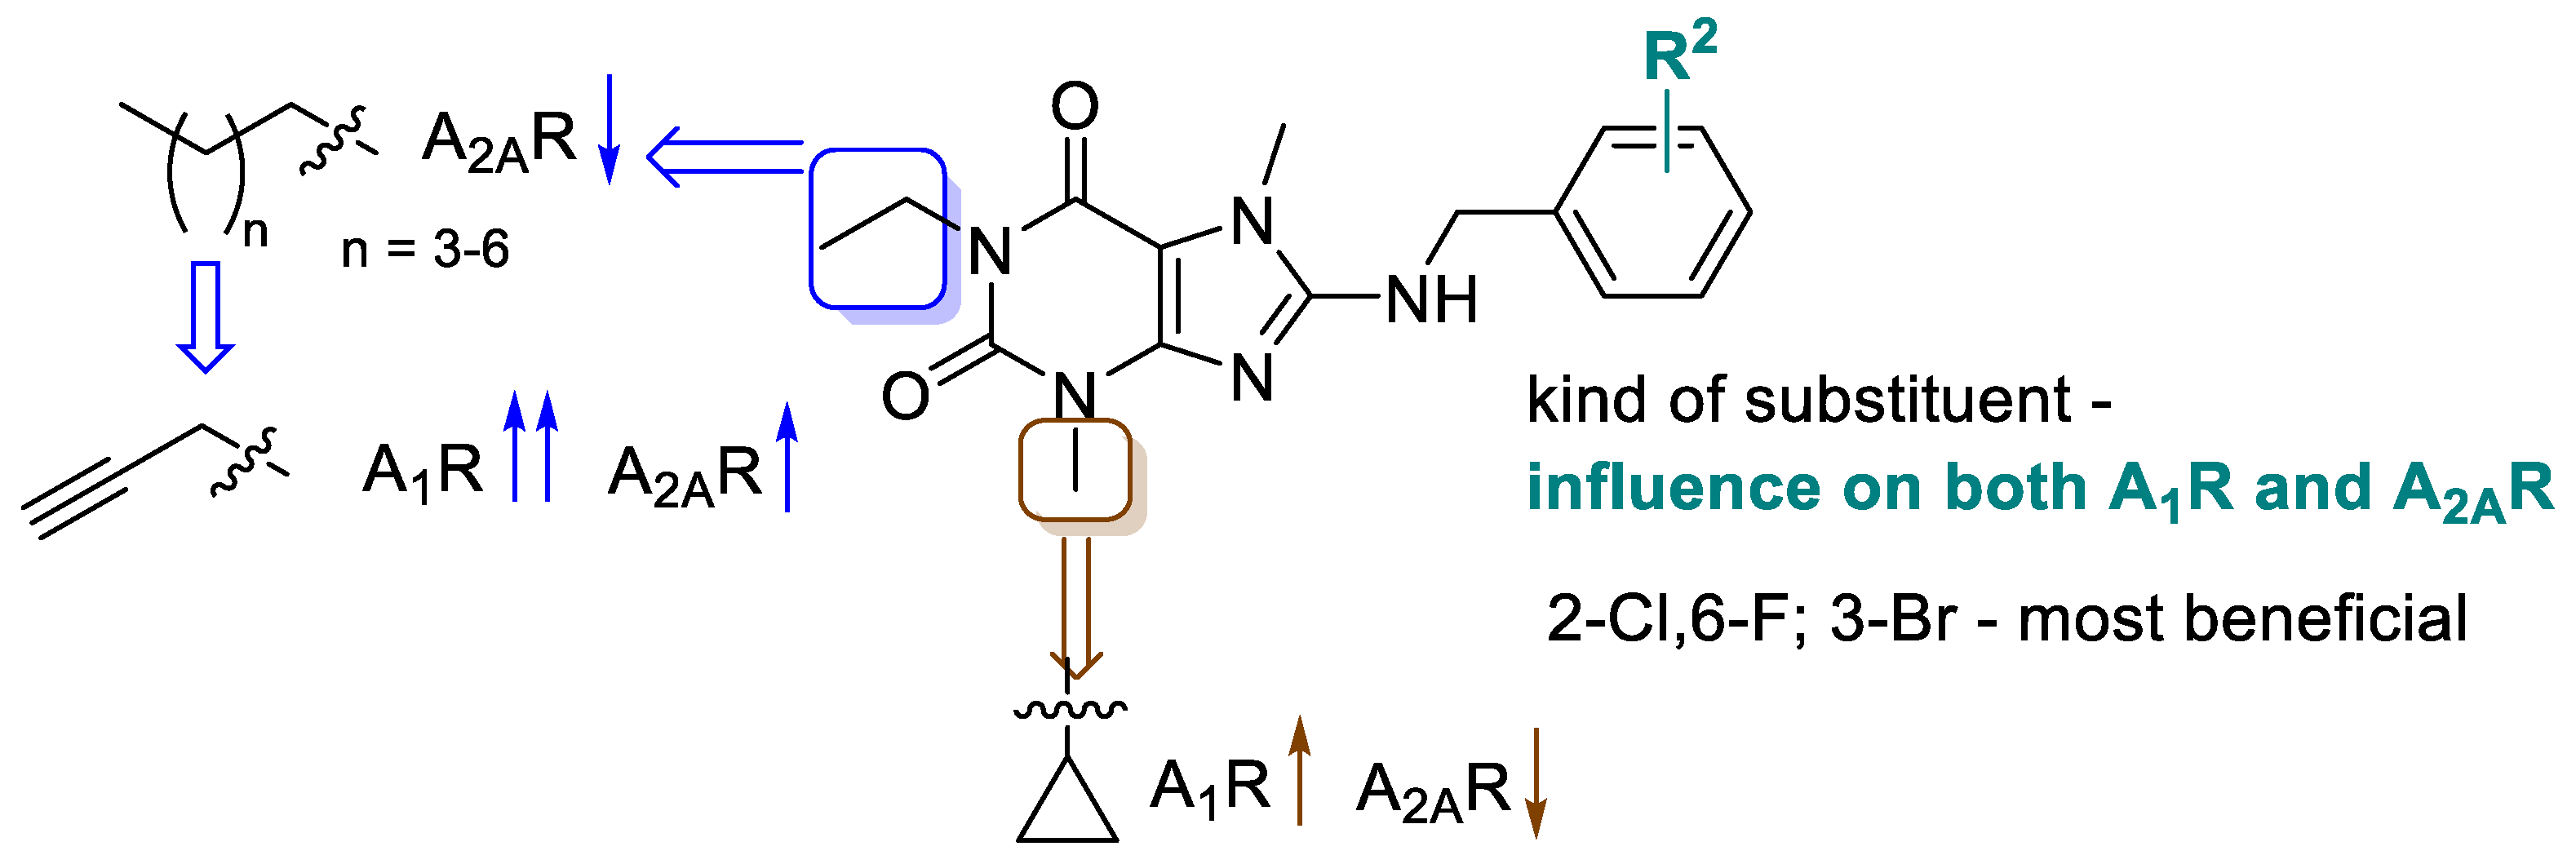
2.2.1. Structure-Activity Relationships at Adenosine Receptors
2.2.2. Human Monoamine Oxidase B (MAO B) Inhibition
2.3. Molecular Docking to Adenosine A1 and A2A Receptors and Molecular Dynamics (MD) Simulations
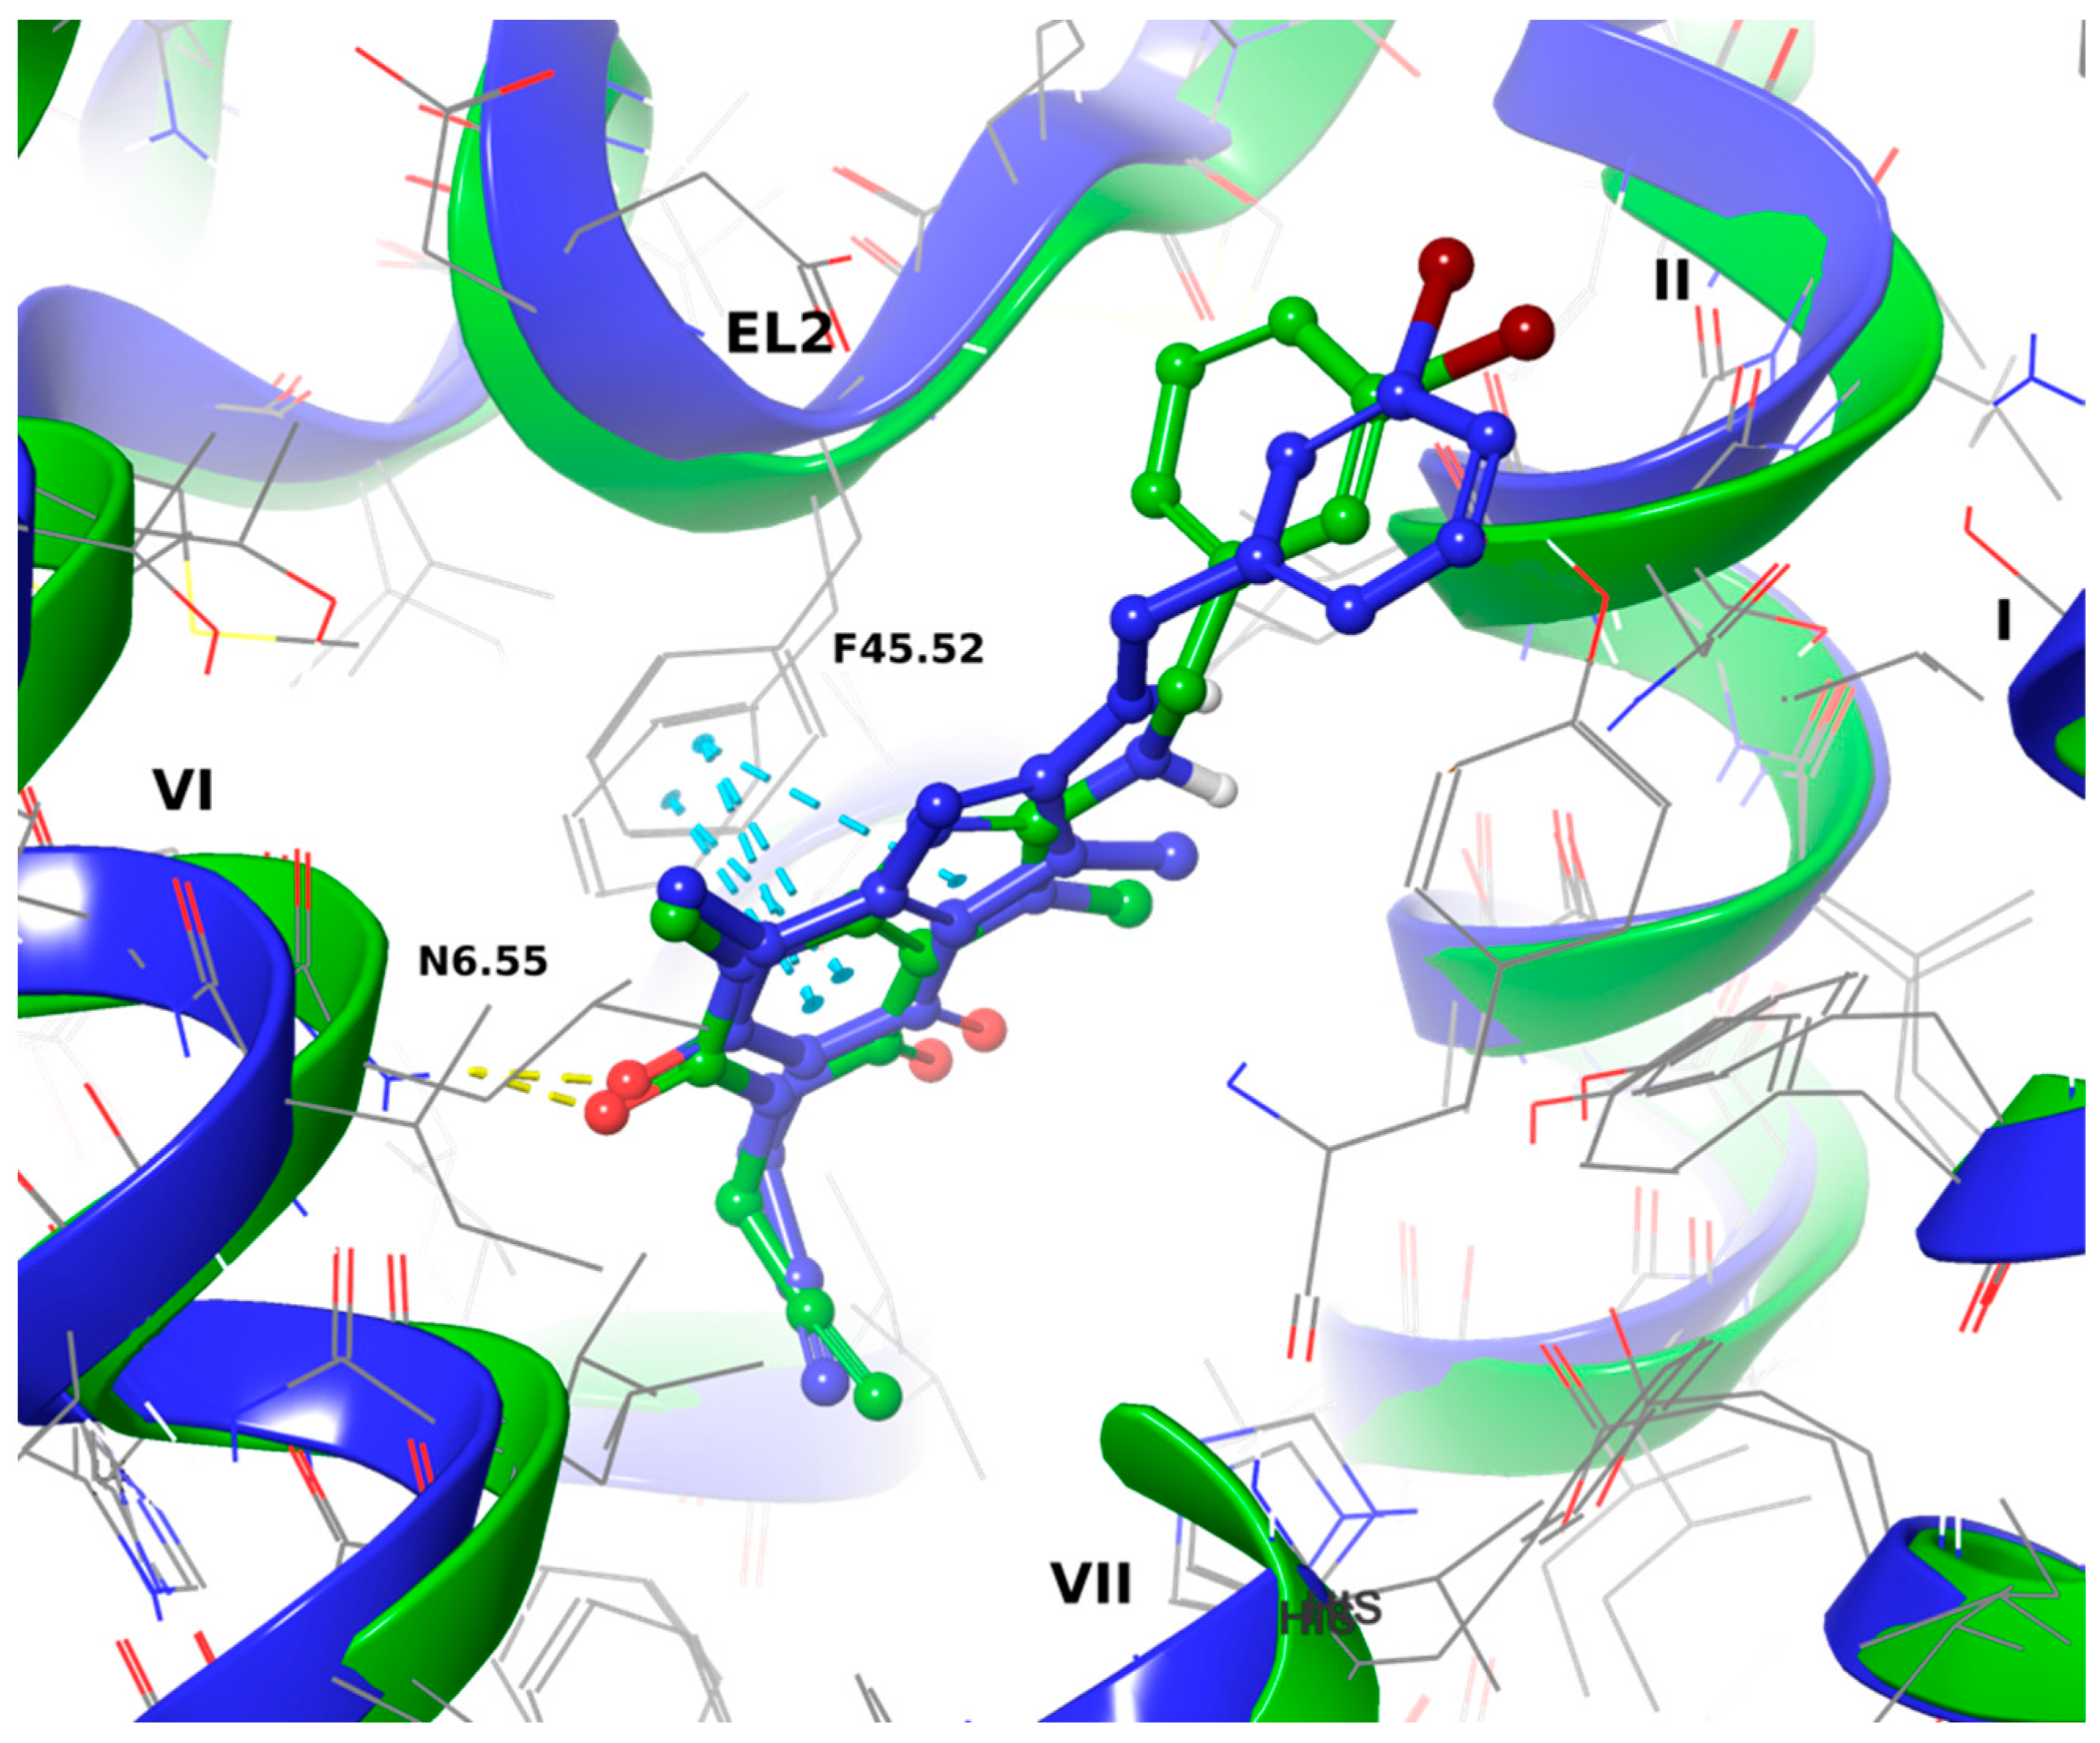
2.3.1. Docking to the 5N2S (Adenosine A1 Receptor) and MD Simulations
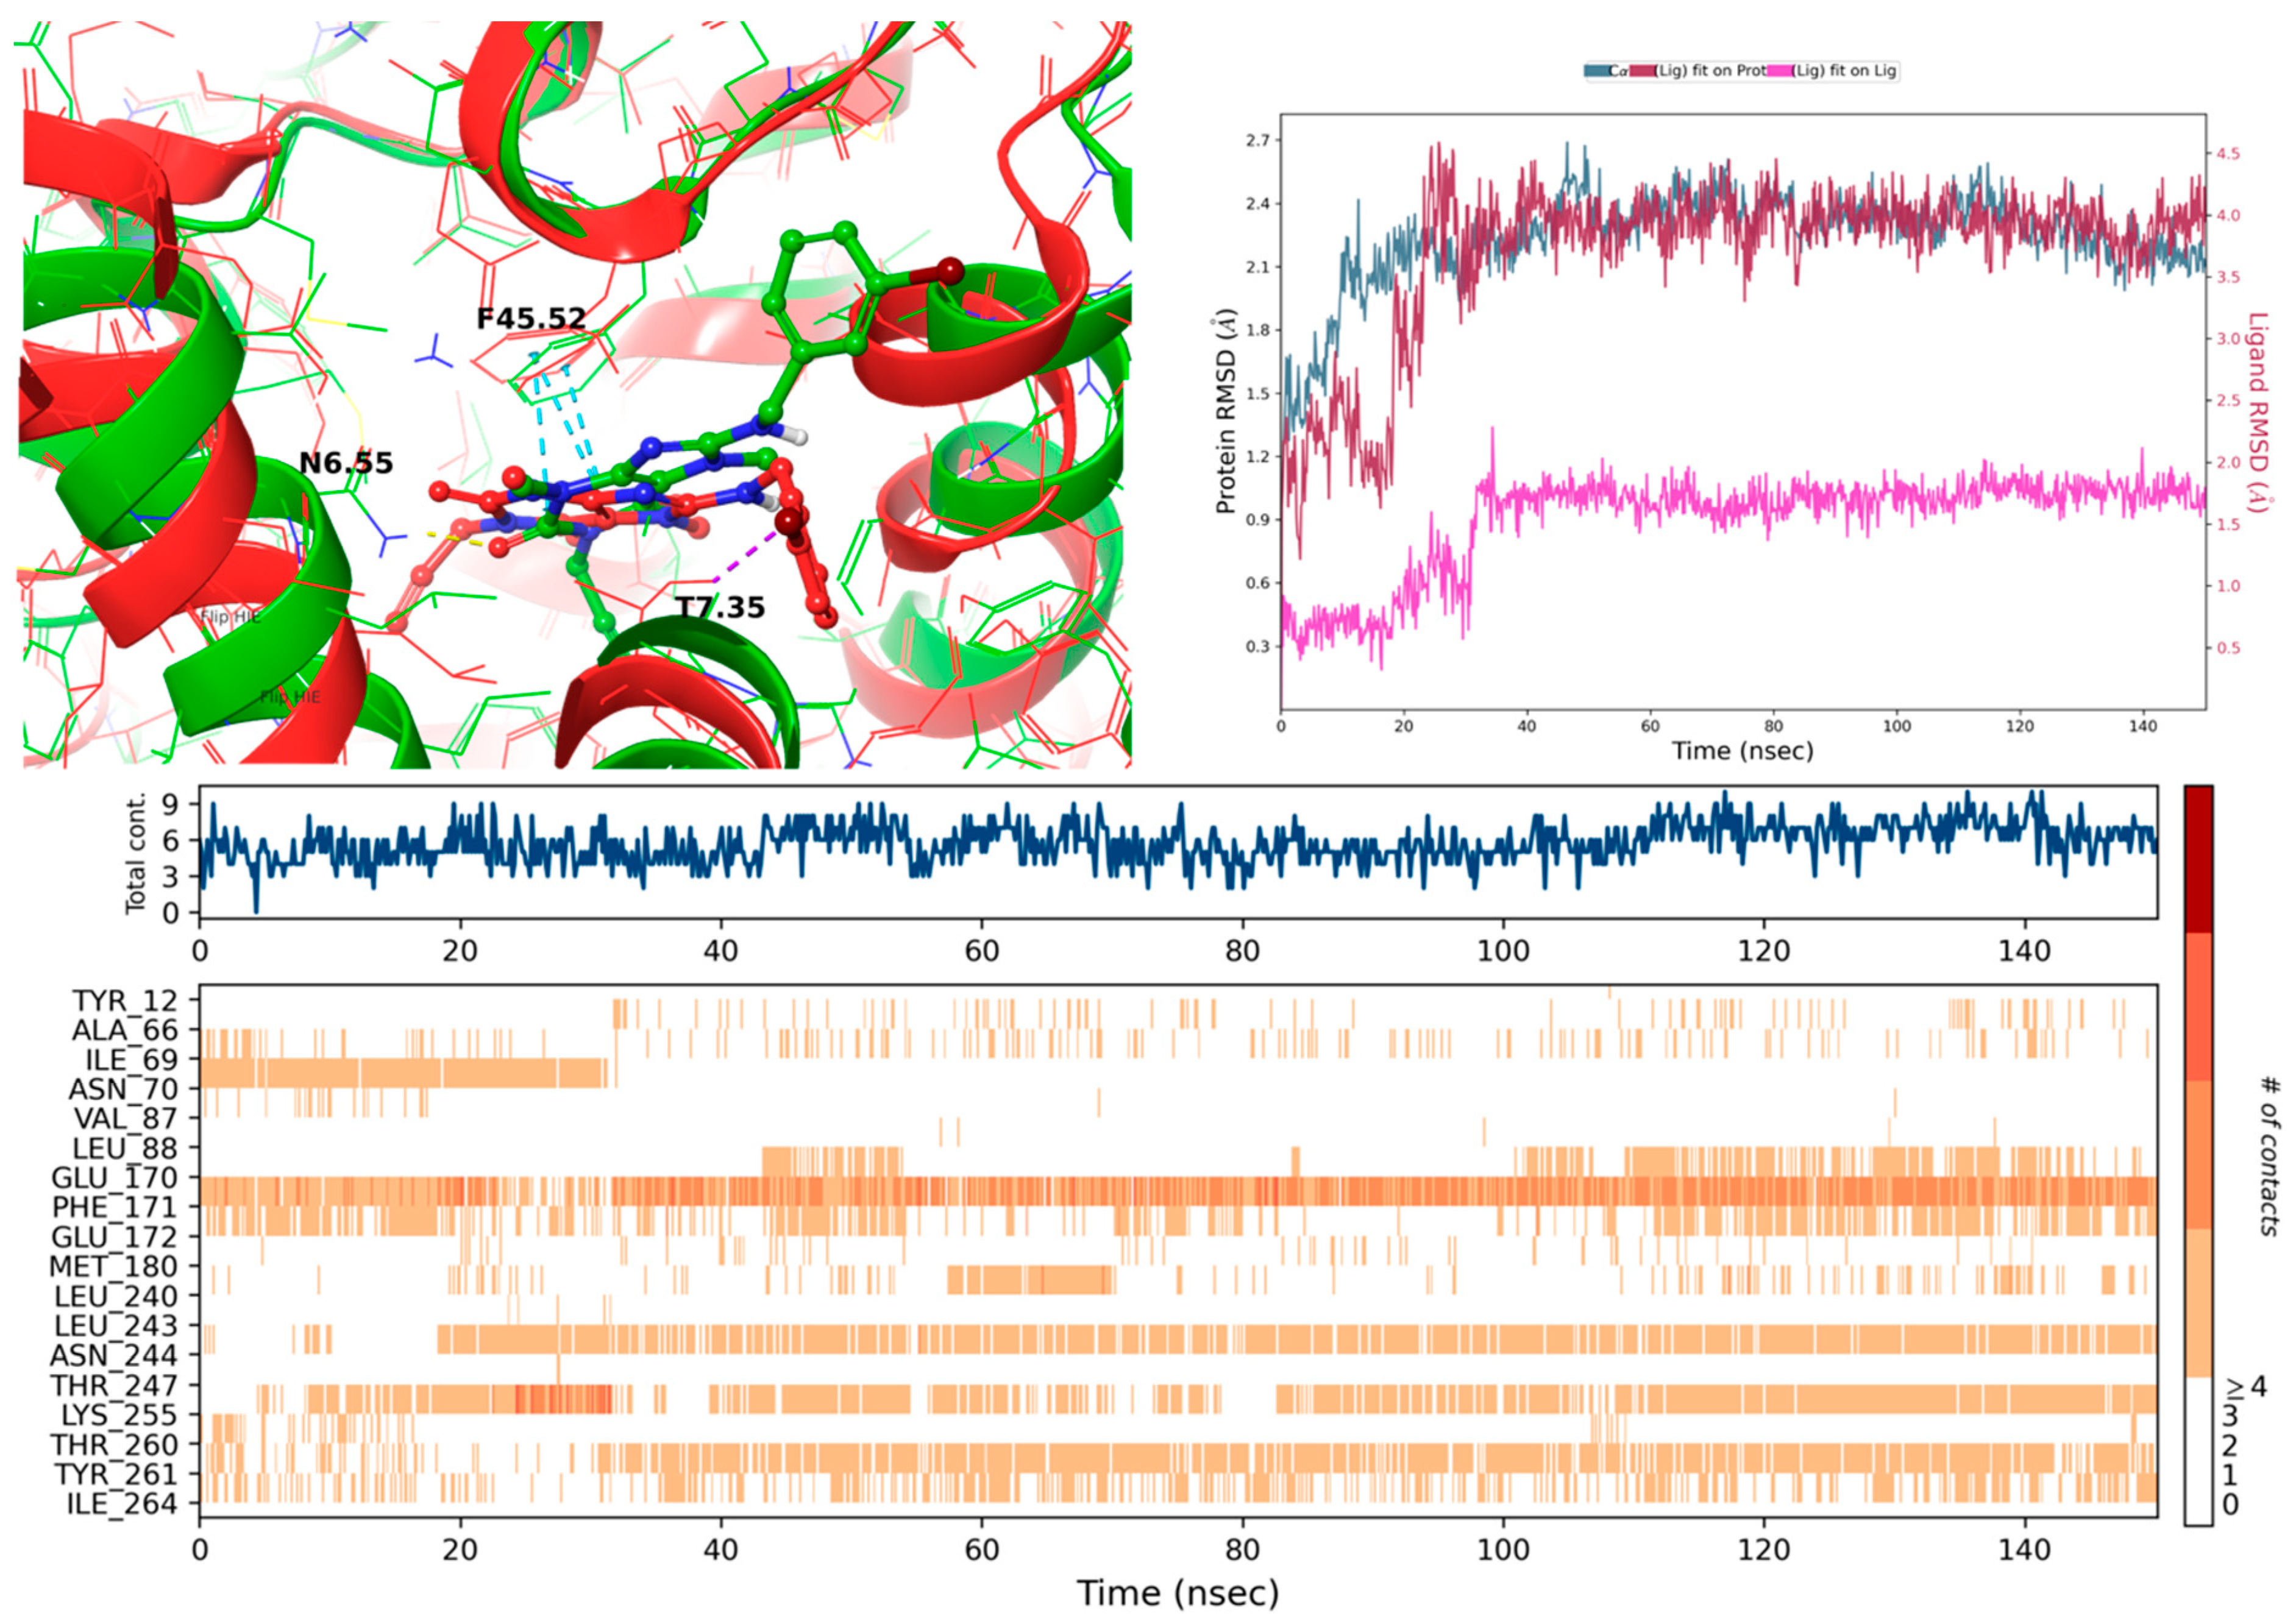
2.3.2. Docking to 5N2R (Adenosine A2A Receptor) and MD Simulations
2.4. Selected ADMET Properties—Evaluation In Vitro
2.4.1. Toxicity Evaluation
2.4.2. Metabolic Stability
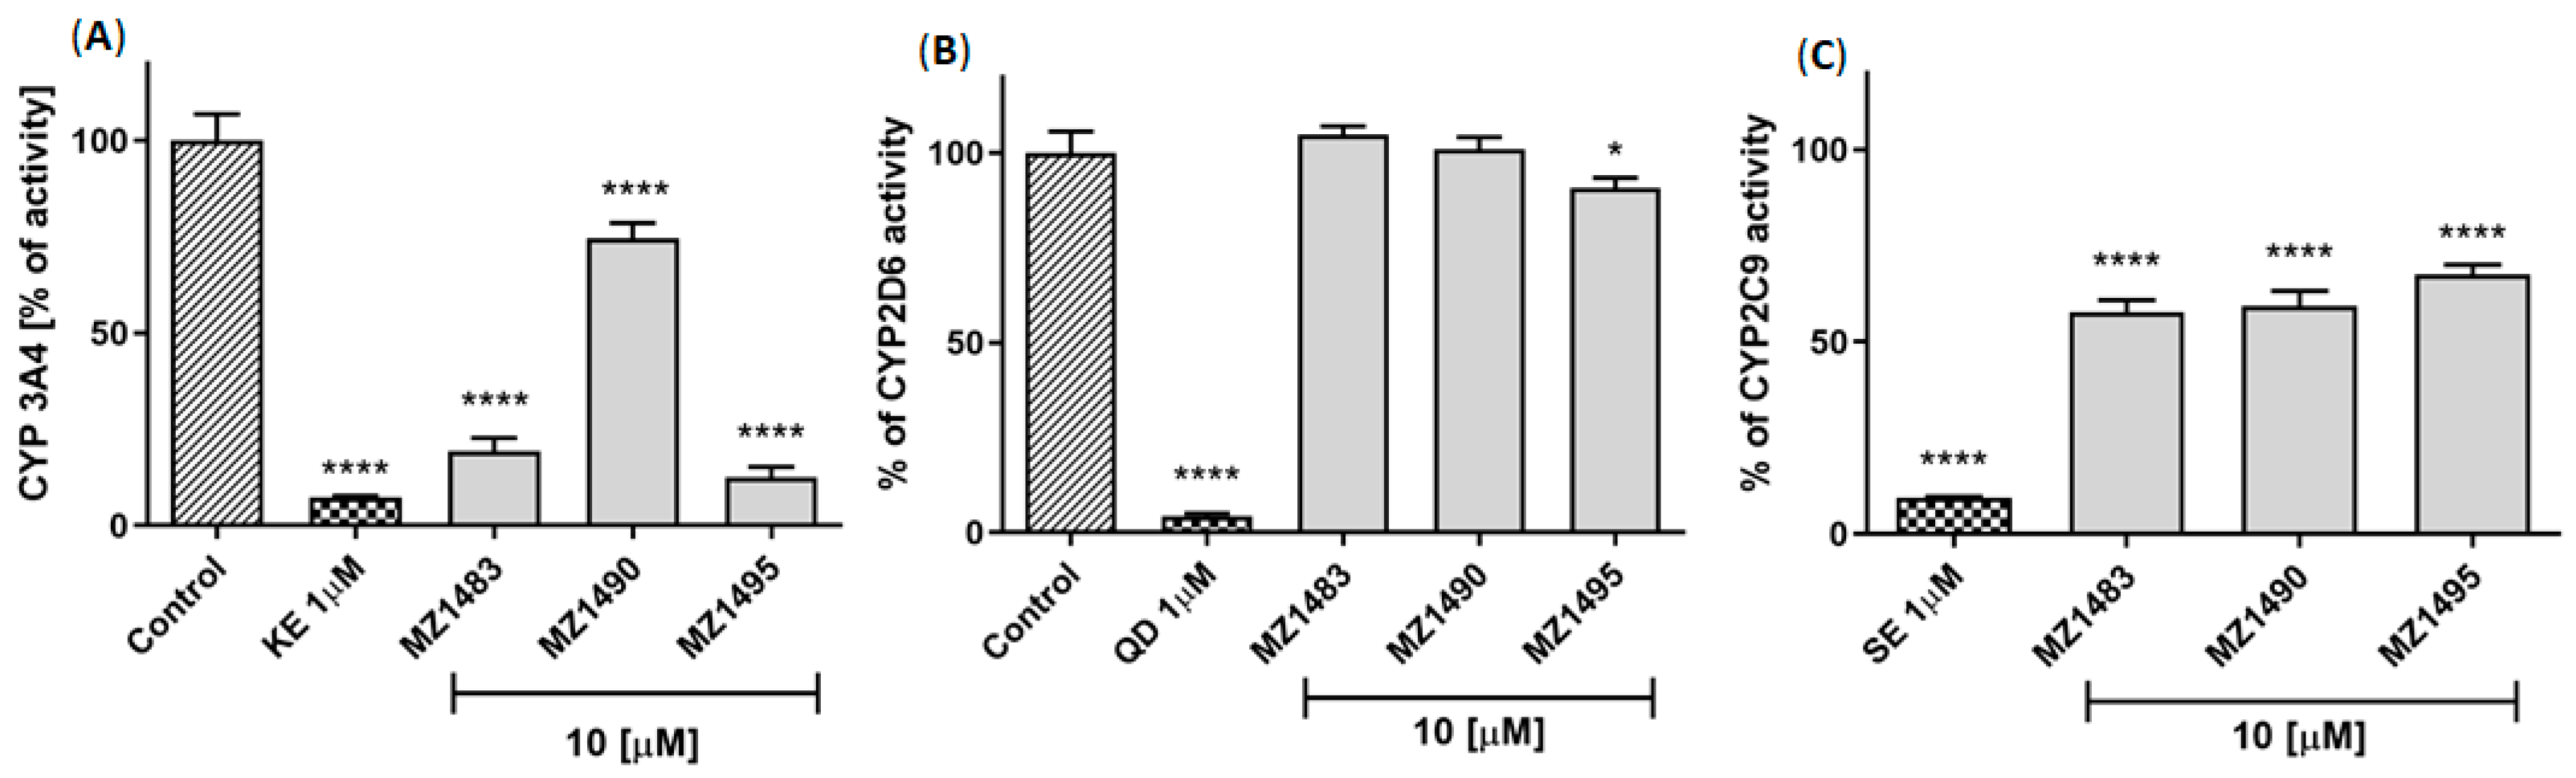
2.4.3. Potential for Drug-Drug Interactions
2.4.4. Blood Brain Barrier Permeability
2.5. Anti-Inflammatory Activity In Vitro
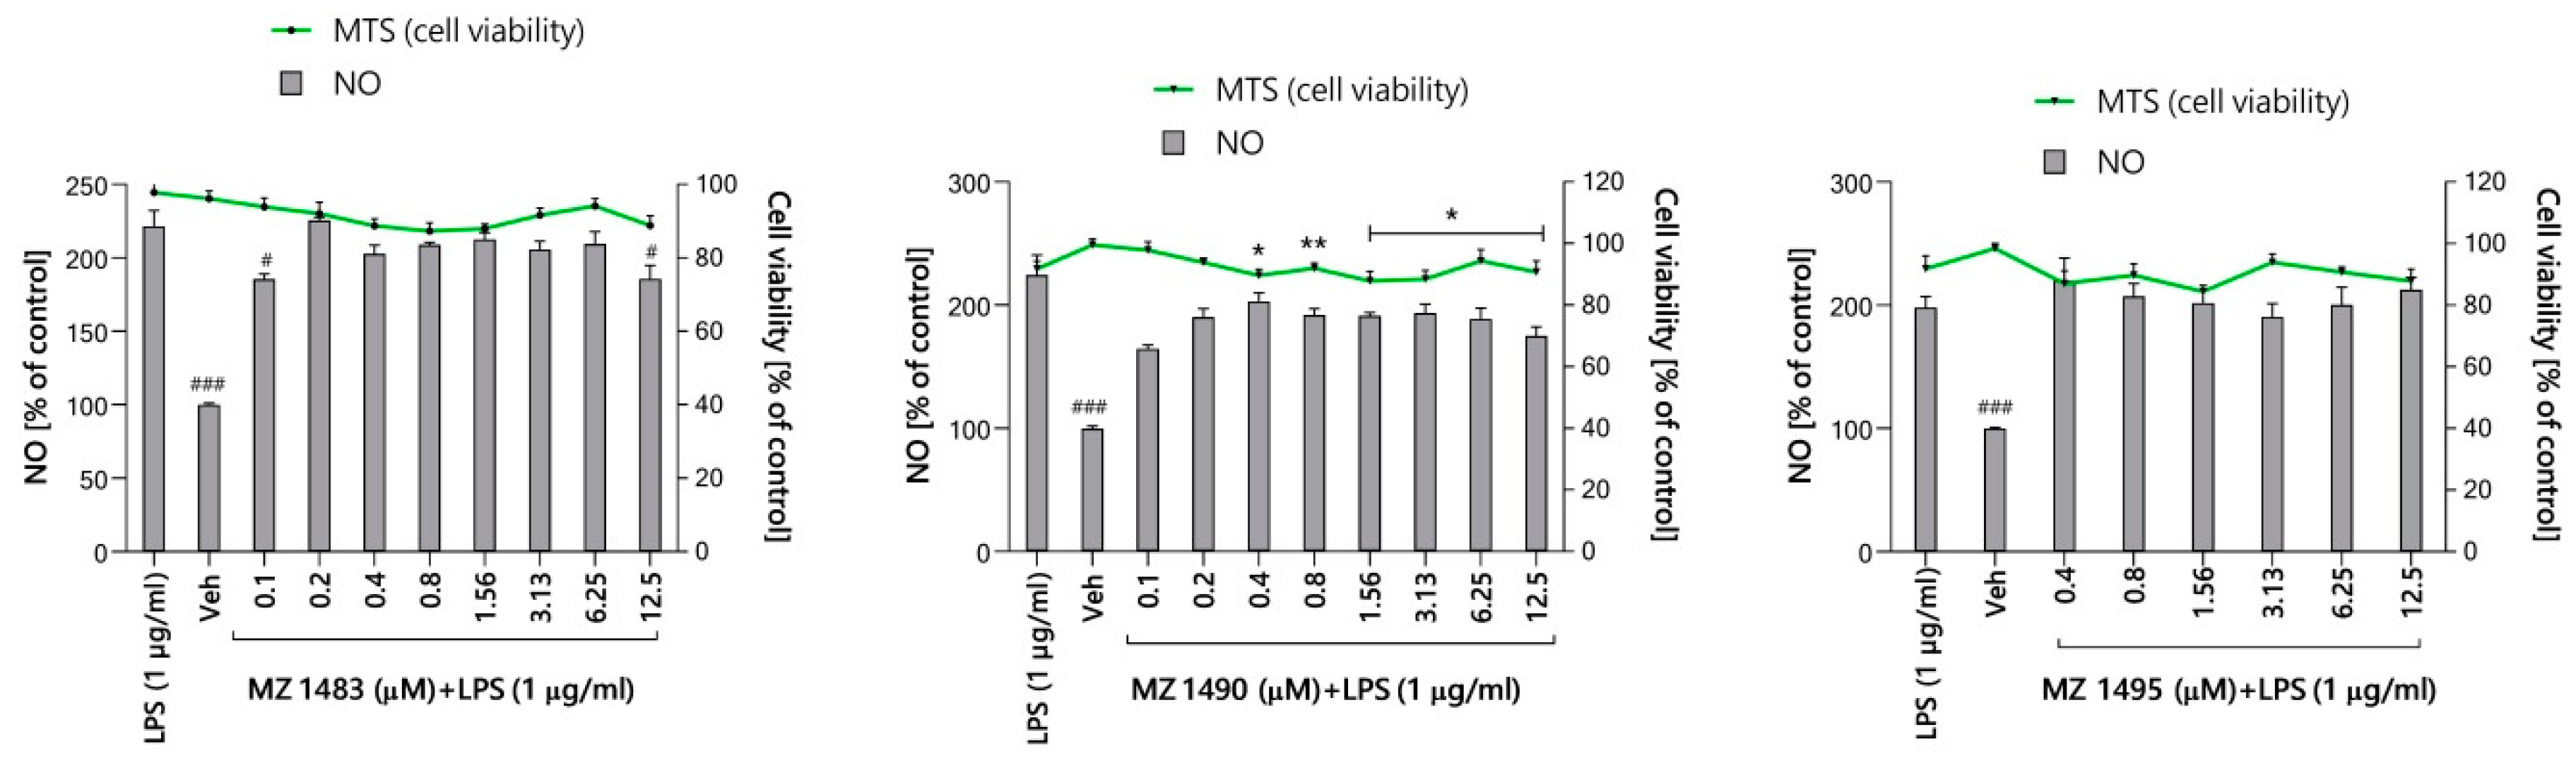
2.5.1. Preliminary Screening of Anti-Inflammatory Activity in Griess Assay
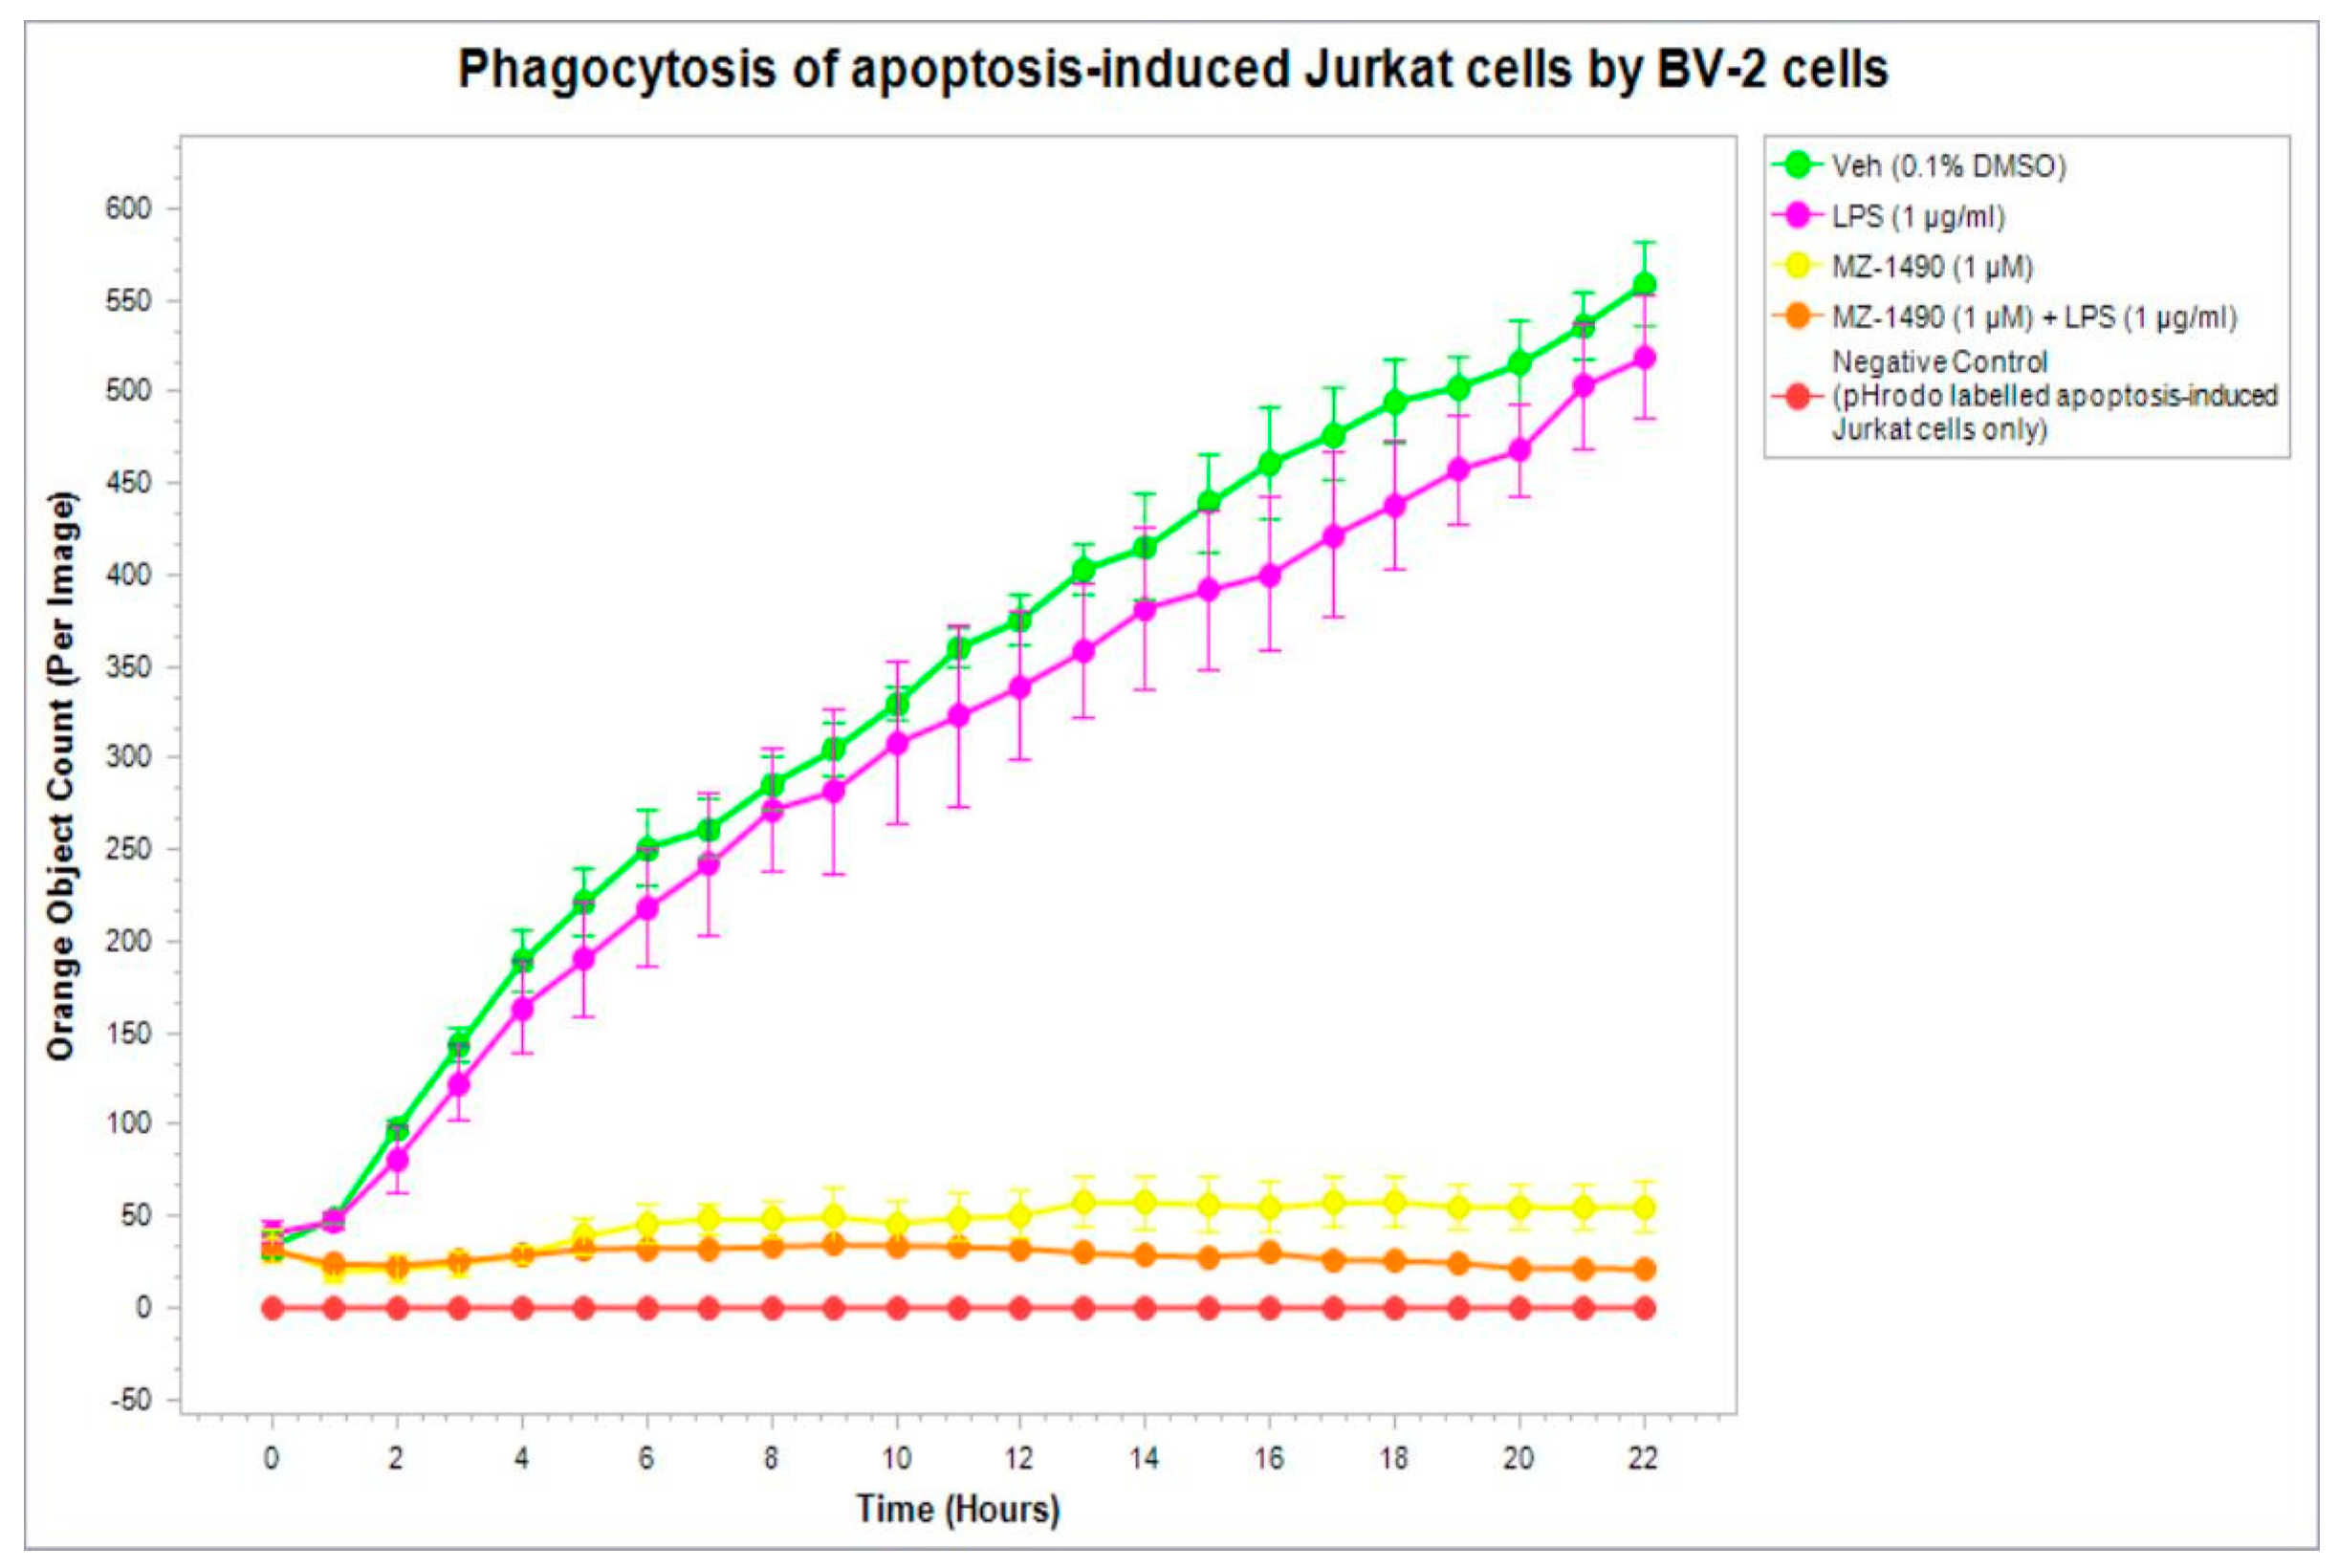
2.5.2. Phagocytic Activity
2.6. Antinociceptive and Antiinflammatory Activity In Vivo
2.6.1. Anti-Inflammatory (Antiedematous) Effect in the Carrageenan-Induced Edema Model
2.6.2. Anti-Nociceptive Activity in the Formalin Test
3. Conclusions
- ✓
- interaction with A3R at submicromolar concentrations,
- ✓
- no interaction with A2BR at submicromolar concentrations (except for compounds 5 and 14),
- ✓
- affinities for A1R in the nanomolar range in the series IC and II (except 20 and 26), and
- ✓
- variable affinities for A2AR (most compounds had Ki values in the range from 62 nM to 773 nM)
4. Material and Methods
4.1. Chemistry
4.1.1. General Information
4.1.2. Synthesis of Compounds 5–26
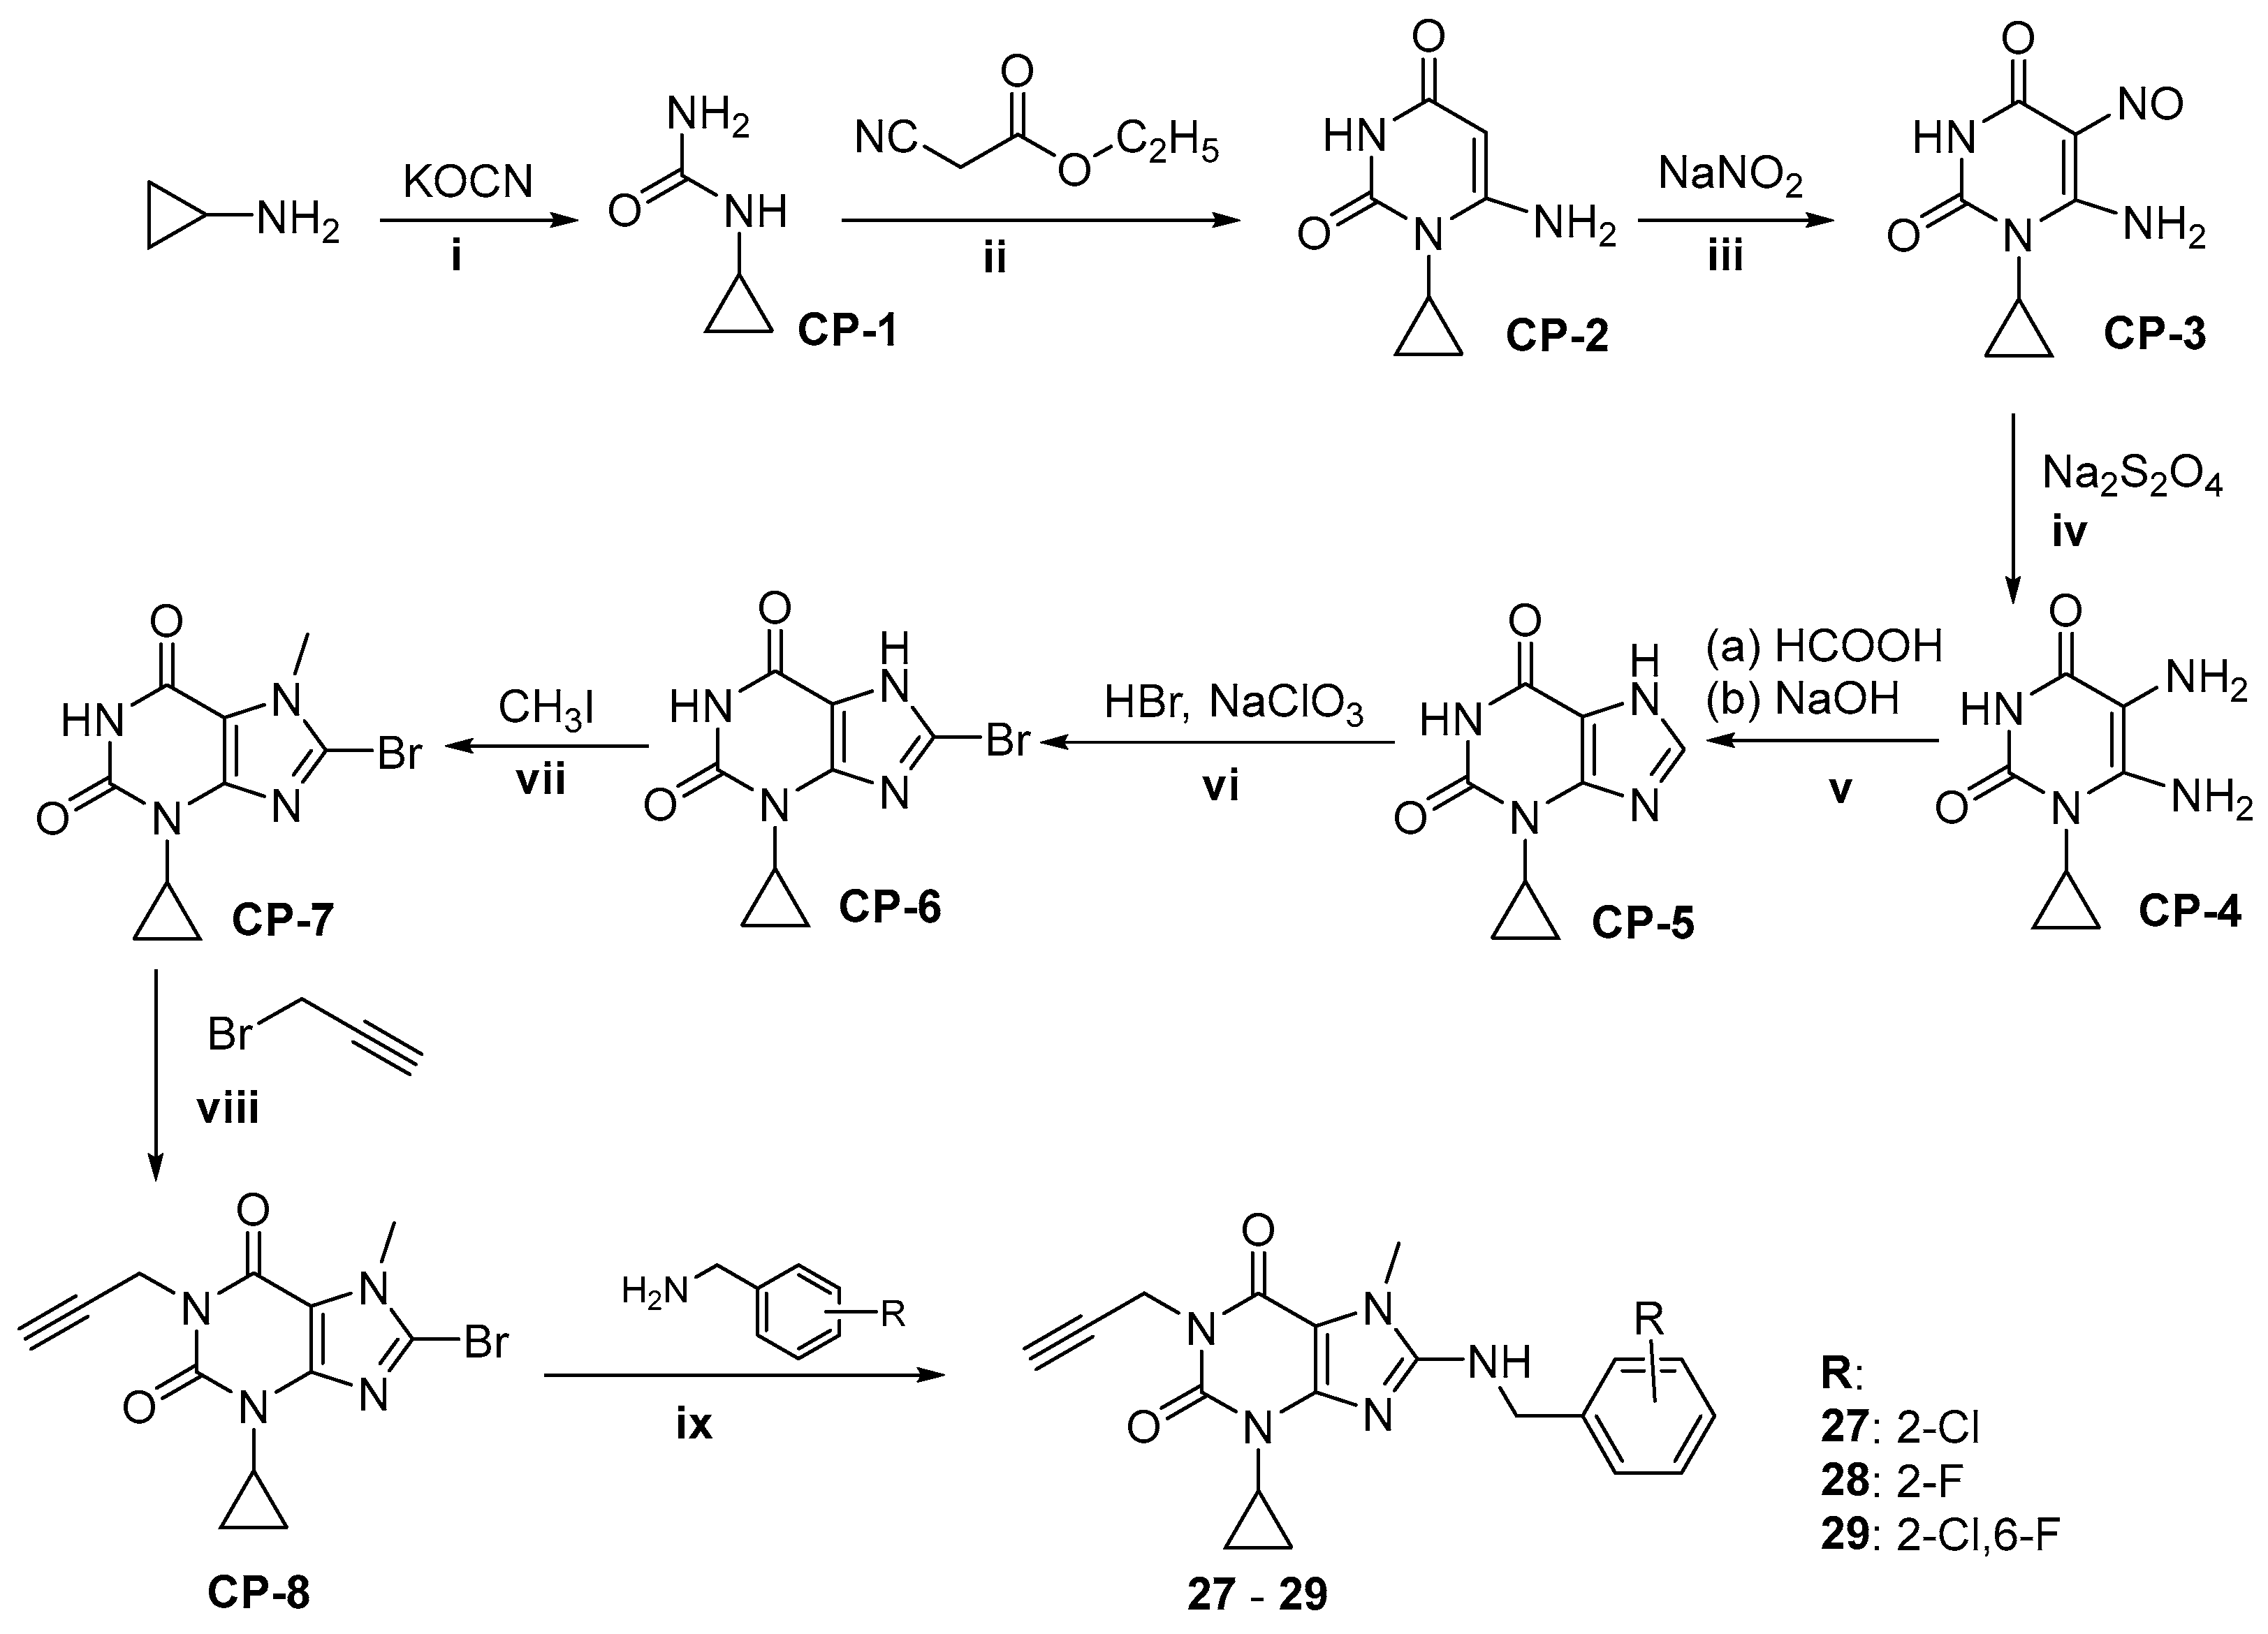
4.1.3. Synthesis of 8-substitued 3-cyclopropyl-7-methyl-1-propargylxanthines 27–29
Synthesis of Substrates
General Procedure of Synthesis of Compounds 27–29
4.2. Radioligand Binding Assays at Human Adenosine Receptors
4.3. Human MAO B Inhibitory Activity
4.4. Molecular Modeling Studies to Adenosine A1 and A2A Receptors
4.5. ADMET Properties
4.5.1. Toxicity Evaluation
4.5.2. Metabolic Stability in Human Liver Microsomes
4.5.3. Drug—Drug Interactions
4.5.4. Blood Brain Barrier Permeability
4.6. Anti-Inflammatory Activity In Vitro
4.6.1. Preliminary Screening for Anti-Inflammatory Activity (Griess Assay)
4.6.2. Phagocytic Activity
4.7. Antinociceptive and Anti-Inflammatory Activity In Vivo
4.7.1. Animals
4.7.2. Statistical Analysis
4.7.3. The Formalin Test
4.7.4. Carrageenan-Induced Edema Model
Supplementary Materials
Author Contributions
Funding
Institutional Review Board Statement
Informed Consent Statement
Data Availability Statement
Acknowledgments
Conflicts of Interest
References
- Bloem, B.R.; Okun, M.S.; Klein, C. Parkinson’s Disease. Lancet 2021, 397, 2284–2303. [Google Scholar] [CrossRef] [PubMed]
- Liddle, R.A. Parkinson’s disease from the gut. Brain Res. 2018, 1693 Pt B, 201–206. [Google Scholar] [CrossRef]
- Pajares, M.; Rojo, A.I.; Manda, G.; Boscá, L.; Cuadrado, A. Inflammation in Parkinson’s Disease: Mechanisms and Therapeutic Implications. Cells 2020, 9, 1687. [Google Scholar] [CrossRef] [PubMed]
- Tansey, M.G.; Wallings, R.L.; Houser, M.C.; Herrick, M.K.; Keating, C.E.; Joers, V. Inflammation and immune dysfunction in Parkinson disease. Nat. Rev. Immunol. 2022, 22, 657–673. [Google Scholar] [CrossRef]
- Armstrong, M.J.; Okun, M.S. Diagnosis and Treatment of Parkinson Disease: A Review. JAMA 2020, 323, 548–560. [Google Scholar] [CrossRef] [PubMed]
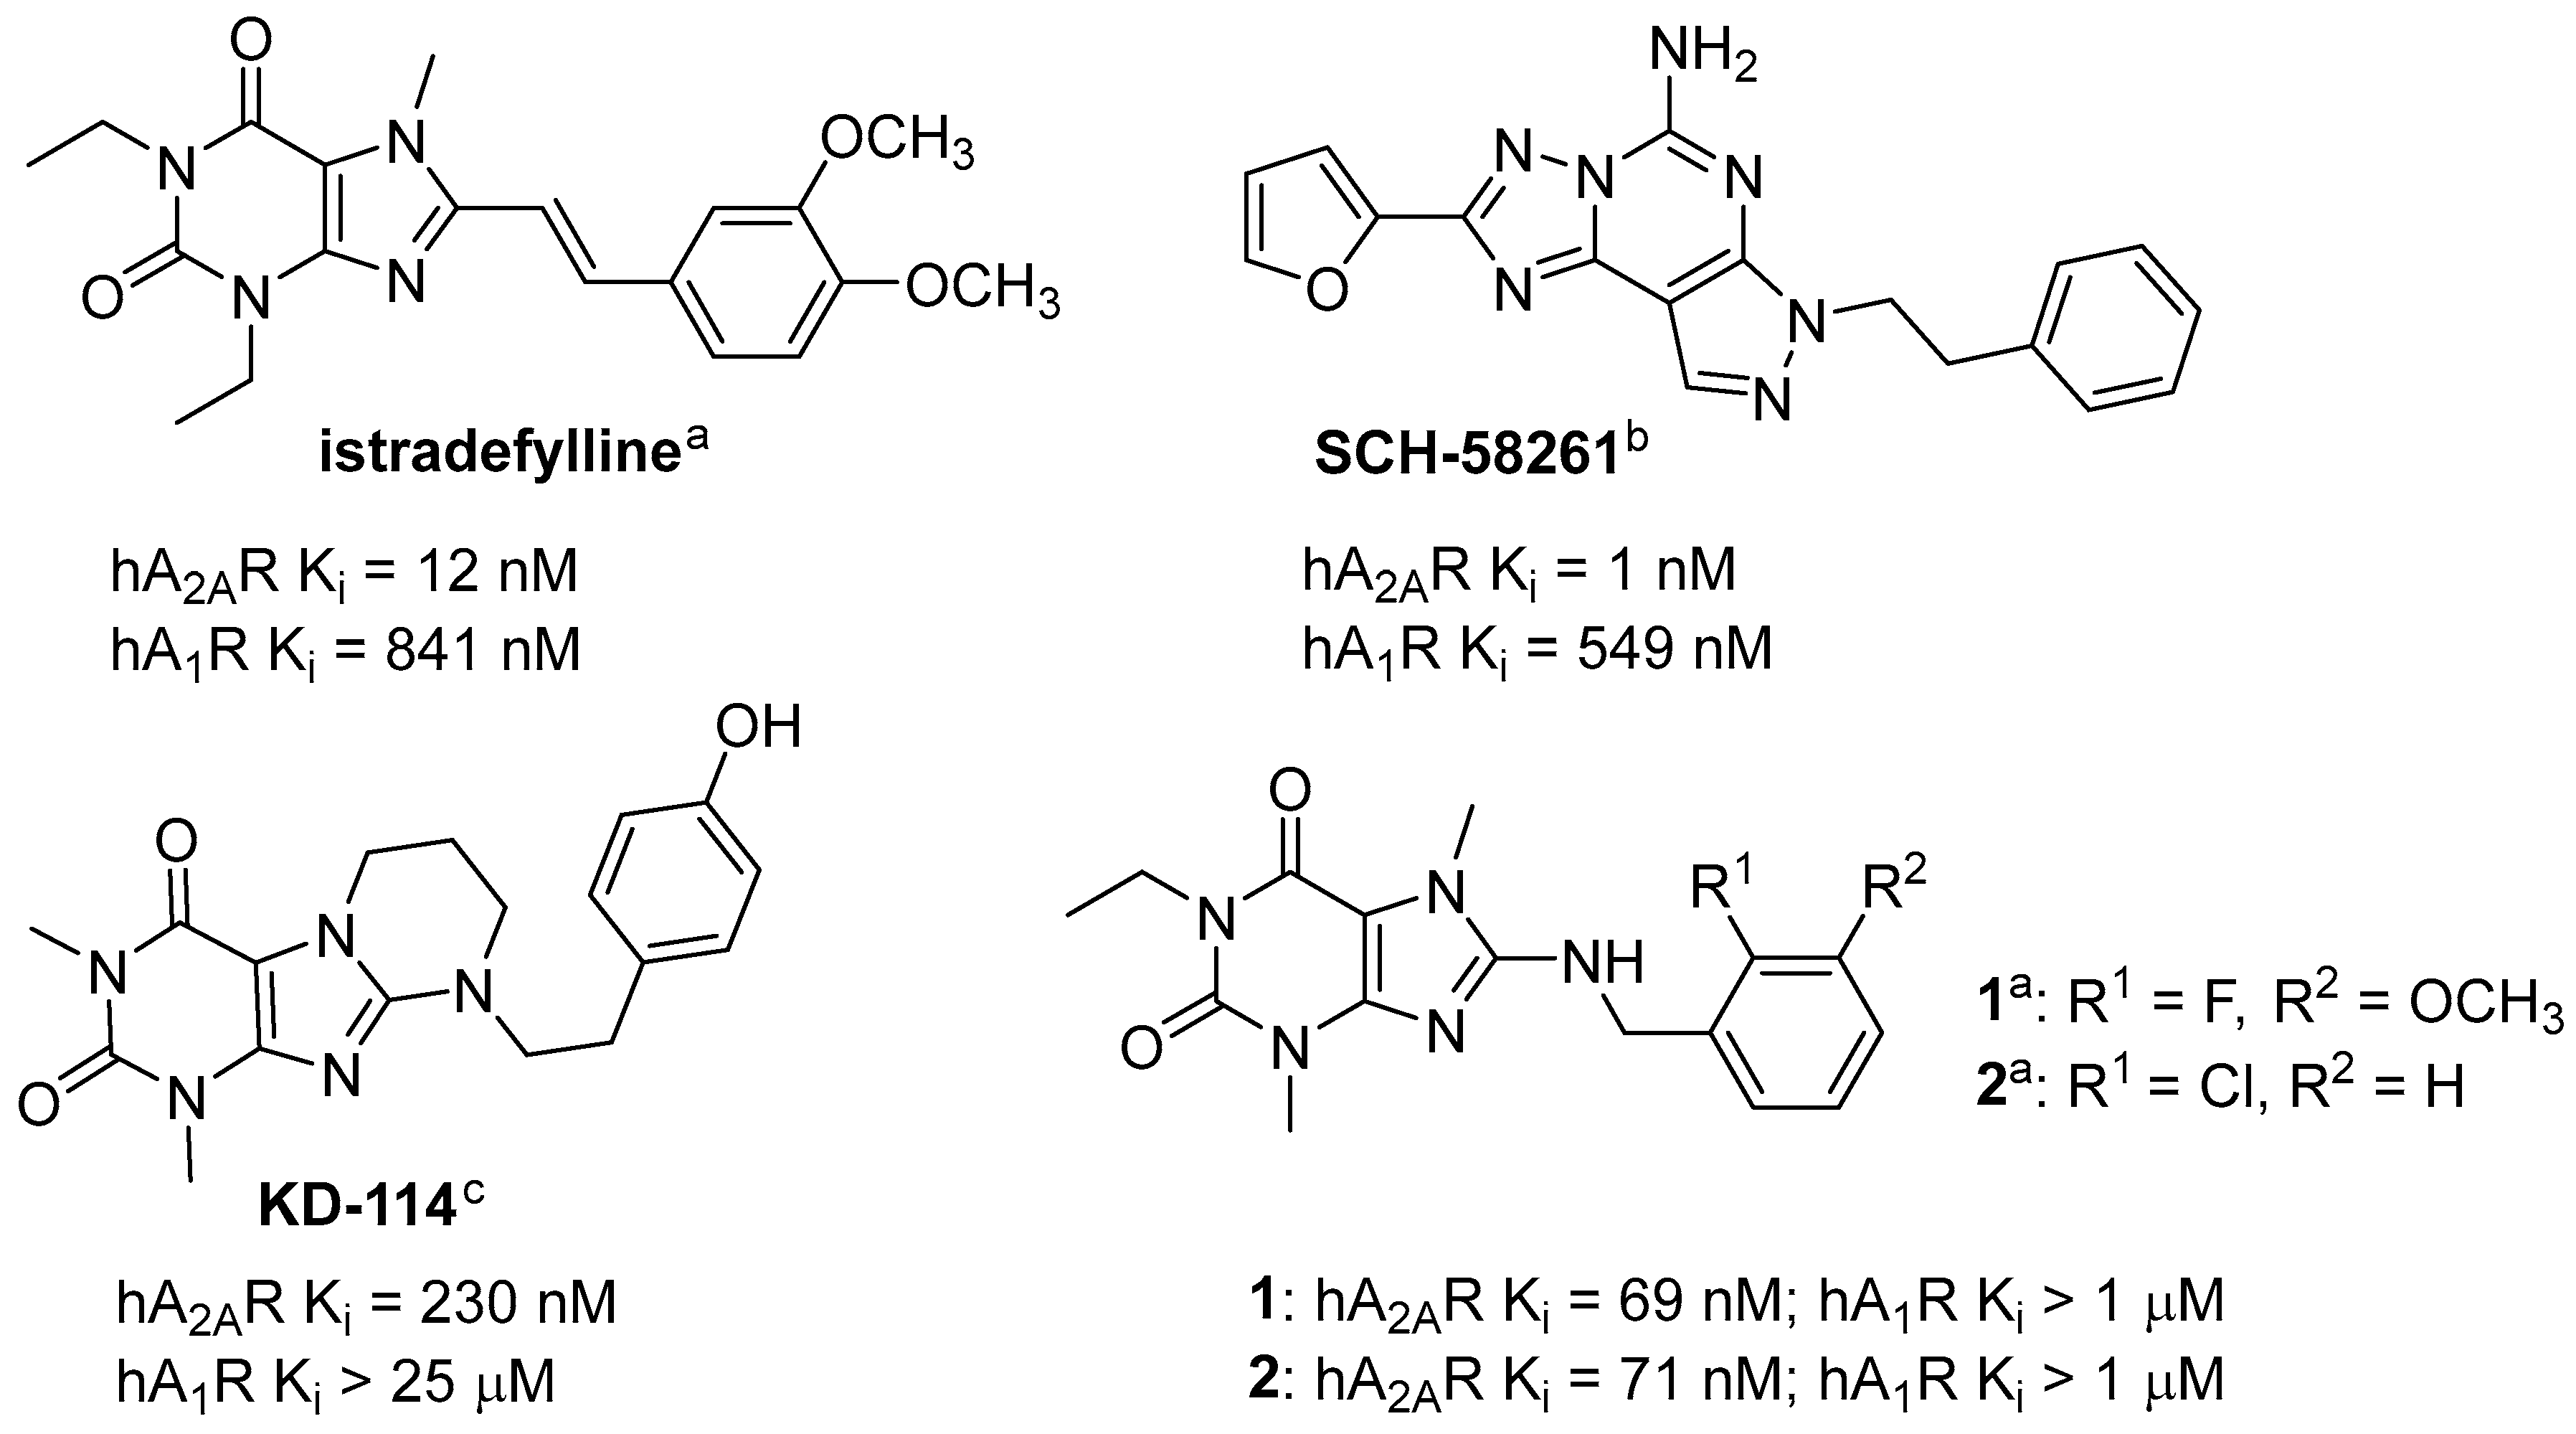
- Jenner, P.; Mori, A.; Aradi, S.D.; Hauser, R.A. Istradefylline—A first generation adenosine A2A antagonist for the treatment of Parkinson’s disease. Expert. Rev. Neurother. 2021, 21, 317–333. [Google Scholar] [CrossRef]
- Müller, C.E.; Jacobson, K.A. Xanthines as adenosine receptor antagonists. Handb. Exp. Pharmacol. 2011, 200, 151–199. [Google Scholar] [CrossRef]
- Pasquini, S.; Contri, C.; Borea, P.A.; Vincenzi, F.; Varani, K. Adenosine and Inflammation: Here, There and Everywhere. Int. J. Mol. Sci. 2021, 22, 7685. [Google Scholar] [CrossRef]
- Ongini, E. SCH 58261: A selective A2A adenosine receptor antagonist. Drug Develop. Res. 1997, 42, 63–70. [Google Scholar] [CrossRef]
- Rebola, N.; Simões, A.P.; Canas, P.M.; Tomé, A.R.; Andrade, G.M.; Barry, C.E.; Agostinho, P.M.; Lynch, M.A.; Cunha, R.A. Adenosine A2A receptors control neuroinflammation and consequent hippocampal neuronal dysfunction. J. Neurochem. 2011, 117, 100–111. [Google Scholar] [CrossRef]
- Colella, M.; Zinni, M.; Pansiot, J.; Cassanello, M.; Mairesse, J.; Ramenghi, L.; Baud, O. Modulation of Microglial Activation by Adenosine A2a Receptor in Animal Models of Perinatal Brain Injury. Front. Neurol. 2018, 9, 605. [Google Scholar] [CrossRef] [PubMed]
- Zygmunt, M.; Gołembiowska, K.; Drabczyńska, A.; Kieć-Kononowicz, K.; Sapa, J. Anti-inflammatory, antioxidant, and antiparkinsonian effects of adenosine A2A receptor antagonists. Pharmacol. Biochem. Behav. 2015, 32, 71–78. [Google Scholar] [CrossRef]
- Załuski, M.; Schabikowski, J.; Jaśko, P.; Bryła, A.; Olejarz-Maciej, A.; Kaleta, M.; Głuch-Lutwin, M.; Brockmann, A.; Hinz, S.; Zygmunt, M.; et al. 8-Benzylaminoxanthine scaffold variations for selective ligands acting on adenosine A2A receptors. Design, synthesis and biological evaluation. Bioorg. Chem. 2020, 101, 104033. [Google Scholar] [CrossRef]
- Cheng, R.K.Y.; Segala, E.; Robertson, N.; Deflorian, F.; Doré, A.S.; Errey, J.C.; Fiez-Vandal, C.; Marshall, F.H.; Cooke, R.M. Structures of Human A 1 and A 2A Adenosine Receptors with Xanthines Reveal Determinants of Selectivity. Structure 2017, 25, 1275–1285.E4. [Google Scholar] [CrossRef] [PubMed]
- Weyler, S.; Fülle, F.; Diekmann, M.; Schumacher, B.; Hinz, S.; Klotz, K.N.; Müller, C.E. Improving potency, selectivity, and water solubility of adenosine A1 receptor antagonists: Xanthines modified at position 3 and related pyrimido[1,2,3-cd]purinediones. ChemMedChem 2006, 1, 891–902. [Google Scholar] [CrossRef]
- Słoczyńska, K.; Gunia-Krzyżak, A.; Koczurkiewicz, P.; Wójcik-Pszczoła, K.; Żelaszczyk, D.; Popiół, J.; Pękala, E. Metabolic stability and its role in the discovery of new chemical entities. Acta Pharm. 2019, 69, 345–361. [Google Scholar] [CrossRef] [PubMed]
- Neumaier, F.; Zlatopolskiy, B.D.; Neumaier, B. Drug Penetration into the Central Nervous System: Pharmacokinetic Concepts and In Vitro Model Systems. Pharmaceutics 2021, 13, 1542. [Google Scholar] [CrossRef]
- Sharma, J.N.; Al-Omran, A.; Parvathy, S.S. Role of nitric oxide in inflammatory diseases. Inflammopharmacology 2007, 15, 252–259. [Google Scholar] [CrossRef]
- Honkisz-Orzechowska, E.; Popiołek-Barczyk, K.; Linart, Z.; Filipek-Gorzała, J.; Rudnicka, A.; Siwek, A.; Werner, T.; Stark, H.; Chwastek, J.; Starowicz, K.; et al. Anti-inflammatory effects of new human histamine H3 receptor ligands with flavonoid structure on BV-2 neuroinflammation. Inflamm. Res. 2023, 72, 181–194. [Google Scholar] [CrossRef]
- Galloway, D.A.; Phillips, A.E.M.; Owen, D.R.J.; Moore, C.S. Phagocytosis in the Brain: Homeostasis and Disease. Front. Immunol. 2019, 10, 790. [Google Scholar] [CrossRef]
- Lv, Q.K.; Tao, K.X.; Wang, X.B.; Yao, X.Y.; Pang, M.Z.; Liu, J.Y.; Wang, F.; Liu, C.F. Role of α-synuclein in microglia: Autophagy and phagocytosis balance neuroinflammation in Parkinson’s disease. Inflamm. Res. 2023, 72, 443–462. [Google Scholar] [CrossRef] [PubMed]
- Kinetic Analysis of Microglial Function and Morphology. News-Medical. Available online: https://www.news-medical.net/whitepaper/20200714/Kinetic-Analysis-of-Microglial-Function-and-Morphology.aspx (accessed on 14 March 2023).
- Ronaldson, P.T.; Davis, T.P. Regulation of blood-brain barrier integrity by microglia in health and disease: A therapeutic opportunity. J. Cereb. Blood Flow. Metab. 2020, 40 (Suppl. 1), S6–S24. [Google Scholar] [CrossRef] [PubMed]
- Jolivel, V.; Brun, S.; Binamé, F.; Benyounes, J.; Taleb, O.; Bagnard, D.; De Sèze, J.; Patte-Mensah, C.; Mensah-Nyagan, A.G. Microglial Cell Morphology and Phagocytic Activity Are Critically Regulated by the Neurosteroid Allopregnanolone: A Possible Role in Neuroprotection. Cells 2021, 10, 698. [Google Scholar] [CrossRef] [PubMed]
- Winter, C.A.; Risely, E.A.; Nuss, G.W. Carrageenan induced edema in hind paw of the rat as an assay for anti-inflammatory. Proc. Soc. Exp. Biol. Med. 1962, 111, 544–547. [Google Scholar] [CrossRef] [PubMed]
- Morris, C.J. Carrageenan-Induced Paw Edema in the Rat and Mouse. In Inflammation Protocols. Methods in Molecular Biology; Winyard, P.G., Willoughby, D.A., Eds.; Humana Press Inc.: Totowa, NJ, USA, 2003; Volume 225, pp. 115–121. [Google Scholar] [CrossRef]
- López-Cano, M.; Fernández-Dueñas, V.; Llebaria, A.; Ciruela, F. Formalin Murine Model of Pain. Bio-Protoc. 2017, 7, e2628. [Google Scholar] [CrossRef] [PubMed]
- Chen, X.; Murawski, A.; Patel, K.; Crespi, C.L.; Balimane, P.V. A novel design of artificial membrane for improving the PAMPA model. Pharm. Res. 2008, 25, 1511–1520. [Google Scholar] [CrossRef] [PubMed]
- Kansy, M.; Fischer, H.; Kratzat, K.; Senner, F.; Wagner, B.; Parrilla, I. High-Throughput Artificial Membrane Permeability Studies in Early Lead Discovery and Development. In Pharmacokinetic Optimization in Drug Research; Testa, B., Van de Waterbeend, H., Folkers, G., Guy, R., Eds.; Verlag Helvetica Chimica Acta/Wiley/VCH: Zurich, Switzerland, 2001; pp. 447–464. [Google Scholar]
- Gupta, D.; Bhatia, D.; Dave, V.; Sutariya, V.; Varghese Gupta, S. Salts of Therapeutic Agents: Chemical, Physicochemical, and Biological Considerations. Molecules 2018, 23, 1719. [Google Scholar] [CrossRef]
- Patrushev, S.S.; Rybalova, T.V.; Ivanov, I.D.; Vavilin, V.A.; Shults, E.E. Synthesis of a new class of bisheterocycles via the Heck reaction of eudesmane type methylene lactones with 8-bromoxanthines. Tetrahedron 2017, 73, 2717–2726. [Google Scholar] [CrossRef]
- Drabczyńska, A.; Karcz, T.; Szymańska, E.; Köse, M.; Müller, C.E.; Paskaleva, M.; Karolak-Wojciechowska, J.; Handzlik, J.; Yuzlenko, O.; Kieć-Kononowicz, K. Synthesis, biological activity and molecular modelling studies of tricyclic alkylimidazo-, pyrimido- and diazepinopurinediones. Purinergic Signal. 2013, 9, 395–414. [Google Scholar] [CrossRef]
- Schrödinger, LLC. Schrödinger Release 2022-4: Schrödinger Suite 2022-4; Schrödinger, LLC: New York, NY, USA, 2017. [Google Scholar]
- Watts, K.S.; Dalal, P.; Murphy, R.B.; Sherman, W.; Friesner, R.A.; Shelley, J.C. ConfGen: A Conformational Search Method for Efficient Generation of Bioactive Conformers. J. Chem. Inf. Model. 2010, 50, 534–546. [Google Scholar] [CrossRef]
- Friesner, R.A.; Banks, J.L.; Murphy, R.B.; Halgren, T.A.; Klicic, J.J.; Mainz, D.T.; Repasky, M.P.; Knoll, E.H.; Shelley, M.; Perry, J.K.; et al. Glide: A new approach for rapid, accurate docking and scoring. 1. Method and assessment of docking accuracy. J. Med. Chem. 2004, 47, 1739–1749. [Google Scholar] [CrossRef] [PubMed]
- Jacobson, M.P.; Pincus, D.L.; Rapp, C.S.; Day, T.J.F.; Honig, B.; Shaw, D.E.; Friesner, R. A Hierarchical Approach to All-Atom Protein Loop Prediction. Proteins Struct. Funct. Genet. 2004, 55, 351–367. [Google Scholar] [CrossRef]
- Bowers, K.J.; Chow, E.; Xu, H.; Dror, R.O.; Eastwood, M.P.; Gregersen, B.A.; Klepeis, J.L.; Kolossvary, I.; Moraes, M.A.; Sacerdoti, F.D.; et al. Scalable Algorithms for Molecular Dynamics Simulations on Commodity Clusters. In Proceedings of the 2006 ACM/IEEE Conference on Supercomputing, Tampa, FL, USA, 11–17 November 2006; Association for Computing Machinery: New York, NY, USA, 2006; p. 84. [Google Scholar] [CrossRef]
- Lomize, M.A.; Lomize, A.L.; Pogozheva, I.D.; Mosberg, H. OPM: Orientations of proteins in membranes database. Bioinformatics 2006, 22, 623–625. [Google Scholar] [CrossRef] [PubMed]
- Jorgensen, W.L.; Chandrasekhar, J.; Madura, J.D.; Impey, R.W.; Klein, M. Comparison of simple potential functions for simulating liquid water. J. Chem. Phys. 1983, 79, 926–935. [Google Scholar] [CrossRef]
- Lubelska, A.; Latacz, G.; Jastrzębska-Więsek, M.; Kotańska, M.; Kurczab, R.; Partyka, A.; Marć, M.A.; Wilczyńska, D.; Doroz-Płonka, A.; Łażewska, D.; et al. Are the Hydantoin-1,3,5-triazine 5-HT6R Ligands a Hope to a Find New Procognitive and Anti-Obesity Drug? Considerations Based on Primary In Vivo Assays and ADME-Tox Profile In Vitro. Molecules 2019, 24, 4472. [Google Scholar] [CrossRef]
- Kolesnikov, Y.; Cristea, M.; Oksman, G.; Torosjan, A.; Wilson, R. Evaluation of teh tail formalin test in mice as a new model to assess local analgesic effects. Brain Res. 2004, 1029, 217–223. [Google Scholar] [CrossRef] [PubMed]
- Litchfield, J.T.; Wilcoxon, F. A simplifield method of evaluating dose-effect experiments. J. Pharmacol. Exp. Ther. 1948, 96, 99–113. [Google Scholar]
- Lence, P. A new device for plethysmoscopic measuring of small objects. Arch. Int. Pharmacodyn. Ther. 1962, 136, 237–240. [Google Scholar]


| Compd. | Structure | A1R vs. [³H]CCPA b | A2AR vs. [³H]MSX-2 c | A2BR vs. [³H]PSB-603 d | A3R vs. [H³]PSB-11 e |
|---|---|---|---|---|---|
| Ki ± SEM (nM) (or % Inhibition ± SEM at 1 µM) | |||||
| Series IA—N1-Different Substituents | |||||
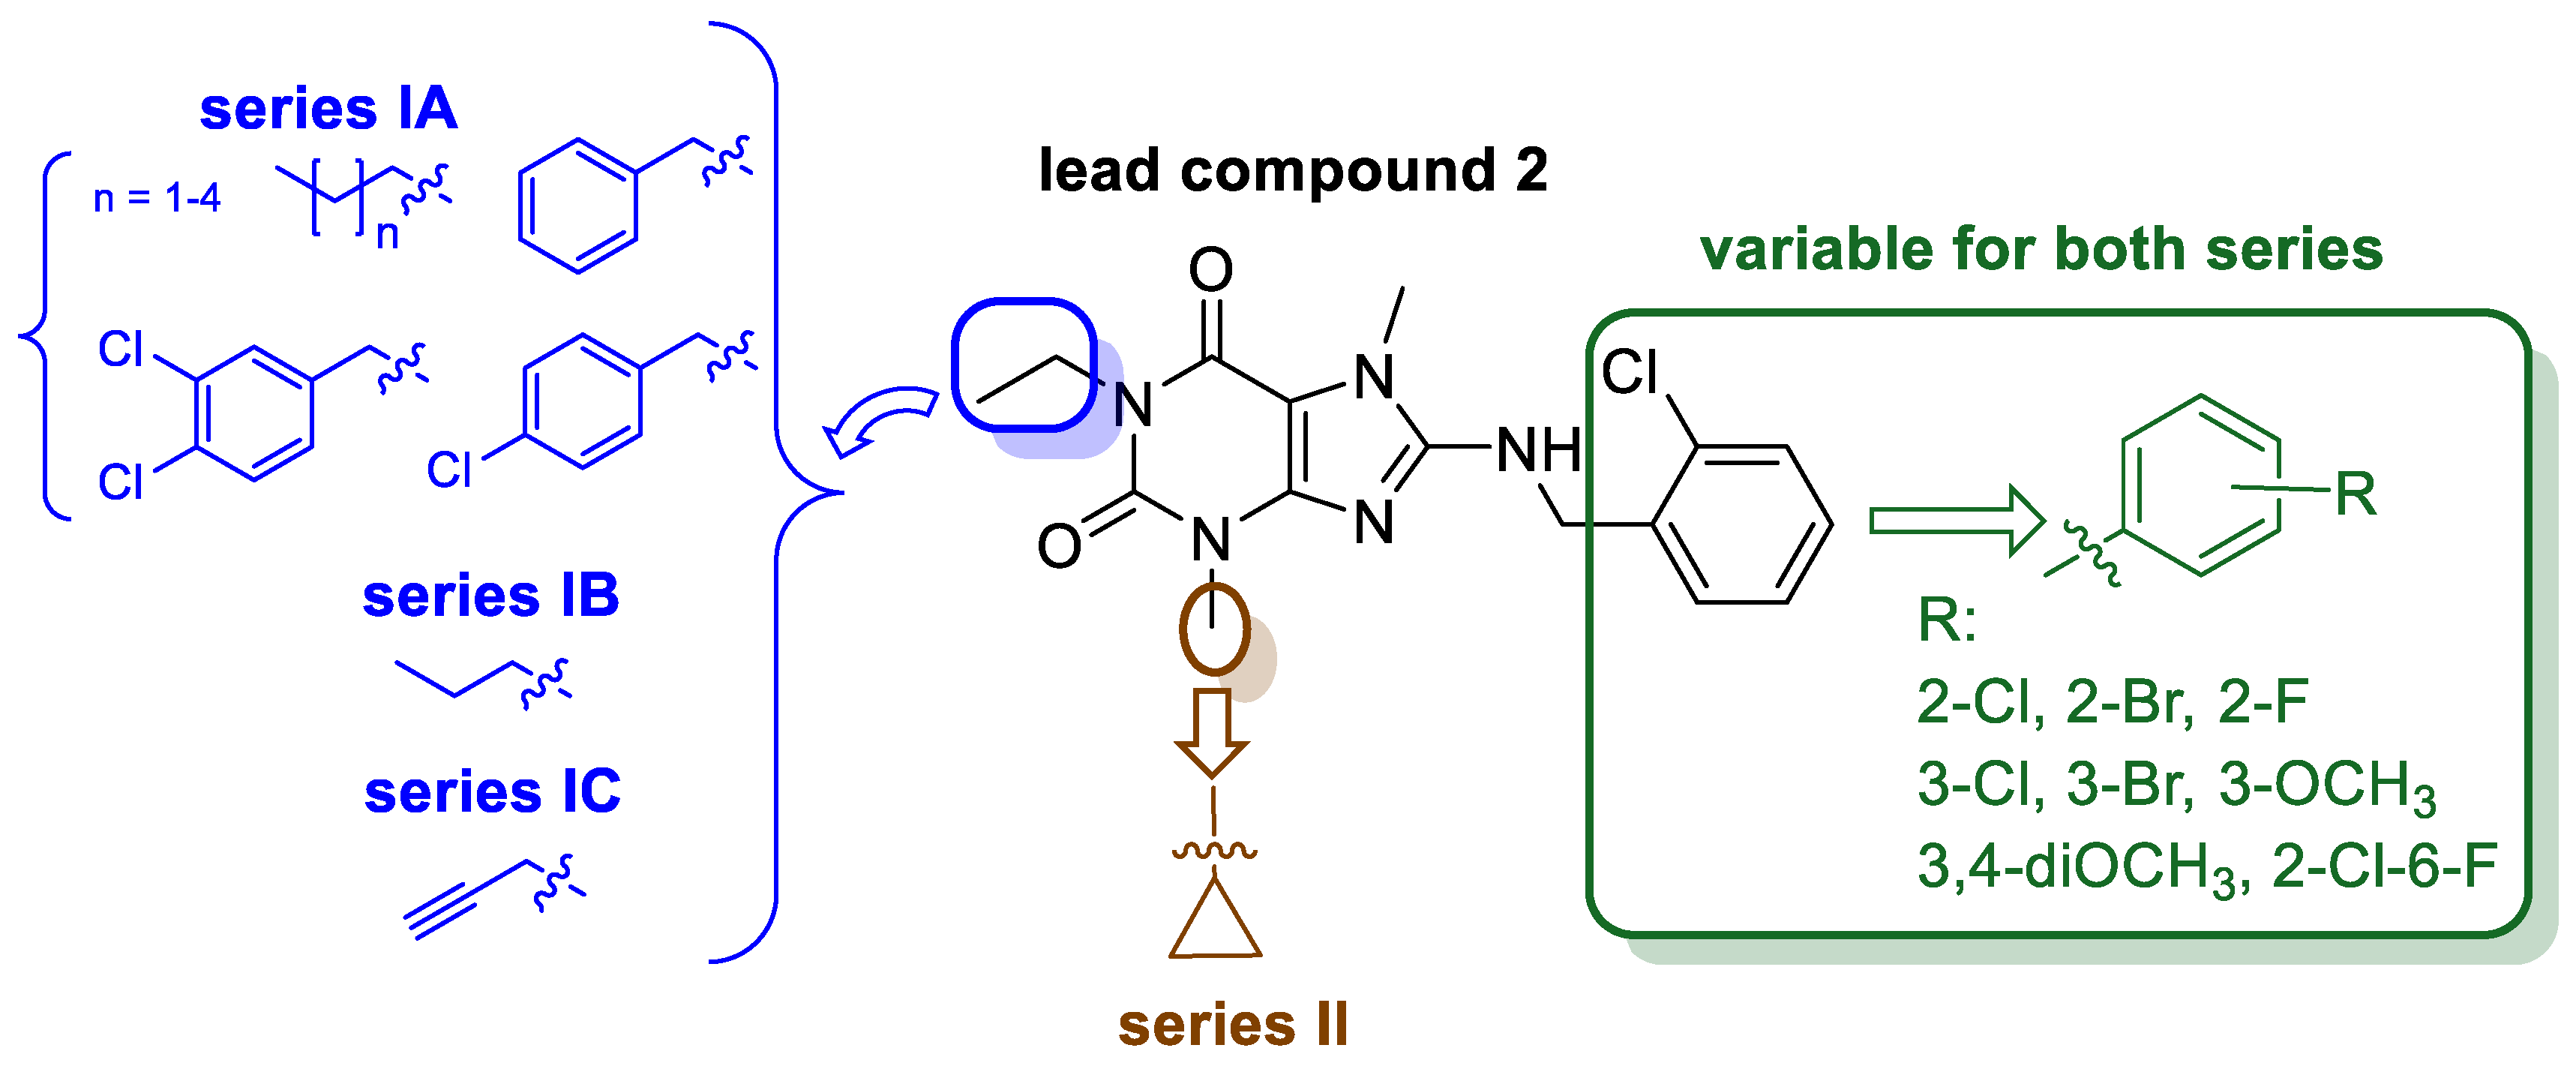
| Compound 2 (lead) |  | >1000 f (22 ± 1) | 71 ± 6 f | >1000 f (44 ± 10) | >1000 f (14 ± 1) |
| 5 |  | >1000 (26 ± 8) | 302 ± 34 | 832 ± 133 | >1000 (4 ± 4) |
| 6 |  | >1000 (21 ± 6) | 318 ± 141 | >1000 (32 ± 0) | >1000 (11 ± 2) |
| 7 |  | >1000 (35 ± 2) | >1000 (38 ± 4) | >1000 (41 ± 8) | >1000 (13 ± 3) |
| 8 | 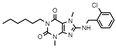 | >1000 (17 ± 6) | >1000 (9 ± 8) | >1000 (13 ± 5) | >1000 (31 ± 3) |
| 9 | 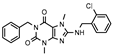 | >1000 (23 ± 5) | 323 ± 150 | >1000 (9 ± 1) | >1000 (24 ± 7) |
| 10 | 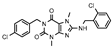 | >1000 (12 ± 1) | >1000 | >1000 (14 ± 11) | >1000 (31 ± 2) |
| 11 | 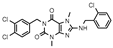 | >1000 (10 ± 2) | >1000 (23 ± 7) | >1000 (4 ± 7) | >1000 (40 ± 9) |
| Series IB—N1-propyl derivatives | |||||
| 12 | 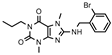 | >1000 (30 ± 1) | 361 ± 82 | >1000 (33 ± 10) | >1000 (8 ± 4) |
| 13 | 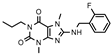 | >1000 (32 ± 4) | >1000 (47 ± 2) | >1000 (21 ± 11) | >1000 (6 ± 8) |
| 14 | 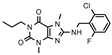 | >1000 (29 ± 10) | 124± 26 | 687 ± 147 | >1000 (18 ± 4) |
| 15 |  | >1000 (40 ± 3) | 588 ± 74 | >1000 (34 ± 8) | >1000 (0 ± 1) |
| 16 | 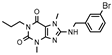 | 340 ± 73 | 254 ± 59 | >1000 (30 ± 1) | >1000 (11 ± 11) |
| 17 | 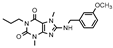 | >1000 (17 ± 2) | 605 ± 120 | >1000 (20 ± 1) | >1000 (6 ± 3) |
| 18 | 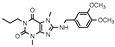 | >1000 (7 ± 12) | 773 ± 127 | >1000 (17 ± 9) | >1000 (−5 ± 10) |
| Series IC—N1-propargyl derivatives | |||||
| 19 (MZ-1483) |  | 407 ± 75 | 96 ± 31 | >1000 (14 ± 6) | >1000 (9 ± 1) |
| 20 | 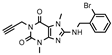 | >1000 (44 ± 5) | 137 ± 35 | >1000 (25 ± 10) | >1000 (13 ± 9) |
| 21 | 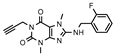 | 353 ± 42 | 287 ± 90 | >1000 (41 ± 3) | >1000 (21 ± 1) |
| 22 (MZ-1490) |  | 130 ± 34 | 62 ± 5 | >1000 (41 ± 6) | >1000 (21 ± 6) |
| 23 | 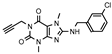 | 334 ± 122 | 126± 15 | >1000 (26 ± 2) | >1000 (14 ± 4) |
| 24 (MZ-1495) | 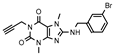 | 72 ± 8 | 77 ± 24 | >1000 (25 ± 8) | >1000 (7 ± 8) |
| 25 | 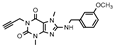 | 460 ± 99 | 225 ± 40 | >1000 (35 ± 9) | >1000 (0 ± 2) |
| 26 | 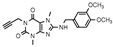 | >1000 (−2 ± 7) | 108 ± 22 | >1000 (28 ± 6) | >1000 (2 ± 0) |
| Series II—N1-propargyl-N3-cyclopropyl derivatives | |||||
| 27 | 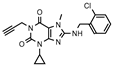 | 247 ± 43 | 311 ± 167 | >1000 (9 ± 1) | >1000 (16 ± 2) |
| 28 | 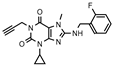 | 166 ± 65 | 386 ± 61 | >1000 (14 ± 4) | >1000 (−2 ± 6) |
| 29 | 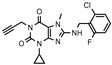 | 78 ± 9 | 204 ± 38 | >1000 (16 ± 3) | >1000 (16 ± 1) |
| Compound | % of hMAO B Inhibition at 1 µM a | Compound | % of hMAO B Inhibition at 1 µM a |
|---|---|---|---|
| 5 | 8 | 19 | 6 |
| 12 | 7 | 20 | 32 |
| 13 | 15 | 21 | 8 |
| 14 | 9 | 22 | 7 |
| 15 | 10 | 23 | 8 |
| 16 | 11 | 24 | 10 |
| 17 | 5 | 25 | 11 |
| 18 | 2 | 26 | 3 |
| Drug | % Remaining in the Reaction Mixture a | Molecular Mass (m/z) | Molecular Mass of the Metabolite (m/z)/ Retention Time (min) | Metabolic Pathway |
|---|---|---|---|---|
| 19 | >95 | 358.16 | 249.07/ 6.27 (M1) | fragmentation and hydroxylation |
| 234.16/ 3.59 (M2) | fragmentation, demethylation and hydroxylation | |||
| 22 | >90 | 376.12 | 249.53/ 6.26 (M1) | fragmentation, and hydroxylation |
| 24 | >95 | 402.13 | 249.13/ 6.26 (M1) | fragmentation, and hydroxylation |
| Verapamil b | 31 | 455.31 | 441.35/ 4.95 (M1) | demethylation |
| 291.32/ 4.00 (M2) | fragmentation | |||
| 165.09/ 3.38 (M3) | fragmentation | |||
| 441.29/ 4.62 (M4) | demethylation | |||
| 427.33/4.54 (M5) | double-demethylation | |||
| 277.26/ 3.92 (M6) | fragmentation |
| Compound | a,b Pe (10−6 cm/s) ± SD | Permeable | Drug Retention (%) |
|---|---|---|---|
| Caffeine | 6.57 ± 1.57 | yes | 29.46 |
| 19 | 3.13 ± 0.82 | yes | 51.78 |
| 22 | 0.37 ± 0.01 | no | 68.62 |
| 24 | 0.89 ± 0.71 | no | 93.30 |
| Treatment | Dose (mg/kg) | Change in Edema Volume [mL] | ||
|---|---|---|---|---|
| 1 h | 2 h | 3 h | ||
| Control | 0.78 ± 0.03 | 1.12 ± 0.13 | 1.33 ± 0.13 | |
| 19 | 20 | 0.56 ± 0.13 | 0.72 ± 0.09 | 1.10 ± 0.21 |
| 22 | 20 | 0.49 ± 0.08 | 0.91 ± 0.05 | 0.92 ± 0.06 |
| 24 | 20 | 0.38 ± 0.02 a | 0.63 ± 0.14 a | 0.69 ± 0.01 b |
| ketoprofen | 20 | 0.32 ± 0.03 a | 0.41 ± 0.04 a | 0.43 ± 0.03 b |
| Treatment | Dose (mg/kg) | Licking of the Hind Paw (sec) | |||
|---|---|---|---|---|---|
| Early Phase (0–5 min) | Inhibition (%) | Late Phase (15–30 min) | Inhibition (%) | ||
| Mean ± SEM | Mean ± SEM | ||||
| Control | 41.6 ± 15.2 | - | 119.4 ± 32.8 | - | |
| 19 | 40 | 42.6 ± 2.8 | 0 | 63.0 ± 6.6 b | 47.2 |
| 20 | 48.2 ± 10.0 | 0 | 76.8 ± 26.4 | 35.7 | |
| 10 | 41.8 ± 5.5 | 23.1 | 88.4 ± 5.6 | 26.0 | |
| 22 | 40 | 39.2 ± 1.3 | 5.8 | 62.0 ± 5.2 b | 48.0 |
| 20 | 41.0 ± 8.6 | 0 | 78.2 ± 20.3 | 0 | |
| 10 | 41.6 ± 5.4 | 0 | 92.2 ± 6.5 | 22.8 | |
| 24 | 40 | 30.8 ± 6.7 | 26.0 | 12.2 ± 3.3 d | 89.7 |
| 20 | 31.4 ± 5.0 | 24.5 | 20.4 ± 10.6 d | 82.9 | |
| 10 | 43.2 ± 6.6 | 0 | 61.2 ± 6.4 b | 48.7 | |
| Control | 63.8 ± 2.0 | - | 120.8 ± 3.4 | - | |
| ASA | 200 | 62.0 ± 8.6 | 9.2 | 40.6 ± 14.0 c | 66.3 |
| 100 | 58.5 ± 4.5 | 14.3 | 60.3 ± 9.5 c | 50.0 | |
| 50 | 59.8 ± 6.3 | 12.4 | 108.7 ± 13.8 | 10.0 | |
Disclaimer/Publisher’s Note: The statements, opinions and data contained in all publications are solely those of the individual author(s) and contributor(s) and not of MDPI and/or the editor(s). MDPI and/or the editor(s) disclaim responsibility for any injury to people or property resulting from any ideas, methods, instructions or products referred to in the content. |
© 2023 by the authors. Licensee MDPI, Basel, Switzerland. This article is an open access article distributed under the terms and conditions of the Creative Commons Attribution (CC BY) license (https://creativecommons.org/licenses/by/4.0/).
Share and Cite
Załuski, M.; Łażewska, D.; Jaśko, P.; Honkisz-Orzechowska, E.; Kuder, K.J.; Brockmann, A.; Latacz, G.; Zygmunt, M.; Kaleta, M.; Greser, B.A.; et al. Anti-Inflammatory Activities of 8-Benzylaminoxanthines Showing High Adenosine A2A and Dual A1/A2A Receptor Affinity. Int. J. Mol. Sci. 2023, 24, 13707. https://doi.org/10.3390/ijms241813707
Załuski M, Łażewska D, Jaśko P, Honkisz-Orzechowska E, Kuder KJ, Brockmann A, Latacz G, Zygmunt M, Kaleta M, Greser BA, et al. Anti-Inflammatory Activities of 8-Benzylaminoxanthines Showing High Adenosine A2A and Dual A1/A2A Receptor Affinity. International Journal of Molecular Sciences. 2023; 24(18):13707. https://doi.org/10.3390/ijms241813707
Chicago/Turabian StyleZałuski, Michał, Dorota Łażewska, Piotr Jaśko, Ewelina Honkisz-Orzechowska, Kamil J. Kuder, Andreas Brockmann, Gniewomir Latacz, Małgorzata Zygmunt, Maria Kaleta, Beril Anita Greser, and et al. 2023. "Anti-Inflammatory Activities of 8-Benzylaminoxanthines Showing High Adenosine A2A and Dual A1/A2A Receptor Affinity" International Journal of Molecular Sciences 24, no. 18: 13707. https://doi.org/10.3390/ijms241813707