
Cheminformatics and Machine Learning Approaches to Assess Aquatic Toxicity Profiles of Fullerene Derivatives
 ,
,  ,
,  , , and
Abstract
:1. Introduction
2. Results and Discussions
2.1. The Modeling Plan Carried Out in the Study
2.2. ALL_CPANN Model Based on Twenty-Eight Descriptors
2.3. Investigation of the Relationship between the Studied Binding Activities in Regression and ANN Models
2.4. Investigating the Relationship between Considered Binding Affinities and Descriptors in Regression and ANN Models
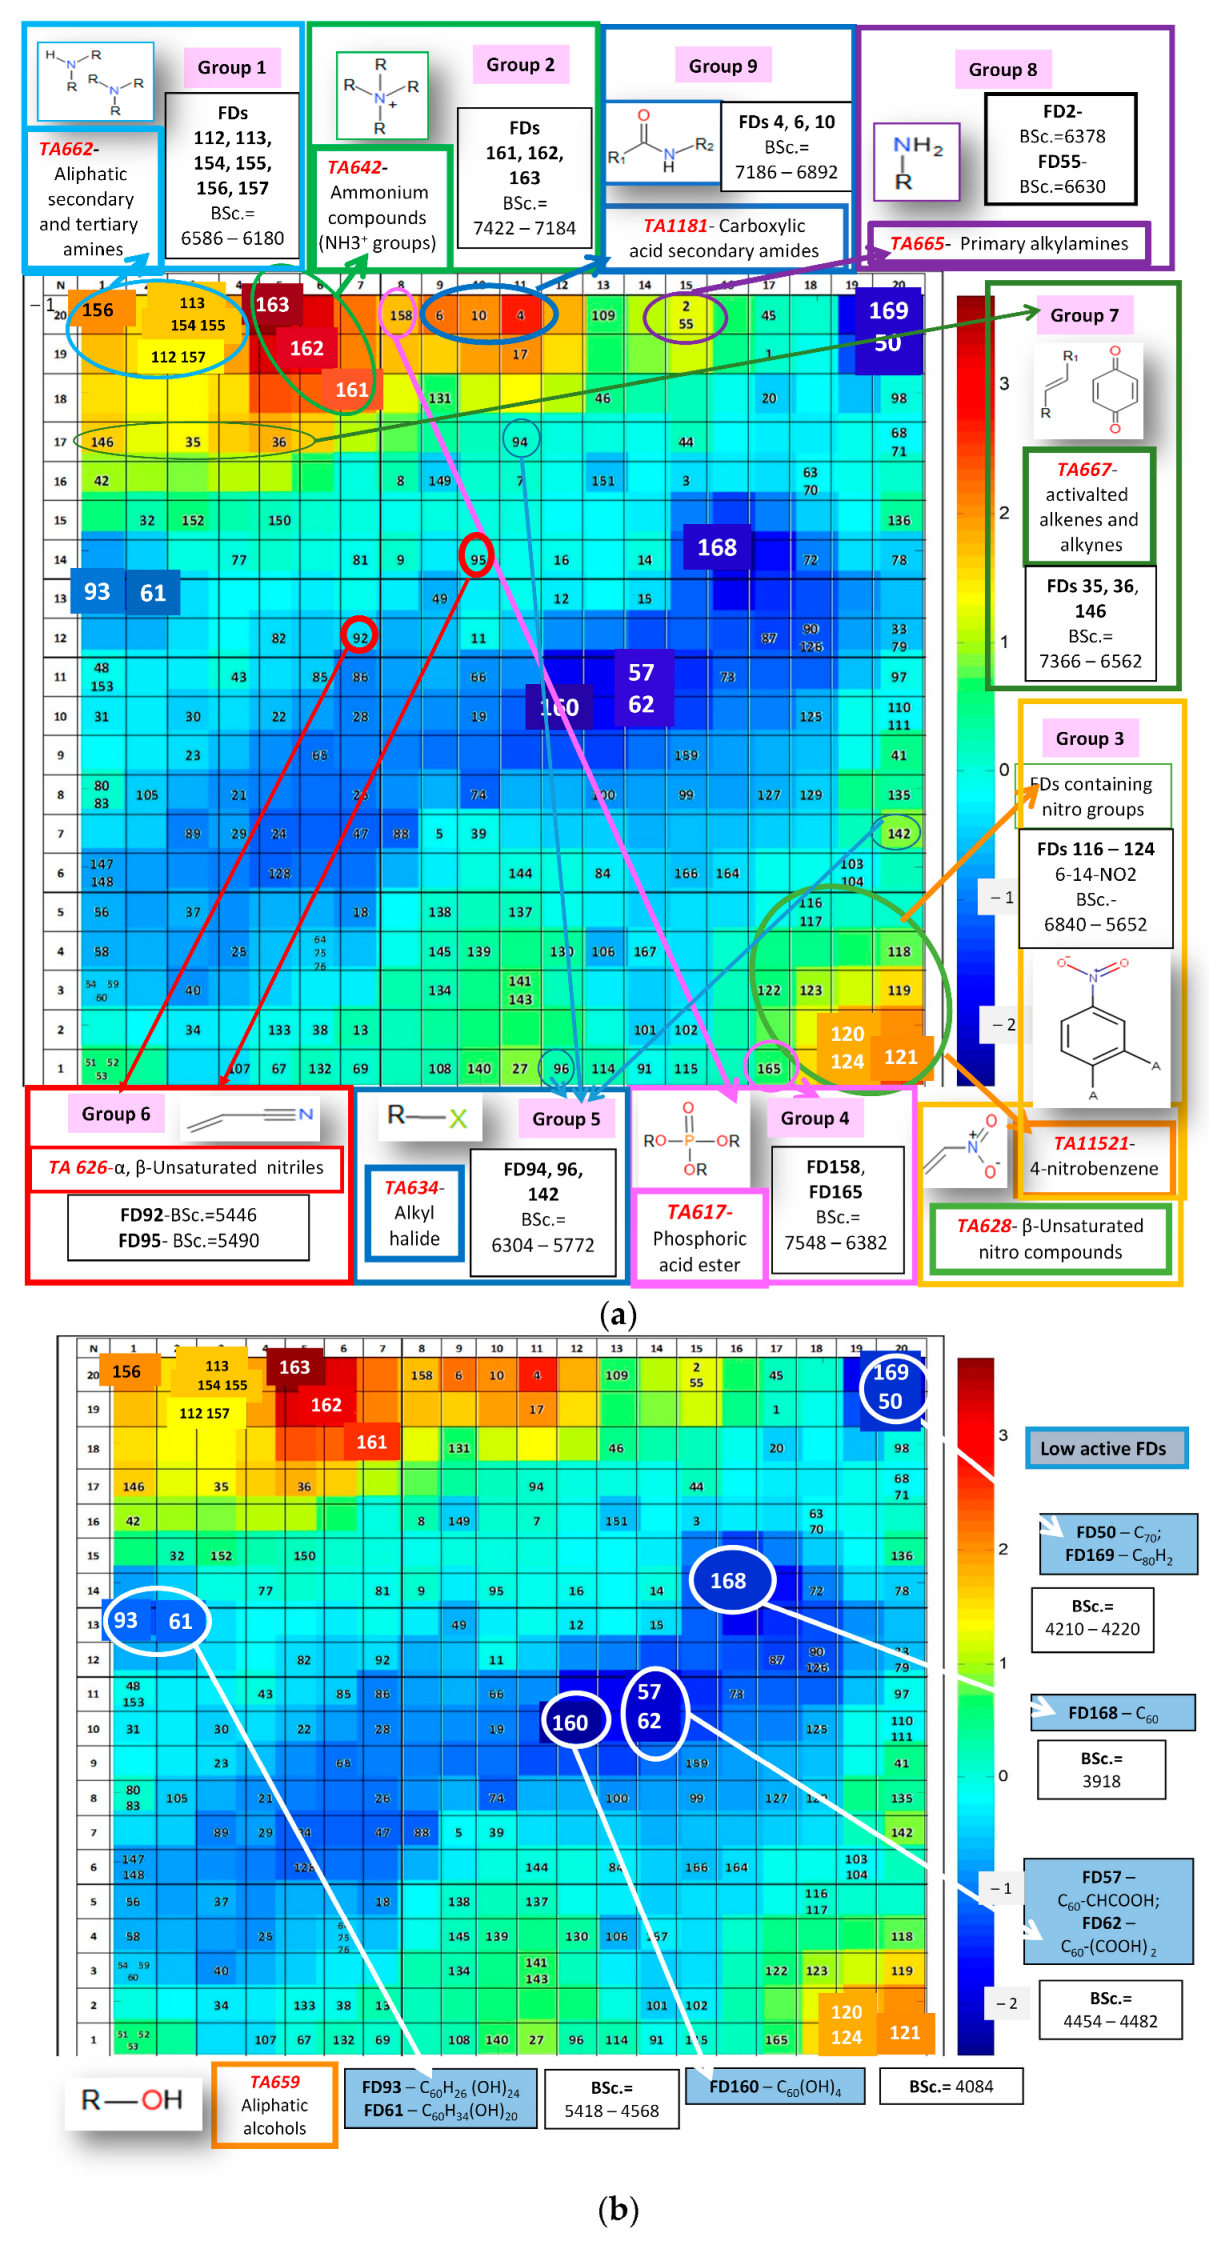
2.5. Application of CPANN Tools to Analyze the Most and Least Active FDs Based on Structural Alerts
2.6. Regression Models for Predicting Binding Affinities Using Descriptors QPpolrz and TD (Regression Model 1) and Optimal Descriptors DCW (Regression Model 2)
2.7. CPANN Models for Predicting Binding Affinities Using the Descriptors QPpolrz and TD (CPANN Model 1) and the Optimal Descriptors DCW (CPANN Model 2)
3. Materials and Methods
3.1. Dataset
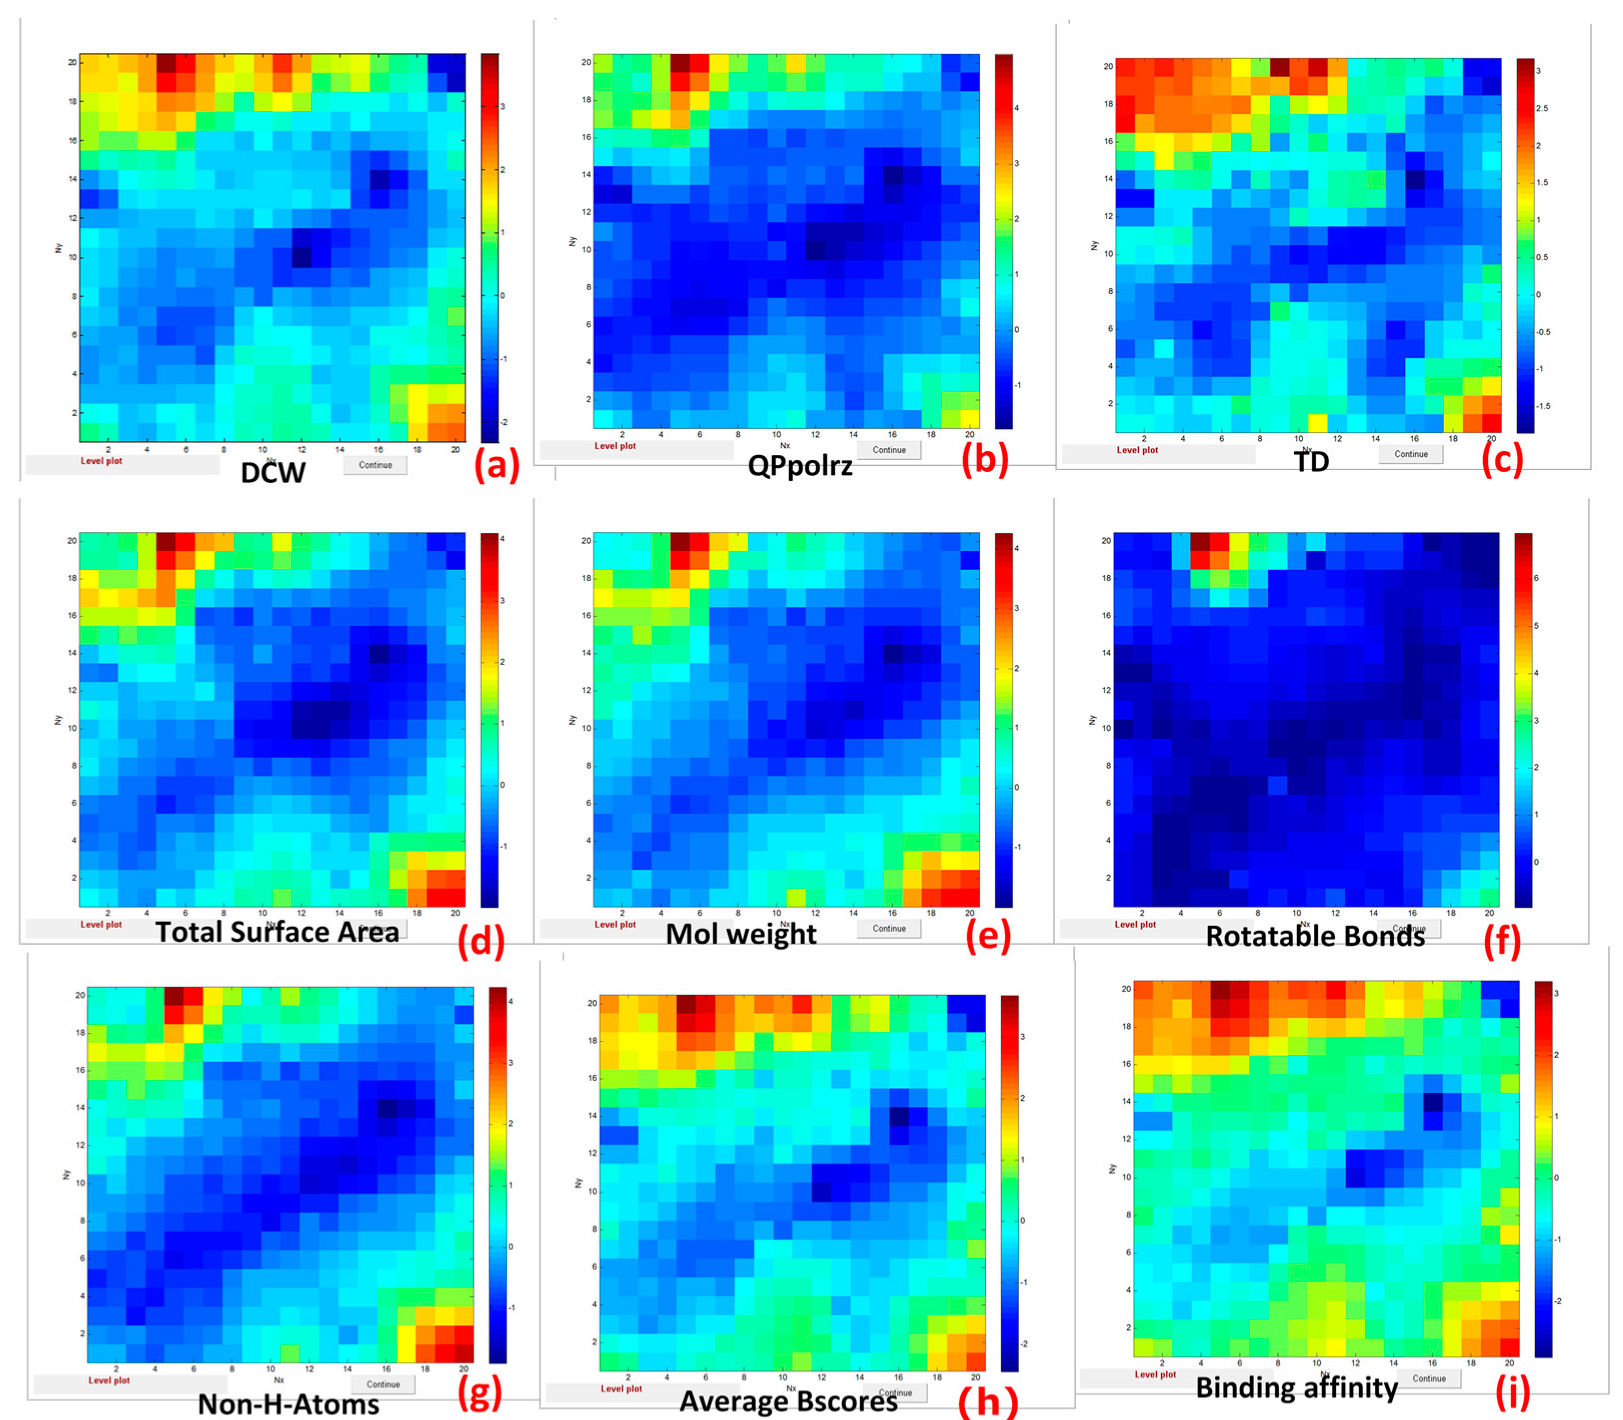
3.2. Descriptors Used in the Study
3.3. Characterization of the Parameter Referred to in the Study as Binding Affinity and How It Was Calculated
3.4. Regression Analysis
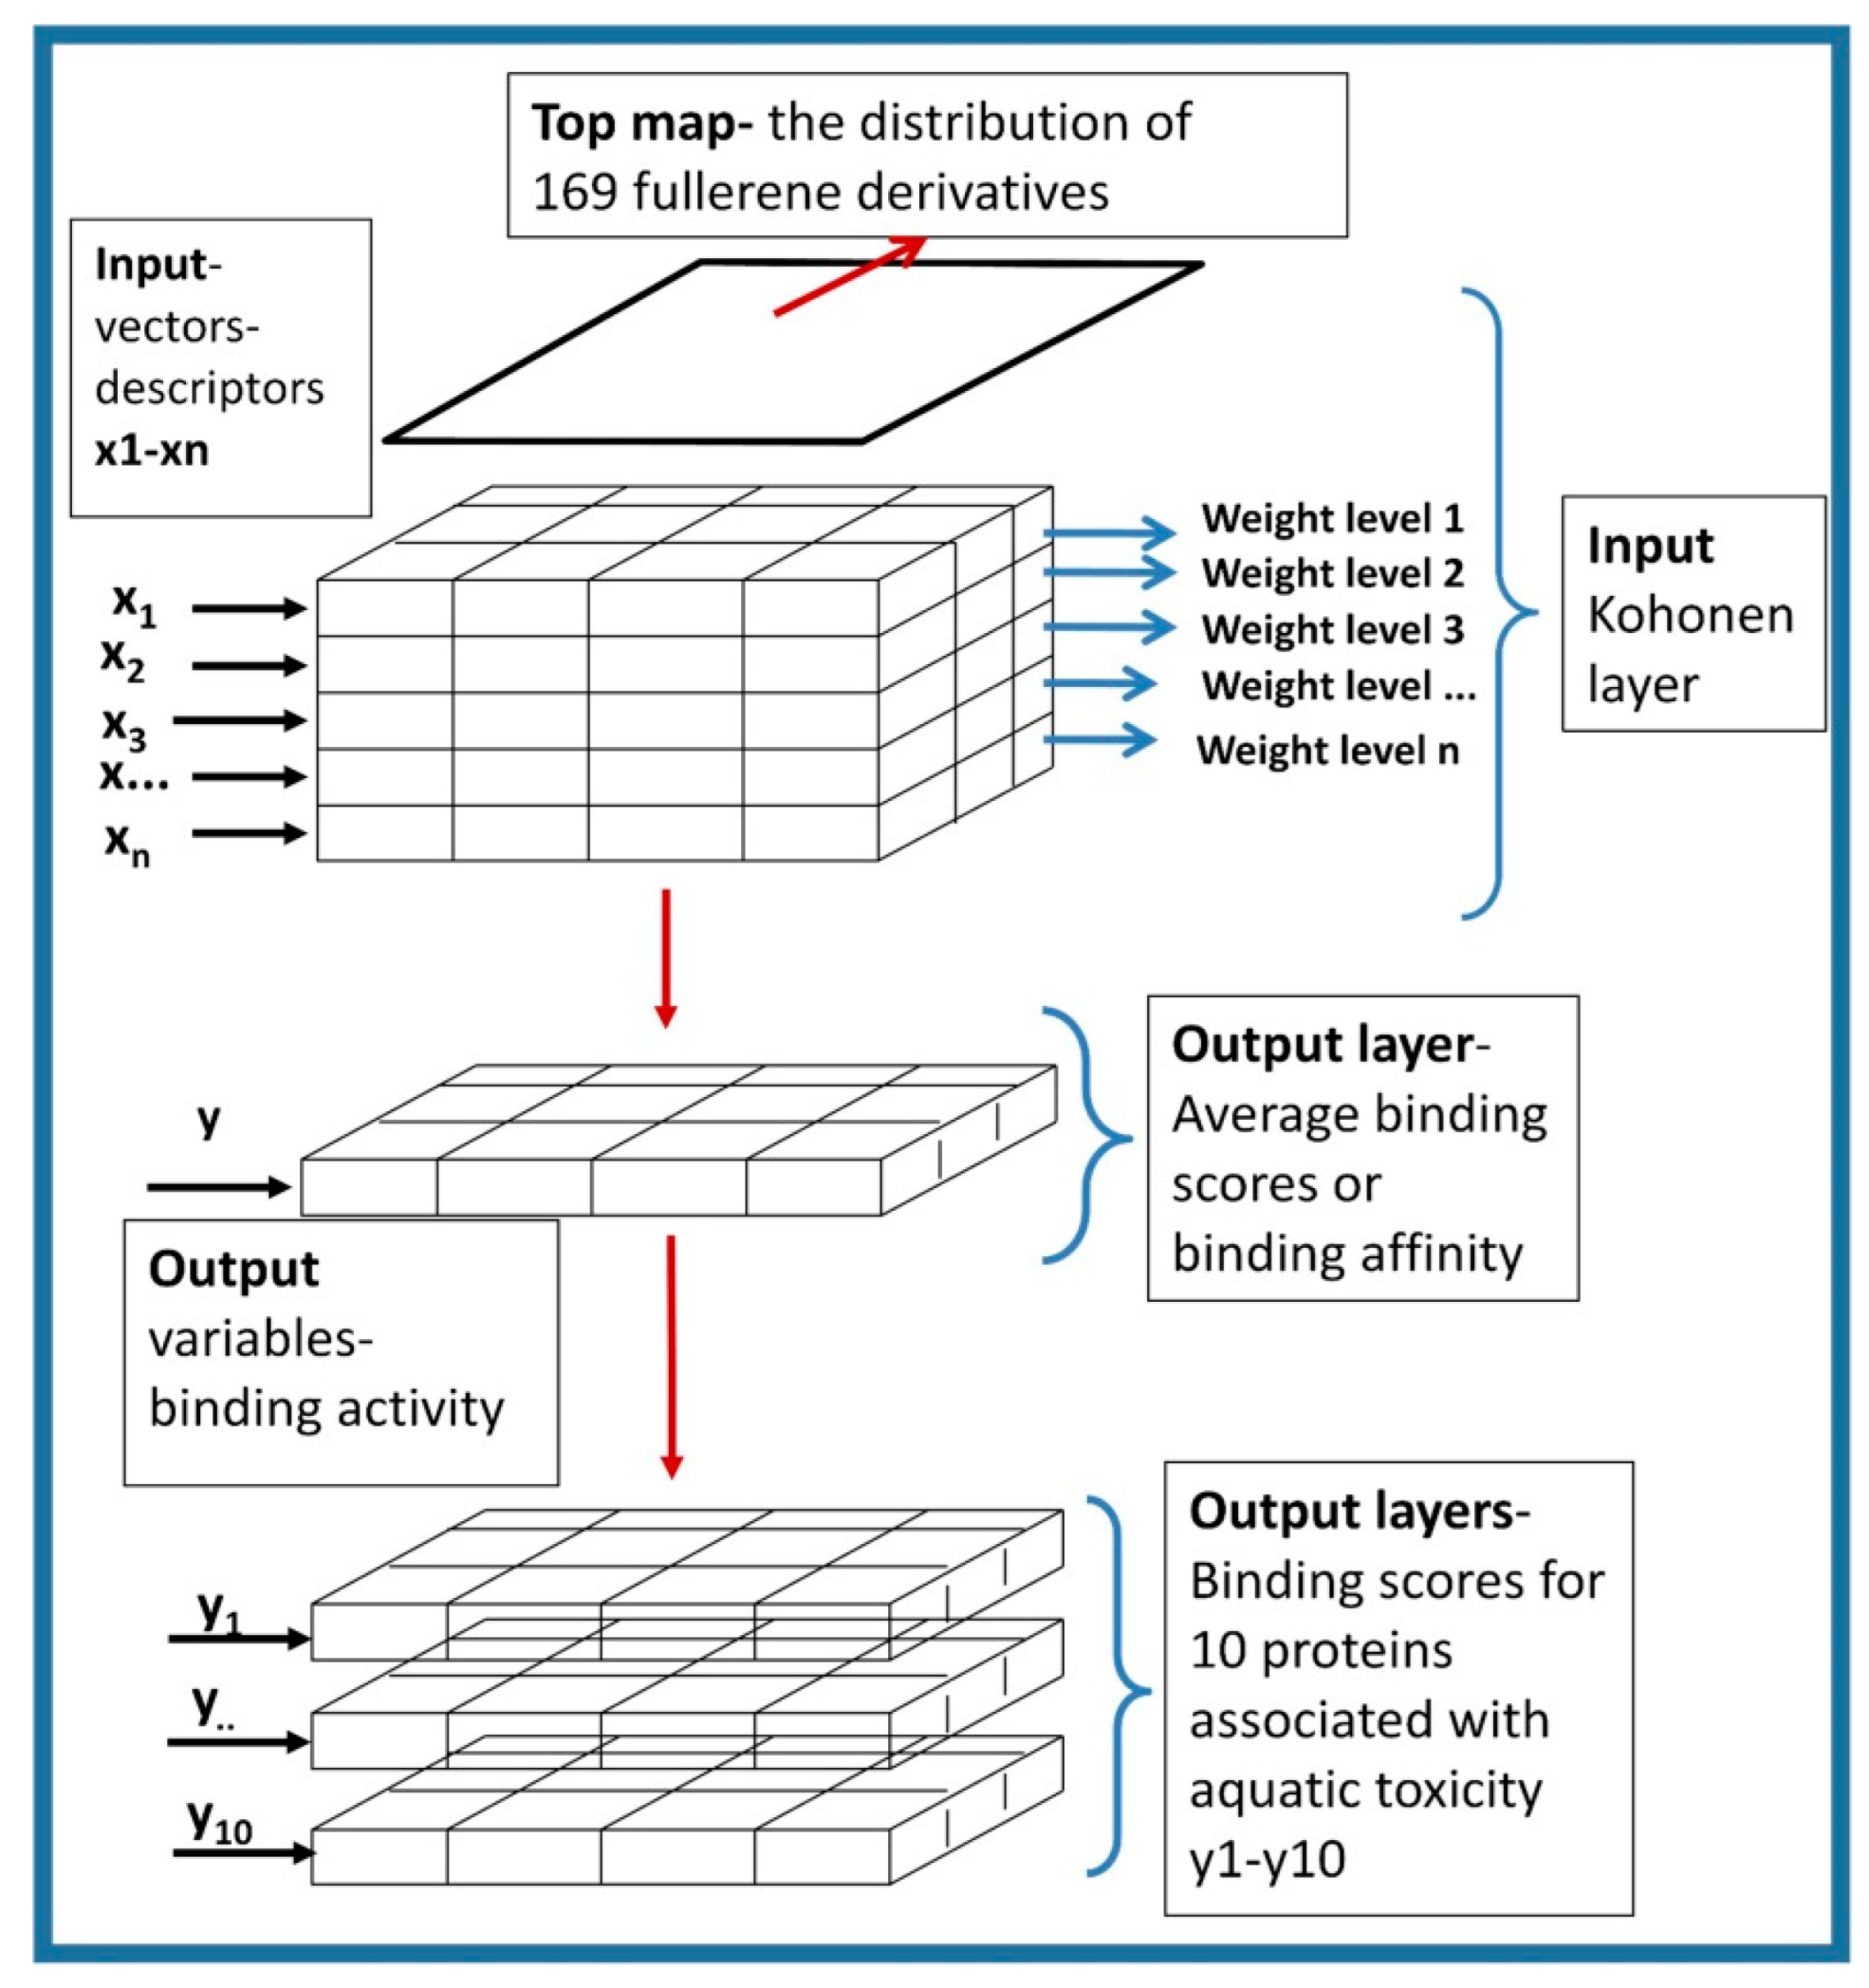
3.5. The Counter-Propagation Artificial Neural Network (CPANN) Algorithm and Self-Organizing Kohonen Maps
3.6. The ToxAlerts Web Server for Aquatic Toxicity SA Selection
4. Conclusions
- Topological diameter (TD) and Molecular Weight (MW) characterizing the size of FD molecules;
- Total Surface Area (TSA) affecting interaction with the environment;
- Polarizability volume in cubic Angstroms (QPpolrz) related to electric charge and affecting the strength of interaction with proteins;
- Rotatable Bonds that affect pharmacodynamics events, resulting from interactions with biological targets such as receptors, enzymes, ion channels, nucleic acids, etc.
Supplementary Materials
Author Contributions
Funding
Institutional Review Board Statement
Informed Consent Statement
Data Availability Statement
Acknowledgments
Conflicts of Interest
References
- Taylor, R.; Walton, D.R. The chemistry of fullerenes. Nature 1993, 363, 685–693. [Google Scholar] [CrossRef]
- Freixa, A.; Acuña, V.; Sanchís, J.; Farré, M.; Barceló, D.; Sabater, S. Ecotoxicological effects of carbon based nanomaterials in aquatic organisms. Sci. Total Environ. 2018, 619, 328–337. [Google Scholar] [CrossRef] [PubMed]
- Aydın, A.; Sipahi, H.; Charehsaz, M. Nanoparticles Toxicity and Their Routes of Exposures. In Recent Advances in Novel Drug Carrier Systems; Sezer, A.D., Ed.; IntechOpen: London, UK, 2012; pp. 483–500. [Google Scholar] [CrossRef]
- Chauhan, A.K.; Jha, P.; Aswal, D.K.; Yakhmi, J.V. Organic Devices: Fabrication, Applications, and Challenges. J. Electron. Mater. 2022, 51, 447–485. [Google Scholar] [CrossRef]
- Mousavi, S.Z.; Nafisi, S.; Maibach, H.I. Fullerene nanoparticle in dermatological and cosmetic applications. Nanomedicine 2017, 13, 1071–1087. [Google Scholar] [CrossRef]
- Aschberger, K.; Johnston, H.J.; Stone, V.; Aitken, R.J.; Tran, C.L.; Hankin, S.M.; Peters, S.A.; Christensen, F.M. Review of fullerene toxicity and exposure–appraisal of a human health risk assessment, based on open literature. Regul. Toxicol. Pharmacol. 2010, 58, 455–473. [Google Scholar] [CrossRef]
- Yang, J.; Zhong, W.; Chen, P.; Zhang, Y.; Sun, B.; Liu, M.; Zhu, Y.; Zhu, L. Graphene oxide mitigates endocrine disruption effects of bisphenol A on zebrafish at an early development stage. Sci. Total Environ. 2019, 697, 134158. [Google Scholar] [CrossRef]
- Chen, M.; Zhou, S.; Guo, L.; Wang, L.; Yao, F.; Hu, Y.; Li, H.; Hao, J. Aggregation behavior and antioxidant properties of amphiphilic fullerene C60 derivatives cofunctionalized with cationic and nonionic hydrophilic groups. Langmuir 2019, 35, 6939–6949. [Google Scholar] [CrossRef]
- Lalwani, G.; Sitharaman, B.J. Multifunctional fullerene and metallofullerene based nanobiomaterials. Nano Life 2013, 3, 1342003. [Google Scholar] [CrossRef]
- Sharoyko, V.V.; Shemchuk, O.S.; Meshcheriakov, A.A.; Vasina, L.V.; Iamalova, N.R.; Luttsev, M.D.; Ivanova, D.A.; Petrov, A.V.; Maystrenko, D.N.; Molchanov, O.E.; et al. Biocompatibility, antioxidant activity and collagen photoprotection properties of C-60 fullerene adduct with L-methionine. Nanomed. Nanotechnol. Biol. Med. 2022, 40, 102500. [Google Scholar] [CrossRef]
- Tzirakis, D.M.; Orfanopoulos, M. Radical Reactions of Fullerenes: From Synthetic Organic Chemistry to Materials Science and Biology. Chem. Rev. 2013, 113, 5262–5321. [Google Scholar] [CrossRef]
- Shoji, M.; Takahashi, E.; Hatakeyama, D.; Iwai, Y.; Morita, Y.; Shirayama, R.; Echigo, N.; Kido, H.; Nakamura, S.; Mashino, T.; et al. Anti-influenza activity of c60 fullerene derivatives. PLoS ONE 2013, 8, e66337. [Google Scholar] [CrossRef]
- Heredia, D.A.; Durantini, A.M.; Durantini, J.E.; Durantini, E.N. Fullerene C60 derivatives as antimicrobial photodynamic agents. J. Photochem. Photobiol. C Photochem. Rev. 2021, 51, 100471. [Google Scholar] [CrossRef]
- Friedman, S.H.; DeCamp, D.L.; Sijbesma, R.P.; Srdanov, G.; Wudl, F.; Kenyon, G.L. Inhibition of the HIV-1 protease by fullerene derivatives: Model building studies and experimental verification. J. Am. Chem. Soc. 1993, 115, 6506–6509. [Google Scholar] [CrossRef]
- Youssef, Z.; Vanderesse, R.; Colombeau, L.; Baros, F.; Roques-Carmes, T.; Frochot, C.; Wahab, H.; Toufaily, J.; Hamieh, T.; Acherar, S.; et al. The application of titanium dioxide, zinc oxide, fullerene, and graphene nanoparticles in photodynamic therapy. Cancer Nanotechnol. 2017, 8, 6. [Google Scholar] [CrossRef]
- Zhang, Q.; Wu, Z.; Li, N.; Pu, Y.; Wang, B.; Zhang, T.; Tao, J. Advanced review of graphene-based nanomaterials in drug delivery systems: Synthesis, modification, toxicity and application. Mater. Sci. Eng. C 2017, 77, 1363–1375. [Google Scholar] [CrossRef]
- Indeglia, P.A.; Georgieva, A.T.; Krishna, V.B.; Martyniuk, C.J.; Bonzongo, J.C.J. Toxicity of functionalized fullerene and fullerene synthesis chemicals. Chemosphere 2018, 207, 1–9. [Google Scholar] [CrossRef]
- Kar, S.; Leszczynski, J. QSAR and machine learning modeling of toxicity of nanomaterials: A risk assessment approach. In Health and Environmental Safety of Nanomaterials: Polymer Nanocomposites and Other Materials Containing Nanoparticles; Njuguna, J., Pielichowski, K., Zhu, H., Eds.; Woodhead Publishing: Sawston, UK, 2021; pp. 417–441. [Google Scholar] [CrossRef]
- Chen, M.; Sun, Y.; Liang, J.; Zeng, G.; Li, Z.; Tang, L.; Zhu, Y.; Jiang, D.; Song, B. Understanding the influence of carbon nanomaterials on microbial communities. Environ. Int. 2019, 126, 690–698. [Google Scholar] [CrossRef] [PubMed]
- Oberdörster, E.; Zhu, S.; Blickley, T.M.; McClellan-Green, P.; Haasch, M.L. Ecotoxicology of carbon-based engineered nanoparticles: Effects of fullerene (C60) on aquatic organisms. Carbon 2006, 44, 1112–1120. [Google Scholar] [CrossRef]
- Sumi, N.; Chitra, K.C. Fullerene C60 nanomaterial induced oxidative imbalance in gonads of the freshwater fish, Anabas testudineus (Bloch, 1792). Aquat. Toxicol. 2019, 210, 196–206. [Google Scholar] [CrossRef]
- Ferreira, J.L.R.; Barros, D.M.; Geracitano, L.A.; Fielmann, G.; Fossa, C.E.; de Almeida, E.A.; de Castro Prado, M.; Neves, B.R.A.; Pinheiro, M.V.B.; Monserrat, J.M. In vitro exposure to fullerene C60 influences redox state and lipid peroxidation in brain and gills from Cyprinus carpio (Cyprinidae). Environ. Toxicol. Chem. 2012, 31, 961–967. [Google Scholar] [CrossRef] [PubMed]
- Souza, J.P.; Baretta, J.F.; Santos, F.; Paino, I.M.M.; Zucolotto, V. Toxicological effects of graphene oxide on adult zebrafish (Danio rerio). Aquat. Toxicol. 2017, 186, 11–18. [Google Scholar] [CrossRef] [PubMed]
- Zhu, X.; Zhu, L.; Lang, Y.; Chen, Y. Oxidative stress and growth inhibition in the freshwater fish Carassius auratus induced by chronic exposure to sublethal fullerene aggregates. Environ. Toxicol. Chem. 2008, 27, 1979–1985. [Google Scholar] [CrossRef] [PubMed]
- Blickley, T.M.; McClellan-Green, P. Toxicity of aqueous fullerene in adult and larval Fundulus heteroclitus. Environ. Toxicol. Chem. Int. J. 2008, 27, 1964–1971. [Google Scholar] [CrossRef]
- Henry, T.B.; Petersen, E.J.; Compton, R.N. Aqueous fullerene aggregates (nC60) generate minimal reactive oxygen species and are of low toxicity in fish: A revision of previous reports. Curr. Opin. Biotechnol. 2011, 22, 533–537. [Google Scholar] [CrossRef] [PubMed]
- da Rosa, P.C.C.; Leão, M.B.; Dalla Corte, C.L.; de Matos, C.F. Evaluation of the Carbon Nanostructures Toxicity as a Function of Their Dimensionality Using Model Organisms: A Review. Water Air Soil Pollut. 2021, 232, 367. [Google Scholar] [CrossRef]
- McRobb, F.M.; Sahagun, V.; Kufareva, I.; Abagyan, R. In Silico Analysis of the Conservation of Human Toxicity and Endocrine Disruption Targets in Aquatic Species. Environ. Sci. Technol. 2014, 48, 1964–1972. [Google Scholar] [CrossRef] [PubMed]
- Prior, H.; Haworth, R.; Labram, B.; Roberts, R.; Wolfreys, A.; Sewell, F. Justification for species selection for pharmaceutical toxicity studies. Toxicol. Res. 2020, 9, 758–770. [Google Scholar] [CrossRef]
- OECD. Test Guideline No. 203: Fish, Acute Toxicity Test-ing. In OECD Test Guidelines for the Testing of Chemicals; Section 2; OECD Publishing: Paris, France, 2019. [Google Scholar]
- Margiotta-Casaluci, L.; Owen, S.F.; Cumming, R.I.; de Polo, A.; Winter, M.J.; Panter, G.H.; Rand-Weaver, M.; Sumpter, J.P. Quantitative cross-species extrapolation between humans and fish: The case of the anti-depressant fluoxetine. PLoS ONE 2014, 9, e110467. [Google Scholar] [CrossRef]
- Madia, F.; Corvi, R.; Worth, A.; Matys, I.; Prieto, P. Making better use of toxicity studies for human health by extrapolating across endpoints. ALTEX-Altern. Anim. Ex. 2020, 37, 519–531. [Google Scholar] [CrossRef]
- Saçan, M.T.; Özkul, M.; Erdem, S.S. QSPR analysis of the toxicity of aromatic compounds to the algae (Scenedesmus obliquus). Chemosphere 2007, 68, 695–702. [Google Scholar] [CrossRef]
- Tugcu, G.; Yilmaz, H.B.; Sacan, M.T. Comparative performance of descriptors in a multiple linear and Kriging models: A case study on the acute toxicity of organic chemicals to algae. Environ. Sci. Pollut. Res. 2014, 21, 11924–11932. [Google Scholar] [CrossRef] [PubMed]
- Onlu, S.; Sacan, M.T. An in Silico Algal Toxicity Model with a Wide Applicability Potential for Industrial Chemicals and Pharmaceuticals. Environ. Toxicol. Chem. 2017, 36, 1012–1019. [Google Scholar] [CrossRef] [PubMed]
- Onlu, S.; Sacan, M.T. An in Silico Approach to Cytotoxicity of Pharmaceuticals and Personal Care Products on the Rainbow Trout Liver Cell Line Rtl-W1. Environ. Toxicol. Chem. 2017, 36, 1162–1169. [Google Scholar] [CrossRef]
- Tugcu, G.; Saçan, M.T. A multipronged QSAR approach to predict algal low-toxic-effect concentrations of substituted phenols and anilines. J. Hazard. Mater. 2018, 344, 893–901. [Google Scholar] [CrossRef]
- Kahraman, E.N.; Saçan, M.T. On the prediction of cytotoxicity of diverse chemicals for topminnow (Poeciliopsis lucida) hepatoma cell line, PLHC-1. SAR QSAR Environ. Res. 2018, 29, 675–691. [Google Scholar] [CrossRef]
- Kahraman, E.N.; Saçan, M.T. Predicting Cytotoxicity and Enzymatic Activity of Diverse Chemicals Using Goldfish Scale Tissue and Topminnow Hepatoma Cell Line-based Data. Mol. Inform. 2019, 38, 1800127. [Google Scholar] [CrossRef]
- Tugcu, G.; Saçan, M.T.; Vracko, M.; Novic, M.; Minovski, N. QSTR modelling of the acute toxicity of pharmaceuticals to fish. SAR QSAR Environ. Res. 2012, 23, 297–310. [Google Scholar] [CrossRef] [PubMed]
- Onlu, S.; Saçan, M.T. Toxicity of contaminants of emerging concern to Dugesia japonica: QSTR modeling and toxicity relationship with Daphnia magna. J. Hazard. Mater. 2018, 351, 20–28. [Google Scholar] [CrossRef]
- Chatterjee, M.; Roy, K. Prediction of aquatic toxicity of chemical mixtures by the QSAR approach using 2D structural descriptors. J. Hazard. Mater. 2021, 408, 124936. [Google Scholar] [CrossRef]
- Gajewicz-Skretna, A.; Furuhama, A.; Yamamoto, H.; Suzuki, N. Generating accurate in silico predictions of acute aquatic toxicity for a range of organic chemicals: Towards similarity-based machine learning methods. Chemosphere 2021, 280, 130681. [Google Scholar] [CrossRef]
- Chicu, S.A.; Putz, M.V. Köln-Timişoara Molecular Activity Combined Models toward Interspecies Toxicity Assessment. Int. J. Mol. Sci. 2009, 10, 4474–4497. [Google Scholar] [CrossRef] [PubMed]
- Kim, H.J.; Koedrith, P.; Seo, Y.R. Ecotoxicogenomic Approaches for Understanding Molecular Mechanisms of Environmental Chemical Toxicity Using Aquatic Invertebrate, Daphnia Model Organism. Int. J. Mol. Sci. 2015, 16, 12261–12287. [Google Scholar] [CrossRef] [PubMed]
- Fjodorova, N.; Novič, M.; Venko, K.; Rasulev, B. A comprehensive cheminformatics analysis of structural features affecting the binding activity of fullerene derivatives. Nanomaterials 2020, 10, 90. [Google Scholar] [CrossRef] [PubMed]
- Sizochenko, N.; Kuz’min, V.; Ognichenko, L.; Leszczynski, J. Introduction of simplex-informational descriptors for QSPR analysis of fullerene derivatives. J. Math. Chem. 2016, 54, 698–706. [Google Scholar] [CrossRef]
- Toropova, A.P.; Toropov, A.A. Fullerenes C60 and C70: A model for solubility by applying the correlation intensity index. Fuller. Nanotub. Carbon Nanostruct. 2020, 28, 900–906. [Google Scholar] [CrossRef]
- Huang, H.J.; Chetyrkina, M.; Wong, C.W.; Kraevaya, O.A.; Zhilenkov, A.V.; Voronov, I.I.; Wang, P.H.; Troshin, P.A.; Hsu, S.H. Identification of potential descriptors of water-soluble fullerene derivatives responsible for antitumor effects on lung cancer cells via QSAR analysis. Comput. Struct. Biotechnol. J. 2021, 19, 812–825. [Google Scholar] [CrossRef]
- Minovskia, N.; Saçan, M.T.; Eminoğlu, E.; Erdem, S.S.; Novič, M. Revisiting fish toxicity of active pharmaceutical ingredients: Mechanistic insights from integrated ligand-/structure-based assessments on acetylcholinesterase. Ecotoxicol. Environ. Saf. 2019, 170, 548–558. [Google Scholar] [CrossRef]
- Worth, A.P. The future of in silico chemical safety… and beyond. Comput. Toxicol. 2019, 10, 60–62. [Google Scholar] [CrossRef]
- Petersen, E.; Ceger, P.; Allen, D.; Coyle, J.; Derk, R.; Garcia-Reyero, N.; Gordon, J.; Kleinstreuer, N.; Matheson, J.; McShan, D.; et al. US Federal Agency interests and key considerations for new approach methodologies for nanomaterials. ALTEX-Altern. Anim. Exp. 2022, 39, 183–206. [Google Scholar] [CrossRef]
- Ertürk, M.D.; Saçan, M.T.; Novic, M.; Minovski, N. Quantitative structure–activity relationships (QSARs) using the novel marine algal toxicity data of phenols. J. Mol. Graph. Model. 2012, 38, 90–100. [Google Scholar] [CrossRef]
- Vračko, M.; Zupan, J. A non-standard view on artificial neural networks. Chemom. Intell. Lab. Syst. 2015, 149, 140–152. [Google Scholar] [CrossRef]
- Ahmed, L.; Rasulev, B.; Turabekova, M.; Leszczynska, D.; Leszczynski, J. Receptor- and ligand-based study of fullerene analogues: Comprehensive computational approach including quantum-chemical, QSAR and molecular docking simulations. Org. Biomol. Chem. 2013, 11, 5798–5808. [Google Scholar] [CrossRef] [PubMed]
- Sushko, I.; Salmina, E.; Potemkin, V.A.; Poda, G.; Tetko, I.V. ToxAlerts: A Web Server of Structural Alerts for Toxfic Chemicals and Compounds with Potential Adverse Reactions. J. Chem. Inf. Model. 2012, 52, 2310–2316. [Google Scholar] [CrossRef]
- Zhang, R.Q.; Guo, H.Z.; Hua, Y.Q.; Cui, X.Y.; Shi, Y.P.; Li, X. Modeling and insights into the structural basis of chemical acute aquatic toxicity. Ecotoxicol. Environ. Saf. 2022, 242, 113940. [Google Scholar] [CrossRef] [PubMed]
- Khan, K.; Baderna, D.; Cappelli, C.; Toma, C.; Lombardo, A.; Roy, K.; Benfenati, E. Ecotoxicological QSAR modeling of organic compounds against fish: Application of fragment based descriptors in feature analysis. Aquat. Toxicol. 2019, 212, 162–174. [Google Scholar] [CrossRef] [PubMed]
- Tinkov, O.; Polishchuk, P.; Matveieva, M.; Grigorev, V.; Grigoreva, L.; Porozov, Y. The Influence of Structural Patterns on Acute Aquatic Toxicity of Organic Compounds. Mol. Inform. 2021, 40, 2000209. [Google Scholar] [CrossRef]
- Nendza, M.; Wenzel, A.; Muller, M.; Lewin, G.; Simetska, N.; Stock, F.; Arning, J. Screening for potential endocrine disruptors in fish: Evidence from structural alerts and in vitro and in vivo toxicological assays. Environ. Sci. Eur. 2016, 28, 26. [Google Scholar] [CrossRef]
- Fjodorova, N.; Novič, M.; Venko, K.; Drgan, V.; Rasulev, B.; Saçan, M.T.; Erdem, S.S.; Tugcu, G.; Toropova, S.P.; Toropov, A.A. How fullerene derivatives (FDs) act on therapeutically important targets associated with diabetic diseases. Comput. Struct. Biotechnol. J. 2022, 20, 913–924. [Google Scholar] [CrossRef]
- Colovic, M.B.; Krstic, D.Z.; Lazarevic-Pasti, T.D.; Bondzic, A.M.; Vasic, V.M. Acetylcholinesterase Inhibitors: Pharmacology and Toxicology. Curr. Neuropharmacol. 2013, 11, 315–335. [Google Scholar] [CrossRef]
- Kolosnjaj, J.; Szwarc, H.; Moussa, F. Toxicity Studies of Carbon Nanotubes. In Bio-Applications of Nanoparticles. Advances in Experimental Medicine and Biology; Chan, W.C.W., Ed.; Springer: New York, NY, USA, 2007; pp. 181–204. [Google Scholar] [CrossRef]
- Gramatica, P. Principles of QSAR models validation: Internal and external. QSAR Comb. Sci. 2007, 26, 694–701. [Google Scholar] [CrossRef]
- Tropsha, A.; Gramatica, P.; Gombar Vijay, K. The Importance of Being Earnest: Validation is the Absolute Essential for Successful Application and Interpretation of QSPR Models. QSAR Comb. Sci. 2003, 22, 69–77. [Google Scholar] [CrossRef]
- Ahmed, L.; Rasulev, B.; Kar, S.; Krupa, P.; Mozolewska, M.A.; Leszczynski, J. Inhibitors or toxins? Large Library Target-specific Screening of Fullerene-based Nanoparticles for Drug Design Purpose. Nanoscale 2017, 9, 10263–10276. [Google Scholar] [CrossRef]
- Burley, S.; Berman, H.; Bhikadiya, C.; Bi, C.; Chen, L.; Di Costanzo, L.; Christie, C.; Dalenberg, K.; Duarte, J.M.; Dutta, S.; et al. RCSB Protein Data Bank: Biological macromolecular structures enabling research and education in fundamental biology, biomedicine, biotechnology and energy. Nucleic Acids Res. 2019, 47, D464–D474. [Google Scholar] [CrossRef]
- Toropov, A.A.; Carbó-Dorca, R.; Toropova, A.P. Index of Ideality of Correlation: New possibilities to validate QSAR: A case study. Struct. Chem. 2018, 29, 33–38. [Google Scholar] [CrossRef]
- Toropov, A.A.; Toropova, A.P.; Raska, I., Jr. QSPR modeling of octanol/water partition coefficient for vitamins by optimal descriptors calculated with SMILES. Eur. J. Med. Chem. 2008, 43, 714–740. [Google Scholar] [CrossRef] [PubMed]
- Toropova, A.P.; Toropov, A.A.; Veselinović, J.B.; Veselinović, A.M. QSAR as a random event: A case of NOAEL. Environ. Sci. Pollut. Res. 2015, 22, 8264–8271. [Google Scholar] [CrossRef]
- Keller, T.; Pichota, A.; Yin, Z. A practical view of ‘druggability’. Curr. Opin. Chem. Biol. 2006, 10, 357–361. [Google Scholar] [CrossRef] [PubMed]
- Ursu, O.; Rayan, A.; Goldblum, A.; Oprea, T.I. Understanding drug-likeness. Wires Comput. Mol. Sci. 2011, 1, 760–781. [Google Scholar] [CrossRef]
- Oprea, T.I. Property distribution of drug-related chemical databases. J. Comput. Aid. Mol. Des. 2000, 14, 251–264. [Google Scholar] [CrossRef]
- Lipinski, C. Drug-like properties and the causes of poor solubility and poor permeability. J. Pharmacol. Toxicol. Methods 2000, 44, 3–25. [Google Scholar] [CrossRef]
- Vistoli, G.; Pedretti, A.; Testa, B. Assessing Drug-likeness—What are we Missing? Drug Discov. Today 2008, 13, 285–294. [Google Scholar] [CrossRef]
- Sander, T.; Freyss, J.; Korff, M.; Rufener, C. DataWarrior: An Open-Source Program for Chemistry Aware Data Visualization and Analysis. J. Chem. Inf. Model. 2015, 55, 460–473. [Google Scholar] [CrossRef] [PubMed]
- Schneidman-Duhovny, D.; Inbar, Y.; Nussinov, R.; Wolfson, H.J. PatchDock and SymmDock: Servers for rigid and symmetric docking. Nucleic Acids Res. 2005, 33, W363–W367. [Google Scholar] [CrossRef] [PubMed]
- Trott, O.; Olson, A.J. AutoDockVina: Improving the speed and accuracy of docking with a new scoring function, efficient optimization, and multithreading. J. Comput. Chem. 2010, 31, 455–461. [Google Scholar] [PubMed]
- Duhovny, D.; Nussinov, R.; Wolfson, H.J. Efficient Unbound Docking of Rigid Molecules. In Proceedings of the 2nd Workshop on Algorithms in Bioinformatics (WABI), Rome, Italy, 17–21 September 2002; Gusfield, D., Guigo, R., Eds.; Springer: Berlin/Heidelberg, Germany, 2002; Volume 2452, pp. 185–200. [Google Scholar]
- MINITAB. Available online: https://en.freedownloadmanager.org/users-choice/Download_Minitab_14_Version_64_Bit.html (accessed on 11 September 2023).
- Mazzatorta, P.; Vračko, M.; Jezierska, A.; Benfenati, E. Modeling Toxicity by Using Supervised Kohonen Neural Networks. J. Chem. Inf. Comput. Sci. 2003, 43, 485–492. [Google Scholar] [CrossRef]
- Vračko, M.; Novič, M.; Zupan, J. Study of Structure-Toxicity Relationship by a Counter-propagation Neural Network. Anal. Chim. Acta 1999, 384, 319–332. [Google Scholar] [CrossRef]
- Zupan, J.; Novič, M.; Ruisainchez, I. Kohonen and Counterpropagation Artificial Neural Networks in Analytical Chemistry. Chemometr. Intell. Lab. 1997, 38, 1–23. [Google Scholar] [CrossRef]
- Zupan, J.; Gasteiger, J. Neural Networks in Chemistry and Drug Design, 2nd ed.; Wiley-VCH Verlag GmbH: Weinheim, Germany, 1999. [Google Scholar]
- Grošelj, N.; Van der Veer, G.; Tušar, M.; Vračko, M.; Novič, M. Verification of the Geological Origin of Bottled Mineral Water Using Artificial Neural Networks. Food Chem. 2010, 118, 941–947. [Google Scholar] [CrossRef]
- Kohonen, T. Self-Organizing Maps; Springer: Berlin/Heidelberg, Germany, 2001. [Google Scholar] [CrossRef]

| Models | Model Name | Applied Tools | The Goal of the Study |
|---|---|---|---|
| CPANN model based on 28 descriptors (25 drug-like descriptors + QPpolrz + TD + DCW) | ALL_ CPANN model | Visualization in 2D Kohonen map | To find out:
|
| Regression model based on 28 descriptors (25 drug-like descriptors + QPpolrz + TD + DCW) | ALL_ regression model | Correlation analysis MLR equations | To find out:
|
| CPANN model based on QPpolrz + TD descriptors | CPANN model 1 | Prediction QSAR model | Prediction of binding affinity |
| CPANN model based on DCW optimal descriptors | CPANN model 2 | Prediction QSAR model | Prediction of binding affinity |
| Regression model based on QPpolrz + TD descriptors | Regression model 1 | Prediction QSAR model | Prediction of binding affinity |
| Regression model based on DCW optimal descriptors | Regression model 2 | Prediction QSAR model | Prediction of binding affinity |
| PDB_ID | Biochemical Function | Receptor/ (Protein Code) | Functional Name of Proteins | Description |
|---|---|---|---|---|
| 1D6U | Neurotransmitter oxidation | Amine oxidase [copper-containing] A (CuAO) | Oxidoreductase | Crystal structure of E. coli amine oxidase anaerobically red 2 beta-phenylethylamine |
| 1GOS | Neurotransmitter oxidation | Amine oxidase [flavin-containing] B (MAO-B) | Oxidoreductase | Human monoamine oxidase B |
| 1H82 | Polyamine catabolism | Amine oxidase [flavin-containing] (PAO) | Oxidoreductase | Structure of polyamine oxidase in complex with guazatine |
| 1E3K | Endocrine system-related proteins | Androgen receptor (AR) | Human progesterone receptor | Human progesterone receptor ligand binding domain in complex 2 with the ligand metribolone (R1881) |
| 1GS4 | Endocrine system-related proteins | Androgen receptor (AR) | Androgen receptor | Structural basis for the glucocorticoid response in a mutant 2 human androgen receptor (ARccr) derived from an androgen-independent prostate cancer |
| 1UOM | Endocrine system-related proteins | Estrogen receptor (ESR1) | Nuclear protein | The structure of estrogen receptor in complex with a selective and potent tetrahydroisochiolin ligand |
| 3ERT | Endocrine system-related proteins | Estrogen receptor (ESR1) | Nuclear receptor | Human estrogen receptor alpha ligand-binding domain in complex hydroxytamoxifen |
| 1OG5 | Metabolism-related enzyme | Cytochrome P450 2C9 (CYP2C9) | Electron transport | Structure of human cytochrome P450 CYP2C9 |
| 2F9Q | Metabolism-related enzyme | Cytochrome P450 2D6 (CYP2D6) | Oxidoreductase | Crystal structure of human cytochrome P450 CYP2D6 |
| 2J0D | Metabolism-related enzyme | Cytochrome P450 3A4 (CYP3A4) | Oxidoreductase | Crystal structure of human P450 CYP3A4 in complex with erythromycin |
| Set1 | QPpolrz—Polarizability Volume in Cubic Angstroms (1), TD—Topological Diameter (2); |
| Set2 | DCW-Optimal descriptors (1); |
| Set3 | The group of twenty-five drug-like descriptors: H-acceptors (1), H-donors (2), TSA—total surface area (3), RPSA—relative polar surface area (4), PSA—polar surface area (5), drug-likeness (6), MW—molecular weight (7), cLogP (8), cLogS (9), electronegative atoms (10), stereo centers (11), rotatable bonds (12), rings closures (13), small rings (14), aromatic rings (15), aromatic atoms (16), sp3-atoms (17), symmetric atoms (18), amides (19), amines (20), aromatic nitrogen (21), basic nitrogen (22), acidic oxygen (23), non-H atoms (24), non-C/H atoms (25). |
| Set1 | Average Binding Score (Average BScore) (1). |
| Set2 | Binding affinity (2). |
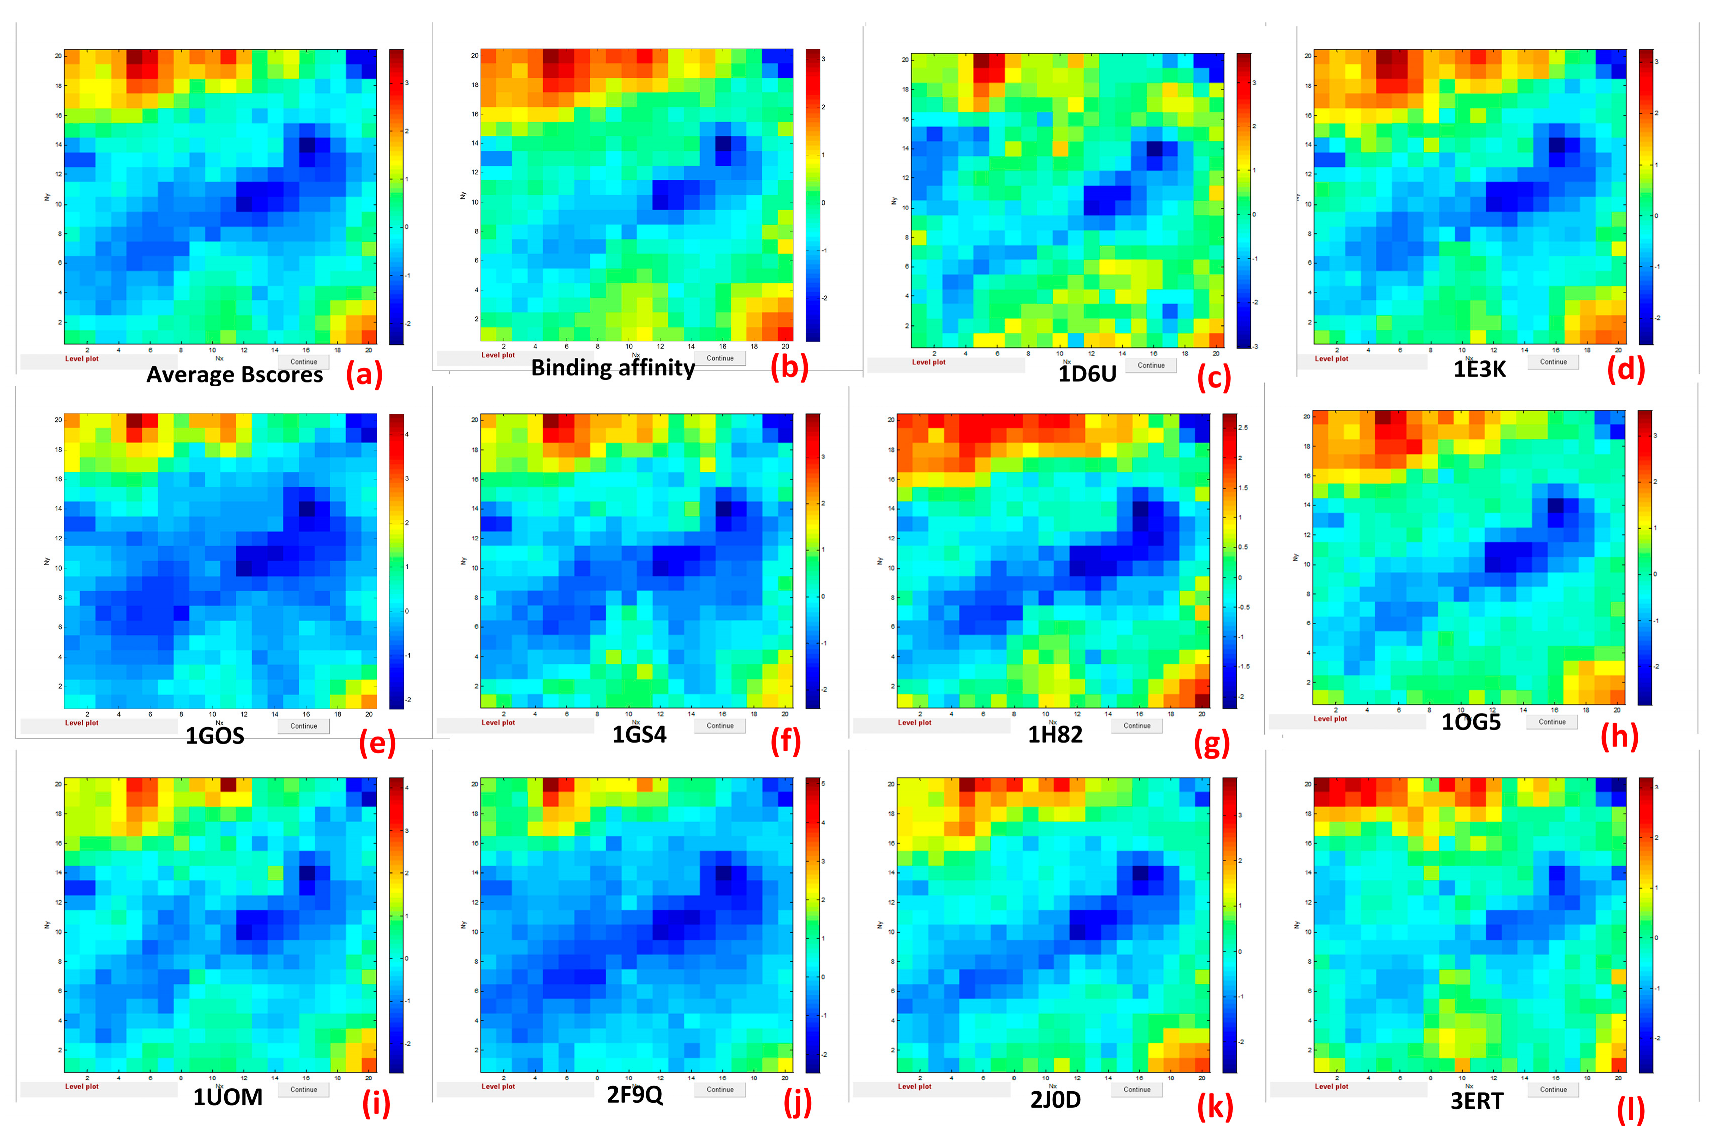
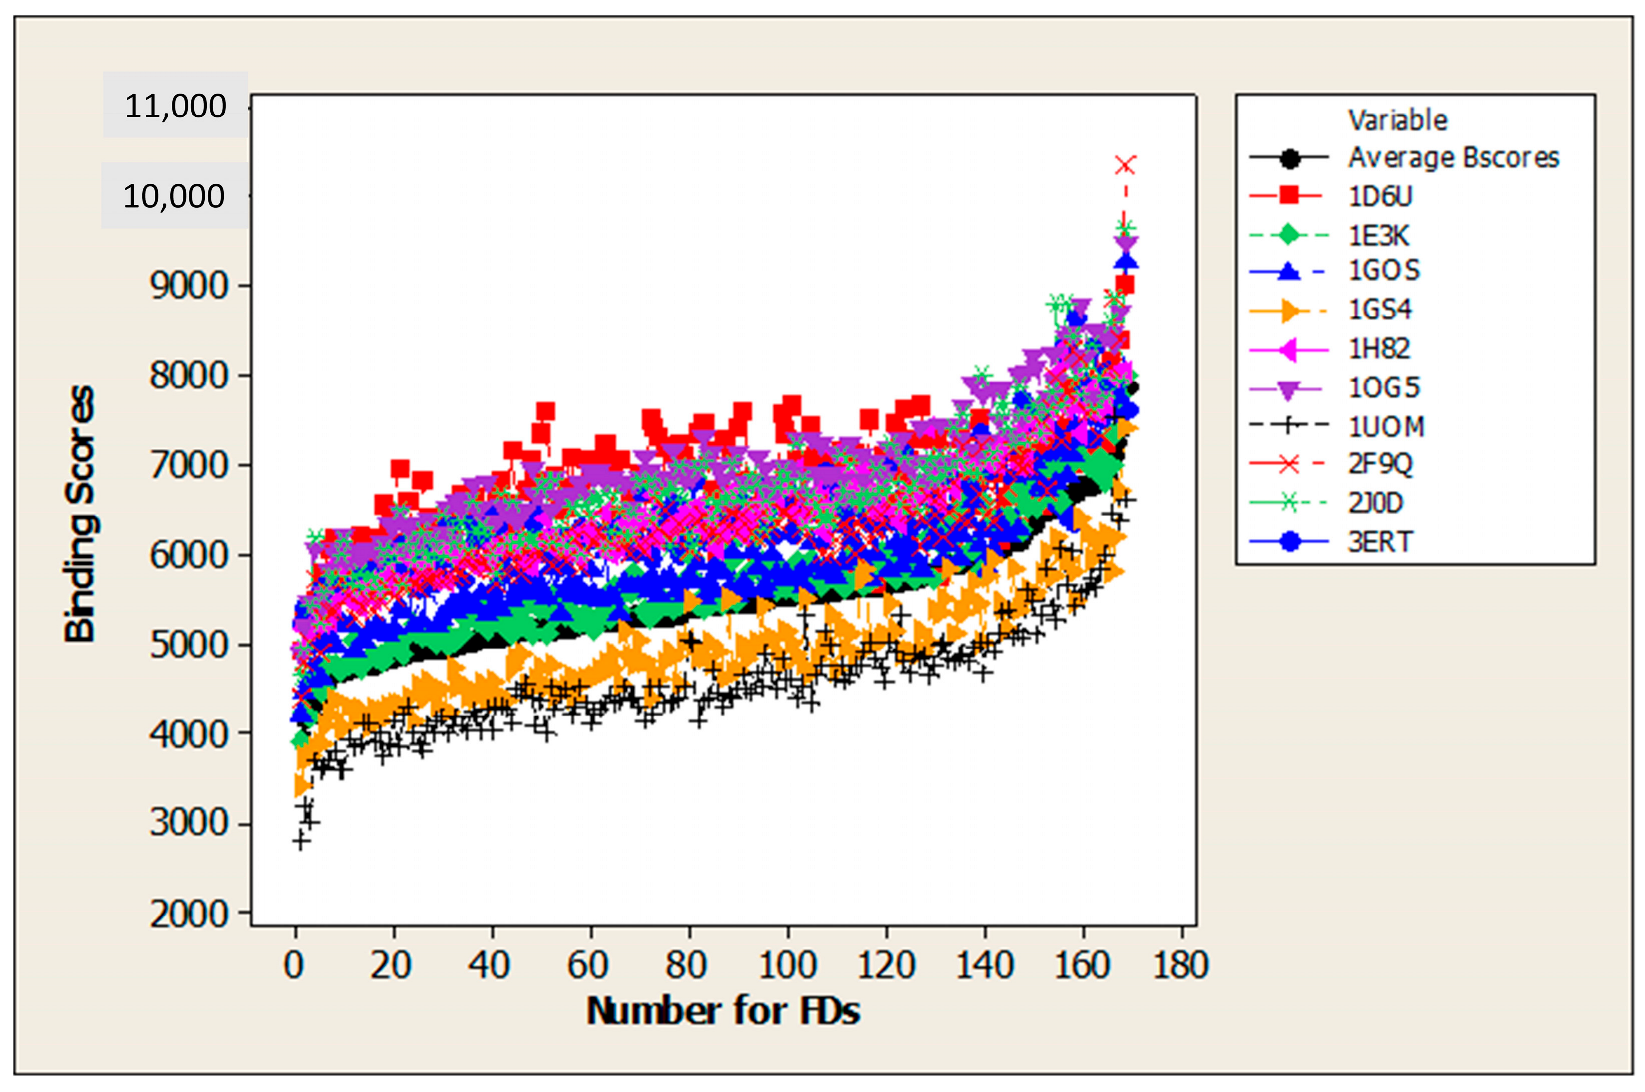
| Set3 | Binding scores for ten proteins associated with aquatic species: 1D6U (1); 1E3K (2); 1GOS (3); 1GS4 (4); 1H82 (5); 1OG5 (6); 1UOM (7); 2F9Q (8); 2J0D (9); 3ERT (10). |
| Set4 | Binding scores for acetylcholinesterase enzyme (AChE) (PDB code: 1VOT) for Torpedo californica (TcAChE). |
Disclaimer/Publisher’s Note: The statements, opinions and data contained in all publications are solely those of the individual author(s) and contributor(s) and not of MDPI and/or the editor(s). MDPI and/or the editor(s) disclaim responsibility for any injury to people or property resulting from any ideas, methods, instructions or products referred to in the content. |
© 2023 by the authors. Licensee MDPI, Basel, Switzerland. This article is an open access article distributed under the terms and conditions of the Creative Commons Attribution (CC BY) license (https://creativecommons.org/licenses/by/4.0/).
Share and Cite
Fjodorova, N.; Novič, M.; Venko, K.; Rasulev, B.; Türker Saçan, M.; Tugcu, G.; Sağ Erdem, S.; Toropova, A.P.; Toropov, A.A. Cheminformatics and Machine Learning Approaches to Assess Aquatic Toxicity Profiles of Fullerene Derivatives. Int. J. Mol. Sci. 2023, 24, 14160. https://doi.org/10.3390/ijms241814160
Fjodorova N, Novič M, Venko K, Rasulev B, Türker Saçan M, Tugcu G, Sağ Erdem S, Toropova AP, Toropov AA. Cheminformatics and Machine Learning Approaches to Assess Aquatic Toxicity Profiles of Fullerene Derivatives. International Journal of Molecular Sciences. 2023; 24(18):14160. https://doi.org/10.3390/ijms241814160
Chicago/Turabian StyleFjodorova, Natalja, Marjana Novič, Katja Venko, Bakhtiyor Rasulev, Melek Türker Saçan, Gulcin Tugcu, Safiye Sağ Erdem, Alla P. Toropova, and Andrey A. Toropov. 2023. "Cheminformatics and Machine Learning Approaches to Assess Aquatic Toxicity Profiles of Fullerene Derivatives" International Journal of Molecular Sciences 24, no. 18: 14160. https://doi.org/10.3390/ijms241814160