

Investigating the Effects of a New Peptide, Derived from the Enterolobium contortisiliquum Proteinase Inhibitor (EcTI), on Inflammation, Remodeling, and Oxidative Stress in an Experimental Mouse Model of Asthma–Chronic Obstructive Pulmonary Disease Overlap (ACO)
 , , , ,
  , and
, and
Abstract
:1. Introduction
2. Results
2.1. Control Groups
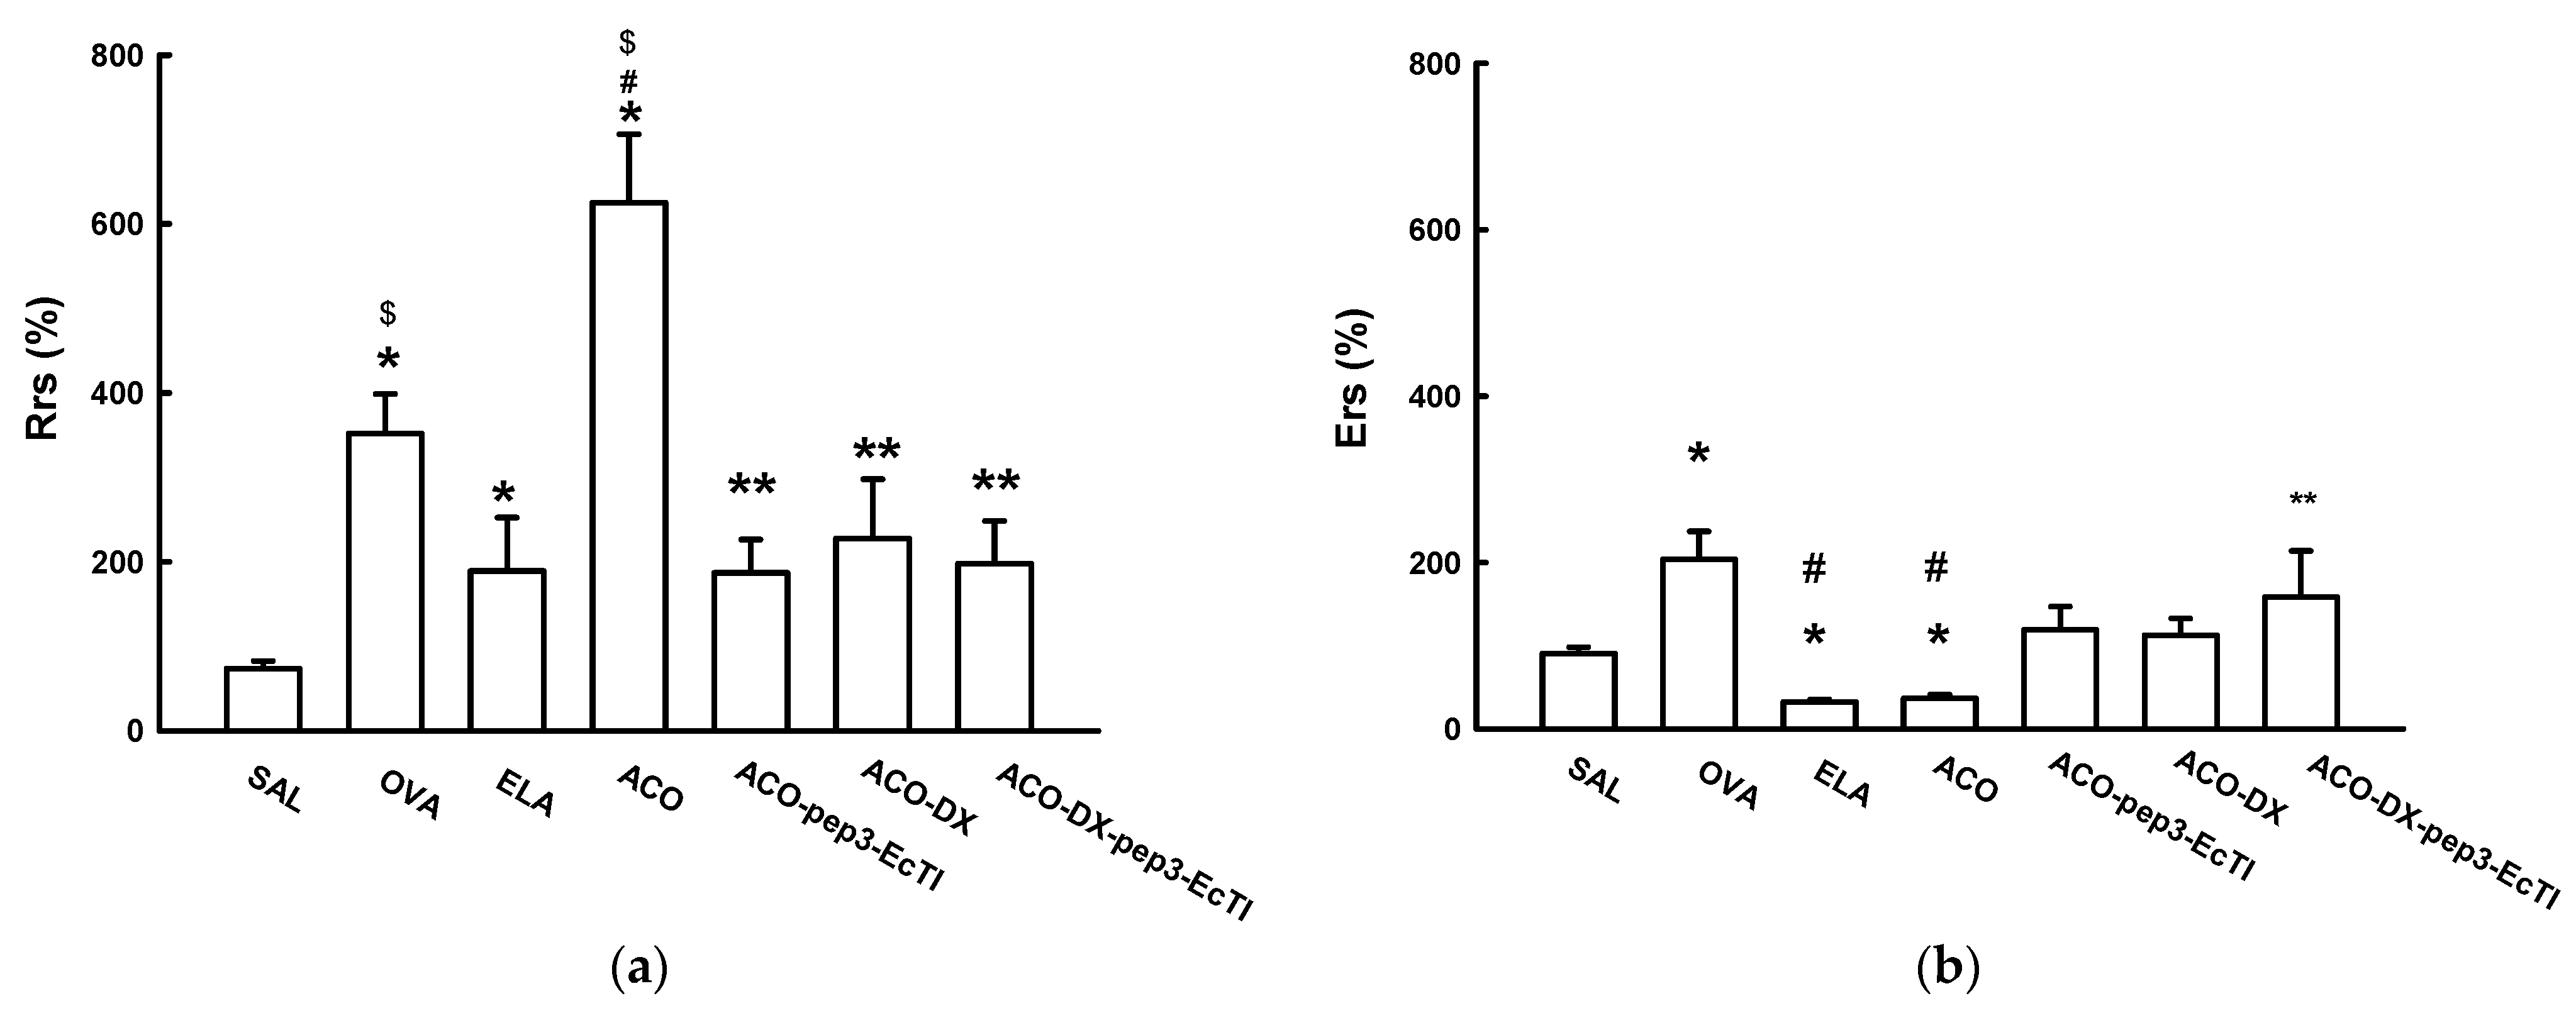
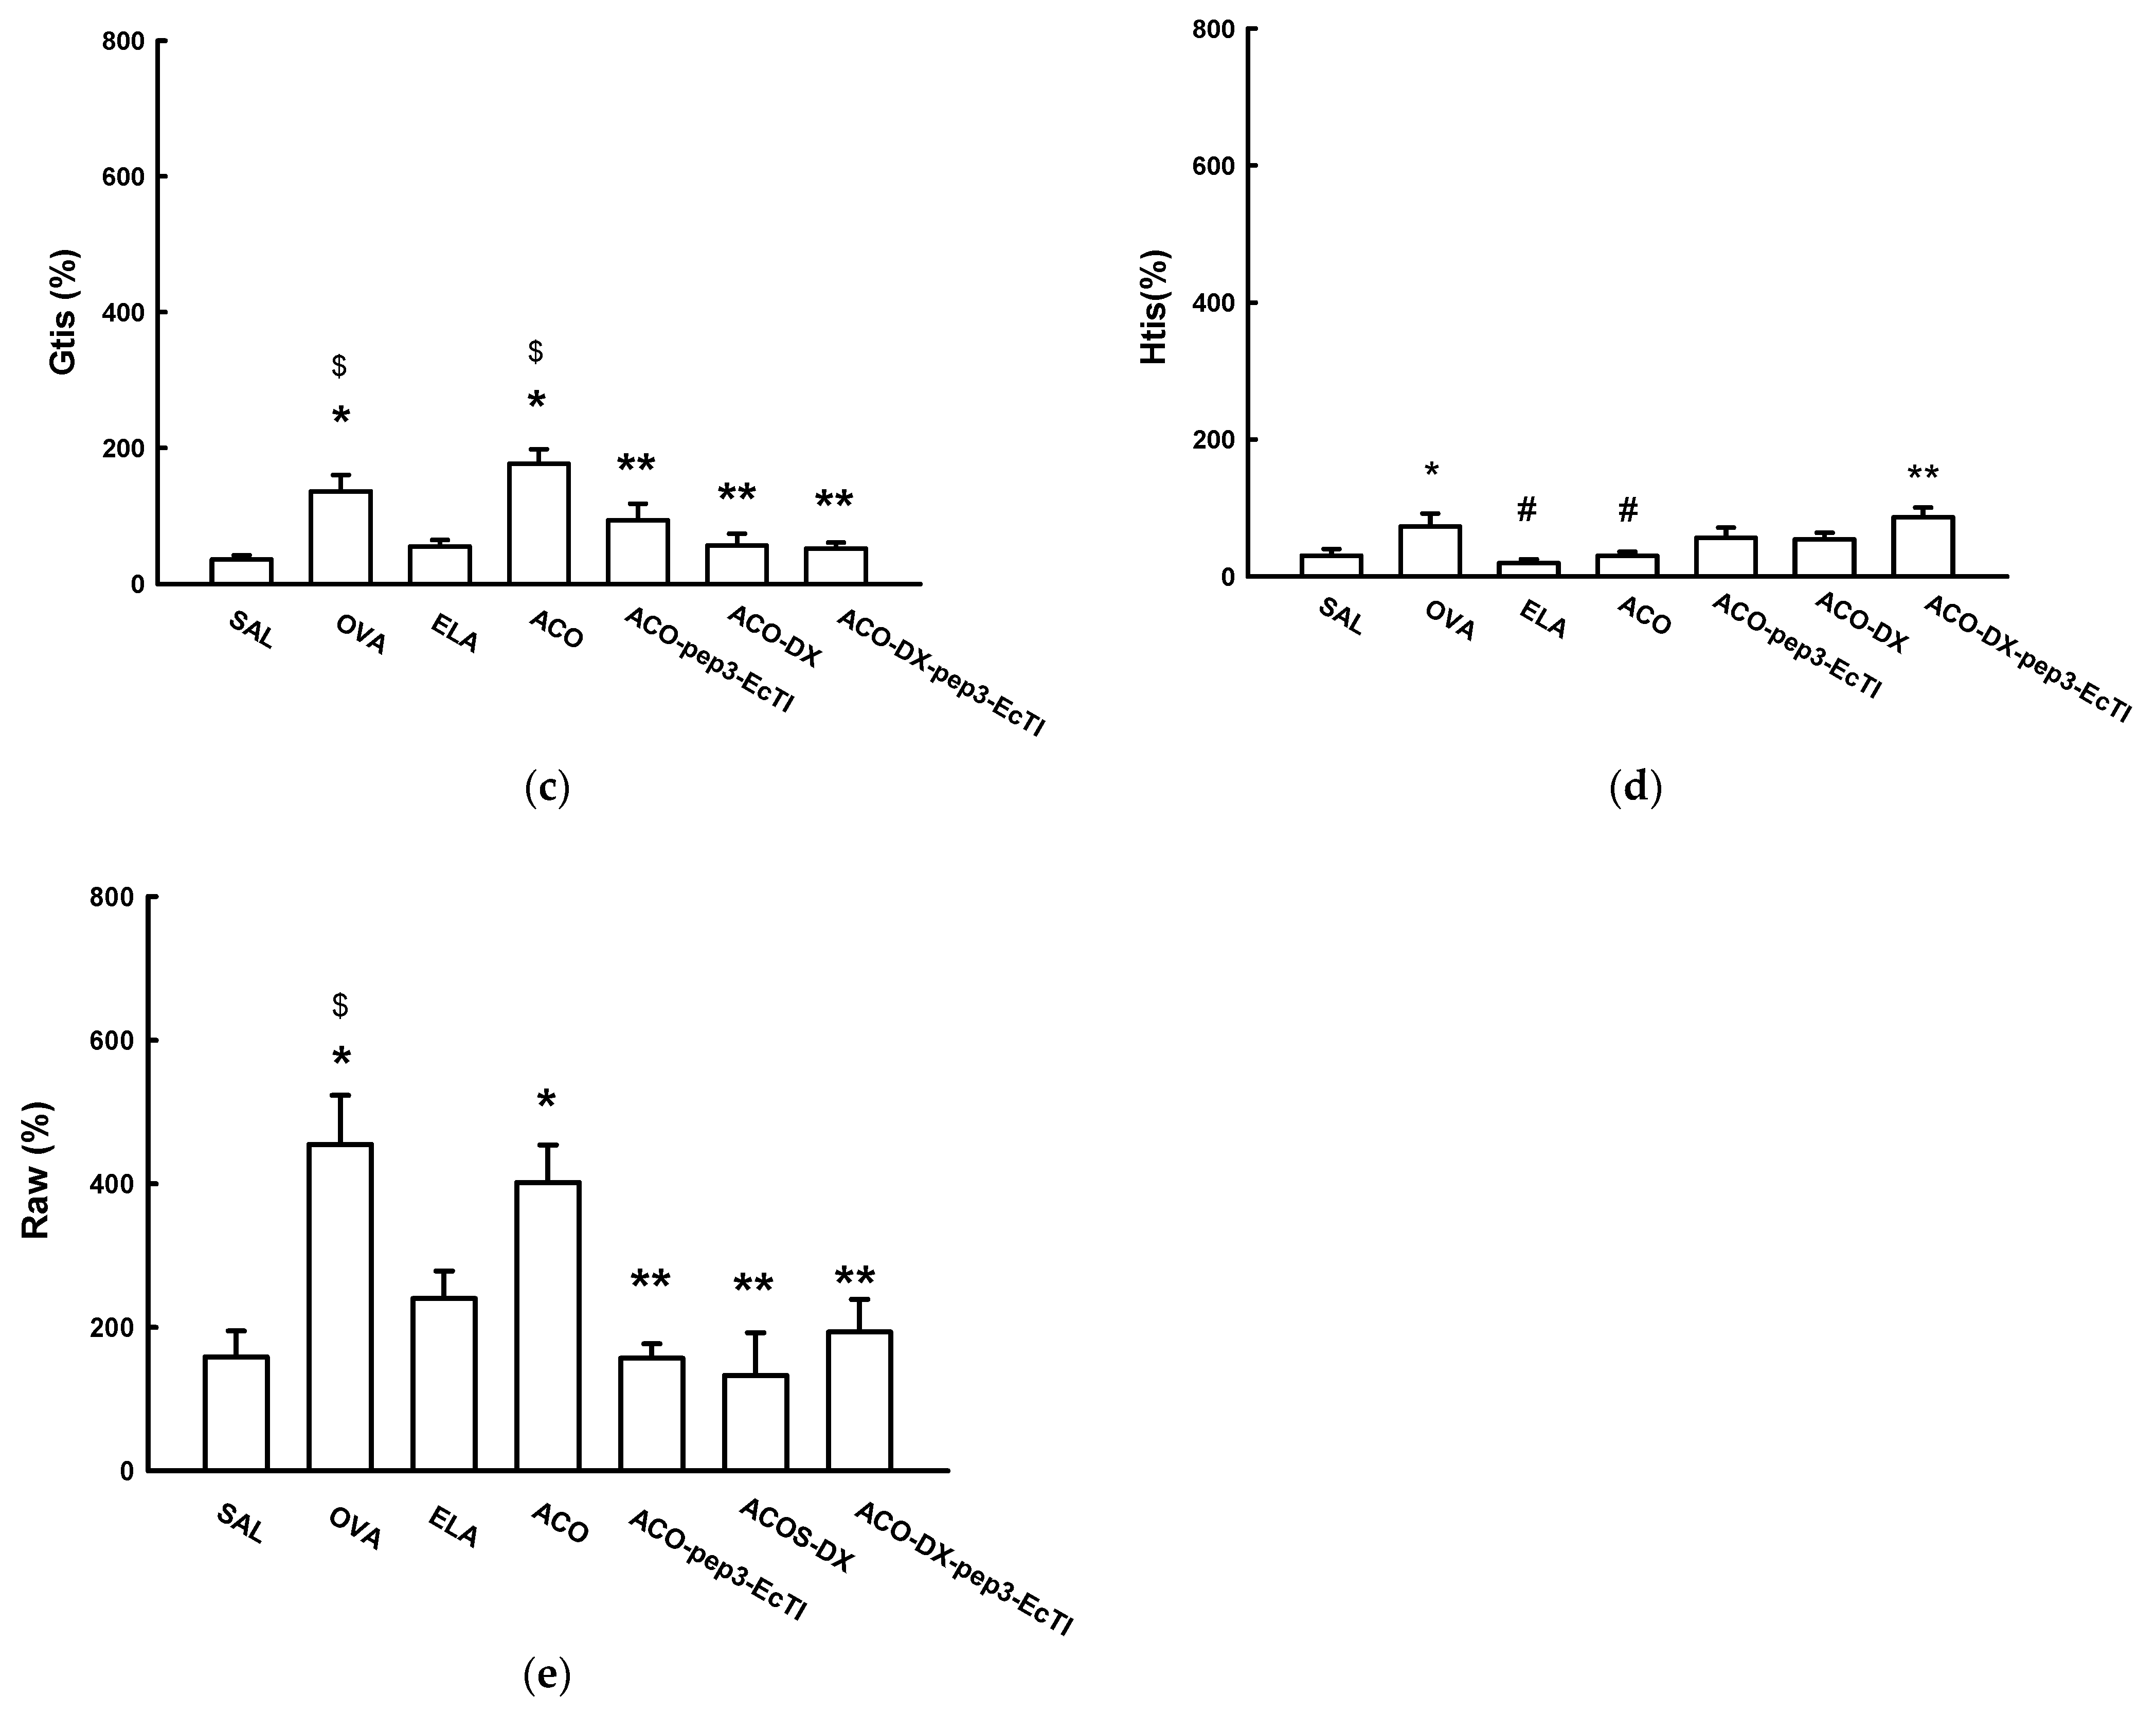
2.2. Lung Mechanics Airway Hyperresponsiveness to Methacholine
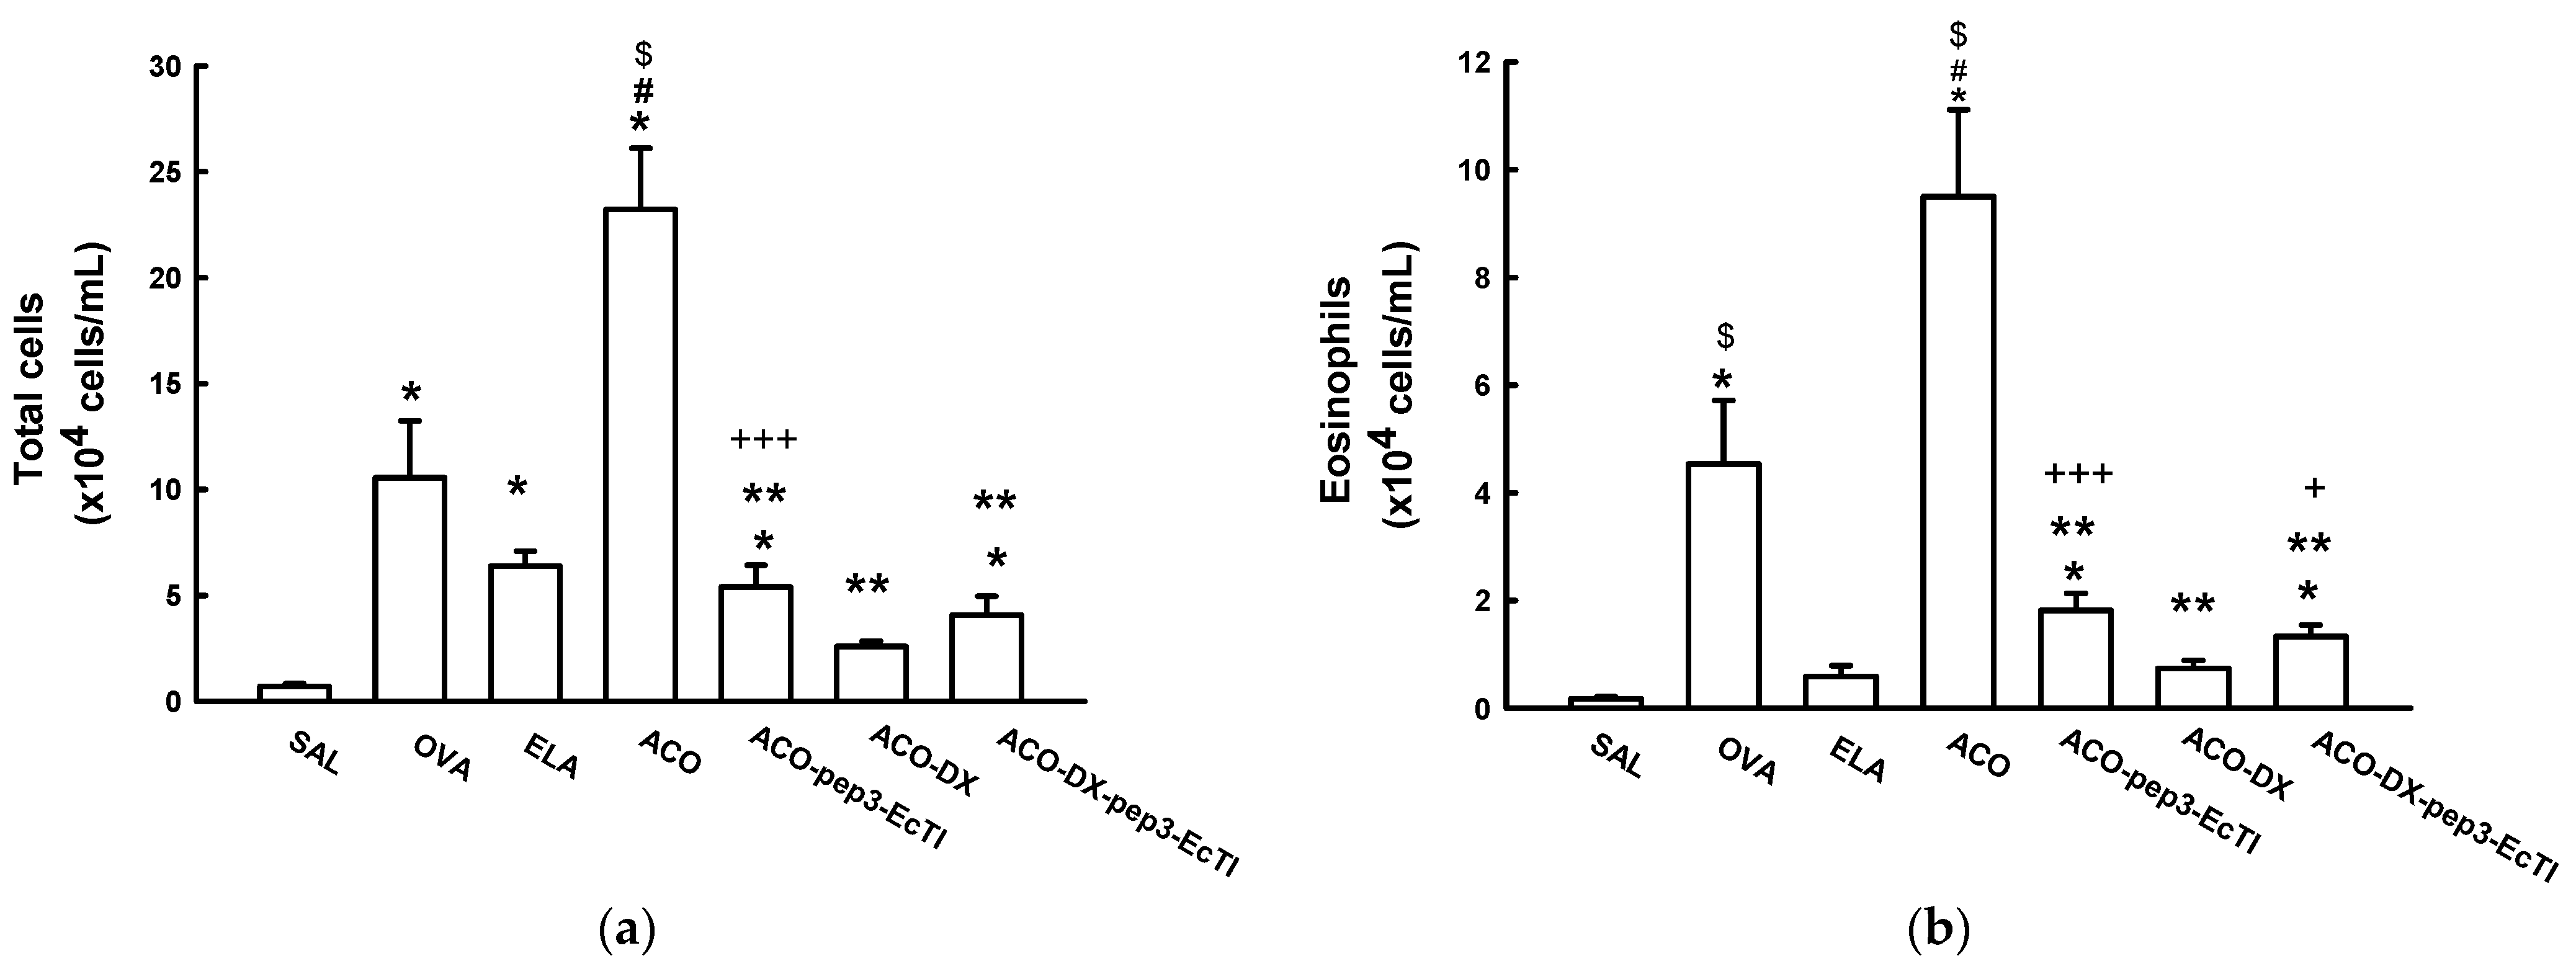
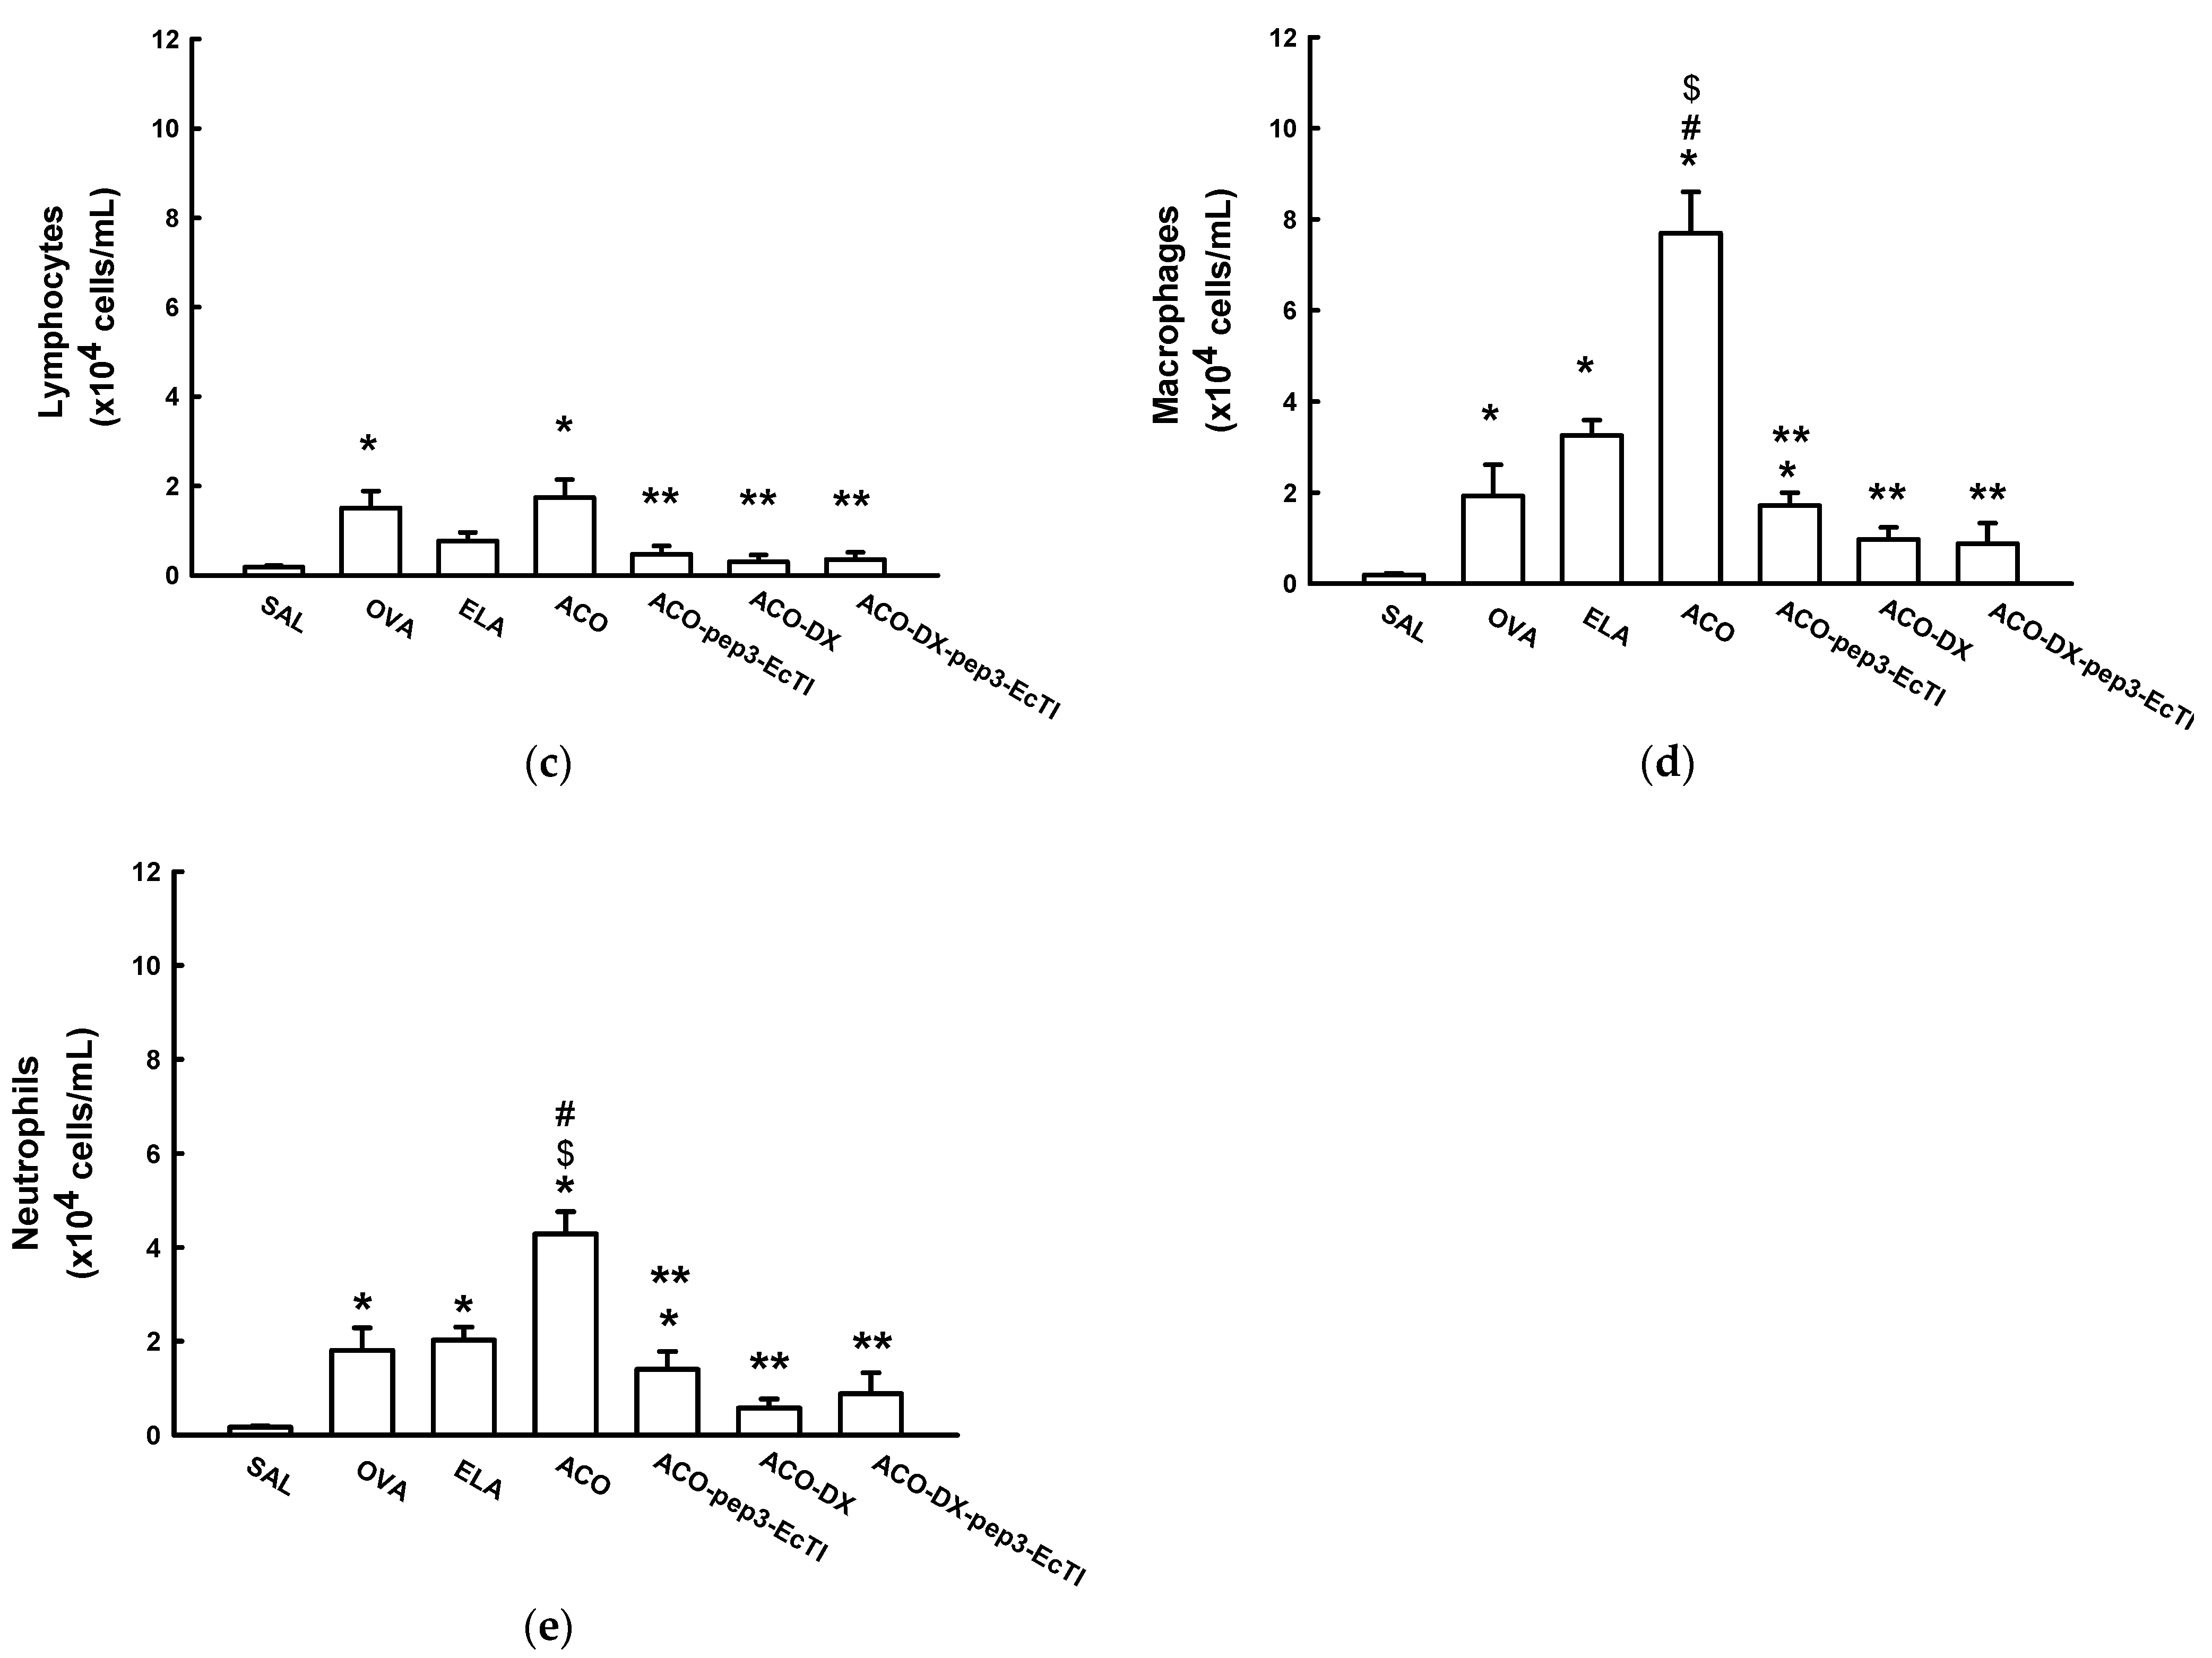
2.3. BALF Analysis
2.4. Lm
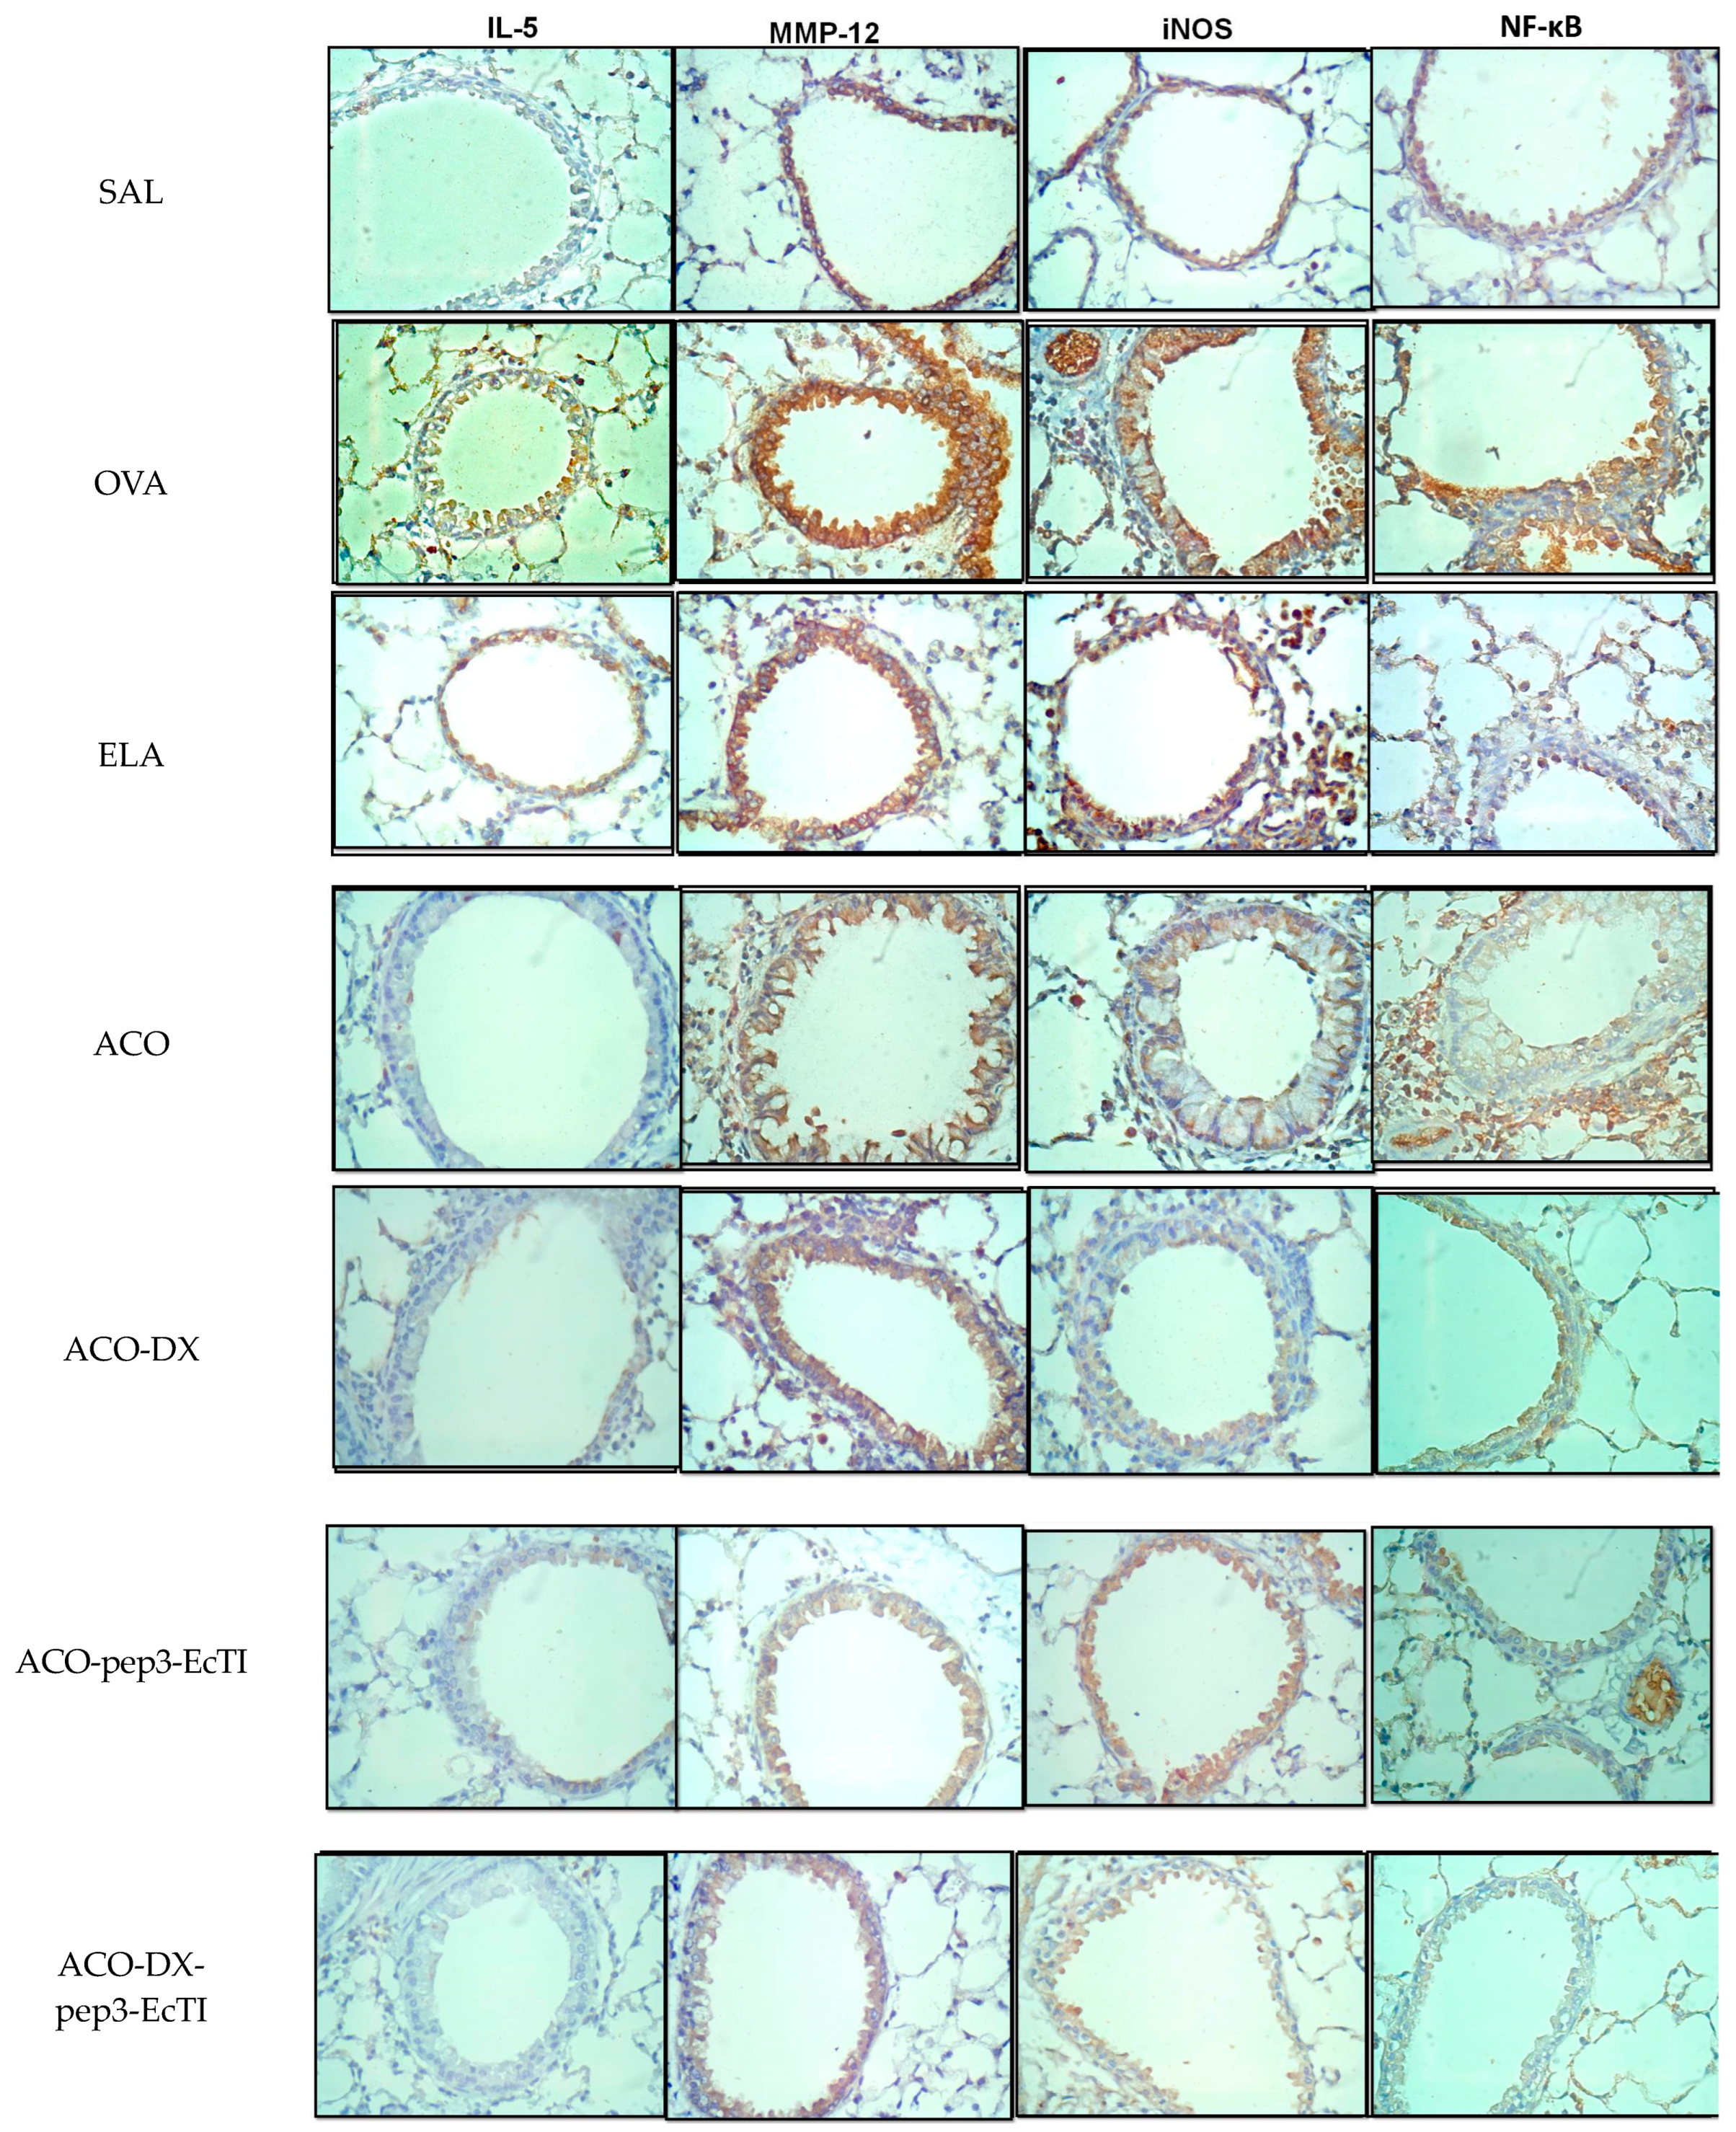
2.5. Inflammatory Markers
2.6. Oxidative Stress Response
2.7. Extracellular Matrix Remodeling
2.8. Qualitative Analysis
3. Discussion
4. Materials and Methods
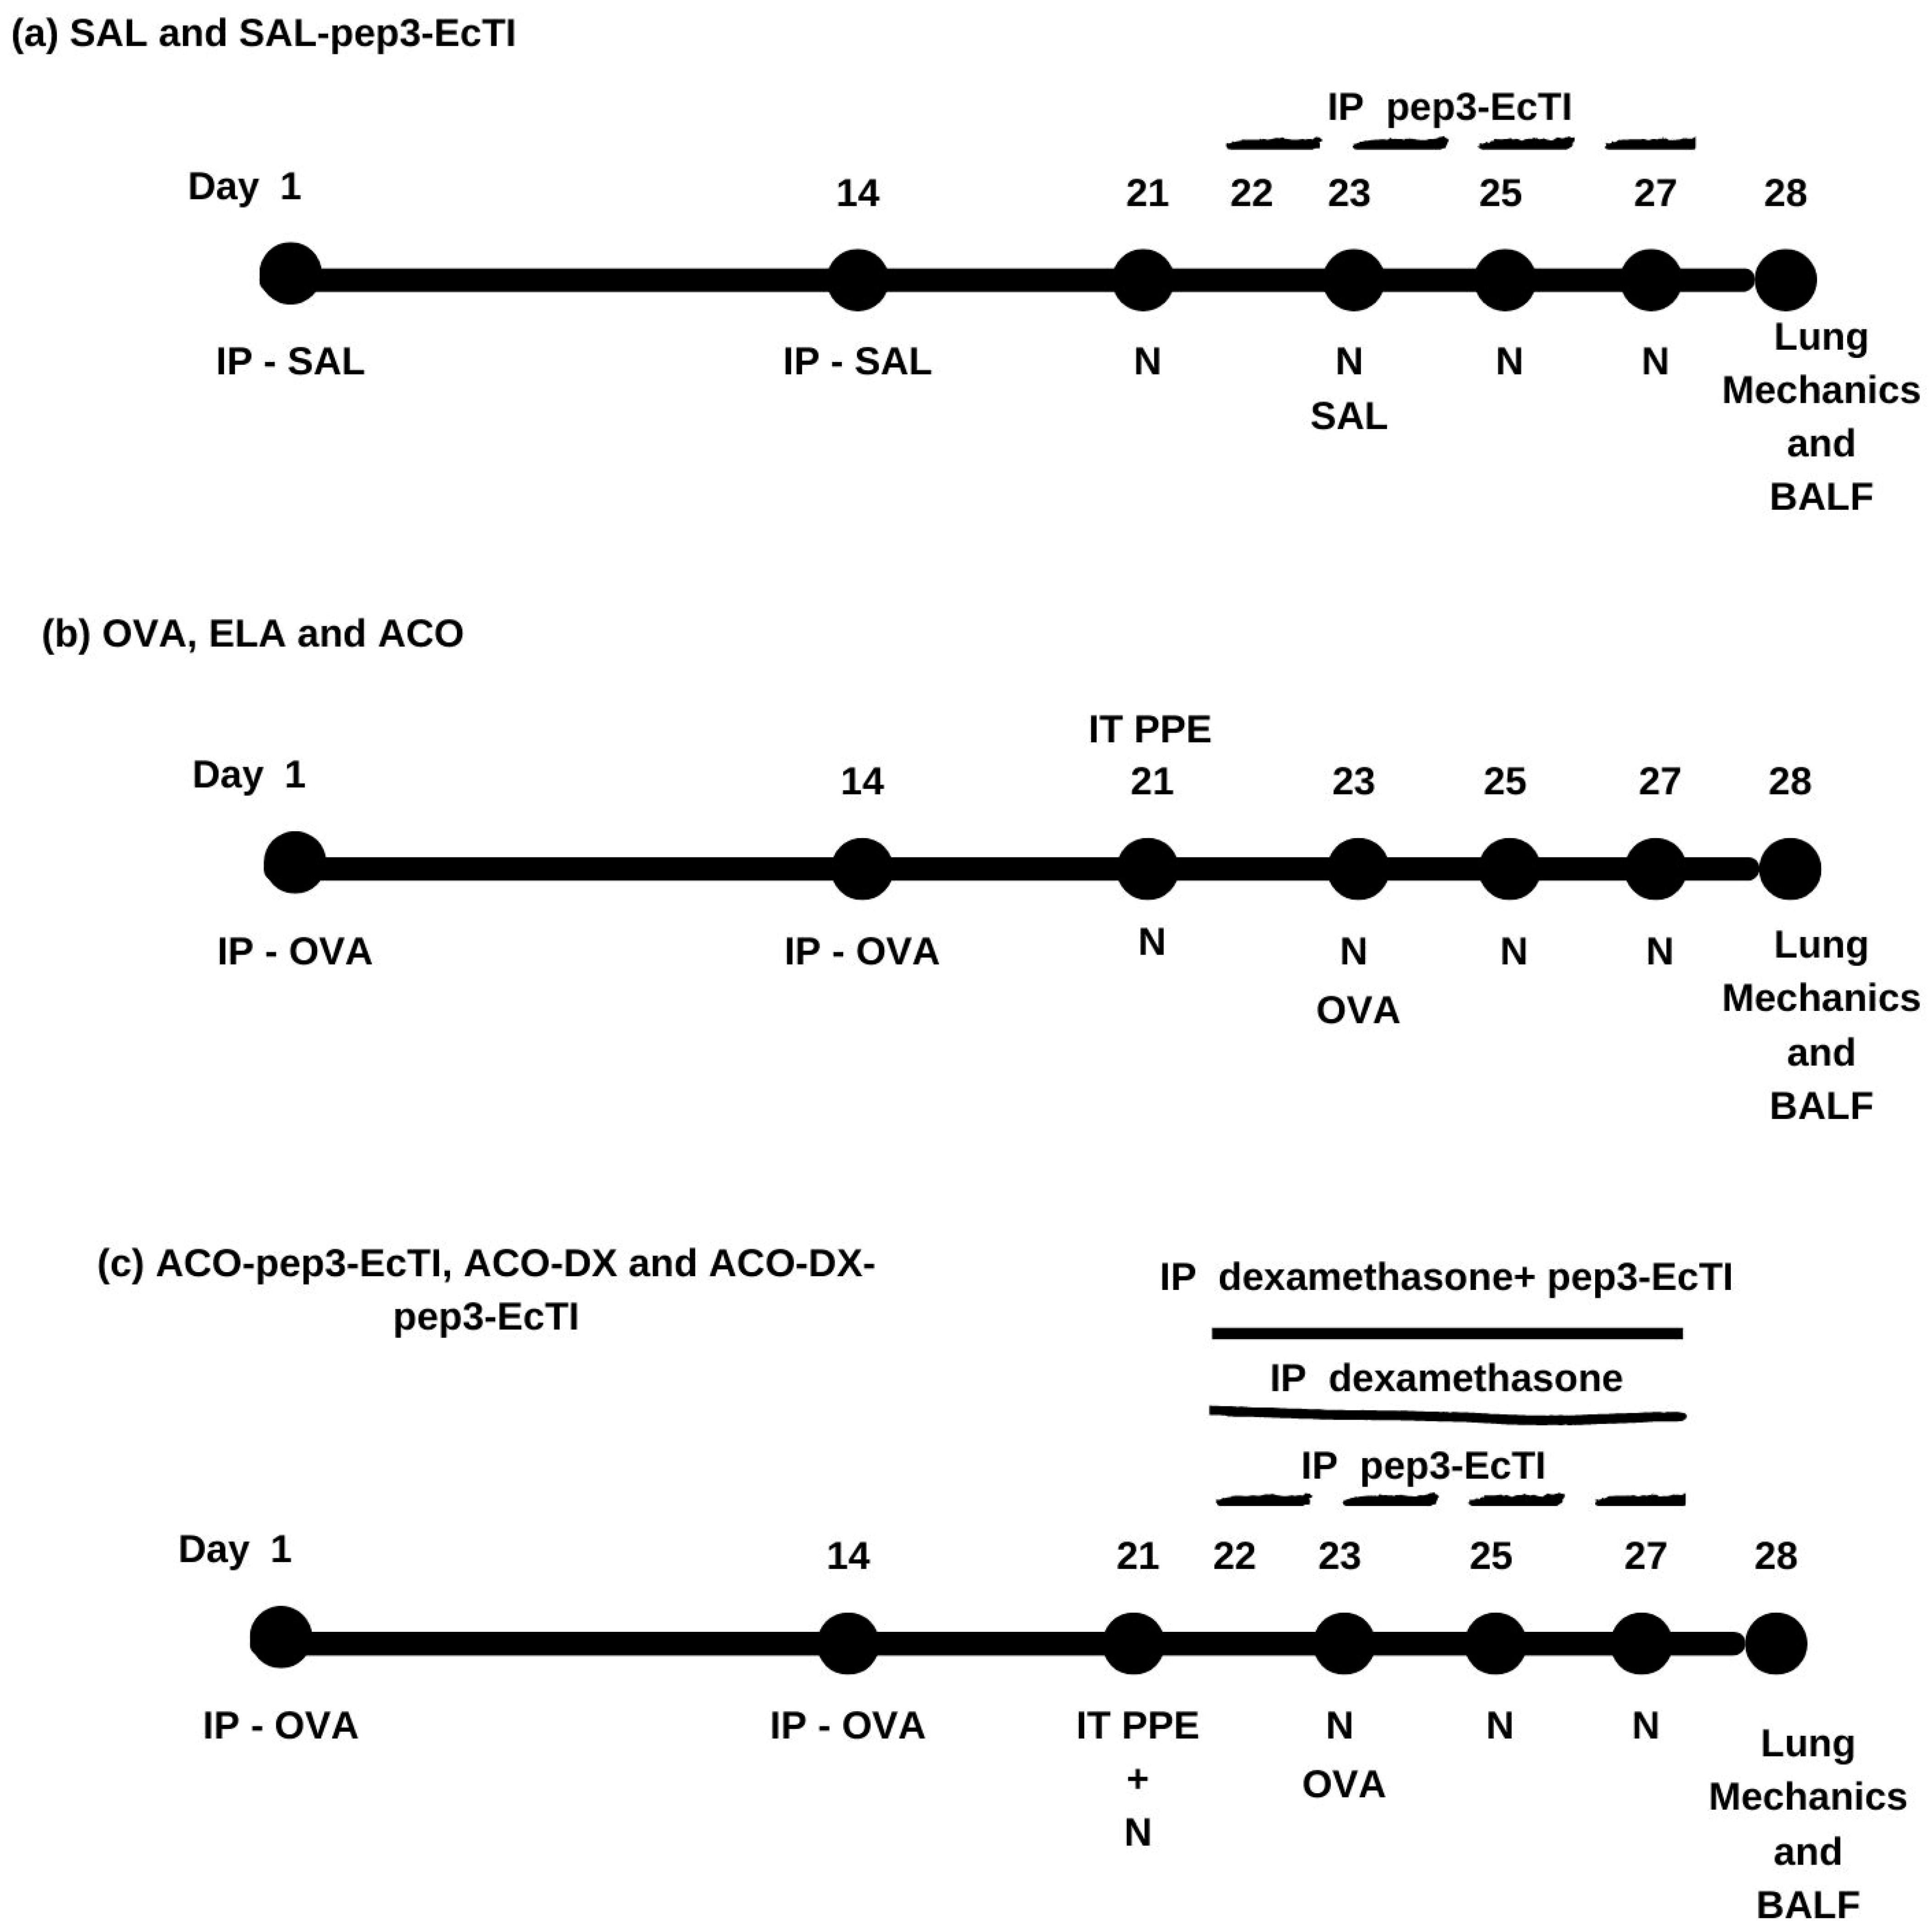
4.1. Experimental Design
4.2. Inhibitor Purification
4.3. Experimental Model of Asthma
4.4. Mice Model of Elastase-Induced Emphysema
4.5. Experimental Model of ACO
4.6. Pep3-EcTI and Dexamethasone-Treated Groups
4.7. Evaluation of Hyperresponsiveness to Methacholine and Exhaled Nitric Oxide Collection
4.8. Bronchoalveolar Lavage Fluid
4.9. Histochemistry and Immunohistochemistry
4.10. Morphometric Analysis
4.11. Lm
4.12. Data Analysis
5. Conclusions
Supplementary Materials
Author Contributions
Funding
Institutional Review Board Statement
Informed Consent Statement
Data Availability Statement
Acknowledgments
Conflicts of Interest
Abbreviations
| ACO | asthma-COPD overlap |
| ACO | ovalbumin + elastase protocol |
| ACO-DX | treated with dexamethasone |
| ACO-DX-pep3-EcTI | treated with dexamethasone and peptide |
| ACO-pep3-EcTI | treated with inhibitor |
| ACO-like model | model used in Ikeda research |
| AS | alveolar septa |
| AW | airways |
| BALF | bronchoalveolar lavage fluid |
| BSA | bovine serum albumin |
| CD8+ T | cluster of differentation 8 |
| CNPq | National Council for Scientific and Technological Development |
| COPD | chronic obstructive pulmonary disease |
| DAB | diaminobenzidine chromogen |
| ECM | extracellular matrix |
| EcTI | Enterolobium contortisiliquum |
| ELA | elastase protocol |
| eNO | exhaled nitric oxide |
| %Ers | respiratory system elastance |
| FAPESP | research support foundation of the State of São Paulo |
| FEV1 | forced expiratory volume in first second |
| GINA | Global Initiative of Asthma |
| GOLD | Global Initiative for Chronic Obstructive Lung Disease |
| %Gtis | tissue resistance system |
| %Htis | tissue elastance system |
| ICS | inhaled corticosteroid |
| IFN-γ | interferon gamma |
| IgE | immunoglobulin E |
| IL-1β | interleukin 1Beta |
| IL-4 | interleukin 4 |
| IL-5 | interleukin 5 |
| IL-6 | interleukin 6 |
| IL-10 | interleukin 10 |
| IL-13 | interleukin 13 |
| IL-17 | interleukin 17 |
| IL-17F | interleukin 17 A |
| IL-17F | interleukin 17 F |
| IL-22 | interleukin 22 |
| iNOS | inducible nitric oxide synthase |
| IP | intraperitoneal |
| Lm | linear mean intercept |
| LIM-20 | Laboratory of Experimental Therapy I |
| MMP´s | Metalloproteinases |
| MMP-9 | metalloproteinase 9 |
| MMP-12 | metalloproteinase 12 |
| NF-κB | nuclear factor kappa-B |
| NO | nitric oxide |
| OVA | ovalbumin protocol |
| PBS | Phosphate-buffered Saline |
| pep3-EcTI | Peptide EcTI |
| PKa | human plasma kallikrein |
| ppb | parts per billion |
| PPE | porcine pancreatic elastase |
| %Raw | airway resistance system |
| %Rrs | respiratory system resistance |
| SAL | saline protocol |
| SAL-pep3- EcTI | saline group treated with peptide |
| TGF-β | transforming growth factor beta |
| Th2 | T-helper cells 2 |
| Th17 | T-helper cells 17 |
| TNF-α | tumor necrosis fator alpha |
References
- Global Initiative for Asthma Global Strategy for Asthma Management and Prevention. Available online: https://ginasthma.org/gina-reports/ (accessed on 15 July 2023).
- Global Initiative for Chronic Obstructive Lung Disease Global Strategy for Diagnosis, Management, and Prevention of Chronic Obstructive Pulmonary Disease (2023 Report). Available online: https://goldcopd.org/2023-gold-report-2/ (accessed on 20 May 2023).
- Górka, K.; Gross-Sondej, I.; Górka, J.; Stachura, T.; Polok, K.; Celejewska-Wójcik, N.; Mikrut, S.; Andrychiewicz, A.; Sładek, K.; Soja, J. Assessment of Airway Remodeling Using Endobronchial Ultrasound in Asthma-COPD Overlap. J. Asthma Allergy 2021, 14, 663–674. [Google Scholar] [CrossRef] [PubMed]
- Soler-Cataluña, J.J.; Novella, L.; Soler, C.; Nieto, M.L.; Esteban, V.; Sánchez-Toril, F.; Miravitlles, M. Clinical Characteristics and Risk of Exacerbations Associated with Different Diagnostic Criteria of Asthma-COPD Overlap. Arch. Bronconeumol. 2020, 56, 282–290. [Google Scholar] [CrossRef] [PubMed]
- Uchida, A.; Sakaue, K.; Inoue, H. Epidemiology of Asthma-chronic Obstructive Pulmonary Disease Overlap (ACO). Allergol. Int. 2018, 67, 165–171. [Google Scholar] [CrossRef] [PubMed]
- Fujino, N.; Sugiura, H. ACO (Asthma-COPD Overlap) Is Independent from COPD, a Case in Favor: A Systematic Review. Diagnostics 2021, 11, 859. [Google Scholar] [CrossRef]
- Miravitlles, M.; Soriano, J.B.; Ancochea, J.; Munoz, L.; Duran-Tauleria, E.; Sánchez, G.; Sobradillo, V.; García-Río, F. Characterisation of the Overlap COPD-asthma Phenotype. Focus on Physical Activity and Health Status. Respir. Med. 2013, 107, 1053–1060. [Google Scholar] [CrossRef]
- Barnes, P.J.; Dweik, R.A.; Gelb, A.F.; Gibson, P.G.; George, S.C.; Grasemann, H.; Pavord, I.D.; Ratjen, F.; Silkoff, P.E.; Taylor, D.R.; et al. Exhaled Nitric Oxide in Pulmonary Diseases: A Comprehensive Review. Chest 2010, 138, 682–692. [Google Scholar] [CrossRef]
- Rice, J.B.; White, A.G.; Scarpati, L.M.; Wan, G.; Nelson, W.W. Long-term Systemic Corticosteroid Exposure: A Systematic Literature Review. Clin. Ther. 2017, 39, 2216–2229. [Google Scholar] [CrossRef]
- Rodrigues, A.P.D.; Bortolozzo, A.S.S.; Arantes-Costa, F.M.; Saraiva-Romanholo, B.M.; de Souza, F.C.R.; Brüggemann, T.R.; Santana, F.P.R.; de Brito, M.V.; Bonturi, C.R.; Nunes, N.; et al. A plant proteinase inhibitor from Enterolobium contortisiliquum attenuates airway hyperresponsiveness, inflammation and remodeling in a mouse model of asthma. Histol. Histopathol. 2019, 34, 537–552. [Google Scholar]
- Batista, I.F.; Oliva, M.L.; Araujo, M.S.; Sampaio, M.U.; Richardson, M.; Fritz, H.; Sampaio, C.A. Primary structure of a Kunitz-type trypsin inhibitor from Enterolobium contortisiliquum seeds. Phytochemistry 1996, 41, 1017–1022. [Google Scholar] [CrossRef]
- Zhou, D.; Lobo, Y.A.; Batista, I.F.; Marques-Porto, R.; Gustchina, A.; Oliva, M.L.; Wlodawer, A. Crystal Structures of a Plant Trypsin Inhibitor from Enterolobium contortisiliquum (ECTI) and of its Complex with Bovine Trypsin. PLoS ONE 2013, 8, 62252. [Google Scholar] [CrossRef]
- Bonturi, C.R.; Silva Teixeira, A.B.; Rocha, V.M.; Valente, P.F.; Oliveira, J.R.; Filho, C.M.B.; Fátima Correia Batista, I.; Oliva, M.L.V. Plant Kunitz Inhibitors and Their Interaction with Proteases: Current and Potential Pharmacological Targets. Int. J. Mol. Sci. 2022, 23, 4742. [Google Scholar] [CrossRef]
- Bonturi, C.R.; Silva, M.C.C.; Motaln, H.; Salu, B.R.; Ferreira, R.D.S.; Batista, F.P.; Correia, M.; Paiva, P.M.G.; Turnšek, T.L.; Oliva, M.L.V. A Bifunctional Molecule with Lectin and Protease Inhibitor Activities Isolated from Crataeva tapia Bark Significantly Affects Cocultures of Mesenchymal Stem Cells and Glioblastoma Cells. Molecules 2019, 24, 2109. [Google Scholar] [CrossRef] [PubMed]
- Nakahata, A.M.; Mayer, B.; Ries, C.; de Paula, C.A.A.; Karow, M.; Neth, P.; Sampaio, M.U.; Jochum, M.; Oliva, M.L.V. The Effects of a Plant proteinase Inhibitor from Enterolobium contortisiliquum on Human Tumor Cell Lines. Biol. Chem. 2011, 392, 327–336. [Google Scholar] [CrossRef]
- Theodoro-Júnior, O.A.; Righetti, R.F.; Almeida-Reis, R.; Martins-Oliveira, B.T.; Oliva, L.V.; Prado, C.M.; Saraiva-Romanholo, B.M.; Leick, E.A.; Pinheiro, N.M.; Lobo, Y.A.; et al. A Plant Proteinase Inhibitor from Enterolobium contortisiliquum Attenuates Pulmonary Mechanics, Inflammation and Remodeling Induced by Elastase in Mice. Int. J. Mol. Sci. 2017, 18, 403. [Google Scholar] [CrossRef] [PubMed]
- Nunes, N.N.S.; Ferreira, R.S.; de Sá, L.F.R.; de Oliveira, A.E.A.; Oliva, M.L.V. A Novel Cysteine Proteinase Inhibitor from Seeds of Enterolobium contortisiliquum and its Effect on Callosobruchus maculatus. Biochem. Biophys. Rep. 2020, 25, 100876. [Google Scholar]
- Ikeda, G.; Miyahara, N.; Koga, H.; Fuchimoto, Y.; Waseda, K.; Kurimoto, E.; Taniguchi, A.; Tanimoto, Y.; Kataoka, M.; Tanimoto, M.; et al. Effect of a cysteinyl leukotriene receptor antagonist on experimental emphysema and asthma combined with emphysema. Am. J. Respir. Cell Mol. Biol. 2014, 50, 18–29. [Google Scholar] [CrossRef]
- Almeida-Reis, R.; Theodoro-Junior, O.A.; Oliveira, B.T.M.; Oliva, L.V.; Toledo-Arruda, A.C.; Bonturi, C.R.; Brito, M.V.; Lopes, F.; Prado, C.M.; Florencio, A.C.; et al. Plant Proteinase Inhibitor BbCI Modulates Lung Inflammatory Responses and Mechanic and Remodeling Alterations Induced by Elastase in Mice. Biomed. Res. Int. 2017, 2017, 8287125. [Google Scholar] [CrossRef]
- Silva, L.; Barbosa, J.A.S.; João, J.; Fukuzaki, S.; Camargo, L.D.N.; Dos Santos, T.M.; Campos, E.C.; Costa, A.S.; Saraiva-Romanholo, B.M.; Bezerra, S.K.M.; et al. Effects of a Peptide Derived from the Primary Sequence of a Kallikrein Inhibitor Isolated from Bauhinia bauhinioides (pep-BbKI) in an Asthma-COPD Overlap (ACO) Model. Int. J. Mol. Sci. 2023, 24, 11261. [Google Scholar] [CrossRef]
- Biselli, P.J.C.; Benini Kohler, J.; Righetti, R.; de Fátima Lopes Calvo Tibério, I.; de Arruda Martins, M.; Degobbi Tenorio Quirino dos Santos Lopes, F. Analysis of respiratory mechanics in animal models: Its use in understanding lung behavior in emphysema and asthma. Drug Discov. Today Dis. Models 2019, 29–30, 11–17. [Google Scholar] [CrossRef]
- Camargo, L.D.N.; Righetti, R.F.; Aristóteles, L.; Dos Santos, T.M.; de Souza, F.C.R.; Fukuzaki, S.; Cruz, M.M.; Alonso-Vale, M.I.C.; Saraiva-Romanholo, B.M.; Prado, C.M.; et al. Effects of Anti-IL-17 on Inflammation, Remodeling, and Oxidative Stress in an Experimental Model of Asthma Exacerbated by LPS. Front. Immunol. 2017, 8, 1835. [Google Scholar] [CrossRef]
- Hamid, Q.; Tulic, M. Immunobiology of asthma. Annu. Rev. Physiol. 2009, 71, 489–507. [Google Scholar] [CrossRef] [PubMed]
- Lin, C.C.; Lin, L.J.; Wang, S.D.; Chiang, C.J.; Chao, Y.P.; Lin, J.; Kao, S.T. The effect of serine protease inhibitors on airway inflammation in a chronic allergen-induced asthma mouse model. Mediators Inflamm. 2014, 2014, 879326. [Google Scholar] [CrossRef] [PubMed]
- Wong, C.K.; Ho, C.Y.; Ko, F.W.; Chan, C.H.; Ho, A.S.; Hui, D.S.; Lam, C.W. Proinflammatory cytokines (IL-17, IL-6, IL-18 and IL-12) and Th cytokines (IFN-γ, IL-4, IL-10 and IL-13) in patients with allergic asthma. Clin. Exp. Immunol. 2001, 125, 177–183. [Google Scholar] [CrossRef] [PubMed]
- Pauwels, N.S.; Bracke, K.R.; Dupont, L.L.; Van Pottelberge, G.R.; Provoost, S.; Vanden Berghe, T.; Vandenabeele, P.; Lambrecht, B.N.; Joos, G.F.; Brusselle, G.G. Role of IL-1α and the Nlrp3/caspase-1/IL-1β axis in cigarette smoke-induced pulmonary inflammation and COPD. Eur. Respir. J. 2011, 38, 1019–1028. [Google Scholar] [CrossRef]
- Rossios, C.; Pavlidis, S.; Hoda, U.; Kuo, C.H.; Wiegman, C.; Russell, K.; Sun, K.; Loza, M.J.; Baribaud, F.; Durham, A.L.; et al. Sputum transcriptomics reveal upregulation of IL-1 receptor family members in patients with severe asthma. J. Allergy Clin. Immunol. 2018, 141, 560–570. [Google Scholar] [CrossRef]
- Doe, C.; Bafadhel, M.; Siddiqui, S.; Desai, D.; Mistry, V.; Rugman, P.; McCormick, M.; Woods, J.; May, R.; Sleeman, M.A.; et al. Expression of the T helper 17-associated cytokines IL-17A and IL-17F in asthma and COPD. Chest 2010, 138, 1140–1147. [Google Scholar] [CrossRef]
- Fujii, U.; Miyahara, N.; Taniguchi, A.; Waseda, K.; Morichika, D.; Kurimoto, E.; Koga, H.; Kataoka, M.; Gelfand, E.W.; Cua, D.J.; et al. IL-23 Is Essential for the Development of Elastase-Induced Pulmonary Inflammation and Emphysema. Am. J. Respir. Cell Mol. Biol. 2016, 55, 697–707. [Google Scholar] [CrossRef]
- Huang, A.X.; Lu, L.W.; Liu, W.J.; Huang, M. Plasma Inflammatory Cytokine IL-4, IL-8, IL-10, and TNF-α Levels Correlate with Pulmonary Function in Patients with Asthma-Chronic Obstructive Pulmonary Disease (COPD) Overlap Syndrome. Med. Sci. Monit. 2016, 22, 2800–2808. [Google Scholar] [CrossRef]
- Kubysheva, N.; Boldina, M.; Eliseeva, T.; Soodaeva, S.; Klimanov, I.; Khaletskaya, A.; Bayrasheva, V.; Solovyev, V.; Villa-Vargas, L.A.; Ramírez-Salinas, M.A.; et al. Relationship of Serum Levels of IL-17, IL-18, TNF-α, and Lung Function Parameters in Patients with COPD, Asthma-COPD Overlap, and Bronchial Asthma. Mediat. Inflamm. 2020, 2020, 4652898. [Google Scholar] [CrossRef]
- Kharitonov, S.A.; Yates, D.H.; Barnes, P.J. Inhaled glucocorticoids decrease nitric oxide in exhaled air of asthmatic patients. Am. J. Respir. Crit. Care Med. 1996, 153, 454–457. [Google Scholar] [CrossRef]
- Eynott, P.R.; Groneberg, D.A.; Caramori, G.; Adcock, I.M.; Donnelly, L.E.; Kharitonov, S.; Barnes, P.J.; Chung, K.F. Role of nitric oxide in allergic inflammation and bronchial hyperresponsiveness. Eur. J. Pharmacol. 2002, 452, 123–133. [Google Scholar] [CrossRef] [PubMed]
- Bagnasco, D.; Ferrando, M.; Varricchi, G.; Passalacqua, G.; Canonica, G.W. A Critical Evaluation of Anti-IL-13 and Anti-IL-4 Strategies in Severe Asthma. Int. Arch. Allergy Immunol. 2016, 170, 122–131. [Google Scholar] [CrossRef] [PubMed]
- Li, M.; Yang, T.; He, R.; Li, A.; Dang, W.; Liu, X.; Chen, M. The Value of Inflammatory Biomarkers in Differentiating Asthma-COPD Overlap from COPD. Int. J. Chronic Obstr. Pulm. Dis. 2020, 15, 3025–3037. [Google Scholar] [CrossRef] [PubMed]
- Prado, C.M.; Yano, L.; Rocha, G.; Starling, C.M.; Capelozzi, V.L.; Leick-Maldonado, E.A.; Martins Mde, A.; Tibério, I.F. Effects of inducible nitric oxide synthase inhibition in bronchial vascular remodeling-induced by chronic allergic pulmonary inflammation. Exp. Lung Res. 2011, 37, 259–268. [Google Scholar] [CrossRef]
- Schuliga, M. NF-κB Signaling in Chronic Inflammatory Airway Disease. Biomolecules 2015, 5, 1266–1283. [Google Scholar] [CrossRef]
- Rico-Rosillo, G.; Vega-Robledo, G.B. The involvement of NF-?B Transcription factor in asthma. Rev. Alerg. Mex. 2011, 58, 107–111. [Google Scholar]
- National Research Council (US) Committee for the Update of the Guide for the Care and Use of Laboratory Animals. Guide for the Care and Use of Laboratory Animals, 8th ed.; National Academies Press (US): Washington, DC, USA, 2011. [Google Scholar]
- Toledo, A.C.; Sakoda, C.P.; Perini, A.; Pinheiro, N.M.; Magalhães, R.M.; Grecco, S.; Tibério, I.F.; Câmara, N.O.; Martins, M.A.; Lago, J.H.; et al. Flavonone treatment reverses airway inflammation and remodelling in an asthma murine model. Br. J. Pharmacol. 2013, 168, 1736–1749. [Google Scholar] [CrossRef]
- Weibel, E.R. The challenge of measuring lung structure. On the “Standars for the Quantitative Assessment of Lung Structure”. Nihon Kokyuki Gakkai Zasshi 2010, 48, 637–643. [Google Scholar]
- Taguchi, L.; Pinheiro, N.M.; Olivo, C.R.; Choqueta-Toledo, A.; Grecco, S.S.; Lopes, F.D.; Caperuto, L.C.; Martins, M.A.; Tiberio, I.F.; Câmara, N.O.; et al. A Flavanone from Baccharis Retusa (asteraceae) Prevents Elastase-induced Emphysema in Mice by Regulating NF-κB, Oxidative Stress and Metalloproteinases. Respir. Res. 2015, 16, 79. [Google Scholar] [CrossRef]
- Margraf, L.R.; Tomashefski, J.F., Jr.; Bruce, M.C.; Dahms, B.B. Morphometric Analysis of the Lung in Bronchopulmonary Dysplasia1-3. Am. Rev. Respir. Dis. 1991, 143, 391–400. [Google Scholar] [CrossRef]
- Hsia, C.C.; Hyde, D.M.; Ochs, M.; Weibel, E.R. An Official Research Policy Statement of the American Thoracic Society/European Respiratory Society: Standards for Quantitative Assessment of Lung Structure. Am. J. Respir. Crit. Care Med. 2010, 181, 394–418. [Google Scholar] [CrossRef] [PubMed]
- Arantes, M. Efeitos Pulmonares da Fumaça de Cigarro Associada ao Particulado de Diesel Exaurido (dep) em Camundongos. Ph.D. Thesis, Universidade de São Paulo, São Paulo, Brazil, 2015. [Google Scholar]


| SAL | OVA | ELA | ACO | ACO-pep3-EcTI | ACO-DX | ACO-DX-pep3-EcTI | |
|---|---|---|---|---|---|---|---|
| Linear mean intercept (µm) | |||||||
| Linear mean intercept (µm) | 27.27 ± 2.81 | 29.16 ± 1.85 | 42.79 ± 1.94 * | 59.27 ± 1.97 */$ | 25.81 ± 0.95 ** | 29.30 ± 1.31 ** | 27.80 ± 1.40 ** |
| SAL | OVA | ELA | ACO | ACO-pep3-EcTI | ACO-DX | ACO-DX-pep3-EcTI | |
|---|---|---|---|---|---|---|---|
| Inflammatory markers (cells/104 µm2) | |||||||
| IL-1β—Airway | 0.41 ± 0.12 | 4.26 ± 0.44 */$ | 1.26 ± 0.24 | 5.97 ± 0.56 */#/$ | 2.91 ± 0.43 */** | 1.43 ± 0.30 ** | 2.79 ± 0.31 */** |
| IL-1β—Alveolar septa | 0.47 ± 0.17 | 2.63 ± 0.29 */$ | 0.91 ± 0.22 | 4.06 ± 3.22 */$ | 0.87 ± 0.17 ** | 0.73 ± 0.19 ** | 1.52 ± 0.27 +/++ |
| IL-4—Airway | 1.56 ± 0.56 | 10.42 ± 1.09 * | 3.07 ± 0.88 | 12.25 ± 2.30 */# | 8.23 ± 1.09 * | 7.44 ± 1.12 */** | 6.35 ± 0.85 */** |
| IL-4—Alveolar septa | 1.77 ± 0.34 | 10.36 ± 0.59 */$ | 4.78 ± 0.68 */# | 7.94 ± 0.77 */#/$ | 4.43 ± 0.53 */** | 6.48 ± 0.51 * | 4.66 ± 0.46 */** |
| IL-5—Airway | 1.63 ± 0.24 | 11.08 ± 0.76 */$ | 6.10 ± 0.45 */# | 10.11 ± 0.65 */$/# | 3.71 ± 0.43 */** | 5.78 ± 0.38 */**/+/+++ | 3.48 ± 0.46 */** |
| IL-5—Alveolar septa | 1.25 ± 0.19 | 4.41 ± 0.37 */$ | 2.93 ± 0.64 */# | 8.00 ± 0.47 */#/$ | 1.42 ± 0.36 ** | 2.08 ± 0.23 */**/+++ | 0.82 ± 0.14 ** |
| IL-6—Airway | 1.08 ± 0.59 | 8.3 ± 0.54 * | 5.5 ± 0.41 */# | 7.42 ± 0.67 */$ | 1.67 ± 0.24 ** | 2.2 ± 0.35 ** | 2.16 ± 0.27 ** |
| IL-6—Alveolar septa | 0.48 ± 0.17 | 6.62 ± 0.45 * | 7.20 ± 0.53 * | 12.3 ± 1.34 */#/$ | 1.86 ± 0.32 */** | 1.74 ± 0.32 */** | 1.88 ± 0.25 */** |
| IL-10—Airway | 2.13 ± 0.29 | 3.37 ± 0.29 * | 4.06 ± 0.35 * | 5.06 ± 0.40 */#/$ | 2.31 ± 0.26 ** | 3.78 ± 0.29 */**/+/+++ | 2.56 ± 0.24 ** |
| IL-10—Alveolar septa | 3.26 ± 0.32 | 4.51 ± 0.32 * | 5.59 ± 0.40 * | 6.6 ± 0.40 */# | 2.63 ± 0.50 ** | 3.61 ± 0.39 ** | 3.00 ± 0.34 ** |
| IL-13—Airway | 2.76 ± 0.34 | 10.4 ± 0.76 * | 8.40 ± 0.78 * | 11.60 ± 0.59 */$ | 9.18 ± 0.65 */** | 7.63 ± 0.64 */** | 5.94 ± 0.45 */**/+ |
| IL-13—Alveolar septa | 3.18 ± 0.43 | 9.17 ± 0.58 */$ | 6.71 ± 0.65 */# | 16.9 ± 1.52 */#/$ | 3.75 ± 0.34 ** | 4.22 ± 0.37 ** | 6.09 ± 0.44 */**/+/++ |
| IL-17—Airway | 2.88 ± 0.23 | 5.16 ± 0.35 * | 6.49 ± 0.30 * | 7.33 ± 0.47 */# | 2.90 ± 0.34 | 4.06 ± 0.31 */** | 2.77 ± 0.31 ** |
| IL-17—Alveolar septa | 2.85 ± 0.31 | 6.49 ± 0.34 * | 8.15 ± 0.48 */# | 8.41 ± 0.59 */# | 4.59 ± 0.69 ** | 4.92 ± 0.35 */** | 3.97 ± 0.66 */** |
| INF-γ—Airway | 1.02 ± 01.98 | 2.13 ± 0.28 | 3.37 ± 0.43 * | 6.27 ± 0.74 */#/$ | 1.33 ± 0.25 */**/+ | 0.29 ± 0.08 ** | 2.23 ± 0.08 */** |
| INF-γ—Alveolar septa | 0.88 ± 0.26 | 2.96 ± 0.34 * | 2.67 ± 0.39 * | 3.19 ± 0.35 * | 1.72 ± 0.42 | 1.12 ± 0.28 ** | 2.90 ± 0.20 */++ |
| SAL | OVA | ELA | ACO | ACO-pep3-EcTI | ACO-DX | ACO-DX-pep3-EcTI | |
|---|---|---|---|---|---|---|---|
| Oxidative stress markers | |||||||
| iNOS—Airway (cells/104 µm2) | 3.34 ± 0.59 | 9.91 ± 1.28 * | 11.79 ± 0.93 */** | 8.61 ± 0.48 */$ | 2.65 ± 0.34 ** | 3.34 ± 0.30 ** | 3.43 ± 0.39 ** |
| iNOS—Alveolar septa (cells/104 µm2) | 2.62 ± 0.38 | 8.36 ± 0.90 * | 8.72 ± 0.62 * | 9.41 ± 0.49 * | 2.15 ± 0.26 ** | 2.85 ± 0.29 ** | 3.33 ± 0.30 ** |
| eNO—Alveolar septa (ppb) | 12.06 ± 1.52 | 32.41 ± 4.65 | 23.50 ± 3.91 | 41.00 ± 5.155 | 16.56 ± 5.15 | 23.10 ± 4.31 | 17.04 ± 2.03 |
| NF-κB—Airway (cells/104 µm2) | 0.57 ± 0.19 | 6.74 ± 0.61 * | 8.62 ± 0.77 * | 6.55 ± 0.38 */$ | 2.69 ± 0.32 */** | 2.28 ± 0.24 */** | 3.16 ± 0.32 */** |
| NF-κB—Alveolar septa (cells/104 µm2) | 0.34 ± 0.18 | 6.26 ± 0.47 * | 9.06 ± 0.55 */# | 5.91 ± 0.44 */$ | 2.02 ± 0.25 ** | 2.00 ± 0.29 */** | 2.92 ± 0.38 */** |
| SAL | OVA | ELA | ACO | ACO-pep3-EcTI | ACO-DX | ACO-DX-pep3-ECTI | |
|---|---|---|---|---|---|---|---|
| Remodeling markers (cells/104 µm2) | |||||||
| MMP-9—Airway | 0.20 ± 0.03 | 3.06 ± 0.10 */$ | 5.36 ± 0.17 * | 10.27 ± 0.27 */#/$ | 2.43 ± 0.15 */** | 2.09 ± 0.08 */** | 2.15 ± 0.11 */** |
| MMP-9—Alveolar septa | 0.08 ± 0.12 | 2.11 ± 0.81 */$ | 4.43 ± 0.12 */# | 8.74 ± 0.31 */#/$ | 2.63 ± 0.26 */** | 2.36 ± 0.14 */** | 1.95 ± 0.20 */** |
| MMP-12—Airway | 1.98 ± 0.37 | 1.97 ± 0.28 | 2,12 ± 0.38 | 3,31 ± 0.38 */# | 3.09 ± 0.41 +++ | 1.02 ± 0.18 ** | 1.55 ± 0.30 ** |
| MMP-12—Alveolar septa | 0.66 ± 0.19 | 0.43 ± 0.17 | 2.73 ± 0.39 */# | 5.73 ± 0.49 */#/$ | 5.73 ± 0.49 ** | 2.37 ± 0.27 ** | 3.24 ± 0.39 ** |
| TGF-β—Airway | 2.05 ± 0.74 | 5.57 ± 1.16 | 2.77 ± 0.40 | 7.06 ± 0.99 */$ | 3.97 ± 0.50 ** | 3.68 ± 0.45 ** | 3.45 ± 0.65 ** |
| TGF-β—Alveolar septa | 0.26 ± 0.18 | 4.85 ± 0.30 * | 2.85 ± 0.48 | 7.22 ± 0.99 */$ | 2.09 ± 0.30 ** | 1.06 ± 0.28 ** | 1.88 ± 0.2 1** |
| Collagen Fibers—Airway | 1.63 ± 0.41 | 12.56 ± 0.40 */$ | 0.38 ± 0.10 * | 13.76 ± 1.62 */#/$ | 0.68 ± 0.22 ** | 1.38 ± 0.23 ** | 1.93 ± 0.3 **/+ |
| Collagen Fibers—Alveolar septa | 2.46 ± 0.24 | 11.37 ± 0.36 */**/$ | 3.9 ± 0.57 | 9.0 ± 0.87 */#/$ | 2.04 ± 0.16 ** | 5.76 ± 0.79 */**/+/+++ | 2.44 ± 0.20 ** |
| Markers | Specifications of the Primary Antibody | Dilutions | Specifications of the Secondary Antibody | Secondary Antibody |
|---|---|---|---|---|
| IL-1β | SC-52012, L: A0719; Santa Cruz Biotechnology, Santa Cruz, CA, USA | 1:50 | L: ZG0715, Vector; Vectastain Elite ABC Kit Peroxidase (mouse IgG), Newark, CA, USA | Anti-mouse |
| IL-4 | SC-53084, L: J1518; Santa Cruz Biotechnology, Santa Cruz, CA, USA | 1:8000 | L: ZF0206, Vector; Vectastain Elite ABC Kit Peroxidase (mouse IgG), Newark, CA, USA | Anti-mouse |
| IL-5 | SC-398334, L: F1617; Santa Cruz Biotechnology, Santa Cruz, CA, USA | 1:300 | L: ZF0206, Vector; Vectastain Elite ABC Kit Peroxidase (mouse IgG), Newark, CA, USA | Anti-mouse |
| IL-6 | LS-C746886, L: 144178; LSBIO, Seattle, WA, USA | 1:200 | L: ZF0103, Vector; Vectastin Elite ABC Kit (rabbit IgG), Newark, CA, USA | Anti-rabbit |
| IL-10 | SC8438; Santa Cruz Biotechnology, Santa Cruz, CA, USA | 1:50 | L: ZF0206, Vector; Vectastain Elite ABC Kit Peroxidase (mouse IgG), Newark, CA, USA | Anti-mouse |
| IL-13 | SC-393365, L: G1715; Santa Cruz Biotechnology, Santa Cruz, CA, USA | 1:8000 | L: ZF0206, Vector; Vectastain Elite ABC Kit Peroxidase (mouse IgG), Newark, CA, USA | Anti-mouse |
| IL-17 | SC7927, L: A3113; Santa Cruz Biotechnology, Santa Cruz, CA, USA | 1:100 | L: ZF0103, Vector; Vectastin Elite ABC Kit (rabbit IgG), Newark, CA, USA | Anti-rabbit |
| TNF-α | SC-52746, L: J2418; Santa Cruz Biotechnology, Santa Cruz, CA, USA | 1:5000 | L: ZF0206, Vector; Vectastain Elite ABC Kit Peroxidase (mouse IgG), Newark, CA, USA | Anti-mouse |
| IFN-γ | SC-8308, L: B2811; Santa Cruz Biotechnology, Santa Cruz, CA, USA | 1:100 | L: ZF0103, Vector; Vectastin Elite ABC Kit (rabbit IgG), Newark, CA, USA | Anti-rabbit |
| MMP-9 | SC-393859, L:6118; Santa Cruz Biotechnology, Santa Cruz, CA, USA | 1:800 | L: ZF0206, Vector; Vectastain Elite ABC Kit Peroxidase (mouse IgG), Newark, CA, USA | Anti-mouse |
| MMP-12 | SC30072, L: B1910; Santa Cruz Biotechnology, Santa Cruz, CA, USA | 1:400 | L: ZF0103, Vector; Vectastin Elite ABC Kit (rabbit IgG), Newark, CA, USA | Anti-rabbit |
| TGF-β | SC-130348, L: A0219; Santa Cruz Biotechnology, Santa Cruz, CA, USA | 1:700 | L: ZF0206, Vector; Vectastain Elite ABC Kit Peroxidase (mouse IgG), Newark, CA, USA | Anti-mouse |
| iNOS | RB-9242-P, L: 9242P709; Thermo Fisher Scientific, Runcorn, UK | 1:150 | Thermo Fisher Scientific UK L: ZF0103, Vector; Vectastin Elite ABC Kit (rabbit IgG), Newark, CA, USA | Anti-rabbit |
| NF-κB | SC-8008, L: B1119; Santa Cruz Biotechnology, Santa Cruz, CA, USA | 1:700 | L: ZF0206, Vector; Vectastain Elite ABC Kit Peroxidase (mouse IgG), Newark, CA, USA | Anti-mouse |
Disclaimer/Publisher’s Note: The statements, opinions and data contained in all publications are solely those of the individual author(s) and contributor(s) and not of MDPI and/or the editor(s). MDPI and/or the editor(s) disclaim responsibility for any injury to people or property resulting from any ideas, methods, instructions or products referred to in the content. |
© 2023 by the authors. Licensee MDPI, Basel, Switzerland. This article is an open access article distributed under the terms and conditions of the Creative Commons Attribution (CC BY) license (https://creativecommons.org/licenses/by/4.0/).
Share and Cite
Barbosa, J.A.S.; da Silva, L.L.S.; João, J.M.L.G.; de Campos, E.C.; Fukuzaki, S.; Camargo, L.d.N.; dos Santos, T.M.; dos Santos, H.T.; Bezerra, S.K.M.; Saraiva-Romanholo, B.M.; et al. Investigating the Effects of a New Peptide, Derived from the Enterolobium contortisiliquum Proteinase Inhibitor (EcTI), on Inflammation, Remodeling, and Oxidative Stress in an Experimental Mouse Model of Asthma–Chronic Obstructive Pulmonary Disease Overlap (ACO). Int. J. Mol. Sci. 2023, 24, 14710. https://doi.org/10.3390/ijms241914710
Barbosa JAS, da Silva LLS, João JMLG, de Campos EC, Fukuzaki S, Camargo LdN, dos Santos TM, dos Santos HT, Bezerra SKM, Saraiva-Romanholo BM, et al. Investigating the Effects of a New Peptide, Derived from the Enterolobium contortisiliquum Proteinase Inhibitor (EcTI), on Inflammation, Remodeling, and Oxidative Stress in an Experimental Mouse Model of Asthma–Chronic Obstructive Pulmonary Disease Overlap (ACO). International Journal of Molecular Sciences. 2023; 24(19):14710. https://doi.org/10.3390/ijms241914710
Chicago/Turabian StyleBarbosa, Jéssica Anastácia Silva, Luana Laura Sales da Silva, Juliana Morelli Lopes Gonçalves João, Elaine Cristina de Campos, Silvia Fukuzaki, Leandro do Nascimento Camargo, Tabata Maruyama dos Santos, Henrique Tibucheski dos Santos, Suellen Karoline Moreira Bezerra, Beatriz Mangueira Saraiva-Romanholo, and et al. 2023. "Investigating the Effects of a New Peptide, Derived from the Enterolobium contortisiliquum Proteinase Inhibitor (EcTI), on Inflammation, Remodeling, and Oxidative Stress in an Experimental Mouse Model of Asthma–Chronic Obstructive Pulmonary Disease Overlap (ACO)" International Journal of Molecular Sciences 24, no. 19: 14710. https://doi.org/10.3390/ijms241914710
APA StyleBarbosa, J. A. S., da Silva, L. L. S., João, J. M. L. G., de Campos, E. C., Fukuzaki, S., Camargo, L. d. N., dos Santos, T. M., dos Santos, H. T., Bezerra, S. K. M., Saraiva-Romanholo, B. M., Lopes, F. D. T. Q. d. S., Bonturi, C. R., Oliva, M. L. V., Leick, E. A., Righetti, R. F., & Tibério, I. d. F. L. C. (2023). Investigating the Effects of a New Peptide, Derived from the Enterolobium contortisiliquum Proteinase Inhibitor (EcTI), on Inflammation, Remodeling, and Oxidative Stress in an Experimental Mouse Model of Asthma–Chronic Obstructive Pulmonary Disease Overlap (ACO). International Journal of Molecular Sciences, 24(19), 14710. https://doi.org/10.3390/ijms241914710