Article

Is HOXA5 a Novel Prognostic Biomarker for Uterine Corpus Endometrioid Adenocarcinoma?

1
Department of Obstetrics and Gynecology, University of Ulsan College of Medicine, Ulsan University Hospital, Ulsan 44033, Republic of Korea
2
Department of Laboratory Medicine, Keimyung University School of Medicine, Daegu 42601, Republic of Korea
3
Department of Obstetrics and Gynecology, Keimyung University School of Medicine, Daegu 42601, Republic of Korea
4
Department of Pediatrics, Keimyung University School of Medicine, Daegu 42601, Republic of Korea
5
Department of Radiology, Keimyung University School of Medicine, Daegu 42601, Republic of Korea
*
Author to whom correspondence should be addressed.
Int. J. Mol. Sci. 2023, 24(19), 14758; https://doi.org/10.3390/ijms241914758
Submission received: 8 August 2023 / Revised: 26 September 2023 / Accepted: 26 September 2023 / Published: 29 September 2023

Abstract

:
Endometrial cancer (EC) is one of the most pervasive malignancies in females worldwide. HOXA5 is a member of the homeobox (HOX) family and encodes the HOXA5 protein. HOXA5 is associated with various cancers; however, its association with EC remains unclear. This study aimed to determine the association between HOXA5 gene expression and the prognosis of endometrioid adenocarcinoma, a subtype of EC (EAEC). Microarray data of HOXA5 were collected from the Gene Expression Omnibus datasets, consisting of 79 samples from GSE17025 and 20 samples from GSE29981. RNA-sequencing, clinical, and survival data on EC were obtained from The Cancer Genome Atlas cohort. Survival analysis revealed that HOXA5 overexpression was associated with poor overall survival in patients with EAEC (p = 0.044, HR = 1.832, 95% CI = 1.006–3.334). Cox regression analysis revealed that HOXA5 was an independent risk factor for poor prognosis in EAEC. The overexpression of HOXA5 was associated with a higher histological grade of EAEC, and it was also associated with TP53 mutation or the high copy number of EC. Our findings suggest the potential of HOXA5 as a novel biomarker for predicting poor survival outcomes in patients with EAEC.

1. Introduction

Endometrial cancer (EC), or uterine cancer, is one of the most prevalent malignancies in females worldwide. In 2020, a total of 417,367 new uterine cancer cases were diagnosed worldwide [1]. The known risk factors for EC include unopposed estrogen exposure, old age, obesity, diabetes mellitus, and atypical endometrial hyperplasia [2,3]. Increases in the use of hormone replacement therapy (HRT), life expectancy, and the prevalence of obesity have led to a global increase in the incidence of EC [4,5]. Fortunately, symptoms of EC, such as vaginal bleeding, tend to present early, resulting in early diagnosis [6,7] and thus early treatment, which greatly improves prognoses [8]. However, even with early diagnosis, certain clinicopathological factors indicate high recurrence rates and poor treatment outcomes [9,10]. The serous adenocarcinoma histologic subtype of EC (SAEC) and high histological grade are common independent risk factors for EC recurrence and are associated with poor survival rates [11,12]. Traditionally, these morphological features have been key factors in assessing the risk of EC recurrence [13]. However, pathologically distinguishing between high-grade EC and SAEC can be challenging [14]. A precise pathological diagnosis is crucial for clinicians when making treatment decisions because early stage high-grade EC may only require adjuvant radiation therapy, whereas SAEC tends to metastasize early and may require systemic chemotherapy even in the early stages [15]. Recent research has enabled the division of EC into four subtypes based on risk stratification according to their molecular features [16]. These four distinct molecular subtypes include DNA polymerase epsilon (POLE) mutations, microsatellite-unstable or mismatch repair deficiency (MSI-h/MMRd), microsatellite-stable (MSS) or low- and high-copy-number ECs, and TP53 mutation or high-copy-number EC [17,18]. Developing these molecular subclassifications improves our understanding of EC diagnostic modalities and creates a potential opportunity for producing targeted therapies [19]. Despite these developments, risk stratification according to molecular variations remains not fully understood.
Homeobox (HOX) genes play substantial roles in cell differentiation and embryogenesis [20,21]. HOXA5 is a member of the HOX family and encodes the HOXA5 protein [22]. HOXA5 inhibits the wingless (Wnt) signaling pathway, and aberrant HOXA5 expression affects tumor cell proliferation, differentiation, invasion, and apoptosis [23,24]. HOXA5 is also associated with various cancers. Hussain et al. reported that HOXA5 expression is elevated in breast cancer [25], and Zhang et al. reported that HOXA5 expression is associated with a poor prognosis in non-small cell lung cancer [26]. Peng et al. reported that HOXA5 is a tumor suppressor gene in gastric cancer [27]. A relationship between HOXA5 and gynecological cancer has also been reported. The downregulation of HOXA5 is associated with poorly differentiated cervical cancer [28,29], and HOXA5 is downregulated in grade 1 EC. However, the association between EC and HOXA5 gene is not yet fully understood [30].
In this study, we investigated the relationship between HOXA5 gene expression and EC prognosis, focusing on the endometrioid adenocarcinoma subtype of EC (EAEC). Additionally, we aimed to integrate HOXA5 gene expression into the traditional classification system based on the molecular subtype of EC. This research may be crucial in contributing to our understanding of the molecular mechanisms underlying endometrial cancer and may pave the way for more accurate prognostic assessments and personalized treatment strategies.

2. Results

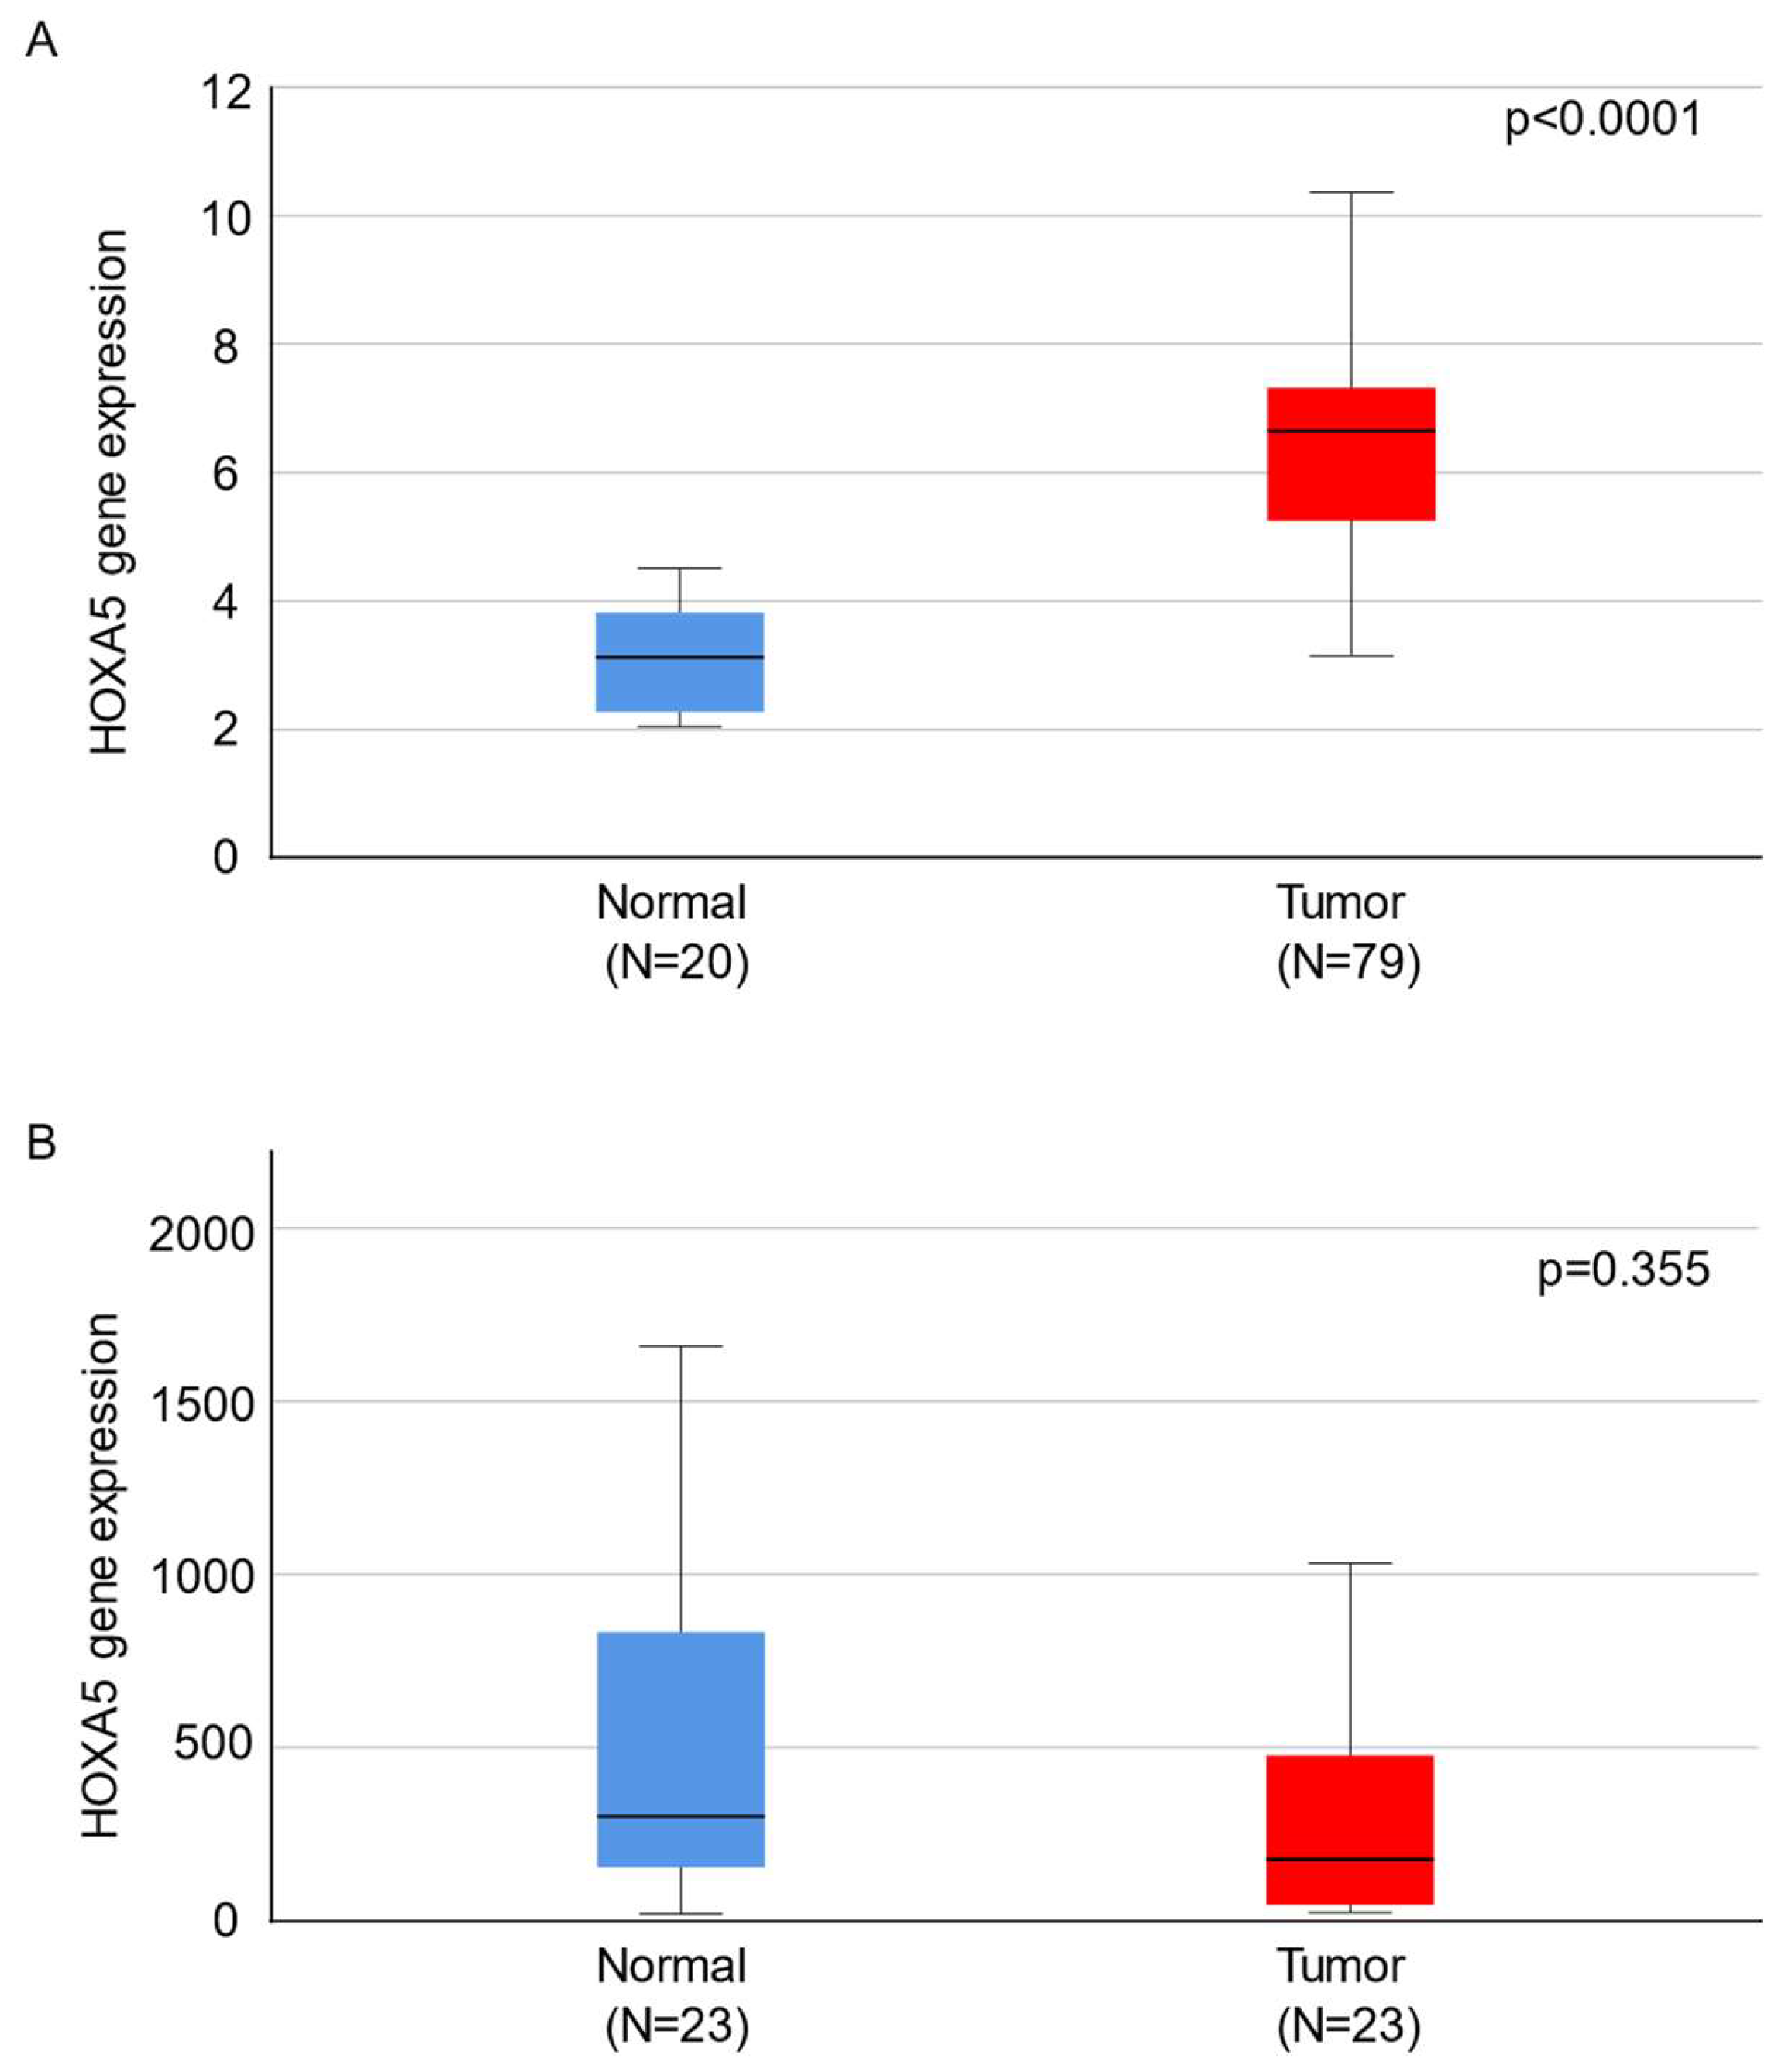
2.1. HOXA5 Is Overexpressed in Endometrial Cancer Tissues

HOXA5 expression in normal and cancerous tissues was analyzed using data from the Gene Expression Omnibus datasets GSE17025 and GSE29981. The GSE17025 dataset included data from 79 patients with stage I EAEC. These diagnoses were substantiated by the Federation of International Gynecology and Obstetrics (FIGO). The 79 samples included 30 grade 1, 33 grade 2, and 16 grade 3 cancer tissues. The dataset GSE29981 included data from 20 healthy endometrial tissue samples. The data for each sample set were merged and normalized before comparing the mean expression levels of the HOXA5 gene. The results showed that the expression level of HOXA5 was significantly higher in cancer tissues than in normal tissues (Figure 1A). Next, we compared the HOXA5 gene expression levels in tissue samples from 23 patients with EC and their paired adjacent normal endometrial tissues. The data were obtained from the TNM plotter online platform (https://TNMplot.com, accessed on 31 August 2023). The expression level of HOXA5 in EC tissue with adjacent normal endometrial tissue was not significantly different (Figure 1B).

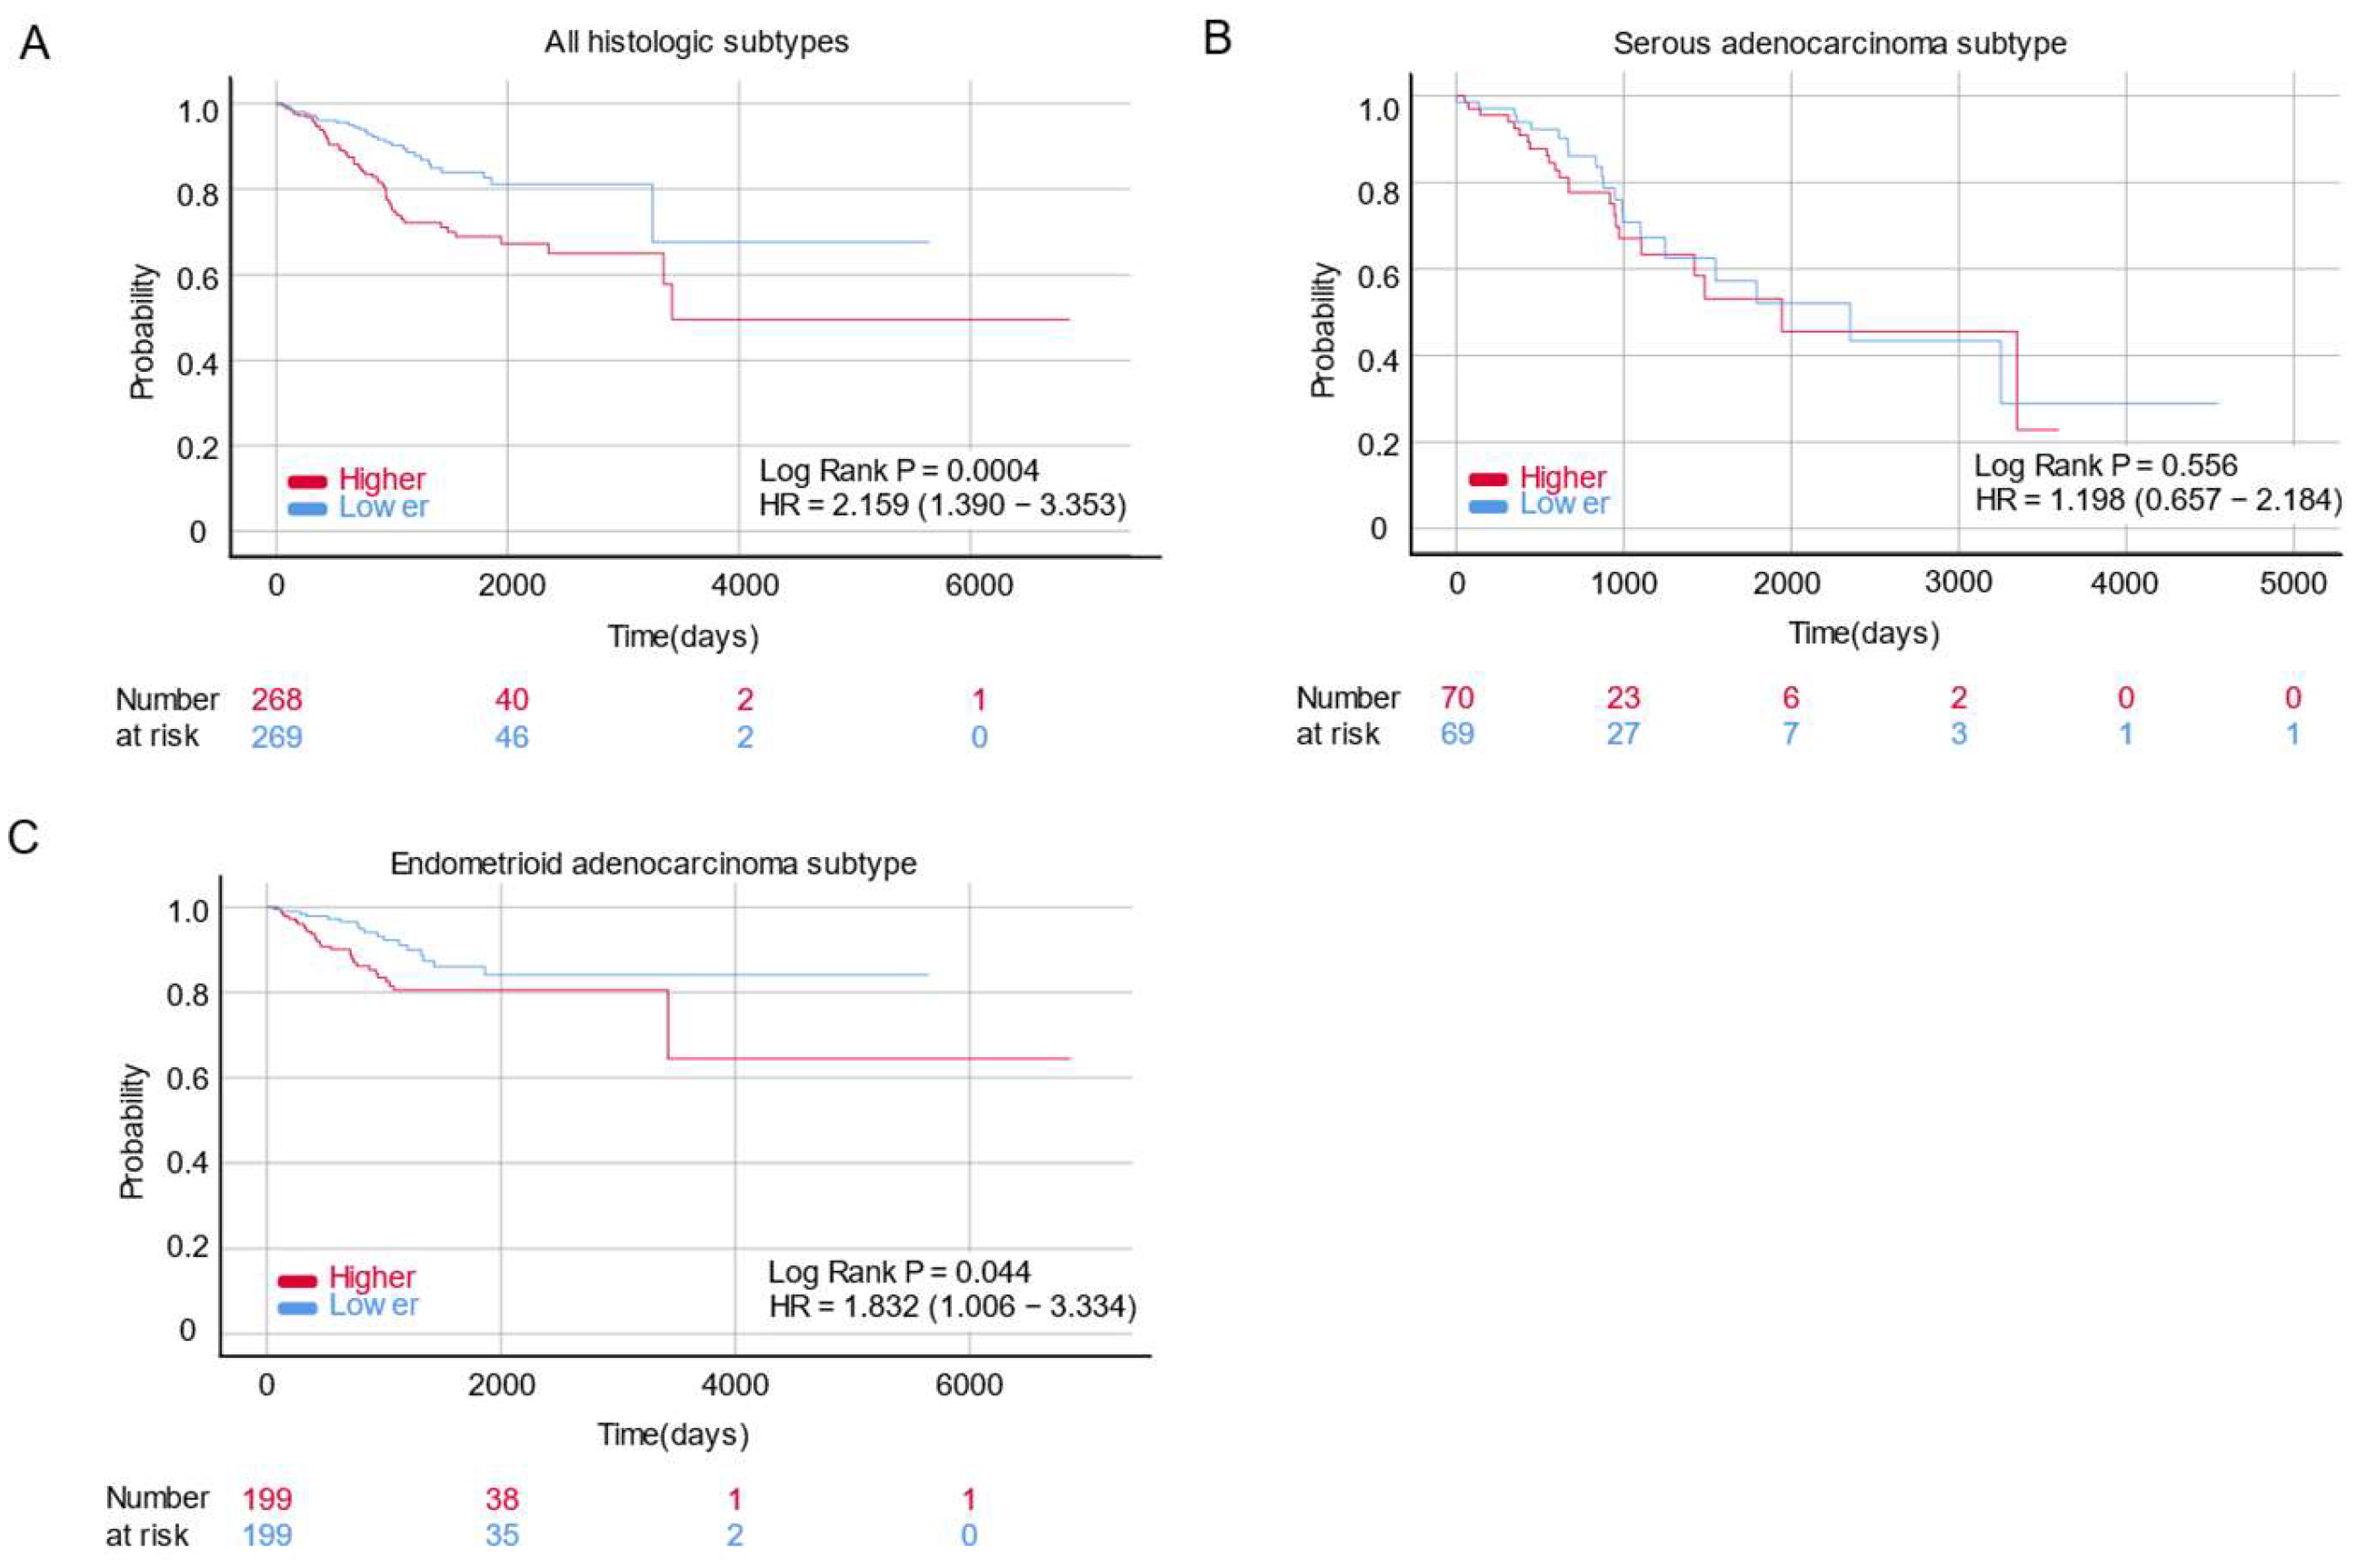
2.2. HOXA5 Is Associated with Poor Survival in Patients with Endometrial Cancer

The survival data of patients with EC in The Cancer Genome Atlas (TCGA) cohort were subjected to Kaplan–Meier survival analysis using the R survival package. After excluding unavailable gene expression and survival data, 537 patients were included: 196 SAEC and 398 EAEC patients. From the 537 patients with all histological subtypes, we compared 268 patients displaying HOXA5 overexpression and 269 patients demonstrating low expression levels of HOXA5. The results showed that the overexpression of HOXA5 was associated with poor overall survival (OS) in all histological subtypes of EC (p = 0.0004, hazard ratio (HR) = 2.159, 95% confidence interval (CI) = 1.390–3.353) (Figure 2). We then compared 199 patients who demonstrated the overexpression of the HOXA5 gene and 199 patients who showed lower HOXA5 gene expression in EAEC, as well as 70 patients who overexpressed the HOXA5 gene and 69 patients who showed a lower expression of the HOXA5 gene in SAEC. According to each histologic subtype, survival analyses showed that HOXA5 was not associated with OS in SAEC (p = 0.556, HR = 1.198, 95% CI = 0.657–2.184) but was associated with poor OS in EAEC (p = 0.044, HR = 1.832, 95% CI = 1.006–3.334) (Figure 2). The result of the Cox regression analysis of EAEC patients is presented in Table 1. In the univariate analysis, a higher expression of HOXA5, clinical stage, histologic grade and positive cytology were all associated with poorer OS (HOXA5 expression, HR = 2.368, 95% CI = 1.376–4.077, p = 0.002; clinical stage, HR = 4.763, 95% CI = 2.862–7.926, p < 0.0001; histologic grade, HR = 3.405, 95% CI = 1.809–6.410, p < 0.0001; positive cytology, HR = 6.615, 95% CI = 3.739–11.703, p < 0.0001, respectively). In the multivariate analysis, higher HOXA5 expression, clinical stage, and positive cytology were identified as independent prognostic factor for poor OS (HOXA5 expression, HR = 2.228, 95% CI = 1.112–4.465, p = 0.024; clinical stage, HR = 3.297, 95% CI = 1.652–6.577, p = 0.001; positive cytology, HR = 2.667, 95% CI = 1.351–5.265, p = 0.005, respectively).

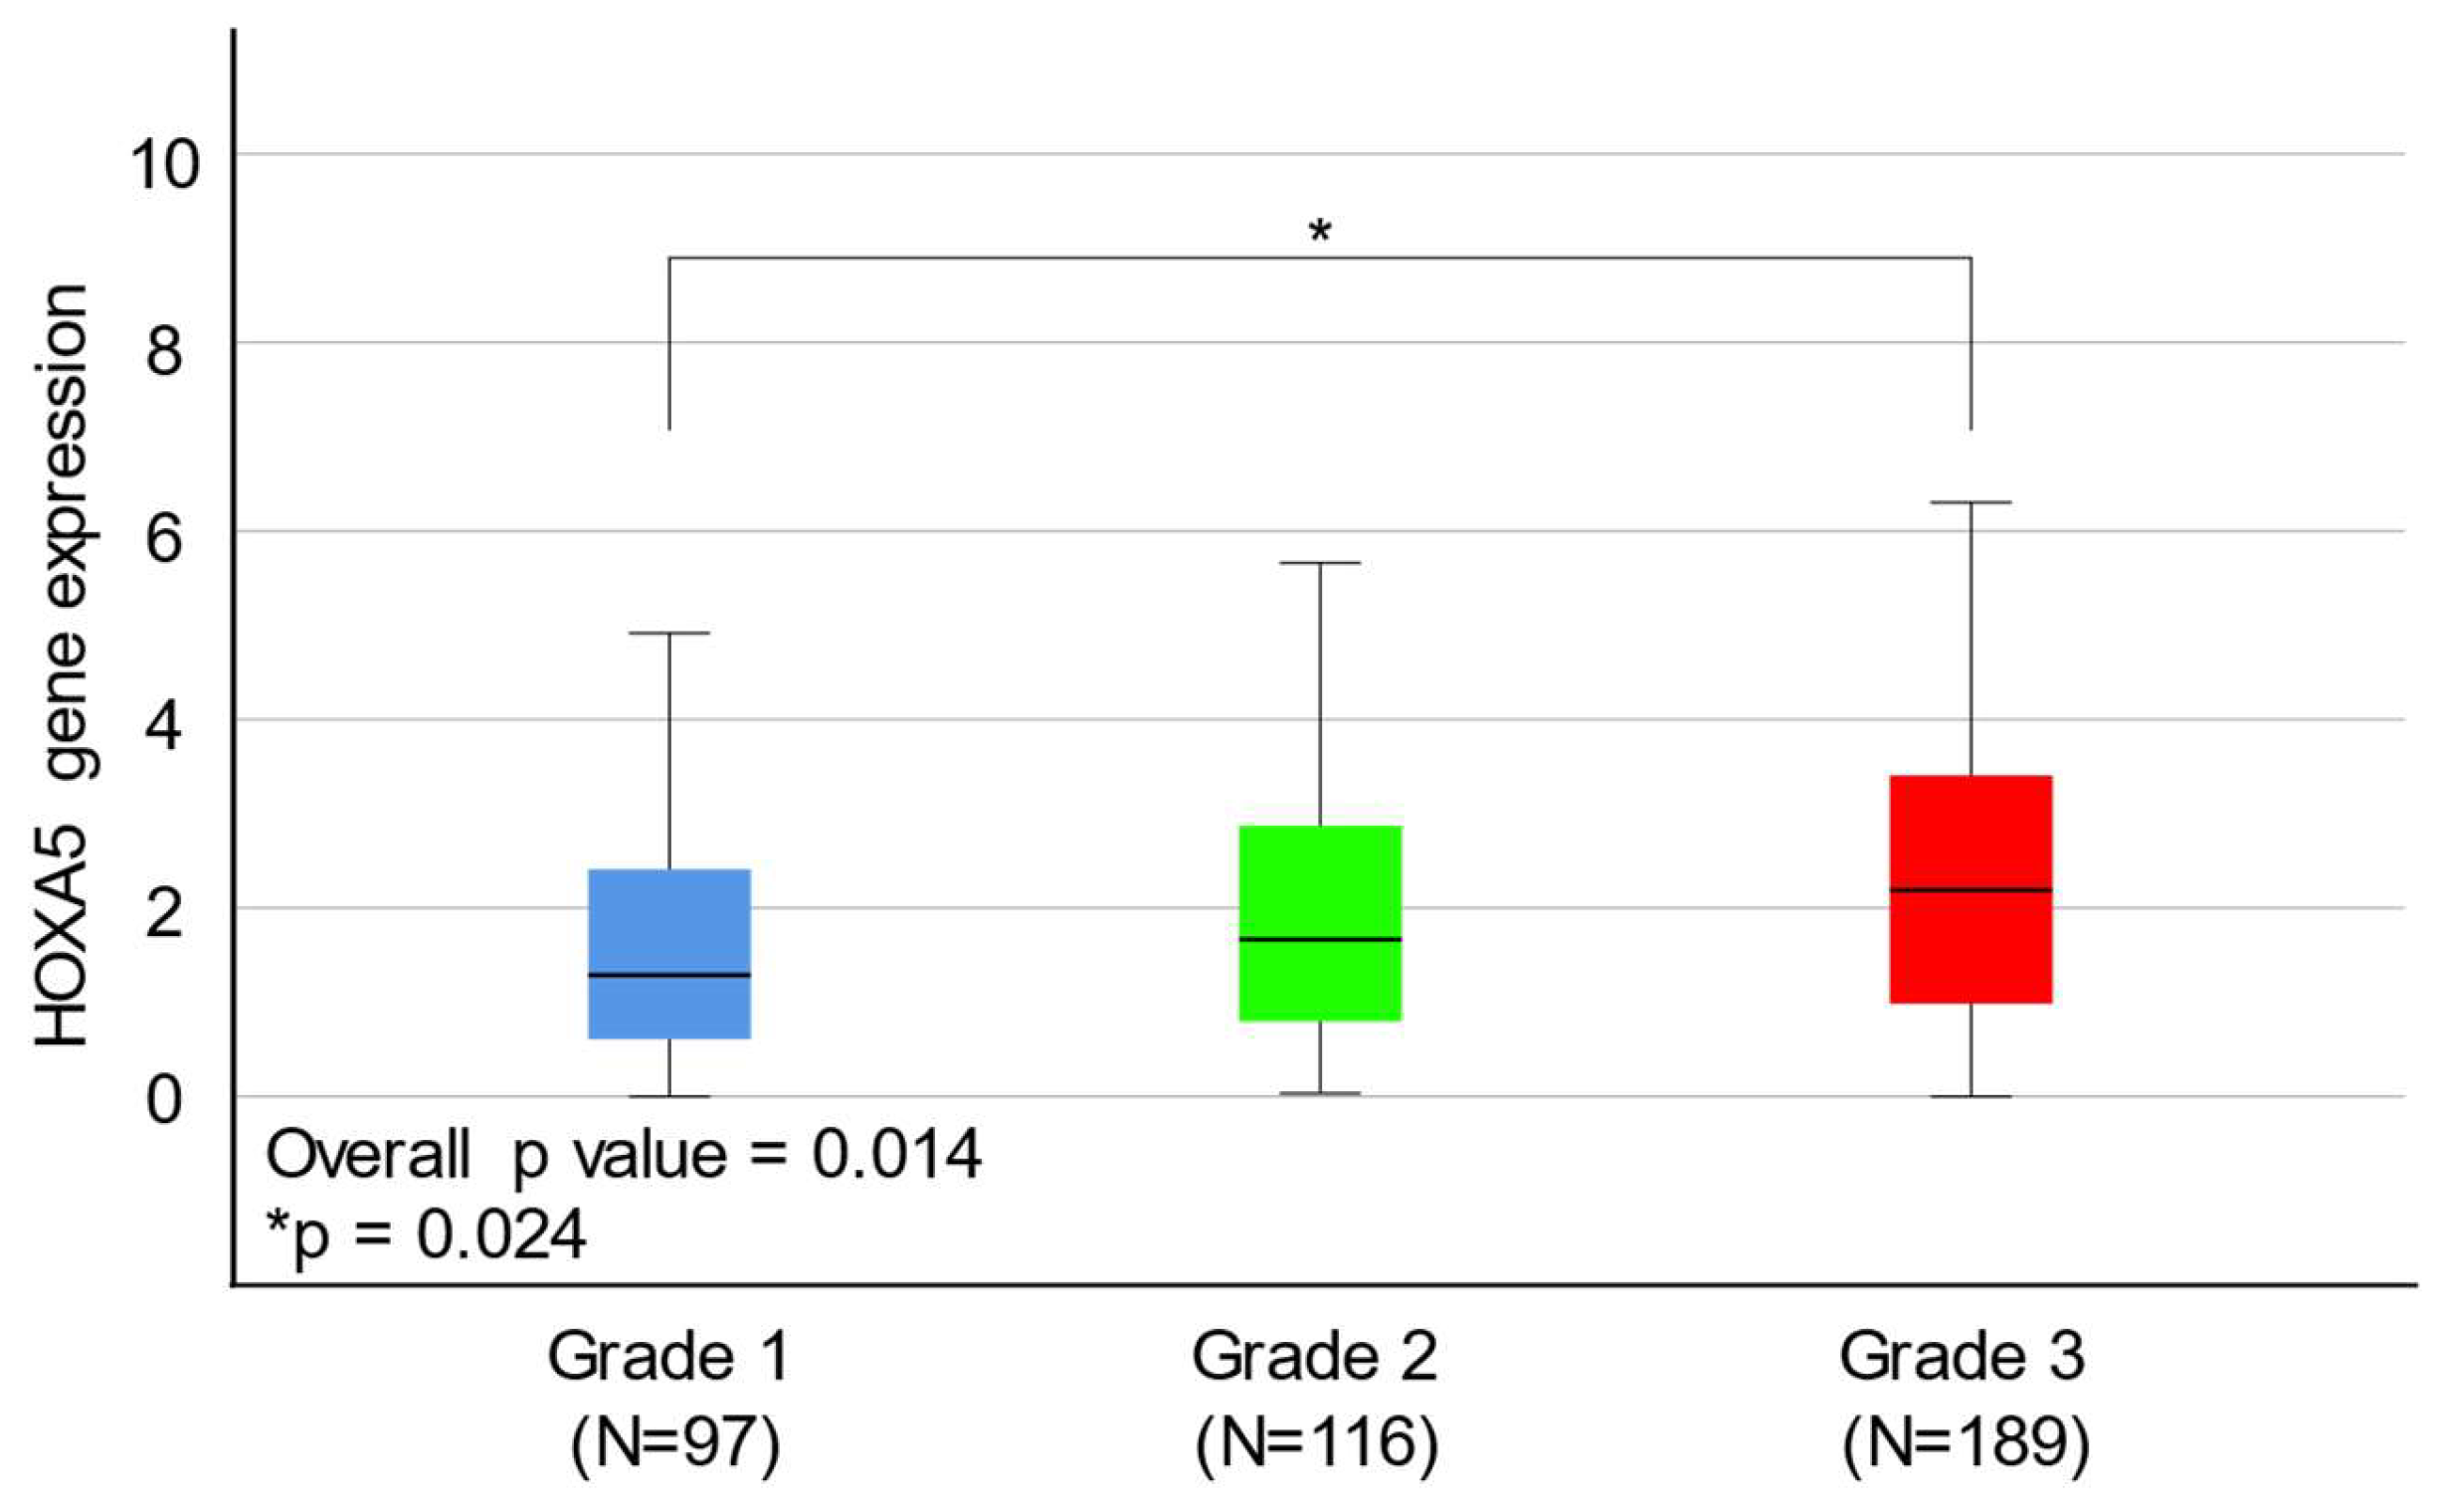
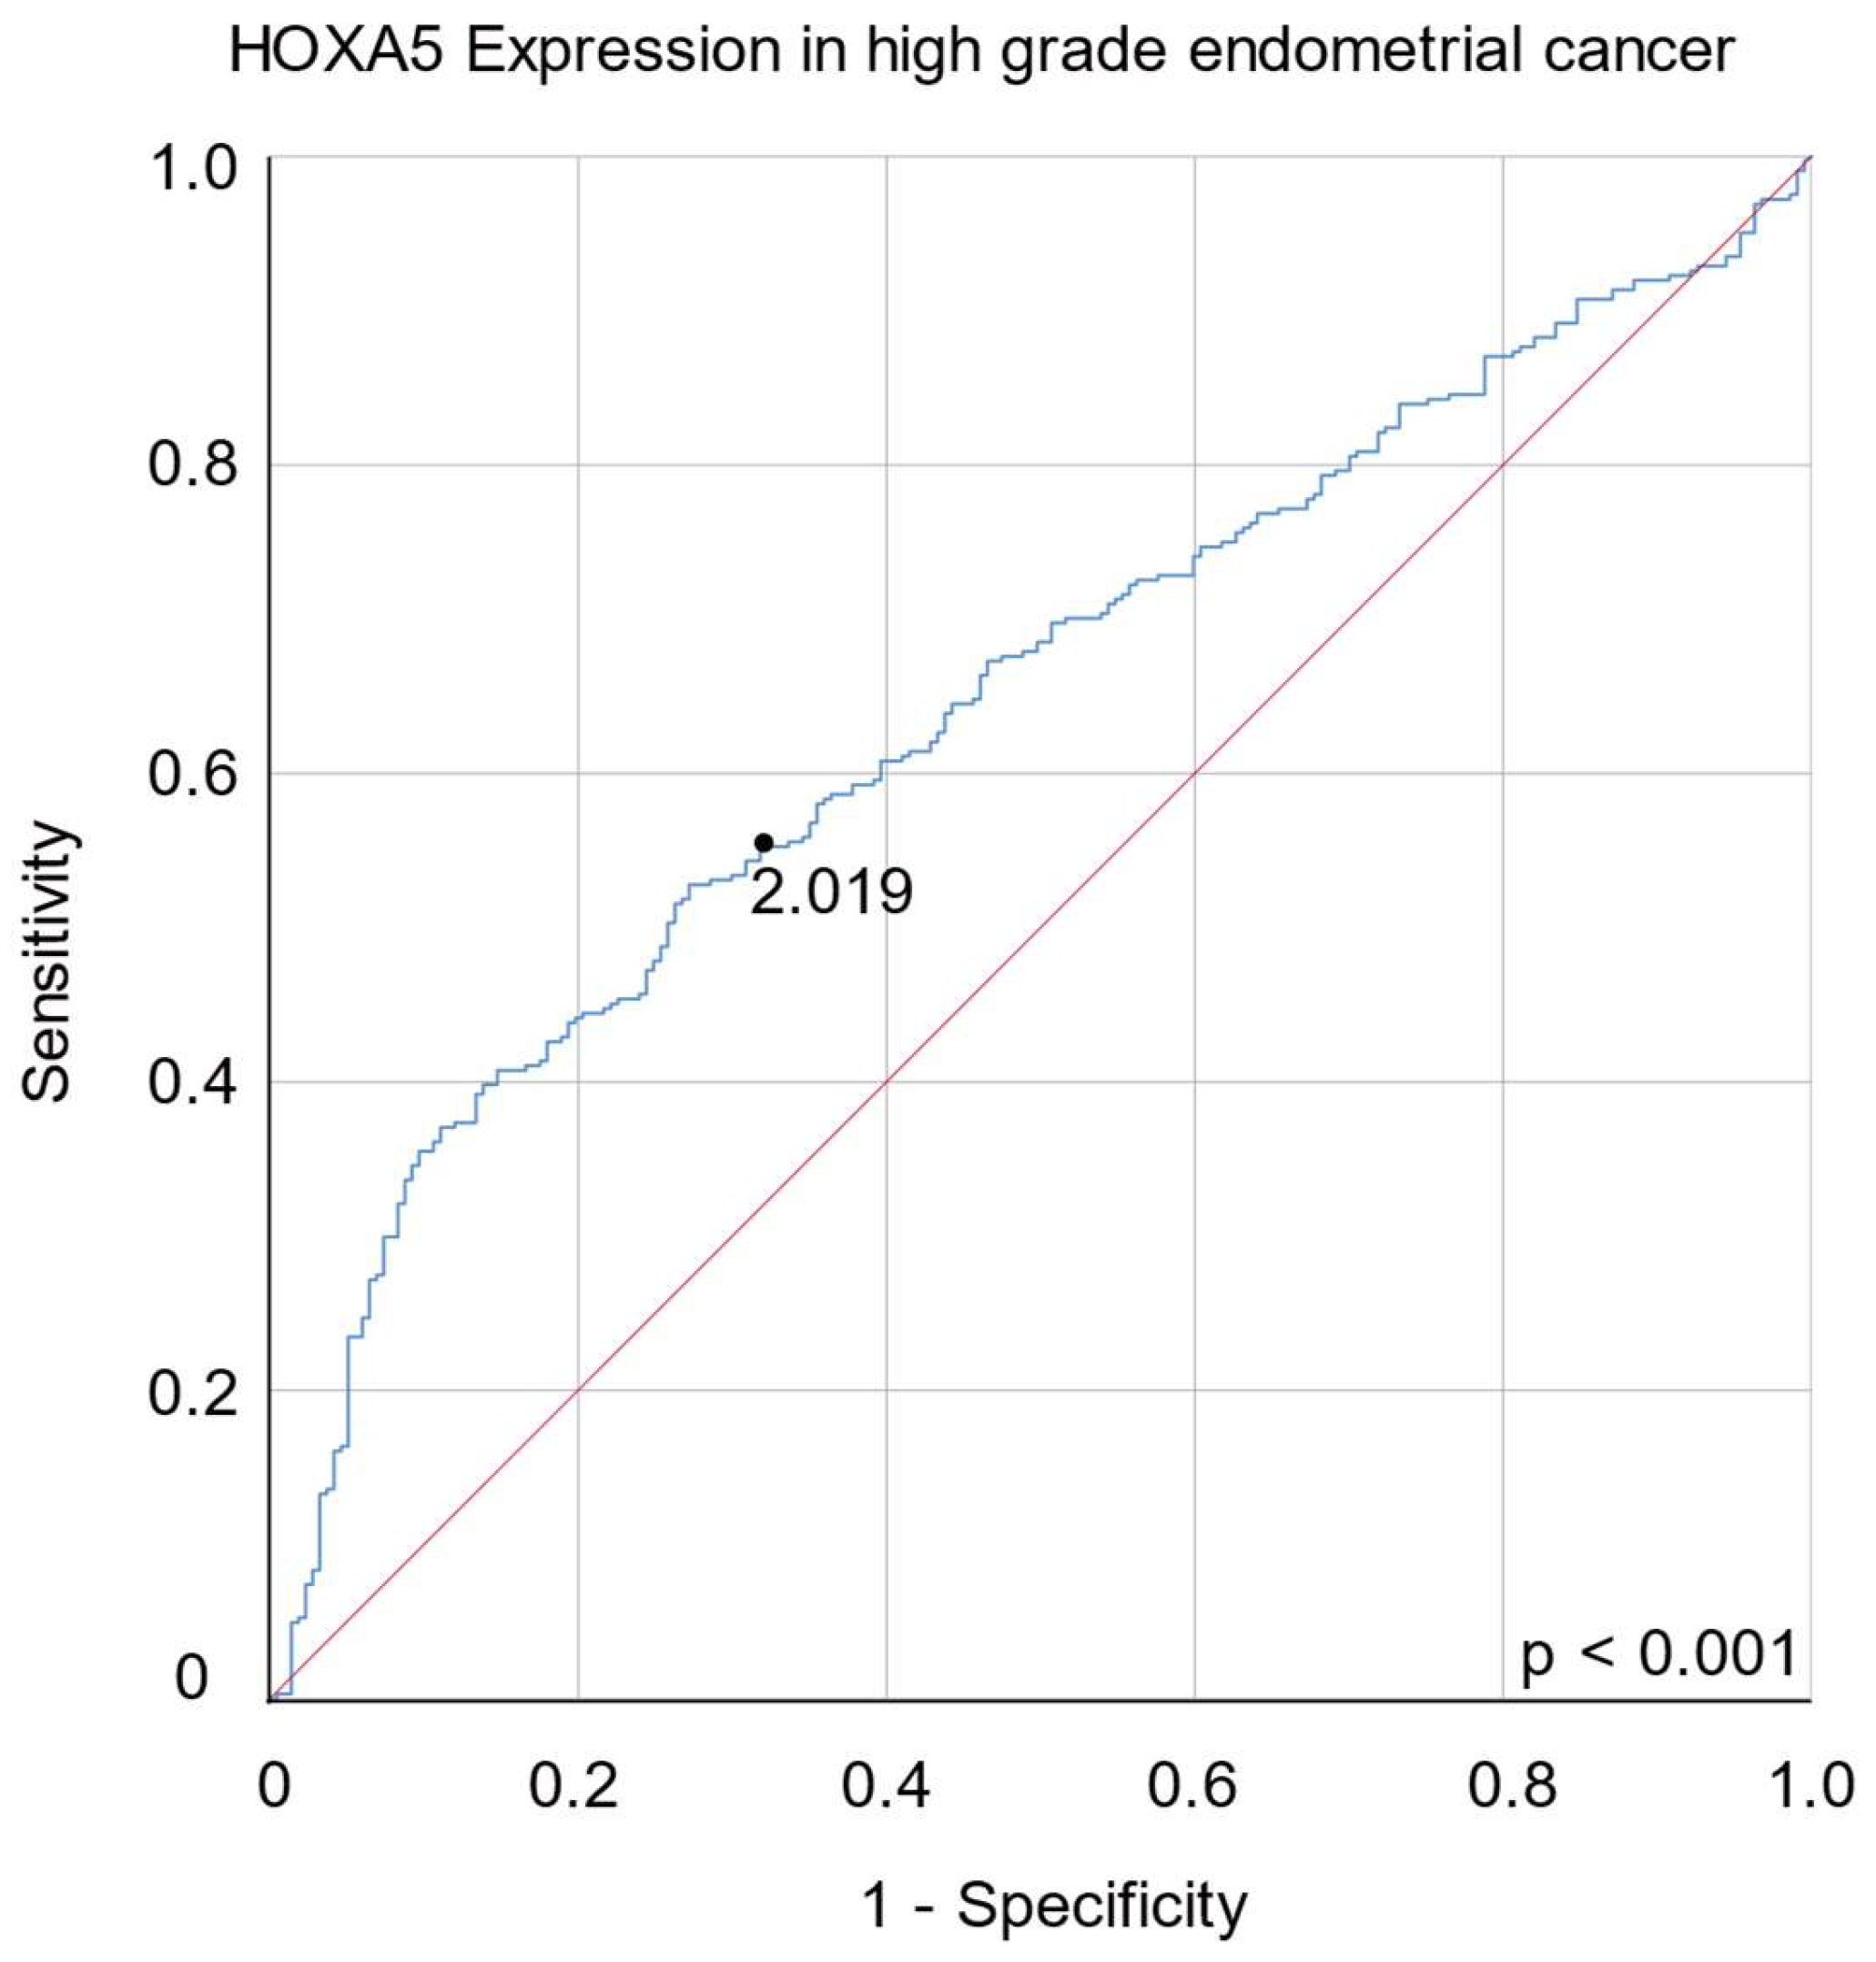
2.3. HOXA5 Overexpression Is Associated with a Higher Histological Grade of Endometrial Cancer

After excluding patients with unavailable gene expression data and clinical information, 404 patients with EAEC were included in this study. Age, clinical stage, hypertension, diabetes, menopausal status, history of HRT, postoperative tumor status, postoperative cytology test results, and adjuvant treatment status were not associated with HOXA5 expression. In contrast, histological grade and mean levels of HOXA5 expression were found to be positively correlated (Table 2 and Figure 3). Subgroup analysis was performed by subdividing the three histological grades into group 1 (grade 1), group 2 (grades 2 and 3), group 3 (grades 1 and 2), and group 4 (grade 3). Subgroup analysis revealed that HOXA5 overexpression was associated with a higher histological grade (Table 3). Subsequently, we performed receiver operating characteristic (ROC) curve analysis with 213 grade 1 and 2 EAEC patients, and 189 grade 3 EAEC patients. The result of ROC curve analysis using data from 213 grade 1 and 2 EAEC patients and 189 grade 3 EAEC patients indicated that HOXA5 could be utilized to discriminate high-grade EC, although it was not considered an ideal tool for distinguishing high-grade EC (AUC = 0.644. 95% CI, 0.598–0.690). The ROC curve analysis suggested an optimal cut-off value of 2.019, with a sensitivity of 0.586 and specificity of 0.636 (Figure 4).
Our findings suggest that there is indeed an association between HOXA5 gene expression and EC prognosis. Moreover, HOXA5 can be used for discriminating high-grade EC. The overexpression of HOXA5 is associated with a higher histological grade; this is one of the key risk factors for EC recurrence and may lead to poor OS in patients with EC.

2.4. HOXA5 Is Overexpressed in the High-Copy-Number Endometrial Carcinoma Group

By incorporating novel molecular classification, patients were sub-grouped into four categories: POLE mutation, MSI-h/MMRd, MSS or normal-copy-number, and TP53 mutation or high-copy-number groups. The Kaplan–Meier survival analysis showed the most favorable OS in the POLE mutation group and the worst OS in the TP53 mutation or high-copy-number group (Figure 5A). HOXA5 expression was the highest in the TP53 mutation or high-copy-number group (Figure 5B).

3. Discussion

In this study, we determined the prognostic value of HOXA5 gene expression in EC. EC is the most common gynecological malignancy in developed countries, and its incidence is increasing worldwide [31]. The symptoms of EC tend to present early, leading to early diagnosis; however, EC still causes approximately 90,000 cancer-related deaths annually [32]. Age, race, obesity, nulliparity, diabetes, hypertension, HRT, histologic subtype, and histologic grade are the known prognostic factors for EC [33].
In 2013, TCGA (http://www.cancer.gov/about-nci/organization/ccg/research/structure-genomics/tcga/using-tcga/citing-tcga, accessed on 1 January 2023), which is a large-scale genomic analysis of various types of cancer, enabled further understanding of the molecular and genomic aspects of cancer [34]. Through this research, crucial information, such as whole-exome sequencing, somatic copy number alterations, methylation profiles, and the somatic mutations of patients with EC, became available to the public. As a result, researchers have identified four distinct molecular features of EC: POLE mutations, microsatellite instability or mismatch repair deficiency, and low- and high-copy-number ECs [35]. However, further clarification is needed to better understand how these molecular variations relate to traditional classification and the assessment of risk factors [16].
The HOX genes are found in almost all eukaryotic cells and were first identified in 1992 [36,37]. The genes typically consist of a highly conserved DNA sequence of 180 base pairs and encode the homeodomain, which is a protein domain that binds to specific DNA sequences [38]. The HOX gene family plays a key role in cell differentiation and embryogenesis [20,21] and is involved in the development and healthy functioning of the female reproductive tract [39]. Studies have identified that the dysregulation of HOX genes is associated with many types of cancers [36,40]. The aberrant expression of HOX genes may affect apoptosis, angiogenesis, receptor signaling, and differentiation, resulting in the promotion of oncogenesis or tumor suppression [41]. In humans, the HOX gene cluster can be divided into four groups: HOXA, HOXB, HOXC, and HOXD [42]. Each group contains a series of HOX genes, and HOXA5 is part of the series within the HOXA cluster. Other series within the HOXA cluster have been identified as oncogenes or tumor suppressors in various cancers [41]. HOXA1 is known to be an oncogene in breast cancer, glioma, and gastric cancer [43,44,45]. HOXA3 is known to be an oncogene in non-small cell lung cancer and thyroid cancer [46,47]. HOXA6 and HOXA13 promote gastric cancer and colorectal cancer [48,49]. HOXA7 has been found to be associated with the development and progression of cervical cancer and hepatocellular carcinoma [50,51]. HOXA9 induces breast cancer and leukemia, and HOXA10 is an oncogene of prostate and testicular cancers [52,53,54]. Finally, HOXA11 is known to promote gastric cancer and renal cancer [55]. In contrast, HOXA4 is known to be a tumor suppressor gene in lung and ovarian cancers [56,57]. These studies indicate that HOXA genes can act as oncogenes or tumor suppressors; therefore, HOXA genes might be novel therapeutic targets for the treatment and prevention of cancer. Importantly, however, the prognostic value and clinical significance of HOXA expression in EC remain unclear.
After comparing the expression levels of HOXA5 in normal and cancerous tissues using the GSE17025 and GSE29981 datasets, we observed that HOXA5 was overexpressed in EC tissues compared to normal endometrial tissues. However, the HOXA5 expression level did not show difference when comparing EC tissue and paired normal endometrial tissue. The inconsistency in these results may be attributed to the relatively small sample size or the presence of tissue heterogeneity. A larger-scale study is need in the future to validate these results. Survival analyses showed that HOXA5 overexpression was associated with poor survival in patients with EC for all histological subtypes. Specifically, HOXA5 overexpression was associated with poor survival in patients with EAEC but not in patients with SAEC. The mean expression level of the HOXA5 gene was positively associated with the histological grade of EAEC. Moreover, Cox regression analysis demonstrated that a higher HOXA5 expression, clinical stage, and positive cytology were independent risk factors for poor OS. ROC curve analysis showed that HOXA5 could discriminate high-grade EC but with limited accuracy.
In our study, we analyzed HOXA5 expression according to molecular classification, the POLE gene functions in DNA duplication, and tumor suppression [58]. There were 80 patients who showed POLE gene mutations, with the most common mutations being Val411Leu (n = 13) and Pro286Arg (n = 21). Although grade 3 EC (n = 51) was the most common in the POLE mutation group, it exhibited the most favorable OS and a relatively low expression of HOXA5 compared to the other groups.
Microsatellites are short, repeated DNA sequences, and defects in MMR function can lead to microsatellite instability [59]. MSI-h/MMRd is often determined via the immunohistochemical staining of MMR proteins, such as MLH1, MSH2, MSH6, and PMS2. It can also be detected by the hypermethylation of the MLH1 promotor area [60,61,62]. In our study, there were 90 patients in the MSI-h/MMRd group, most of whom had grade 1 or 2 EAEC. Next, patients with confirmed TP53 gene mutations or high somatic copy numbers were grouped separately. The TP53 gene mutation or high-copy-number group consisted of 78 and 40 patients with SAEC and EAEC, respectively. Among the 40 patients with EAEC, 32 had high-grade EC. This group showed the worst prognosis in the survival analysis.
There were also 251 patients who had MSS or normal copy numbers. The survival analysis yielded similar results to a study by the Cancer Genome Atlas Research Network et al. (2013), although the proportion of the POLE mutation group was slightly higher in our study [35]. The POLE mutation group showed the most favorable survival outcome, whereas the TP53 mutation or high-copy-number group showed the worst survival outcome. The expression of HOXA5 did not show a precise correlation with this molecular subtyping, but we observed the overexpression of HOXA5 in the TP53 gene mutation or high-copy-number group, which was considerably associated with poor survival outcomes. It is important to note that owing to limitations in interpreting publicly available data, our molecular subgrouping method may not have been identical to previous reports [35]. Nevertheless, the results of our study suggest that HOXA5 overexpression is a potential biomarker, indicating a poor prognostic outcome in patients with EC. Moreover, we have shed light on a novel biomarker for predicting the prognosis of patients with EC that incorporates both traditional risk factors and new molecular classification.
Aberrant HOXA5 expression has been associated with various cancers [23]. HOXA5 is downregulated in breast cancer, gastric cancer, colorectal cancer, hepatocellular carcinoma, lung cancer, osteosarcoma, and adrenocortical carcinoma but is overexpressed in oral squamous carcinoma, esophageal squamous carcinoma, glioma, and leukemia [23]. Some studies have shown a relationship between aberrant HOXA5 gene expression and gynecologic cancers, such as cervical cancer and EC. In these reports, HOXA5 overexpression was associated with a better prognosis in cervical cancer [28,29]. One study reported that HOXA5 was downregulated in the glandular tissue of grade 1 EC [30]. Conversely, our study suggests that the overexpression of HOXA5 is associated with higher histological grade, TP53 mutation or high-copy-number EC, and poor survival in patients with EAEC.
Our study’s strength lies in its comprehensive analysis of the microarray and RNA-sequencing data of patients accumulated from different databases. Moreover, we analyzed HOXA5 expression levels according to novel molecular classification. To the best of our knowledge, this is the first report to indicate that HOXA5 overexpression is associated with poor survival in patients with EC. One of the limiting factors of this study is its retrospective analysis of the published data. To thoroughly explore the use of HOXA5 as a therapeutic target for patients with EC, further studies are necessary to validate these results and reveal the molecular pathways of HOXA5 in EC pathophysiology.

4. Materials and Methods

4.1. Acquisition of Microarray Datasets

The gene expression microarray datasets GSE17025 and GSE29981 were downloaded from the publicly available Gene Expression Omnibus database (National Institutes of Health, Bethesda, MD, USA; http://www.ncbi.nlm.nih.gov/geo, accessed on 3 February 2023). The GSE17025 dataset included data from 79 tissues from patients with stage I EAEC, whereas the GSE29981 dataset included data from 20 healthy endometrial tissues. Both samples were analyzed using an Affymetrix GeneChip Human Genome U133 plus 2.0 Array (Affymetrix, Santa Clara, CA, USA). The Affymetrix ID 213844_at (HOXA5) was valid. The basic dataset information is presented in Table 4.

4.2. Data Normalization

A robust multiarray average algorithm and a quantile normalization method were used to normalize the data. Differences in gene expression between normal and cancer tissues were analyzed using Student’s t-test. The box plots displaying the differential gene expression levels between normal and cancer tissues, as well as the log2-fold change, were plotted using the R programming language (version 3.4.1; http://cran.r-project.org/, accessed on 7 March 2023). Statistical significance was set at p < 0.05.

4.3. Acquisition and Analysis of Clinical Data

The RNA-sequencing datasets were downloaded from the USCS Xena Browser (http://xenabrowser.net/, 1 January 2023) and included gene expression (dataset ID: TCGA-UCEC.Htseq_fpkm), clinicopathological parameters (dataset ID: TCGA-UCEC.GDC_phenotype), and survival data (dataset ID: TCGA-UCEC.survival) from patients with EC. Of the 583 RNA-sequencing data samples, 139 SAEC and 398 EAEC samples were included in the survival analysis after excluding those with insufficient survival data. A total of 402 patients with EAEC were analyzed after excluding samples with insufficient clinical data. The clinical data included age, clinical stage, hypertension, diabetes, menopausal status, history of HRT, postoperative tumor status, postoperative cytology test results, adjuvant treatment status, and survival information. The mean expression of HOXA5 was analyzed according to each clinical parameter. For survival analysis, the patients were divided into high- and low-gene expression groups according to the median gene expression level. Survival analysis was performed using the Kaplan–Meier survival and Cox regression analyses using the survival package (version 3.5-5; http://CRAN.Rproject.org/package=survival, accessed on 27 April 2023) in R (version 4.3.0; http://cran.r-project.org/, accessed on 27 April 2023). This study met the publication guidelines provided by TCGA. The data for the comparison of gene expression between EC tissues and paired adjacent normal tissues were downloaded from the TNM plotter database. TNM plotter is an online platform that provides a comparison of gene expression levels between tumor or metastatic tissues and paired or non-paired normal tissues [65]. The RNA-sequencing data of the HOXA5 gene from 23 patients with EC and their paired adjacent normal tissues were downloaded and analyzed.

4.4. Subgrouping According to Molecular Classification

The molecular classification datasets were downloaded from the USCS Xena Browser and included somatic mutation (dataset ID: TCGA-UCEC.muse_snv), methylation data (dataset ID: TCGA-UCEC.methylation450), and copy number data (dataset ID: TCGA-UCEC.cnv). First, we grouped the patients based on POLE gene mutations. The mutations considered for this grouping included intron variants, missense variants, synonymous variants, splice acceptor variants, and splice region variants of the POLE gene. Next, we grouped patients based on the hypermethylation of the MLH1 promotor region, which was defined as a high methylation beta value of 0.9512 when using the Illumina Infinium HumanMehtlyation450 Beadchip. Finally, we grouped patients based on either TP53 gene mutations or the high-level amplification of TP53 gene copies. Patients with normal copy numbers or patients without the hypermethylation of the MLH1 promotor region were grouped separately.

4.5. Statistical Analyses

The R programming language was used to analyze the data. One-way analysis of variance (ANOVA) was used to compare the mean expression of genes among three or more groups. Post hoc tests were conducted using Bonferroni correction when significant results were observed. The results were considered statistically significant at p < 0.05. Gene expression levels in normal and tumor tissues were compared using Levene’s test and the Student’s t-test. A p-value < 0.05 in the Levene’s test was considered to indicate a non-parametric distribution of variances. A p-value < 0.05 was considered statistically significant when using the Student’s t-test. For the survival analysis, the patients were divided into higher expression and lower expression by using the median HOXA5 expression level as a cutoff point. The Kaplan–Meier survival analysis was used to analyze the data. The Cox proportional hazard model was utilized in the univariate and multivariate analysis. Variables that exhibited a p-value less than 0.05 in the univariate analysis were subsequently included in the multivariable analysis. ROC curve analysis was conducted using SPSS (IBM SPSS Statistics for Windows, version 26.0; IBM Corp, Armonk, NY, USA). The results were considered statistically significant at p < 0.05, and an area under the curve greater than 0.7 was considered indicative of a good prognostic model.

5. Conclusions

Our study identified that HOXA5 was associated with a higher histological grade and poor survival in patients with EAEC. These findings may provide new insights into the pathophysiology of EAEC and may have broad implications in developing future clinical prognostic tools. Further investigations are needed to validate these outcomes, but we carefully propose the potential utilization of HOXA5 as a novel biomarker for predicting poor survival outcomes in patients with EAEC.

Author Contributions

All authors contributed to the study. C.S. contributed to the analysis and interpretation of the data. K.B.K. contributed to the acquisition and interpretation of the data. G.S.L. and S.S. contributed to the statistical analysis and revision of the study. B.K. contributed to the interpretation of the data, research design, and the revision of the manuscript. All authors have read and agreed to the published version of the manuscript.

Funding

This research received no external funding.

Institutional Review Board Statement

Not applicable.

Informed Consent Statement

Not applicable.

Data Availability Statement

The data of this study are available from the corresponding author upon request.

Conflicts of Interest

The authors declare no conflict of interest.

References

  1. Sung, H.; Ferlay, J.; Siegel, R.L.; Laversanne, M.; Soerjomataram, I.; Jemal, A.; Bray, F. Global Cancer Statistics 2020: GLOBOCAN estimates of incidence and mortality worldwide for 36 cancers in 185 countries. CA Cancer J. Clin. 2021, 71, 209–249. [Google Scholar] [CrossRef] [PubMed]
  2. Chen, Y.L.; Wang, K.L.; Chen, M.Y.; Yu, M.H.; Wu, C.H.; Ke, Y.M.; Chen, Y.J.; Chang, Y.Y.; Hsu, K.F.; Yen, M.S. Risk factor analysis of coexisting endometrial carcinoma in patients with endometrial hyperplasia: A retrospective observational study of Taiwanese Gynecologic Oncology Group. J. Gynecol. Oncol. 2013, 24, 14–20. [Google Scholar] [CrossRef] [PubMed]
  3. Jeong, J.Y.; Hwang, S.O.; Lee, B.; Kim, K.; Kim, Y.B.; Park, S.H.; Choi, H.Y. Risk factors of progression to endometrial cancer in women with endometrial hyperplasia: A retrospective cohort study. PLoS ONE 2020, 15, e0243064. [Google Scholar] [CrossRef] [PubMed]
  4. Amant, F.; Moerman, P.; Neven, P.; Timmerman, D.; Van Limbergen, E.; Vergote, I. Endometrial cancer. Lancet 2005, 366, 491–505. [Google Scholar] [CrossRef] [PubMed]
  5. Schmeler, K.M.; Soliman, P.T.; Sun, C.C.; Slomovitz, B.M.; Gershenson, D.M.; Lu, K.H. Endometrial cancer in young, normal-weight women. Gynecol. Oncol. 2005, 99, 388–392. [Google Scholar] [CrossRef]
  6. Setiawan, V.W.; Yang, H.P.; Pike, M.C.; McCann, S.E.; Yu, H.; Xiang, Y.B.; Wolk, A.; Wentzensen, N.; Weiss, N.S.; Webb, P.M.; et al. Type I and II endometrial cancers: Have they different risk factors? J. Clin. Oncol. 2013, 31, 2607–2618. [Google Scholar] [CrossRef]
  7. Clarke, M.A.; Long, B.J.; Del Mar Morillo, A.; Arbyn, M.; Bakkum-Gamez, J.N.; Wentzensen, N. Association of endometrial cancer risk with postmenopausal bleeding in women: A systematic review and meta-analysis. JAMA Intern. Med. 2018, 178, 1210–1222. [Google Scholar] [CrossRef]
  8. Dowdy, S.C. Improving oncologic outcomes for women with endometrial cancer: Realigning our sights. Gynecol. Oncol. 2014, 133, 370–374. [Google Scholar] [CrossRef]
  9. Tejerizo-García, A.; Jiménez-López, J.S.; Muñoz-González, J.L.; Bartolomé-Sotillos, S.; Marqueta-Marqués, L.; López-González, G.; Gómez, J.F. Overall survival and disease-free survival in endometrial cancer: Prognostic factors in 276 patients. Onco Targets Ther. 2013, 9, 1305–1313. [Google Scholar] [CrossRef]
  10. Park, J.Y.; Kim, D.Y.; Kim, T.J.; Kim, J.W.; Kim, J.H.; Kim, Y.M.; Kim, Y.T.; Bae, D.S.; Nam, J.H. Hormonal therapy for women with stage IA endometrial cancer of all grades. Obstet. Gynecol. 2013, 122, 7–14. [Google Scholar] [CrossRef]
  11. Singh, N.; Hirschowitz, L.; Zaino, R.; Alvarado-Cabrero, I.; Duggan, M.A.; Ali-Fehmi, R.; Euscher, E.; Hecht, J.L.; Horn, L.C.; Ioffe, O.; et al. Pathologic prognostic factors in endometrial carcinoma (other than tumor type and grade). Int. J. Gynecol. Pathol. 2019, 38 (Suppl. 1), S93–S113. [Google Scholar] [CrossRef] [PubMed]
  12. Yarandi, F.; Shirali, E.; Akhavan, S.; Nili, F.; Ramhormozian, S. The impact of lymphovascular space invasion on survival in early stage low-grade endometrioid endometrial cancer. Eur. J. Med. Res. 2023, 28, 118. [Google Scholar] [CrossRef] [PubMed]
  13. Guerra, E.; Matias-Guiu, X. Relevance of pathologic features in risk stratification for early-stage endometrial cancer. J. Gynecol. Oncol. 2021, 32, e67. [Google Scholar] [CrossRef] [PubMed]
  14. Huvila, J.; Orte, K.; Vainio, P.; Mettälä, T.; Joutsiniemi, T.; Hietanen, S. Molecular subtype diagnosis of endometrial carcinoma: Comparison of the next-generation sequencing panel and Proactive Molecular Risk Classifier for Endometrial Cancer classifier. Hum. Pathol. 2021, 111, 98–109. [Google Scholar] [CrossRef]
  15. Murali, R.; Soslow, R.A.; Weigelt, B. Classification of endometrial carcinoma: More than two types. Lancet Oncol. 2014, 15, e268–e278. [Google Scholar] [CrossRef] [PubMed]
  16. Stelloo, E.; Nout, R.A.; Osse, E.M.; Jürgenliemk-Schulz, I.J.; Jobsen, J.J.; Lutgens, L.C.; van der Steen-Banasik, E.M.; Nijman, H.W.; Putter, H.; Bosse, T.; et al. Improved risk assessment by integrating molecular and clinicopathological factors in early-stage endometrial cancer-combined analysis of the PORTEC cohorts. Clin. Cancer Res. 2016, 22, 4215–4224. [Google Scholar] [CrossRef]
  17. Talhouk, A.; McConechy, M.K.; Leung, S.; Li-Chang, H.H.; Kwon, J.S.; Melnyk, N.; Yang, W.; Senz, J.; Boyd, N.; Karnezis, A.N.; et al. A clinically applicable molecular-based classification for endometrial cancers. Br. J. Cancer 2015, 113, 299–310. [Google Scholar] [CrossRef]
  18. Talhouk, A.; McConechy, M.K.; Leung, S.; Yang, W.; Lum, A.; Senz, J.; Boyd, N.; Pike, J.; Anglesio, M.; Kwon, J.S.; et al. Confirmation of ProMisE: A simple, genomics-based clinical classifier for endometrial cancer. Cancer 2017, 123, 802–813. [Google Scholar] [CrossRef]
  19. Yen, T.T.; Wang, T.L.; Fader, A.N.; Shih, I.M.; Gaillard, S. Molecular classification and emerging targeted therapy in endometrial cancer. Int. J. Gynecol. Pathol. 2020, 39, 26–35. [Google Scholar] [CrossRef]
  20. Krumlauf, R. Hox genes in vertebrate development. Cell 1994, 78, 191–201. [Google Scholar] [CrossRef]
  21. Zakany, J.; Duboule, D. The role of Hox genes during vertebrate limb development. Curr. Opin. Genet. Dev. 2007, 17, 359–366. [Google Scholar] [CrossRef] [PubMed]
  22. Boucherat, O.; Montaron, S.; Bérubé-Simard, F.A.; Aubin, J.; Philippidou, P.; Wellik, D.M.; Dasen, J.S.; Jeannotte, L. Partial functional redundancy between Hoxa5 and Hoxb5 paralog genes during lung morphogenesis. Am. J. Physiol. Lung Cell. Mol. Physiol. 2013, 304, L817–L830. [Google Scholar] [CrossRef] [PubMed]
  23. Fan, F.; Mo, H.; Zhang, H.; Dai, Z.; Wang, Z.; Qu, C.; Liu, F.; Zhang, L.; Luo, P.; Zhang, J.; et al. HOXA5: A crucial transcriptional factor in cancer and a potential therapeutic target. Biomed. Pharmacother. 2022, 155, 113800. [Google Scholar] [CrossRef] [PubMed]
  24. Ordóñez-Morán, P.; Dafflon, C.; Imajo, M.; Nishida, E.; Huelsken, J. HOXA5 counteracts stem cell traits by inhibiting Wnt signaling in colorectal cancer. Cancer Cell 2015, 28, 815–829. [Google Scholar] [CrossRef] [PubMed]
  25. Hussain, I.; Deb, P.; Chini, A.; Obaid, M.; Bhan, A.; Ansari, K.I.; Mishra, B.P.; Bobzean, S.A.; Udden, S.M.N.; Alluri, P.G.; et al. HOXA5 expression is elevated in breast cancer and is transcriptionally regulated by estradiol. Front. Genet. 2020, 11, 592436. [Google Scholar] [CrossRef] [PubMed]
  26. Zhang, M.L.; Nie, F.Q.; Sun, M.; Xia, R.; Xie, M.; Lu, K.H.; Li, W. HOXA5 indicates poor prognosis and suppresses cell proliferation by regulating p21 expression in non small cell lung cancer. Tumour Biol. 2015, 36, 3521–3531. [Google Scholar] [CrossRef]
  27. Peng, X.; Zha, L.; Chen, A.; Wang, Z. HOXA5 is a tumor suppressor gene that is decreased in gastric cancer. Oncol. Rep. 2018, 40, 1317–1329. [Google Scholar] [CrossRef]
  28. Pei, L.; Wang, Z.Q.; Shen, J.; Yang, Y.Z.; Tian, J.; He, X.; Lin, J.; Hou, Q.Y.; Mo, W.F.; Zhao, H.L.; et al. Expression and clinical significance of HOXA5, E-cadherin, and β-catenin in cervical squamous cell carcinoma. Int. J. Clin. Exp. Pathol. 2018, 11, 3091–3096. [Google Scholar]
  29. Ma, H.M.; Cui, N.; Zheng, P.S. HOXA5 inhibits the proliferation and neoplasia of cervical cancer cells via downregulating the activity of the Wnt/β-catenin pathway and transactivating TP53. Cell Death Dis. 2020, 11, 420. [Google Scholar] [CrossRef]
  30. Dziobek, K.; Oplawski, M.; Zmarzły, N.; Gabarek, B.O.; Kiełbasiński, R.; Kiełbasiński, K.; Kieszkowski, P.; Talkowski, K.; Boroń, D. Assessment of expression of Homeobox A5 in endometrial cancer on the mRNA and protein level. Curr. Pharm. Biotechnol. 2020, 21, 635–641. [Google Scholar] [CrossRef]
  31. Morice, P.; Leary, A.; Creutzberg, C.; Abu-Rustum, N.; Darai, E. Endometrial cancer. Lancet 2016, 387, 1094–1108. [Google Scholar] [CrossRef] [PubMed]
  32. Bray, F.; Ferlay, J.; Soerjomataram, I.; Siegel, R.L.; Torre, L.A.; Jemal, A. Global cancer statistics 2018: GLOBOCAN estimates of incidence and mortality worldwide for 36 cancers in 185 countries. CA Cancer J. Clin. 2018, 68, 394–424. [Google Scholar] [CrossRef] [PubMed]
  33. Inoue, M.; Okayama, A.; Fujita, M.; Enomoto, T.; Tanizawa, O.; Ueshima, H. A case-control study on risk factors for uterine endometrial cancer in Japan. Jpn. J. Cancer Res. 1994, 85, 346–350. [Google Scholar] [CrossRef]
  34. The Cancer Genome Atlas Homepage. Available online: http://cancergenome.nih.gov/abouttcga (accessed on 7 March 2023).
  35. Cancer Genome Atlas Research Network; Kandoth, C.; Schultz, N.; Cherniack, A.D.; Akbani, R.; Liu, Y.; Shen, H.; Robertson, A.G.; Pashtan, I.; Shen, R.; et al. Integrated genomic characterization of endometrial carcinoma. Nature 2013, 497, 67–73. [Google Scholar] [CrossRef] [PubMed]
  36. Shah, N.; Sukumar, S. The Hox genes and their roles in oncogenesis. Nat. Rev. Cancer 2010, 10, 361–371. [Google Scholar] [CrossRef]
  37. Mallo, M.; Alonso, C.R. The regulation of Hox gene expression during animal development. Development 2013, 140, 3951–3963. [Google Scholar] [CrossRef]
  38. Holland, P.W. Evolution of homeobox genes. Wiley Interdiscip. Rev. Dev. Biol. 2013, 2, 31–45. [Google Scholar] [CrossRef]
  39. Taylor, H.S. The role of HOX genes in the development and function of the female reproductive tract. Semin. Reprod. Med. 2000, 18, 81–89. [Google Scholar] [CrossRef]
  40. Quinonez, S.C.; Innis, J.W. Human HOX gene disorders. Mol. Genet. Metab. 2014, 111, 4–15. [Google Scholar] [CrossRef]
  41. Grier, D.G.; Thompson, A.; Kwasniewska, A.; McGonigle, G.J.; Halliday, H.L.; Lappin, T.R. The pathophysiology of HOX genes and their role in cancer. J. Pathol. 2005, 205, 154–171. [Google Scholar] [CrossRef]
  42. Holland, P.W.; Booth, H.A.; Bruford, E.A. Classification and nomenclature of all human homeobox genes. BMC Biol. 2007, 5, 47. [Google Scholar] [CrossRef] [PubMed]
  43. Li, J.; Zeng, T.; Li, W.; Wu, H.; Sun, C.; Yang, F.; Yang, M.; Fu, Z.; Yin, Y. Long non-coding RNA SNHG1 activates HOXA1 expression via sponging miR-193a-5p in breast cancer progression. Aging 2020, 12, 10223–10234. [Google Scholar] [CrossRef] [PubMed]
  44. Li, Q.; Dong, C.; Cui, J.; Wang, Y.; Hong, X. Over-expressed lncRNA HOTAIRM1 promotes tumor growth and invasion through up-regulating HOXA1 and sequestering G9a/EZH2/Dnmts away from the HOXA1 gene in glioblastoma multiforme. J. Exp. Clin. Cancer Res. 2018, 37, 265. [Google Scholar] [CrossRef] [PubMed]
  45. Yuan, C.; Zhu, X.; Han, Y.; Song, C.; Liu, C.; Lu, S.; Zhang, M.; Yu, F.; Peng, Z.; Zhou, C. Elevated HOXA1 expression correlates with accelerated tumor cell proliferation and poor prognosis in gastric cancer partly via cyclin D1. J. Exp. Clin. Cancer Res. 2016, 35, 15. [Google Scholar] [CrossRef] [PubMed]
  46. Lin, S.; Zhang, R.; An, X.; Li, Z.; Fang, C.; Pan, B.; Chen, W.; Xu, G.; Han, W. LncRNA HOXA-AS3 confers cisplatin resistance by interacting with HOXA3 in non-small-cell lung carcinoma cells. Oncogenesis 2019, 8, 60. [Google Scholar] [CrossRef]
  47. Jiang, L.; Wu, Z.; Meng, X.; Chu, X.; Huang, H.; Xu, C. LncRNA HOXA-AS2 facilitates tumorigenesis and progression of papillary thyroid cancer by modulating the miR-15a-5p/HOXA3 axis. Hum. Gene Ther. 2019, 30, 618–631. [Google Scholar] [CrossRef]
  48. Lin, J.; Zhu, H.; Hong, L.; Tang, W.; Wang, J.; Hu, H.; Wu, X.; Chen, Y.; Liu, G.; Yang, Q.; et al. Coexpression of HOXA6 and PBX2 promotes metastasis in gastric cancer. Aging 2021, 13, 6606–6624. [Google Scholar] [CrossRef]
  49. Qiao, C.; Huang, W.; Chen, J.; Feng, W.; Zhang, T.; Wang, Y.; Liu, D.; Ji, X.; Xie, M.; Sun, M.; et al. IGF1-mediated HOXA13 overexpression promotes colorectal cancer metastasis through upregulating ACLY and IGF1R. Cell Death Dis. 2021, 12, 564. [Google Scholar] [CrossRef]
  50. Tang, B.; Qi, G.; Sun, X.; Tang, F.; Yuan, S.; Wang, Z.; Liang, X.; Li, B.; Yu, S.; Liu, J.; et al. HOXA7 plays a critical role in metastasis of liver cancer associated with activation of Snail. Mol. Cancer 2016, 15, 57. [Google Scholar] [CrossRef]
  51. Ji, F.; Du, R.; Chen, T.; Zhang, M.; Zhu, Y.; Luo, X.; Ding, Y. Circular RNA circSLC26A4 accelerates cervical cancer progression via miR-1287-5p/HOXA7 axis. Mol. Ther. Nucleic Acids 2020, 19, 413–420. [Google Scholar] [CrossRef]
  52. Zhang, H.; Zhang, Y.; Zhou, X.; Wright, S.; Hyle, J.; Zhao, L.; An, J.; Zhao, X.; Shao, Y.; Xu, B.; et al. Functional interrogation of HOXA9 regulome in MLLr leukemia via reporter-based CRISPR/Cas9 screen. eLife 2020, 9, e57858. [Google Scholar] [CrossRef] [PubMed]
  53. Gilbert, P.M.; Mouw, J.K.; Unger, M.A.; Lakins, J.N.; Gbegnon, M.K.; Clemmer, V.B.; Benezra, M.; Licht, J.D.; Boudreau, N.J.; Tsai, K.K.; et al. HOXA9 regulates BRCA1 expression to modulate human breast tumor phenotype. J. Clin. Investig. 2010, 120, 1535–1550. [Google Scholar] [CrossRef]
  54. Lu, S.; Sun, Z.; Tang, L.; Chen, L. LINC00355 promotes tumor progression in HNSCC by hindering MicroRNA-195-Mediated suppression of HOXA10 expression. Mol. Ther. Nucleic Acids 2020, 19, 61–71, Retraction published in Mol. Ther. Nucleic Acids 2022, 29, 218. [Google Scholar] [CrossRef]
  55. Sun, M.; Nie, F.; Wang, Y.; Zhang, Z.; Hou, J.; He, D.; Xie, M.; Xu, L.; De, W.; Wang, Z.; et al. LncRNA HOXA11-AS promotes proliferation and invasion of gastric cancer by scaffolding the chromatin modification factors PRC2, LSD1, and DNMT1. Cancer Res. 2016, 76, 6299–6310. [Google Scholar] [CrossRef] [PubMed]
  56. Cheng, S.; Qian, F.; Huang, Q.; Wei, L.; Fu, Y.; Du, Y. HOXA4, down-regulated in lung cancer, inhibits the growth, motility and invasion of lung cancer cells. Cell Death Dis. 2018, 9, 465. [Google Scholar] [CrossRef]
  57. Klausen, C.; Leung, P.C.; Auersperg, N. Cell motility and spreading are suppressed by HOXA4 in ovarian cancer cells: Possible involvement of beta1 integrin. Mol. Cancer Res. 2009, 7, 1425–1437. [Google Scholar] [CrossRef]
  58. Rayner, E.; van Gool, I.C.; Palles, C.; Kearsey, S.E.; Bosse, T.; Tomlinson, I.; Church, D.N. A panoply of errors: Polymerase proofreading domain mutations in cancer. Nat. Rev. Cancer 2016, 16, 71–81. [Google Scholar] [CrossRef] [PubMed]
  59. Garrido-Ramos, M.A. Satellite DNA: An Evolving Topic. Genes 2017, 8, 230. [Google Scholar] [CrossRef]
  60. Li, K.; Luo, H.; Huang, L.; Luo, H.; Zhu, X. Microsatellite instability: A review of what the oncologist should know. Cancer Cell Int. 2020, 20, 16. [Google Scholar] [CrossRef]
  61. Meyer, L.A.; Broaddus, R.R.; Lu, K.H. Endometrial cancer and Lynch syndrome: Clinical and pathologic considerations. Cancer Control 2009, 16, 14–22. [Google Scholar] [CrossRef]
  62. Esteller, M.; Levine, R.; Baylin, S.B.; Ellenson, L.H.; Herman, J.G. MLH1 promoter hypermethylation is associated with the microsatellite instability phenotype in sporadic endometrial carcinomas. Oncogene 1998, 17, 2413–2417. [Google Scholar] [CrossRef]
  63. Day, R.S.; McDade, K.K.; Chandran, U.R.; Lisovich, A.; Conrads, T.P.; Hood, B.L.; Kolli, V.S.; Kirchner, D.; Litzi, T.; Maxwell, G.L. Identifier mapping performance for integrating transcriptomics and proteomics experimental results. BMC Bioinform. 2011, 12, 213. [Google Scholar] [CrossRef] [PubMed]
  64. Day, R.S.; McDade, K.K. A decision theory paradigm for evaluating identifier mapping and filtering methods using data integration. BMC Bioinform. 2013, 14, 223. [Google Scholar] [CrossRef] [PubMed]
  65. Nagy, A.; Munkacsy, G.; Gyorffy, B. Pancancer survival analysis of cancer hallmark genes. Sci. Rep. 2021, 11, 6047. [Google Scholar] [CrossRef] [PubMed]
Figure 1. Box plots showing the relative expression of HOXA5 between normal and cancerous tissues. (A) Comparison of the microarray data of 79 endometrial cancer tissues and 20 non-adjacent normal endometrial tissues. (B) Comparison of the RNA-sequencing data of 23 endometrial cancer tissues and 23 paired adjacent normal endometrial tissues.
Ijms 24 14758 g001
Figure 2. Survival analysis of HOXA5 gene expression in patients with endometrial cancer. (A) Kaplan–Meier curve of patients with endometrial cancer. All histological subtypes were included (endometrioid and serous adenocarcinomas) according to the relative mRNA expression levels of the HOXA5 gene. (B) Kaplan–Meier curve of patients with endometrial cancer. The histological subtype serous adenocarcinoma is displayed according to the relative mRNA expression levels of the HOXA5 gene. (C) Kaplan–Meier curve of patients with endometrial cancer. The histological subtype endometrioid adenocarcinoma is displayed according to the relative mRNA expression levels of the HOXA5 gene.
Ijms 24 14758 g002
Figure 3. Box plot showing the relative expression levels of the HOXA5 gene according to histological grade in the endometrioid adenocarcinoma subtype acquired from patients with endometrial cancer.
Ijms 24 14758 g003
Figure 4. Receiver operating characteristic curve analysis of HOXA5 gene expression for discrimination between high-grade and low-grade endometrial cancers.
Ijms 24 14758 g004
Figure 5. Survival analysis and HOXA5 expression levels in patients with endometrial cancer according to molecular classification. (A) Kaplan–Meier curve of patients with endometrial cancer, with subgrouping by POLE mutation, MSI-h/MMRd, MSS/normal copy number, and TP53 mutation/high copy number. (B) Comparison of mean HOXA5 gene expression levels, with subgrouping by POLE mutation, MSI-h/MMRd, MSS/normal copy number, and TP53 mutation/high copy number.
Ijms 24 14758 g005
Table 1. Cox regression analysis of overall survival.
VariablesUnivariateMultivariate
HR 95% CI p-ValueHR 95% CI p-Value
HOXA5Lower1-----
expressionHigher2.3681.376–4.0770.0022.2861.129–4.6300.022
Age<601-----
≥601.6780.923–3.0490.090.8720.436–1.7460.699
Stage1, 21-----
3, 44.7632.862–7.926<0.00013.2751.640–6.5410.001
DiabetesNo1-----
Yes0.9590.472–1.9470.908---
HypertensionNo1-----
Yes0.9240.508–1.6800.796---
HRT §No1-----
Yes0.8910.339–2.3440.815---
MenopauseNo1-----
Yes1.2020.481–3.0040.693---
Grade1, 21-----
33.4051.809–6.410<0.00011.8980.887–4.0620.099
CytologyNegative1-----
Positive6.6153.739–11.703<0.00012.7341.367–5.4700.004
Hazard ratio; confidential interval; § hormone replacement therapy.
Table 2. The single variable analysis of mean HOXA5 expression according to clinical parameters.
Parameters NumberMean Gene Expression (FPKM )p-Value
Age<601601.8120.273
≥602391.980
Clinical stageStage I and II2861.9090.792
Stage III and IV1161.953
Histological gradeGrade 1971.6550.014
Grade 21161.773
Grade 31892.150
HypertensionNo1201.8180.995
Yes1741.819
DiabetesNo1891.8770.335
Yes791.700
HRT No1841.6790.154
Yes282.047
Menopausal statusPre362.1000.430
Peri321.631
Post3131.919
Cytologynegative2711.9370.807
positive282.011
Tumor statusNegative tumor3101.7970.055
With tumor422.250
Adjuvant treatmentNo2891.8500.721
Yes941.912
Fragment per kilobase million; Hormone replacement therapy.
Table 3. Subgroup analysis of HOXA5 gene expression and histological grade.
Subgroup NumberMean Gene Expression (FPKM )p-Value
Group 1 vs. 2Group 1 (grade 1)971.6550.028
Group 2 (grades 2 and 3)3052.007
Group 3 vs. 4Group 3 (grades 1 and 2)2131.3690.004
Group 4 (grade 3)2891.613
Fragment per kilobase million.
Table 4. Microarray dataset information from the NCBI Gene Expression Omnibus (GEO) database.
PlatformGEO DatasetSamplesReference
GPL570GSE1702579 EAEC Day, R. S. et al. [63,64]
GSE2998120 healthy EM
Endometrioid adenocarcinoma subtype of endometrial cancer; endometrium.
Disclaimer/Publisher’s Note: The statements, opinions and data contained in all publications are solely those of the individual author(s) and contributor(s) and not of MDPI and/or the editor(s). MDPI and/or the editor(s) disclaim responsibility for any injury to people or property resulting from any ideas, methods, instructions or products referred to in the content.

