
Mass Spectrometric Blood Metabogram: Acquisition, Characterization, and Prospects for Application

 ,
,  ,
,  ,
,  ,
,
Abstract
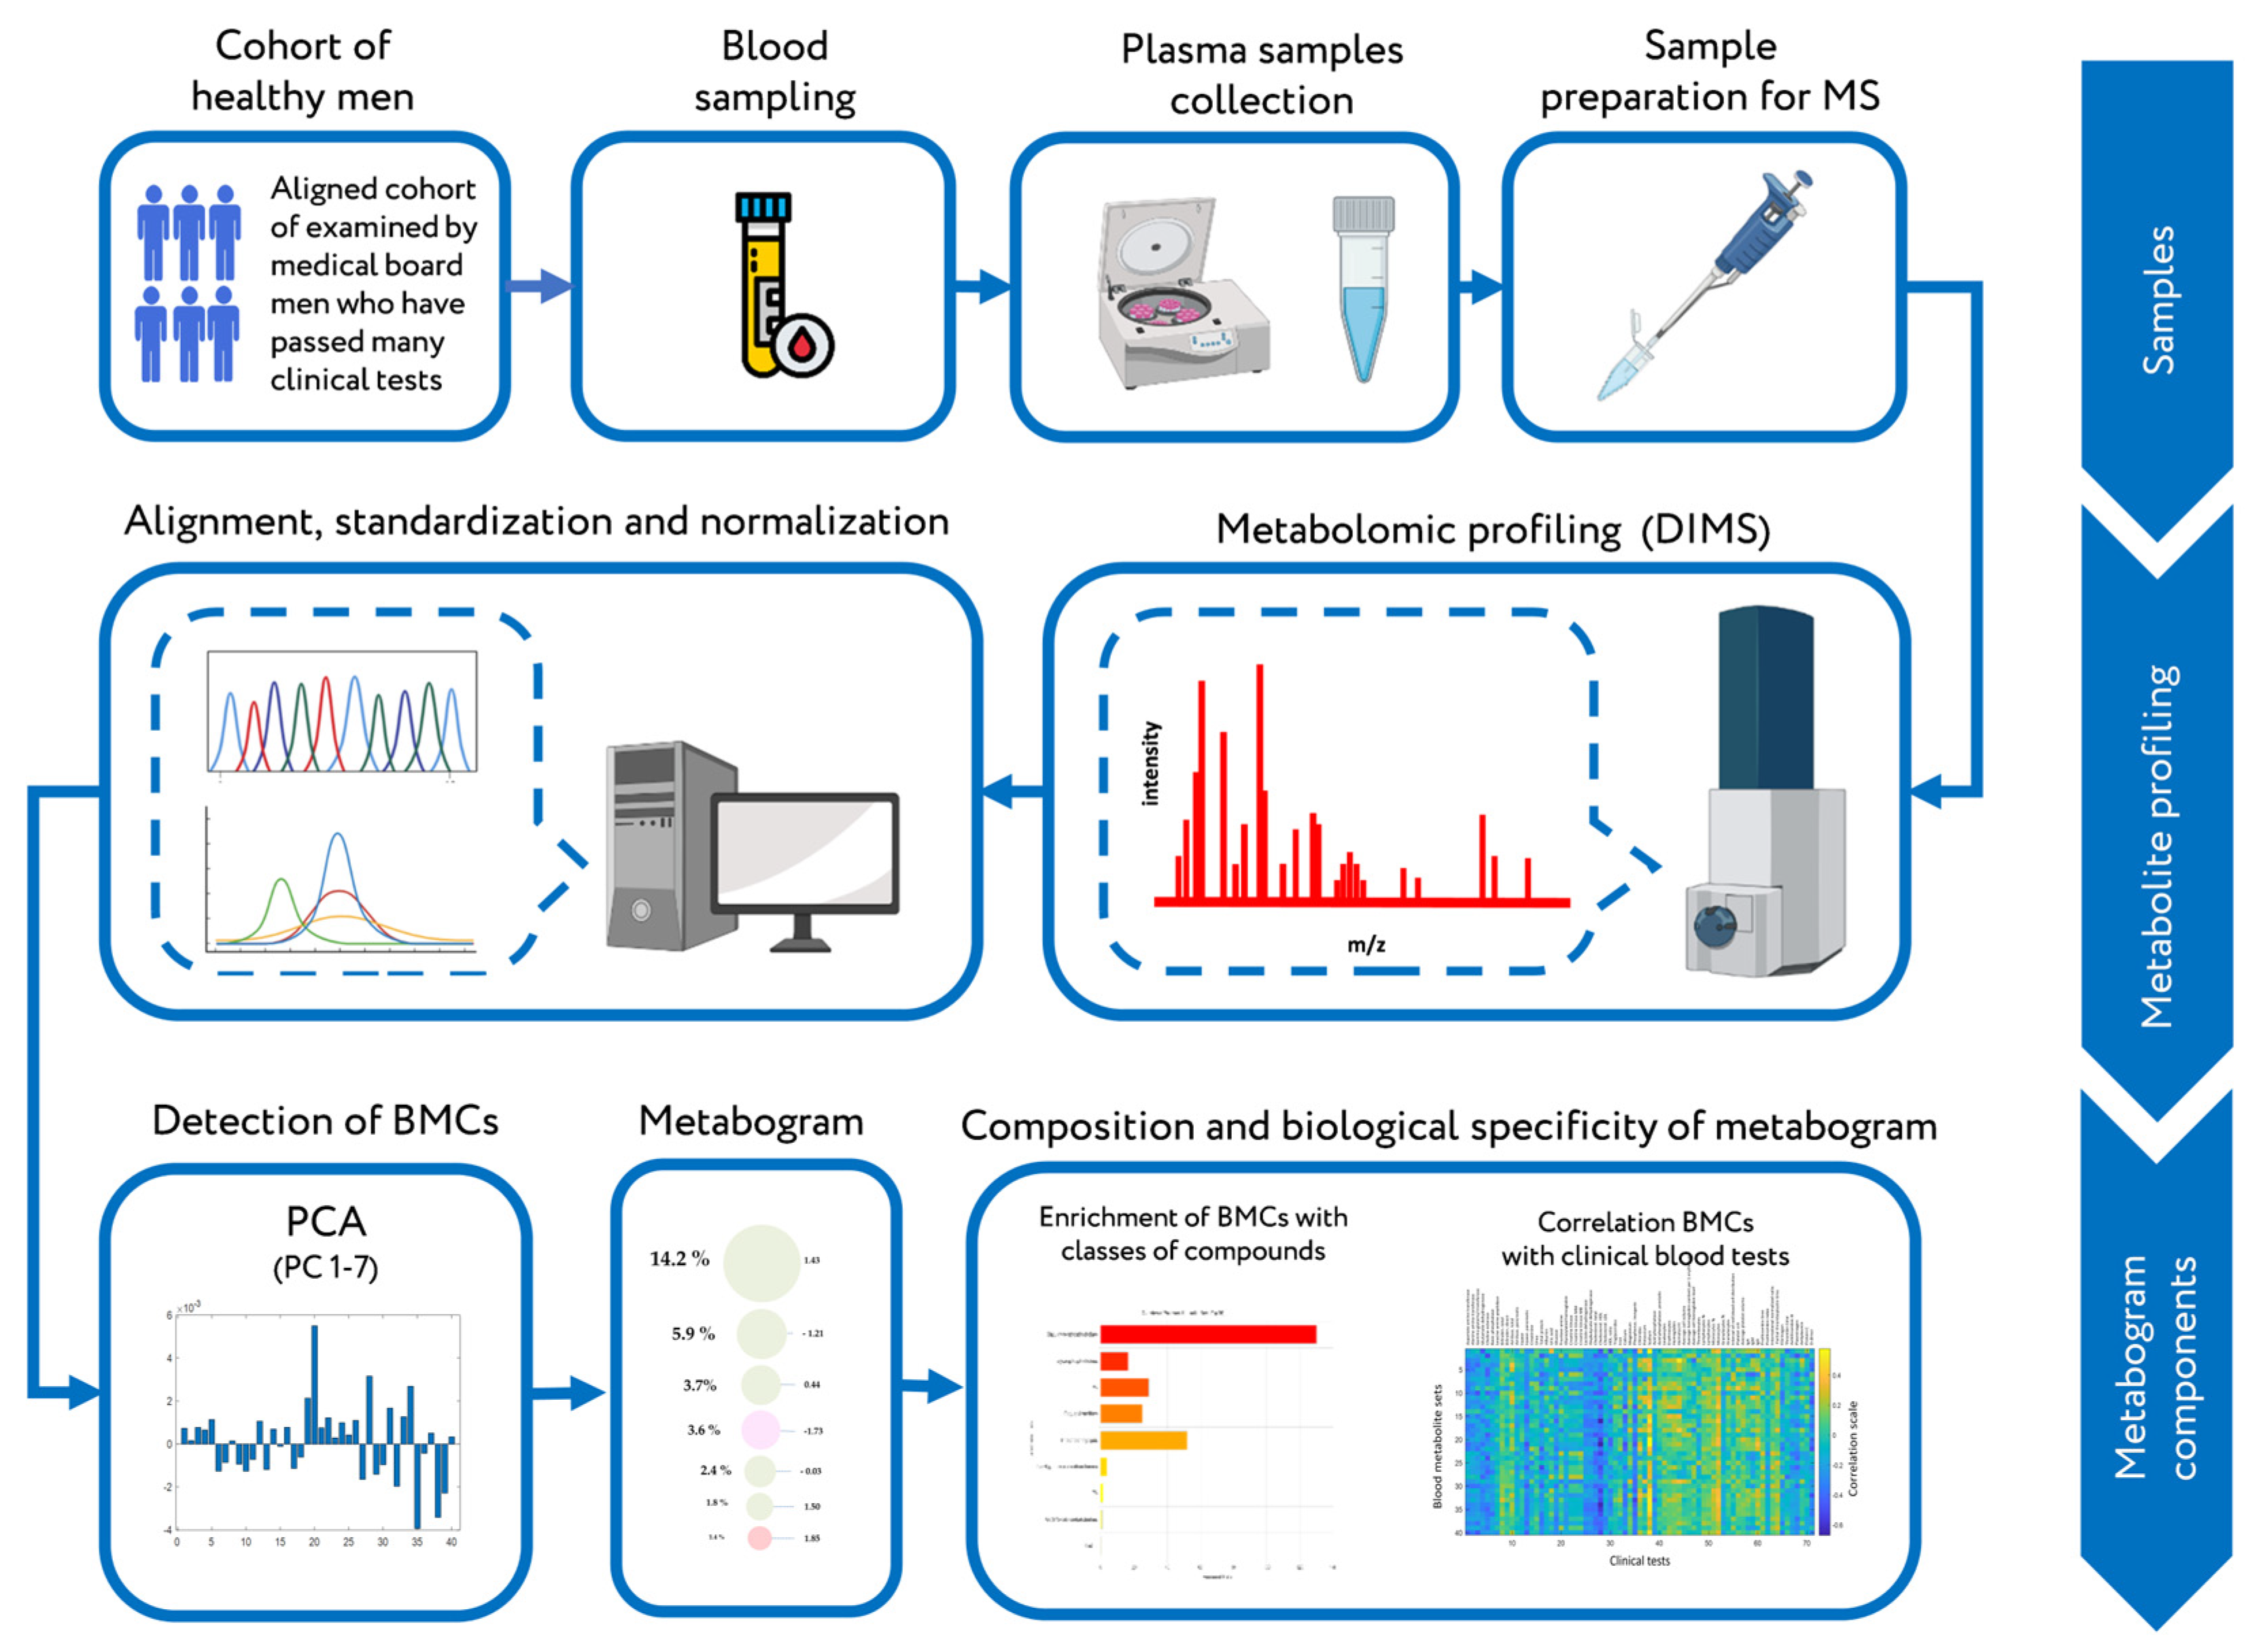
:1. Introduction
2. Results
2.1. Subjects and Mass Spectrometry of Blood Plasma Metabolome
2.2. PCA of Mass Spectrometry Data of Blood Plasma Samples
2.3. Composition of Blood Metabolome Components
2.4. Drawing a Metabogram
2.5. Correlation of the Metabogram Components with Clinical Blood Tests
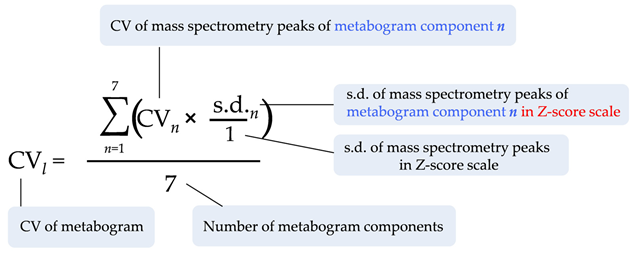
2.6. Metabogram Reproducibility and Variability
3. Discussion
4. Materials and Methods
4.1. Subjects
4.2. Blood Sample Preparation
4.3. Mass Spectrometry
4.4. Mass Spectra Processing
4.5. Mass Lists Processing
4.6. Detection of Blood Metabolome Components (BMCs)
4.7. Composition of BMCs
4.8. Metabogram Components and Their Measure
4.9. Drawing a Metabogram
4.10. Metabogram Correlation with Clinical Tests
4.11. Metabogram Reproducibility and Variability
5. Conclusions
Supplementary Materials
Author Contributions
Funding
Institutional Review Board Statement
Informed Consent Statement
Data Availability Statement
Conflicts of Interest
References
- Bossuyt, P.M. Where are all the new omics-based tests? Clin. Chem. 2014, 60, 1256–1257. [Google Scholar] [CrossRef] [PubMed] [Green Version]
- McShane, L.M.; Cavenagh, M.M.; Lively, T.G.; Eberhard, D.A.; Bigbee, W.L.; Williams, P.M.; Mesirov, J.P.; Polley, M.Y.C.; Kim, K.Y.; Tricoli, J.V.; et al. Criteria for the use of omics-based predictors in clinical trials. Nature 2013, 502, 317–320. [Google Scholar] [CrossRef] [Green Version]
- Rochat, B. Is there a future for metabotyping in clinical laboratories? Bioanalysis 2015, 7, 5–8. [Google Scholar] [CrossRef]
- Bujak, R.; Struck-Lewicka, W.; Markuszewski, M.J.; Kaliszan, R. Metabolomics for laboratory diagnostics. J. Pharm. Biomed. Anal. 2015, 113, 108–120. [Google Scholar] [CrossRef] [PubMed]
- Tolstikov, V.; Akmaev, V.R.; Sarangarajan, R.; Narain, N.R.; Kiebish, M.A. Clinical metabolomics: A pivotal tool for companion diagnostic development and precision medicine. Expert. Rev. Mol. Diagn. 2017, 17, 411–413. [Google Scholar] [CrossRef] [Green Version]
- Pinu, F.R.; Goldansaz, S.A.; Jaine, J. Translational Metabolomics: Current Challenges and Future Opportunities. Metabolites 2019, 9, 108. [Google Scholar] [CrossRef] [Green Version]
- Ashrafian, H.; Sounderajah, V.; Glen, R.; Ebbels, T.; Blaise, B.J.; Kalra, D.; Kultima, K.; Spjuth, O.; Tenori, L.; Salek, R.M.; et al. Metabolomics: The Stethoscope for the Twenty-First Century. Med. Princ. Pract. 2021, 30, 301–310. [Google Scholar] [CrossRef] [PubMed]
- Mussap, M.; Noto, A.; Piras, C.; Atzori, L.; Fanos, V. Slotting metabolomics into routine precision medicine. Expert Rev. Precis. Med. Drug Dev. 2021, 6, 173–187. [Google Scholar] [CrossRef]
- Beger, R.D.; Dunn, W.; Schmidt, M.A.; Gross, S.S.; Kirwan, J.A.; Cascante, M.; Brennan, L.; Wishart, D.S.; Oresic, M.; Hankemeier, T.; et al. Metabolomics enables precision medicine: “A White Paper, Community Perspective. ” Metabolomics 2016, 12, 149. [Google Scholar] [CrossRef] [PubMed] [Green Version]
- Lokhov, P.G.; Trifonova, O.P.; Maslov, D.L.; Lichtenberg, S.; Balashova, E.E. Personal Metabolomics: A Global Challenge. Metabolites 2021, 11, 715. [Google Scholar] [CrossRef] [PubMed]
- Metabolon. Metabolon Launches Meta UDxTM Test to Speed Diagnosis of Rare and Undiagnosed Diseases in Children and Adults. Available online: https://www.metabolon.com/news/meta-udx-launch/ (accessed on 1 September 2022).
- Choucair, I.; Nemet, I.; Li, L.; Cole, M.A.; Skye, S.M.; Kirsop, J.D.; Fischbach, M.A.; Gogonea, V.; Brown, J.M.; Tang, W.H.W.; et al. Quantification of bile acids: A mass spectrometry platform for studying gut microbe connection to metabolic diseases[S]. J. Lipid Res. 2020, 61, 159–177. [Google Scholar] [CrossRef] [PubMed]
- Gathungu, R.M.; Larrea, P.; Sniatynski, M.J.; Marur, V.R.; Bowden, J.A.; Koelmel, J.P.; Starke-Reed, P.; Hubbard, V.S.; Kristal, B.S. Optimization of Electrospray Ionization Source Parameters for Lipidomics To Reduce Misannotation of In-Source Fragments as Precursor Ions. Anal. Chem. 2018, 90, 13523–13532. [Google Scholar] [CrossRef]
- Kiseleva, O.; Kurbatov, I.; Ilgisonis, E.; Poverennaya, E. Defining Blood Plasma and Serum Metabolome by GC-MS. Metabolites 2022, 12, 15. [Google Scholar] [CrossRef] [PubMed]
- Sato, H.; Taketomi, Y.; Murakami, M. Metabolic regulation by secreted phospholipase A2. Inflamm. Regen. 2016, 36, 7. [Google Scholar] [CrossRef] [PubMed] [Green Version]
- Rao, Y.P.; Stravitz, R.T.; Vlahcevic, Z.R.; Gurley, E.C.; Sando, J.J.; Hylemon, P.B. Activation of protein kinase C alpha and delta by bile acids: Correlation with bile acid structure and diacylglycerol formation. J. Lipid Res. 1997, 38, 2446–2454. [Google Scholar] [CrossRef]
- Tan, S.T.; Ramesh, T.; Toh, X.R.; Nguyen, L.N. Emerging roles of lysophospholipids in health and disease. Prog. Lipid Res. 2020, 80, 101068. [Google Scholar] [CrossRef] [PubMed]
- Graham, A.; Bennett, A.J.; McLean, A.A.M.; Zammit, V.A.; Brindley, D.N. Factors regulating the secretion of lysophosphatidylcholine by rat hepatocytes compared with the synthesis and secretion of phosphatidylcholine and triacylglycerol. Effects of albumin, cycloheximide, verapamil, EGTA and chlorpromazine. Biochem. J. 1988, 253, 687–692. [Google Scholar] [CrossRef] [PubMed] [Green Version]
- Mangiapane, E.H.; Brindley, D.N. Effects of dexamethasone and insulin on the synthesis of triacylglycerols and phosphatidylcholine and the secretion of very-low-density lipoproteins and lysophosphatidylcholine by monolayer cultures of rat hepatocytes. Biochem. J. 1986, 233, 151–160. [Google Scholar] [CrossRef] [PubMed] [Green Version]
- Vuong, T.D.; De Kimpe, S.; De Roos, R.; Rabelink, T.J.; Koomans, H.A.; Joles, J.A. Albumin restores lysophosphatidylcholine-induced inhibition of vasodilation in rat aorta. Kidney Int. 2001, 60, 1088–1096. [Google Scholar] [CrossRef] [PubMed] [Green Version]
- Webster, J.; Jiang, J.Y.; Lu, B.; Xu, F.Y.; Taylor, W.A.; Mymin, M.; Zhang, M.; Minuk, G.Y.; Hatch, G.M. On the mechanism of the increase in cardiolipin biosynthesis and resynthesis in hepatocytes during rat liver regeneration. Biochem. J. 2005, 386, 137–143. [Google Scholar] [CrossRef] [PubMed]
- Schiffer, L.; Arlt, W.; Storbeck, K.-H. Intracrine androgen biosynthesis, metabolism and action revisited. Mol. Cell. Endocrinol. 2018, 465, 4–26. [Google Scholar] [CrossRef] [PubMed]
- Paulusma, C.C.; Lamers, W.H.; Broer, S.; van de Graaf, S.F.J. Amino acid metabolism, transport and signalling in the liver revisited. Biochem. Pharmacol. 2022, 201, 115074. [Google Scholar] [CrossRef] [PubMed]
- Cohen, J. Differences between correlation coefficients. In Statistical Power Analysis for the Behavioral Science (Second ed.); Lawrence Erlbaum Associates: Hillsdale, NJ, USA, 1988; pp. 109–145. [Google Scholar]
- Ansell, J.E.; Tiarks, C.; Fairchild, V.K. Coagulation abnormalities associated with the use of anabolic steroids. Am. Heart J. 1993, 125, 367–371. [Google Scholar] [CrossRef]
- Silva, C.A.A.; Fernandes, K.P.S.; Alves, A.N.; Barbosa, J.L.P.; Silva, M.T.; Zamuner, S.R.; Mesquita-Ferrari, R.A. The steroid nandrolone decanoate increases the intracellular activity of creatine kinase in skeletal muscle cells. Med. Sci. Technol. 2013, 54, 26–29. [Google Scholar] [CrossRef]
- Mayer, R.J.; Marshall, L.A. New insights on mammalian phospholipase A2(s); comparison of arachidonoyl-selective and -nonselective enzymes. FASEB J. Off. Publ. Fed. Am. Soc. Exp. Biol. 1993, 7, 339–348. [Google Scholar] [CrossRef]
- Tselepis, A.D.; John Chapman, M. Inflammation, bioactive lipids and atherosclerosis: Potential roles of a lipoprotein-associated phospholipase A2, platelet activating factor-acetylhydrolase. Atheroscler. Suppl. 2002, 3, 57–68. [Google Scholar] [CrossRef]
- Mikhailidis, D.P.; Barradas, M.A.; Maris, A.; Jeremy, J.Y.; Dandona, P. Fibrinogen mediated activation of platelet aggregation and thromboxane A2 release: Pathological implications in vascular disease. J. Clin. Pathol. 1985, 38, 1166–1171. [Google Scholar] [CrossRef] [PubMed]
- Stafforini, D.M. Biology of platelet-activating factor acetylhydrolase (PAF-AH, lipoprotein associated phospholipase A2). Cardiovasc. Drugs Ther. 2009, 23, 73–83. [Google Scholar] [CrossRef] [PubMed]
- Gualde, N.; Aldigier, J.-C.; Mexmain, S.; Goodwin, J.S. Regulation of the Immune Response by Eicosanoid Acids. In Prostaglandins and Immunity; Goodwin, J.S., Ed.; Springer US: Boston, MA, USA, 1985; pp. 147–160. ISBN 978-1-4613-2603-8. [Google Scholar]
- Jia, Q.; Shi, Y.; Bennink, M.B.; Pestka, J.J. Docosahexaenoic Acid and Eicosapentaenoic Acid, but Not α-Linolenic Acid, Suppress Deoxynivalenol-Induced Experimental IgA Nephropathy in Mice. J. Nutr. 2004, 134, 1353–1361. [Google Scholar] [CrossRef] [PubMed] [Green Version]
- Satomi, Y.; Hirayama, M.; Kobayashi, H. One-step lipid extraction for plasma lipidomics analysis by liquid chromatography mass spectrometry. J. Chromatogr. B Anal. Technol. Biomed. life Sci. 2017, 1063, 93–100. [Google Scholar] [CrossRef] [PubMed]
- Lemaitre, R.N.; Jensen, P.N.; Zeigler, M.; Denham, J.; Fretts, A.M.; Umans, J.G.; Howard, B.V.; Sitlani, C.M.; McKnight, B.; Gharib, S.A.; et al. Plasma epoxyeicosatrienoic acids and dihydroxyeicosatrieonic acids, insulin, glucose and risk of diabetes: The strong heart study. EBioMedicine 2021, 66, 103279. [Google Scholar] [CrossRef] [PubMed]
- Hofmann, A.F. The function of bile salts in fat absorption. The solvent properties of dilute micellar solutions of conjugated bile salts. Biochem. J. 1963, 89, 57–68. [Google Scholar] [CrossRef] [PubMed] [Green Version]
- Stryer, L. Membrane structures and dynamics. In Biochemistry; W.H. Freeman and Company: New York, NY, USA, 1995; pp. 268–270. [Google Scholar]
- Smith, S.S.; Gropper, J.L. Advanced Nutrition and Human Metabolism, 6th ed.; Wadsworth/Cengage Learning: Belmont, CA, USA, 2013. [Google Scholar]
- Beckmann, R.J.; Schmidt, R.J.; Santerre, R.F.; Plutzky, J.; Crabtree, G.R.; Long, G.L. The structure and evolution of a 461 amino acid human protein C precursor and its messenger RNA, based upon the DNA sequence of cloned human liver cDNAs. Nucleic Acids Res. 1985, 13, 5233–5247. [Google Scholar] [CrossRef] [Green Version]
- Guidance for Industry Bioanalytical Method Validation Guidance for Industry Bioanalytical Method Validation; U.S. Department of Health and Human Services, FDA, CDER, CVM: Washington, DC, USA, 2001.
- Crews, B.; Wikoff, W.R.; Patti, G.J.; Woo, H.-K.; Kalisiak, E.; Heideker, J.; Siuzdak, G. Variability analysis of human plasma and cerebral spinal fluid reveals statistical significance of changes in mass spectrometry-based metabolomics data. Anal. Chem. 2009, 81, 8538–8544. [Google Scholar] [CrossRef] [Green Version]
- Kupke, I.R.; Zeugner, S. Quantitative high-performance thin-layer chromatography of lipids in plasma and liver homogenates after direct application of 0.5-μl samples to the silica-gel layer. J. Chromatogr. B Biomed. Sci. Appl. 1978, 146, 261–271. [Google Scholar] [CrossRef] [PubMed]
- Committee on the Review of Omics-Based Tests for Predicting Patient Outcomes in Clinical Trials; Board on Health Care Services; Board on Health Sciences Policy; Institute of Medicine. Evolution of Translational Omics: Lessons Learned and the Path Forward; Micheel, C.M., Sharyl, N.J., Omenn, G.S., Eds.; National Academies Press (US): Washington, DC, USA, 2012; ISBN 9780309224185. [Google Scholar]
- Chen, R.; Mias, G.I.; Li-Pook-Than, J.; Jiang, L.; Lam, H.Y.K.; Chen, R.; Miriami, E.; Karczewski, K.J.; Hariharan, M.; Dewey, F.E.; et al. Personal omics profiling reveals dynamic molecular and medical phenotypes. Cell 2012, 148, 1293–1307. [Google Scholar] [CrossRef] [Green Version]
- González-Domínguez, R.; Sayago, A.; Fernández-Recamales, Á. Direct infusion mass spectrometry for metabolomic phenotyping of diseases. Bioanalysis 2017, 9, 131–148. [Google Scholar] [CrossRef]
- Lin, L.; Yu, Q.; Yan, X.; Hang, W.; Zheng, J.; Xing, J.; Huang, B. Direct infusion mass spectrometry or liquid chromatography mass spectrometry for human metabonomics? A serum metabonomic study of kidney cancer. Analyst 2010, 135, 2970–2978. [Google Scholar] [CrossRef]
- Quehenberger, O.; Dennis, E.A. The Human Plasma Lipidome—Mechanisms of Disease, Diversity of Lipids in Human Plasma. N. Engl. J. Med. 2011, 365, 1812–1823. [Google Scholar] [CrossRef] [PubMed]
- Harayama, T.; Riezman, H. Understanding the diversity of membrane lipid composition. Nat. Rev. Mol. Cell Biol. 2018, 19, 281–296. [Google Scholar] [CrossRef]
- O’Donnell, V.B.; Ekroos, K.; Liebisch, G.; Wakelam, M. Lipidomics: Current state of the art in a fast moving field. Wiley Interdiscip. Rev. Syst. Biol. Med. 2020, 12, e1466. [Google Scholar] [CrossRef] [PubMed]
- Kennedy, A.D.; Wittmann, B.M.; Evans, A.M.; Miller, L.A.D.; Toal, D.R.; Lonergan, S.; Elsea, S.H.; Pappan, K.L. Metabolomics in the clinic: A review of the shared and unique features of untargeted metabolomics for clinical research and clinical testing. J. Mass Spectrom. 2018, 53, 1143–1154. [Google Scholar] [CrossRef]
- Lichtenberg, S.; Trifonova, O.P.; Maslov, D.L.; Balashova, E.E.; Lokhov, P.G. Metabolomic Laboratory-Developed Tests: Current Statusand Perspectives. Metabolites 2021, 11, 423. [Google Scholar] [CrossRef]
- Nordström, A.; Want, E.; Northen, T.; Lehtiö, J.; Siuzdak, G. Multiple Ionization Mass Spectrometry Strategy Used To Reveal the Complexity of Metabolomics. Anal. Chem. 2008, 80, 421–429. [Google Scholar] [CrossRef]
- Lokhov, P.G.; Trifonova, O.P.; Maslov, D.L.; Archakov, A.I. Blood plasma metabolites and the risk of developing lung cancer in Russia. Eur. J. Cancer Prev. 2013, 22, 335–341. [Google Scholar] [CrossRef]
- Bar, N.; Korem, T.; Weissbrod, O.; Zeevi, D.A.; Rothschild, D.; Leviatan, S.; Kosower, N.; Lotan-Pompan, M.; Weinberger, A.; Le Roy, C.I.; et al. A reference map of potential determinants for the human serum metabolome. Nature 2020, 588, 135–140. [Google Scholar] [CrossRef]
- Lokhov, P.G.; Maslov, D.L.; Balashova, E.E.; Trifonova, O.P.; Medvedeva, N.V.; Torkhovskaya, T.I.; Ipatova, O.M.; Archakov, A.I.; Malyshev, P.P.; Kukharchuk, V.V.; et al. Mass spectrometry analysis of blood plasma lipidome as the method of disease diagnostics, evalution of effectiveness and optimization of drug therapy. Biochem. Suppl. Ser. B Biomed. Chem. 2015, 9, 95–105. [Google Scholar] [CrossRef]
- Basner, M.; Dinges, D.F.; Mollicone, D.; Ecker, A.; Jones, C.W.; Hyder, E.C.; Di Antonio, A.; Savelev, I.; Kan, K.; Goel, N.; et al. Mars 520-d mission simulation reveals protracted crew hypokinesis and alterations of sleep duration and timing. Proc. Natl. Acad. Sci. USA 2013, 110, 2635–2640. [Google Scholar] [CrossRef] [PubMed] [Green Version]
- BD Vacutainer® Evacuated Blood Collection System For In Vitro Diagnostic Use. Becton, Dickinson and Company. 2019. Available online: www.bd.com/vacutainer/referencematerial (accessed on 15 September 2022).
- Lokhov, P.G.; Balashova, E.E.; Trifonova, O.P.; Maslov, D.L.; Ponomarenko, E.A.; Archakov, A.I. Mass Spectrometry-Based Metabolomics Analysis of Obese Patients’ Blood Plasma. Int. J. Mol. Sci. 2020, 21, 568. [Google Scholar] [CrossRef] [Green Version]
- Lokhov, P.G.; Kharybin, O.N.; Archakov, A.I. Diagnosis of lung cancer based on direct-infusion electrospray mass spectrometry of blood plasma metabolites. Int. J. Mass Spectrom. 2011, 309, 200–205. [Google Scholar] [CrossRef]
- Xia, J.; Wishart, D.S. MSEA: A web-based tool to identify biologically meaningful patterns in quantitative metabolomic data. Nucleic Acids Res. 2010, 38 (Suppl. S2), W71–W77. [Google Scholar] [CrossRef] [PubMed] [Green Version]
- Xia, J.; Wishart, D.S. Using MetaboAnalyst 3.0 for comprehensive metabolomics data analysis. Curr. Protoc. Bioinforma. 2016, 55, 14.10.1–14.10.9. [Google Scholar] [CrossRef] [PubMed]


| Chemical Class (Metabolite Group) | Fold Enrichment (p-Value 1) | ||||||
|---|---|---|---|---|---|---|---|
| BMC 1 | BMC 2 | BMC 3 | BMC 4 | BMC 5 | BMC 6 | BMC 7 | |
| Phosphatidylcholines | - | 3.0 × 10−153 | - | 6.1 × 10−244 | - | - | - |
| Phosphatidylethanolamines | - | 5.0 × 10⁻¹⁰ | - | 2.0 × 10⁻¹⁹ | - | - | - |
| Monosaccharides | - | 3.0 × 10⁻⁶ | - | - | - | - | - |
| Saturated Fatty Acids | 4.4 × 10⁻⁸ | - | - | - | - | - | - |
| C18 steroids | 7.0 × 10⁻²⁹ | - | - | - | - | - | - |
| C10 isoprenoids | 2.1 × 10⁻⁸ | - | - | - | - | - | - |
| C24 bile acids 2 | - | - | - | - | - | 1.6 × 10⁻¹² | |
| Dicarboxylic acids | 0.0006 | - | - | - | 3.4 × 10⁻⁴ | - | - |
| Unsaturated Fatty Acids | 4.0 × 10⁻¹¹ | - | - | - | 7.7 × 10⁻⁵ | - | - |
| Lysophosphatidylcholines 3 | - | - | - | - | 2.3 × 10⁻⁵ | - | 7.2 × 10⁻¹⁷ |
| Lysophosphatidylethanolamines 3 | - | - | - | - | - | - | 3.2 × 10⁻²⁷ |
| Diacylglycerols | - | - | - | - | - | 9.4 × 10−37 | 7.7 × 10−42 |
| Retinoids | - | - | - | - | 6.0 × 10⁻⁸ | 6.0 × 10⁻¹² | - |
| Amino acids | - | - | - | 4.6 × 10⁻¹⁵ | 8.0 × 10⁻²⁶ | - | 4.2 × 10⁻²⁰ |
| Androstane steroids | 8.3 × 10⁻²³ | - | - | - | - | - | 4.6 × 10⁻¹¹ |
| C19 steroids | 2.8 × 10⁻³⁵ | - | - | - | - | - | 6.8 × 10⁻¹² |
| Glycerophosphoglycerophosphates | - | - | - | - | - | - | 6.4 × 10⁻¹⁵ |
| Estrane steroids | 4.0 × 10⁻⁵ | - | - | - | - | - | - |
| Leukotrienes | - | - | - | - | 8.0 × 10⁻¹⁴ | - | - |
| Prostaglandins | - | - | - | - | 3.1 × 10⁻¹⁰ | - | - |
| Method | Technical Reproducibility (CV 1) | Biological Variability (CV) | |
|---|---|---|---|
| Interindividual | Intra-Individual 2 | ||
| DIMS | 10% (1–76) 3 | 44% (12–394) | 40% (7–117) |
| LC-MS | 25% 4 | 56% 4 | - |
| TLC | 2.2% (1.5–2.8) 5 | - | - |
| Metabogram | 1.8% (1.4–2.8) | 13.6% (8.4–17.6) | 10.8% (7.2–16.4) |
| Clinical tests 6 | - | Biochemistry tests—31% (2–117) Hematology tests—17% (5–34) Immunology tests—38% (29–45) Hemostasis tests—15% (5–54) | - |
| Parameter | Metabogram | TLC | LC-MS |
|---|---|---|---|
| Detected substances | Groups of lipids and some main nonlipid groups (carbohydrates and amino acids). | Main groups of lipids. | Lipids and other metabolites (metabolome). Numerous separate metabolites are identified, and their concentration is measured. |
| Principle of substance grouping | Functional relations (covariate substances involved in the same processes). | Structural composition | No grouping |
| Precision of measurement | High | Low | High |
| Reproducibility | High. Suitable for clinical tests (CV lower 15%) | High. Suitable for clinical tests (CV lower 15%) 1 | Low. Technical reproducibility—CV 25% 2 Biological reproducibility—CV 56% 2 |
| Complexity | Moderate. Does not require the identification of individual lipids. | Low | High. A method is usually used in scientific research. |
| Results | The concentration of several functionally related metabolite groups. | The concentration of several main lipid groups. | The concentration of thousands of individual metabolites. |
| Time for acquisition | Quick method | Time-consuming method | Time-consuming method |
| The complexity of data processing | Moderate | Low | High |
| Parameter | Reference Levels 1 | Mean ± s.d. |
|---|---|---|
| Biochemistry | ||
| Aspartate aminotransferase (IU/L) | 0–37 | 31.2 ± 15.5 |
| Alanine aminotransferase (IU/L) | 0–42 | 25.9 ± 14.7 |
| Gamma-glutamyl transferase (IU/L) | 11–50 | 28.2 ± 25.7 |
| Glutamate dehydrogenase (IU/L) | 0–7 | 6.6 ± 7.7 |
| Choline esterase (IU/L) | 5300–12,900 | 8821 ± 1356 |
| Basic phosphatase (IU/L) | 80–306 | 183 ± 39 |
| Leucine amino peptidase (IU/L) | 21.0–57.6 | 35.5 ± 5.6 |
| Bilirubin, total (μM) | 0–17.1 | 13.1 ± 7.4 |
| Bilirubin direct (μM) | 0–4.30 | 3.91 ± 2.03 |
| Amylase, total (IU/L) | 0–220 | 73.3 ± 18.9 |
| Amylase, pancreatic (IU/L) | 0–115 | 33.0 ± 13.7 |
| Lipase (IU/L) | 0–190 | 91.9 ± 31.3 |
| Lipase. Pancreatic (IU/L) | 0–60 | 39.5 ± 11.4 |
| Creatinine (μM) | 53–115 | 89.8 ± 12.6 |
| Urea (mM) | 1.7–8.3 | 4.9 ± 1.3 |
| Total protein (g/L) | 67–87 | 75.6 ± 4.0 |
| Albumin (g/L) | 35–50 | 47.2 ± 1.93 |
| Uric acid (μM) | 200–420 | 342 ± 78 |
| Glucose (mM) | 4.2–6.4 | 5.3 ± 0.5 |
| Fructose amine (μM) | 0–285 | 234 ± 28 |
| Glycosylated hemoglobin (%) | 4.5–7.5 | 5.9 ± 0.6 |
| Creatine kinase (IU/L) | 0–190 | 195 ± 180 |
| Creatine kinase MM (IU/L) | 0–190 | 175 ± 173 |
| Creatine kinase MB (IU/L) | 0–24 | 20.8 ± 7.3 |
| Lactate dehydrogenase (IU/L) | 225–450 | 311 ± 54 |
| Oxybutyrate dehydrogenase (IU/L) | 72–182 | 138 ± 22 |
| Cholesterol, total (mM) | 2.8–5.2 | 4.6 ± 0.8 |
| Cholesterol, HDL (mM) | >0.91 | 1.6 ± 0.3 |
| Cholesterol, LDL (mM) | <4.0 | 2.5 ± 0.6 |
| HDL/LDL cholesterol ratio | >0.28 | 0.7 ± 0.2 |
| Triglycerides (mM) | 0.55–2.30 | 1.0 ± 0.5 |
| Iron (μM) | 6.6–26.0 | 17.1 ± 6.5 |
| Calcium (mM) | 2.25–2.67 | 2.5 ± 0.1 |
| Magnesium (mM) | 0.7–1.05 | 0.98 ± 0.07 |
| Phosphorus, inorganic (mM) | 0.87–1.45 | 1.19 ± 0.19 |
| Chlorides (mM) | 98–106 | 103.6 ± 2.8 |
| Potassium (mM) | 3.5–5.1 | 4.0 ± 0.3 |
| Sodium (mM) | 135–145 | 139.7 ± 2.5 |
| Acid phosphatase (IU/L) | 0–5.4 | 3.0 ± 0.6 |
| Acid phosphatase, prostatic (IU/L) | 0–1.7 | 0.9 ± 0.3 |
| Hematology | ||
| Leukocytes (×109/L) | 4.0–10.0 | 6.3 ± 1.4 |
| Erythrocytes (×1012/L) | 4.0–5.7 | 5.3 ± 0.4 |
| Hemoglobin (g/L) | 130–173 | 159.7 ± 8.9 |
| Hematocrit (%) | 34.0–49.0 | 46.0 ± 3.5 |
| Average cell volume | 80.0–100.0 | 87.6 ± 4.3 |
| Average hemoglobin content per 1 erythrocyte (pg) | 27.0–35.0 | 30.4 ± 1.7 |
| Average cell hemoglobin level (g/L) | 300–380 | 348 ± 17 |
| Thrombocytes (×109/L) | 100–400 | 240 ± 49 |
| Lymphocytes (%) | 19.0–45.0 | 35.3 ± 8.0 |
| Lymphocytes (×109/L) | 1.2–4.0 | 2.2 ± 0.7 |
| Monocytes (%) | 3.0–11.0 | 7.3 ± 1.9 |
| Monocytes (×109/L) | 0.09–0.60 | 0.46 ± 0.16 |
| Granulocytes (%) | 42.0–85.0 | 57.4 ± 8.5 |
| Granulocytes (×109/L) | 2.0–5.8 | 3.6 ± 1.0 |
| Interval of red blood cell distribution (%) | 11.5–14.5 | 13.7 ± 0.6 |
| Platelet crit (%) | 0.08–1.00 | 0.16 ± 0.03 |
| Average platelet volume (fL) | 6.0–11.0 | 6.8 ± 1.4 |
| Immunology | ||
| IgA (g/L) | 0.70–4.00 | 2.4 ± 1.1 |
| IgM (g/L) | 0.40–2.30 | 1.3 ± 0.49 |
| IgG (g/L) | 7.0–16.0 | 12.3 ± 3.6 |
| Hemostasis | ||
| Prothrombin time (CT) (s) | 9.8–12.7 | 11.5 ± 0.6 |
| Prothrombin index (%) | 70–130 | 106.2 ± 12.1 |
| International normalized ratio (units) | 0.85–1.15 | 1.0 ± 0.1 |
| Partial thromboplastin time (s) | 26.4–37.5 | 38.7 ± 4.0 |
| Fibrinogen (g/L) | 1.8–3.5 | 2.0 ± 0.3 |
| Thrombin time (s) | 14–21 | 19.6 ± 0.9 |
| Antithrombin III (%) | 75–125 | 102.9 ± 11.7 |
| Plasminogen (%) | 75–150 | 102.7 ± 17.3 |
| Antiplasmin (%) | 80–120 | 121.8 ± 9.2 |
| Protein C (%) | 70–140 | 112.0 ± 23.9 |
| D-dimer (μg/L) | Up to 550 | 291 ± 157 |
Disclaimer/Publisher’s Note: The statements, opinions and data contained in all publications are solely those of the individual author(s) and contributor(s) and not of MDPI and/or the editor(s). MDPI and/or the editor(s) disclaim responsibility for any injury to people or property resulting from any ideas, methods, instructions or products referred to in the content. |
© 2023 by the authors. Licensee MDPI, Basel, Switzerland. This article is an open access article distributed under the terms and conditions of the Creative Commons Attribution (CC BY) license (https://creativecommons.org/licenses/by/4.0/).
Share and Cite
Lokhov, P.G.; Balashova, E.E.; Trifonova, O.P.; Maslov, D.L.; Grigoriev, A.I.; Ponomarenko, E.A.; Archakov, A.I. Mass Spectrometric Blood Metabogram: Acquisition, Characterization, and Prospects for Application. Int. J. Mol. Sci. 2023, 24, 1736. https://doi.org/10.3390/ijms24021736
Lokhov PG, Balashova EE, Trifonova OP, Maslov DL, Grigoriev AI, Ponomarenko EA, Archakov AI. Mass Spectrometric Blood Metabogram: Acquisition, Characterization, and Prospects for Application. International Journal of Molecular Sciences. 2023; 24(2):1736. https://doi.org/10.3390/ijms24021736
Chicago/Turabian StyleLokhov, Petr G., Elena E. Balashova, Oxana P. Trifonova, Dmitry L. Maslov, Anatoly I. Grigoriev, Elena A. Ponomarenko, and Alexander I. Archakov. 2023. "Mass Spectrometric Blood Metabogram: Acquisition, Characterization, and Prospects for Application" International Journal of Molecular Sciences 24, no. 2: 1736. https://doi.org/10.3390/ijms24021736