
Raman Spectroscopy as a Potential Adjunct of Thyroid Nodule Evaluation: A Systematic Review

 , and
, and
Abstract
:1. Introduction
1.1. Clinical Aspects
1.2. Raman Spectroscopy
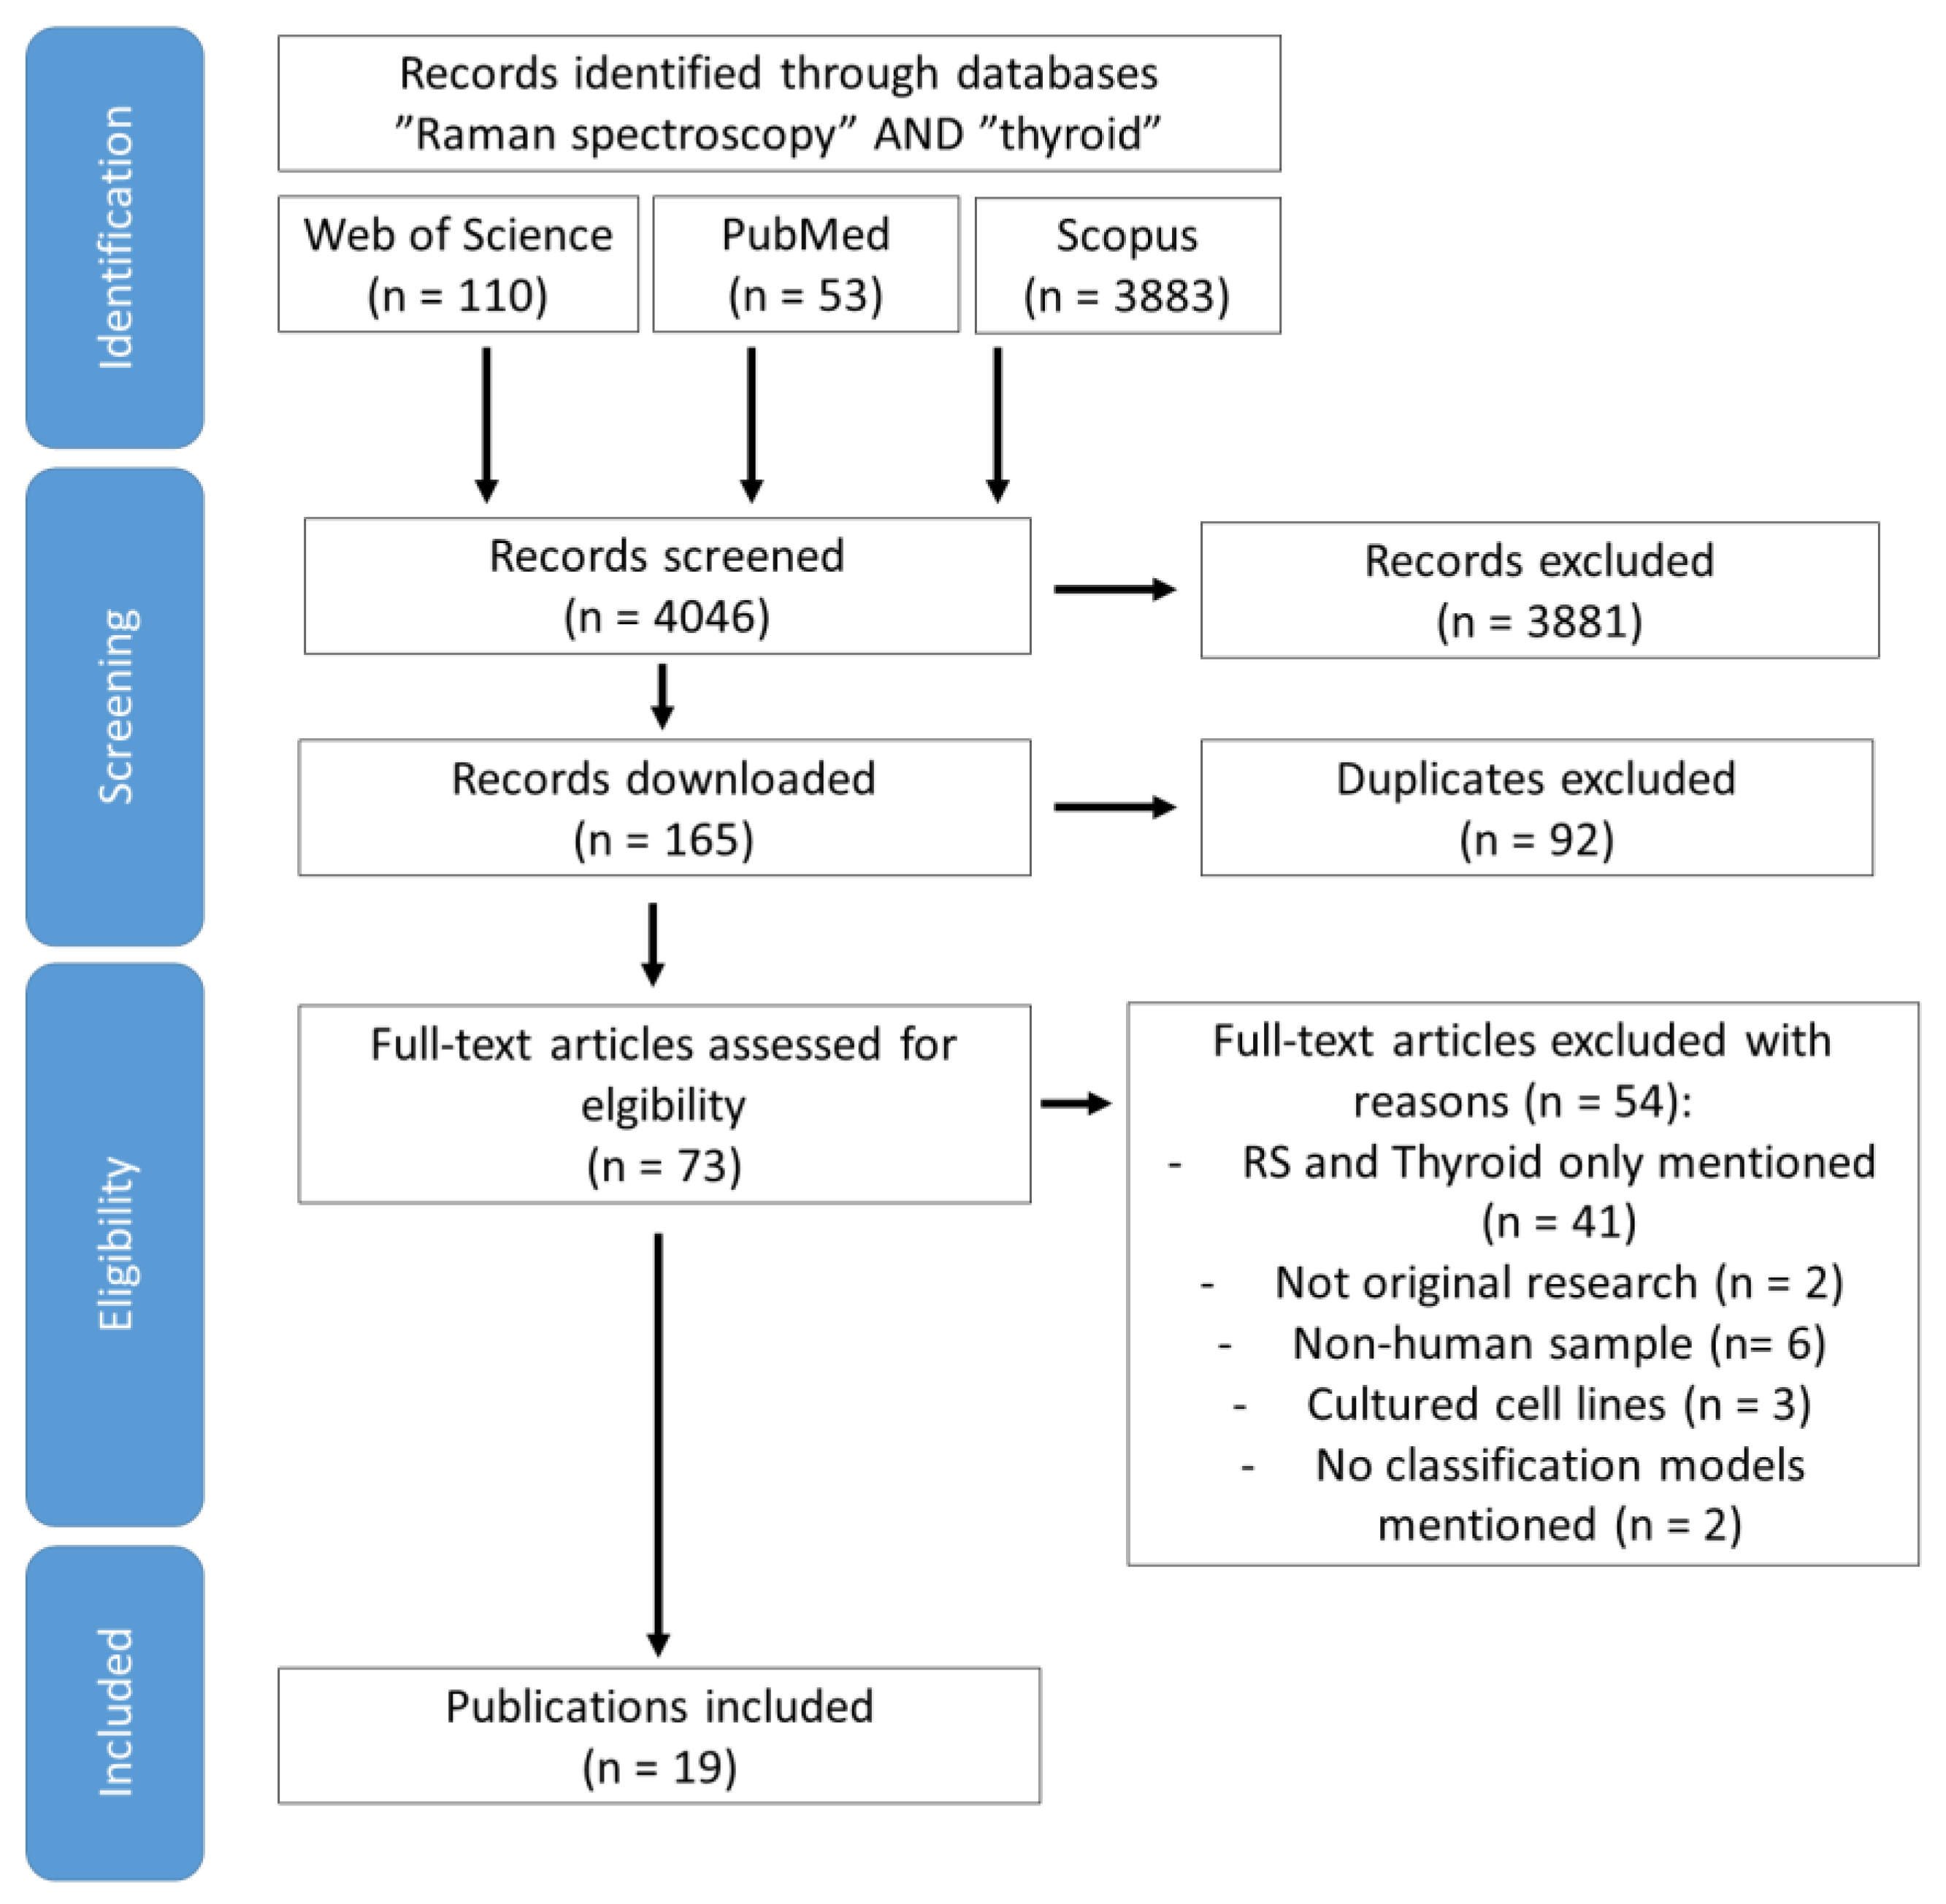
2. Methods
3. Results and Discussion
3.1. Cells from Patients
3.2. RS of Frozen Thyroid Tissue
3.3. Thyroid Tissue-Deparaffinized
3.4. Thyroid Dysfunction Based on Serum RS
3.5. Serum RS Investigations in Thyroid Carcinomas
3.6. Thyroid RS Investigation In Vivo
3.7. RS on Human Cell Cultures
3.8. RS Perspectives
4. Conclusions
Author Contributions
Funding
Conflicts of Interest
Abbreviations
References
- Mu, C.; Ming, X.; Tian, Y.; Liu, Y.; Yao, M.; Ni, Y.; Liu, Y.; Li, Z. Mapping global epidemiology of thyroid nodules among general population: A systematic review and meta-analysis. Front. Oncol. 2022, 12, 1029926. [Google Scholar] [CrossRef] [PubMed]
- Solymosi, T.; Hegedüs, L.; Bonnema, S.J.; Frasoldati, A.; Jambor, L.; Kovacs, G.L.; Papini, E.; Rucz, K.; Russ, G.; Karanyi, Z.; et al. Ultrasound-Based Indications for Thyroid Fine-Needle Aspiration: Outcome of a TIRADS-Based Approach versus Operators’ Expertise. Eur. Thyroid J. 2021, 10, 416–424. [Google Scholar] [CrossRef] [PubMed]
- WHO Classification of Tumours Editorial Board. Endocrine and Neuroendocrine Tumours, 5th ed.; International Agency for Research on Cancer: Lyon, France, 2022.
- Cibas, E.S.; Ali, S.Z. The 2017 Bethesda System for Reporting Thyroid Cytopathology. Thyroid 2017, 27, 1341–1346. [Google Scholar] [CrossRef] [PubMed]
- Vuong, H.G.; Ngo, H.T.T.; Bychkov, A.; Jung, C.K.; Vu, T.H.; Lu, K.B.; Kakudo, K.; Kondo, T. Differences in surgical resection rate and risk of malignancy in thyroid cytopathology practice between Western and Asian countries: A systematic review and meta-analysis. Cancer Cytopathol. 2020, 128, 238–249. [Google Scholar] [CrossRef]
- Vuong, H.G.; Chung, D.G.B.; Ngo, L.M.; Bui, T.Q.; Hassell, L.; Jung, C.K.; Kakudo, K.; Bychkov, A. The Use of the Bethesda System for Reporting Thyroid Cytopathology in Pediatric Thyroid Nodules: A Meta-Analysis. Thyroid 2021, 31, 1203–1211. [Google Scholar] [CrossRef]
- Lebbink, C.A.; Links, T.P.; Czarniecka, A.; Dias, R.P.; Elisei, R.; Izatt, L.; Krude, H.; Lorenz, K.; Luster, M.; Newbold, K.; et al. 2022 European Thyroid Association Guidelines for the management of pediatric thyroid nodules and differentiated thyroid carcinoma. Eur. Thyroid J. 2022, 11, e220146. [Google Scholar] [CrossRef]
- Viola, D.; Materazzi, G.; Valerio, L.; Molinaro, E.; Agate, L.; Faviana, P.; Seccia, V.; Sensi, E.; Romei, C.; Piaggi, P.; et al. Prophylactic central compartment lymph node dissection in papillary thyroid carcinoma: Clinical implications derived from the first prospective randomized controlled single institution study. J. Clin. Endocrinol. Metab. 2015, 100, 1316–1324. [Google Scholar] [CrossRef]
- Morita, S.; Takagi, T.; Inaba, H.; Furukawa, Y.; Kishimoto, S.; Uraki, S.; Shimo, N.; Takeshima, K.; Uraki, S.; Doi, K.; et al. Effect of SARS-CoV-2 BNT162b2 mRNA vaccine on thyroid autoimmunity: A twelve-month follow-up study. Front. Endocrinol. 2023, 14, 1058007. [Google Scholar] [CrossRef]
- Wahadoszamen, M.; Rahaman, A.; Hoque, N.M.R.; I Talukder, A.; Abedin, K.M.; Haider, A.F.M.Y. Laser Raman Spectroscopy with Different Excitation Sources and Extension to Surface Enhanced Raman Spectroscopy. J. Spectrosc. 2015, 2015, 895317. [Google Scholar] [CrossRef]
- Dybas, J.; Marzec, K.M.; Pacia, M.Z.; Kochan, K.; Czamara, K.; Chrabaszcz, K.; Staniszewska-Slezak, E.; Malek, K.; Baranska, M.; Kaczor, A. Raman spectroscopy as a sensitive probe of soft tissue composition—Imaging of cross-sections of various organs vs. single spectra of tissue homogenates. TrAC—Trends Anal. Chem. 2016, 85, 117–127. [Google Scholar] [CrossRef]
- Baker, M.J.; Byrne, H.J.; Chalmers, J.; Gardner, P.; Goodacre, R.; Henderson, A.; Kazarian, S.G.; Martin, F.L.; Moger, J.; Stone, N.; et al. Clinical applications of infrared and Raman spectroscopy: State of play and future challenges. Analyst 2018, 143, 1735–1757. [Google Scholar] [CrossRef] [PubMed]
- Parachalil, D.R.; McIntyre, J.; Byrne, H.J. Potential of Raman spectroscopy for the analysis of plasma/serum in the liquid state: Recent advances. Anal. Bioanal. Chem. 2020, 412, 1993–2007. [Google Scholar] [CrossRef]
- Yang, S.; Li, B.; Slipchenko, M.N.; Akkus, A.; Singer, N.G.; Yeni, Y.N.; Akkus, O. Laser Wavelength Dependence of Background Fluorescence in Raman Spectroscopic Analysis of Synovial Fluid from Symptomatic Joints. J. Raman Spectrosc. 2013, 44, 1089–1095. [Google Scholar] [CrossRef] [PubMed]
- Lemler, P.; Premasiri, W.R.; DelMonaco, A.; Ziegler, L.D. NIR Raman spectra of whole human blood: Effects of laser-induced and in vitro hemoglobin denaturation. Anal. Bioanal. Chem. 2014, 406, 193–200. [Google Scholar] [CrossRef] [PubMed]
- Kujdowicz, M.; Placha, W.; Mech, B.; Chrabaszcz, K.; Okoń, K.; Malek, K. In Vitro Spectroscopy-Based Profiling of Urothelial Carcinoma: A Fourier Transform Infrared and Raman Imaging Study. Cancers 2021, 13, 123. [Google Scholar] [CrossRef]
- Neto, V.; Esteves-Ferreira, S.; Inácio, I.; Alves, M.; Dantas, R.; Almeida, I.; Guimarães, J.; Azevedo, T.; Nunes, A. Metabolic Profile Characterization of Different Thyroid Nodules Using FTIR Spectroscopy: A Review. Metabolites 2022, 12, 53. [Google Scholar] [CrossRef] [PubMed]
- Baker, M.J.; Trevisan, J.; Bassan, P.; Bhargava, R.; Butler, H.J.; Dorling, K.M.; Fielden, P.R.; Fogarty, S.W.; Fullwood, N.J.; Heys, K.A.; et al. Using Fourier transform IR spectroscopy to analyze biological materials. Nat. Protoc. 2014, 9, 1771–1791. [Google Scholar] [CrossRef]
- Yang, M.; Wang, J.; Quan, S.; Xu, Q. Minireview: Advances in Spectral-Based Machine Deep Learning Algorithms for Thyroid Function Diagnosis. Anal. Lett. 2023, 1–24. [Google Scholar] [CrossRef]
- Page, M.J.; Moher, D.; Bossuyt, P.M.; Boutron, I.; Hoffmann, T.C.; Mulrow, C.D.; Shamseer, L.; Tetzlaff, J.M.; Akl, E.A.; Brennan, S.E.; et al. PRISMA 2020 explanation and elaboration: Updated guidance and exemplars for reporting systematic reviews. BMJ 2021, 372, n160. [Google Scholar] [CrossRef]
- Oliveira, M.A.S.; Campbell, M.; Afify, A.M.; Huang, E.C.; Chan, J.W. Hyperspectral Raman microscopy can accurately differentiate single cells of different human thyroid nodules. Biomed. Opt. Express 2019, 10, 4411. [Google Scholar] [CrossRef]
- Oliveira, M.A.S.; Campbell, M.; Afify, A.M.; Huang, E.C.; Chan, J.W. Raman-based cytopathology: An approach to improve diagnostic accuracy in medullary thyroid carcinoma. Biomed. Opt. Express 2020, 11, 6962. [Google Scholar] [CrossRef]
- Oliveira, M.A.S.; Campbell, M.; Afify, A.M.; Huang, E.C.; Chan, J.W. Simulated fine-needle aspiration diagnosis of follicular thyroid nodules by hyperspectral Raman microscopy and chemometric analysis. J. Biomed. Opt. 2022, 27, 095001. [Google Scholar] [CrossRef]
- Palermo, A.; Sodo, A.; Naciu, A.M.; Di Gioacchino, M.; Paolucci, A.; di Masi, A.; Maggi, D.; Crucitti, P.; Longo, F.; Perrella, E.; et al. Clinical Use of Raman Spectroscopy Improves Diagnostic Accuracy for Indeterminate Thyroid Nodules. J. Clin. Endocrinol. Metab. 2022, 107, 3309–3319. [Google Scholar] [CrossRef]
- Teixeira, C.S.B.; Bitar, R.A.; Santos, A.B.O.; Kulcsar, M.A.V.; Friguglietti, C.U.M.; Martinho, H.S.; da Costa, R.B.; Martin, A.A. Evaluation of thyroid tissue by Raman spectroscopy. Biomed. Vib. Spectrosc. IV Adv. Res. Ind. 2010, 7560, 75600G. [Google Scholar] [CrossRef]
- Rau, J.V.; Graziani, V.; Fosca, M.; Taffon, C.; Rocchia, M.; Crucitti, P.; Pozzilli, P.; Onetti Muda, A.; Caricato, M.; Crescenzi, A. RAMAN spectroscopy imaging improves the diagnosis of papillary thyroid carcinoma. Sci. Rep. 2016, 6, 35117. [Google Scholar] [CrossRef] [PubMed]
- Medeiros Neto, L.P.; das Chagas e Silva de Carvalho, L.F.; dos Santos, L.; Tellez Soto, C.A.; de Azevedo Canevari, R.; de Oliveira Santos, A.B.; Mello, E.S.; Pereira, M.A.; Cernea, C.R.; Brandão, L.G.; et al. Micro-Raman spectroscopic study of thyroid tissues. Photodiagn. Photodyn. Ther. 2017, 17, 164–172. [Google Scholar] [CrossRef] [PubMed]
- Rau, J.V.; Fosca, M.; Graziani, V.; Taffon, C.; Rocchia, M.; Caricato, M.; Pozzilli, P.; Onetti Muda, A.; Crescenzi, A. Proof-of-concept Raman spectroscopy study aimed to differentiate thyroid follicular patterned lesions. Sci. Rep. 2017, 7, 14970. [Google Scholar] [CrossRef]
- Sbroscia, M.; Di Gioacchino, M.; Ascenzi, P.; Crucitti, P.; di Masi, A.; Giovannoni, I.; Longo, F.; Mariotti, D.; Naciu, A.M.; Palermo, A.; et al. Thyroid cancer diagnosis by Raman spectroscopy. Sci. Rep. 2020, 10, 16590. [Google Scholar] [CrossRef]
- Mert, S.; Sancak, S.; Aydın, H.; Fersahoğlu, A.T.; Somay, A.; Özkan, F.; Çulha, M. Development of a SERS based cancer diagnosis approach employing cryosectioned thyroid tissue samples on PDMS. Nanomed. Nanotechnol. Biol. Med. 2022, 44, 102577. [Google Scholar] [CrossRef]
- Wang, S.-S.; Xie, C.; Ye, D.-X.; Jin, B. Differentiating Follicular Thyroid Carcinoma and Thyroid Adenoma by Using Near-Infrared Surface-Enhanced Raman Spectroscopy. Indian J. Surg. 2023, 1–9. [Google Scholar] [CrossRef]
- Senol, O.; Albayrak, M.; Miloglu, F.D.; Kadioglu, Y.; Calik, M. Application of photonics in diagnosis of papillary thyroid carcinoma tissues through Raman spectroscopy-assisted with chemometrics. Anal. Lett. 2018, 51, 229–235. [Google Scholar] [CrossRef]
- Depciuch, J.; Stanek-Widera, A.; Skrzypiec, D.; Lange, D.; Biskup-Frużyńska, M.; Kiper, K.; Stanek-Tarkowska, J.; Kula, M.; Cebulski, J. Spectroscopic identification of benign (follicular adenoma) and cancerous lesions (follicular thyroid carcinoma) in thyroid tissues. J. Pharm. Biomed. Anal. 2019, 170, 321–326. [Google Scholar] [CrossRef] [PubMed]
- Zheng, X.; Lv, G.; Du, G.; Zhai, Z.; Mo, J.; Lv, X. Rapid and Low-Cost Detection of Thyroid Dysfunction Using Raman Spectroscopy and an Improved Support Vector Machine. IEEE Photonics J. 2018, 10, 18191739. [Google Scholar] [CrossRef]
- Wang, D.; Jiang, J.; Mo, J.; Tang, J.; Lv, X. Rapid Screening of Thyroid Dysfunction Using Raman Spectroscopy Combined with an Improved Support Vector Machine. Appl. Spectrosc. 2020, 74, 674–683. [Google Scholar] [CrossRef]
- Tian, D.; Lü, G.; Zhai, Z.; Du, G.; Mo, J.; Lü, X. Rapid thyroid dysfunction screening based on serum surface-enhanced Raman scattering and multivariate statistical analysis. Laser Phys. Lett. 2018, 15, 015603. [Google Scholar] [CrossRef]
- Song, H.; Dong, C.; Zhang, X.; Wu, W.; Chen, C.; Ma, B.; Chen, F.; Chen, C.; Lv, X. Rapid identification of papillary thyroid carcinoma and papillary microcarcinoma based on serum Raman spectroscopy combined with machine learning models. Photodiagn. Photodyn. Ther. 2022, 37, 102647. [Google Scholar] [CrossRef]
- Li, Z.; Li, C.; Lin, D.; Huang, Z.; Pan, J.; Chen, G.; Lin, J.; Liu, N.; Yu, Y.; Feng, S.; et al. Surface-enhanced Raman spectroscopy for differentiation between benign and malignant thyroid tissues. Laser Phys. Lett. 2014, 11, 045602. [Google Scholar] [CrossRef]
- Liang, X.; Miao, X.; Xiao, W.; Ye, Q.; Wang, S.; Lin, J.; Li, C.; Huang, Z. Filter-membrane-based ultrafiltration coupled with surface-enhanced raman spectroscopy for potential differentiation of benign and malignant thyroid tumors from blood plasma. Int. J. Nanomed. 2020, 15, 2303–2314. [Google Scholar] [CrossRef]
- O’Dea, D.; Bongiovanni, M.; Sykiotis, G.P.; Ziros, P.G.; Meade, A.D.; Lyng, F.M.; Malkin, A. Raman spectroscopy for the preoperative diagnosis of thyroid cancer and its subtypes: An in vitro proof-of-concept study. Cytopathology 2019, 30, 51–60. [Google Scholar] [CrossRef]
- Soares de Oliveira, M.A.; Fan, Y.; Campbell, M.J.; Huang, E.C.; Chan, J.W. Towards a Raman-based diagnostic approach for characterizing cytologically indeterminate thyroid nodules. SPIE 2019, 53, 10881. [Google Scholar] [CrossRef]
- Palermo, A.; Fosca, M.; Tabacco, G.; Marini, F.; Graziani, V.; Santarsia, M.C.; Longo, F.; Lauria, A.; Cesareo, R.; Giovannoni, I.; et al. Raman Spectroscopy Applied to Parathyroid Tissues: A New Diagnostic Tool to Discriminate Normal Tissue from Adenoma. Anal. Chem. 2018, 90, 847–854. [Google Scholar] [CrossRef] [PubMed]
- Medeiros-Neto, L.P.; Tellez Soto, C.A.; Chagas, M.J.; Carvalho, L.F.C.; Rajasekaran, R.; Martin, A.A. In vivo Raman spectroscopic characterization of papillary thyroid carcinoma. Vib. Spectrosc. 2019, 101, 1–9. [Google Scholar] [CrossRef]
- Neto, L.P.M.; Martin, A.A.; Soto, C.A.T.; Santos, A.B.O.; Mello, E.S.; Pereira, M.A.; Cernea, C.R.; Brandão, L.G.; Canevari, R.A. Biochemical and molecular characterization of thyroid tissue by micro-Raman spectroscopy and gene expression analysis. Photonic Ther. Diagn. XII 2016, 9689, 96892A. [Google Scholar] [CrossRef]
- Petruk, A.A.; Álvarez, R.M.S. Structural changes induced by interactions between thyroid hormones and phospholipid membranes: A Raman Spectroscopy study. J. Raman Spectrosc. 2013, 44, 346–354. [Google Scholar] [CrossRef]
- Sosa Morales, M.C.; Juárez, A.C.; Álvarez, R.M.S. Raman spectroscopy study of the interaction of 3,5,3′-triiodo-L-thyronine with phosphatidylglycerol lipid bilayers. J. Raman Spectrosc. 2015, 46, 302–308. [Google Scholar] [CrossRef]
- Téllez Soto, C.A.; Medeiros-Neto, L.P.; dos Santos, L.; Santos, A.B.O.; Ferreira, I.; Singh, P.; Canevari, R.A.; Martin, A.A. Infrared and confocal Raman spectroscopy to differentiate changes in the protein secondary structure in normal and abnormal thyroid tissues. J. Raman Spectrosc. 2018, 49, 1165–1173. [Google Scholar] [CrossRef]
- Law, A.W.L.; Ahmed, R.; Cheung, T.W.; Mak, C.Y.; Lau, C. In situ cellular level Raman spectroscopy of the thyroid. Biomed. Opt. Express 2017, 8, 670. [Google Scholar] [CrossRef] [PubMed]
- Medina-Gutiérrez, C.; Quintanar, J.L.; Frausto-Reyes, C.; Sato-Berrú, R. The application of NIR Raman spectroscopy in the assessment of serum thyroid-stimulating hormone in rats. Spectrochim. Acta—Part A Mol. Biomol. Spectrosc. 2005, 61, 87–91. [Google Scholar] [CrossRef] [PubMed]
- Khatami, F.; Larijani, B.; Nikfar, S.; Hasanzad, M.; Fendereski, K.; Tavangar, S.M. Personalized treatment options for thyroid cancer: Current perspectives. Pharmacogenom. Pers. Med. 2019, 12, 235–245. [Google Scholar] [CrossRef]
- Harris, A.T.; Garg, M.; Yang, X.B.; Fisher, S.E.; Kirkham, J.; Smith, D.A.; Martin-Hirsch, D.P.; High, A.S. Raman spectroscopy and advanced mathematical modelling in the discrimination of human thyroid cell lines. Head Neck Oncol. 2009, 1, 38. [Google Scholar] [CrossRef]
- Taylor, J.N.; Mochizuki, K.; Hashimoto, K.; Kumamoto, Y.; Harada, Y.; Fujita, K.; Komatsuzaki, T. High-Resolution Raman Microscopic Detection of Follicular Thyroid Cancer Cells with Unsupervised Machine Learning. J. Phys. Chem. B 2019, 123, 4358–4372. [Google Scholar] [CrossRef] [PubMed]
- Wang, L.; Liu, W.; Tang, J.W.; Wang, J.J.; Liu, Q.H.; Wen, P.B.; Wang, M.M.; Pan, Y.C.; Gu, B.; Zhang, X. Applications of Raman Spectroscopy in Bacterial Infections: Principles, Advantages, and Shortcomings. Front. Microbiol. 2021, 12, 683580. [Google Scholar] [CrossRef] [PubMed]
- Petersen, M.; Yu, Z.; Lu, X. Application of Raman spectroscopic methods in food safety: A review. Biosensors 2021, 11, 187. [Google Scholar] [CrossRef] [PubMed]
- Dumouilla, V.; Dussap, C.-G. Raman spectroscopy-based imaging in the food industry. In Current Developments in Biotechnology and Bioengineering Advances in Food Engineering; Elsevier: Amsterdam, The Netherlands, 2022; pp. 391–420. ISBN 978-0-323-91158-0. [Google Scholar]
- Kujdowicz, M.; Perez-Guaita, D.; Chlosta, P.; Okon, K.; Malek, K. Evaluation of grade and invasiveness of bladder urothelial carcinoma using infrared imaging and machine learning. Analyst 2023, 148, 278–285. [Google Scholar] [CrossRef] [PubMed]
- Kujdowicz, M.; Perez Guaita, D.; Chłosta, P.; Okon, K.; Malek, K. Towards the Point of Care and noninvasive classification of bladder cancer from urine sediment infrared spectroscopy. Spectral differentiation of normal, abnormal and cancer patients. Microchem. J. 2021, 168, 106460. [Google Scholar] [CrossRef]
- Kujdowicz, M.; Mech, B.; Chrabaszcz, K.; Chlosta, P.; Okon, K.; Malek, K. FTIR Spectroscopic Imaging Supports Urine Cytology for Classification of Low- and High-Grade Bladder Carcinoma. Cancers 2021, 13, 5734. [Google Scholar] [CrossRef]
- Kujdowicz, M.; Perez-Guaita, D.; Chlosta, D.; Okon, K.; Malek, K. Fourier transform IR imaging of primary tumors predicts lymph node metastasis of bladder carcinoma. BBA—Mol. Basis Dis. 2023, 1869, 166840. [Google Scholar] [CrossRef]
- Chrabaszcz, K.; Kaminska, K.; Augustyniak, K.; Kujdowicz, M.; Smeda, M.; Jasztal, A.; Stojak, M.; Marzec, K.M.; Malek, K. Tracking extracellular matrix remodeling in lungs induced by breast cancer metastasis. Fourier transform infrared spectroscopic studies. Molecules 2020, 25, 236. [Google Scholar] [CrossRef]
- Chrabaszcz, K.; Kaminska, K.; Song, C.L.; Morikawa, J.; Kujdowicz, M.; Michalczyk, E.; Smeda, M.; Stojak, M.; Jasztal, A.; Kazarian, S.G.; et al. Fourier transform infrared polarization contrast imaging recognizes proteins degradation in lungs upon metastasis from breast cancer. Cancers 2021, 13, 162. [Google Scholar] [CrossRef]

| Subject | Laser Line and Power | Spectral Region and Resolution [cm−1] | Classification Model | Classification Parameters | Author, Year, Ref. |
|---|---|---|---|---|---|
| Cells From Patients | |||||
| 10 patients: 5 PTC and 5 benign TNs (divided into subtypes); 121 and 127 cells of PTC and benign, respectively (228 cells in total) | 785 nm; 2 W | 500–1750; n.a. | PCA-LDA | Se 95%, Sp 97%, Acc 97% (CV-PTC vs. benign) Se 100%, Sp 100%, Acc 100% (FTC vs. FA) Se 94%, Sp 98%, Acc 98% (CV-PTC vs. FV-PTC) | - Oliveira et al., 2019 [21] |
| 14 patients: 4 benign, 5 classic variant PTC, 5 MTC; 365 cells in total | 785 nm; n.a. | 950–1800; n.a. | PCA-LDA and 1003 cm−1 band intensity | PLS-DA: Se 96%, Sp 95%, Acc 95% (MTC vs. benign) Se, Sp–n.a, Acc 79% (PTC vs. benign) Se 99%, Sp 99%, Acc 99% (MTC vs. PTC) Based on 1003 cm−1 intensity: Acc 87% (MTC vs. benign) Acc 79% (PTC vs. benign) Acc 95% (MTC vs. PTC) | - Oliveira et al., 2020 [22] |
| 11 patients: 2 FA, 3 HCA, 2 FTC, 4 HCC; 392 cells in total | 785 nm; n.a. | 950–1750; n.a. | PCA-LDA, SVM, ANN | Acc for PCA-LDA models c.a. 60% Acc c.a. 81% (SVM, CNN, all 4 groups in one model) Acc 84% (SVM, malignant vs. non-malignant) Acc 83% (CNN malignant vs. non-malignant) | - Oliveira et al., 2022 [23] |
| 123 patients: 38 benign, 85 cancer (patients from TIR3A to TIR5 in USG) | 532 nm; 100 mW | 100–3600; 1 | AHC, KM | Se 60–85%, Sp 87–100%, Prevalence 27–80% | Palermo et al., 2022 [24] |
| Frozen Tissue | |||||
| 18 patients, 27 tissue samples: healthy (11), goiter (9), FA (1), FTC (1), PTC (5) | 1064 nm; 300 mW | 450–1800; 4 | Discriminant Analysis of Minitab software | Acc 58% (goiter TNs vs. healthy) Acc 65% (healthy and goiter vs. PTC) Acc 73% (goiter and FA vs. PTC and FTC) | Teixeira et al., 2010 [25] |
| 9 PTC patients: 7 CV-PTC, 3 FV-PTC; 2 healthy and 2 cancer images of each patient (1 patient had mixed variant CV/FV-PTC and additional 2 maps) | 532 nm; 8 mW | 200–3400; 5 | PCA-LDA | Se 100%, Sp 100%, Acc 100% (healthy vs. PTC) Se 93%, Sp 100%, Acc 95% (CV-PTC vs. FV-PTC) | Rau et al., 2016 [26] |
| 30 samples (number of patients n.a.): 10 normal thyroid, 10 goiter, and 10 thyroid cancer (7 PTC and 3 FTC) | 785 nm; 20 mW | 400–1800; n.a. | PCA-LDA with cross validation and binary logistic regression (BLR) analysis | Se 73%, Sp 87 %, Acc 89% (cancer vs. control); Se 77%, Sp 70%, Acc 86% (goiter vs. cancer) Se 60%, Sp 67%, Acc 81% (normal vs. goiter) | Medeiros-Neto et al., 2017 [27] |
| 14 patients: 5 FV-PTC, hyperplastic 1 TN, 4 FA, 2 HCA; 66 maps in total from tumours and healthy tissue | 532 nm; 8 mW | 200–3400; 5 | PCA-LDA | Se 89%, Sp 68%, Acc 78% (healthy vs. follicular neoplasms); Se 93%, Sp 86%, Acc 89% (FA vs. FTC and PTC) | Rau et al., 2017 [28] |
| 30 patients, 46 samples: 15 healthy, 8 FA, 3 FTC, 15 PTC, 4 FV-PTC | 532 nm; 60 mW | 100–3800; 1 | AHC, KM | Acc 90% (healthy vs. cancers) Acc 82% (healthy vs. all tumours) | Sbroscia et al., 2020 [29] |
| SERS of 31 patients, 64 samples: 31 healthy and 33 tumours (22 benign and 11 malignant) | 830 nm; 30 mW | 400–1800; n.a. | PCA-LDA | Se 94%, Sp 79%, Acc 93%, (benign and malignant) Se 79%, Sp 71%, Acc 76% (benign and healthy) Se 100%, Sp 76%, Acc 91% (malignant and healthy) | Mert et al., 2022 [30] |
| SERS of 74 patients: 37 FA, 37 FTC | 785 nm; n.a. | 400–1750; n.a. | Logistic regression analysis | Se 100%, Sp 83–100%, Acc 100% (tissue) Se 75–88%, Sp 50–57%, Acc 61–68% (serum) | Wang et al., 2023 [31] |
| Deparaffinized Tissue | |||||
| 23 samples (number of patients n.a.): healthy (12), tumours (11) | 785 nm; n.a. | 100–4000; n.a. | OPLS | Se 75%, Sp 82% | Senol et al., 2018 [32] |
| 32 patients: 15 FA, 17 FTC | 1064 nm; 1 W | 150–3700; 8 | PCA-LDA | Se 76%, Sp 81% (control vs. FTC) Se 81%, Sp 94% (control vs. FA) Se 66%, Sp 70% (FA vs. FTC) | Depciuch et al., 2019 [33] |
| Serum–TNs with Thyroid Disorders | |||||
| 74 patients: 34 with thyroid dysfunction and 40 healthy | 532 nm; 100 mW | 400–1800; 0.35 | PCA-SVM (AFSA, AFUD, GS) | Acc: AFUD-SVM 83%, GS-SVM 81%, AFSA-SVM 80% | Zheng et al., 2018 [34] |
| 185 patients: 95 with thyroid dysfunction and 90 patients with normal thyroid function | 532 nm; 50 mW | 400–2000; n.a. | SVM (PSO, SAPSO, GA, AFUD, GS, PLS-GAPSO) | The best GAPSO-SVM: Se 92%, Sp 98%, Acc 95% | Wang et al., 2020 [35] |
| SERS of 64 patients: 32 with thyroid dysfunction and 32 with normal thyroid function | 633 nm; n.a. | 0–4000, n.a. | PCA-LDA | Se 91%, Sp 84%, Acc 87% | Tian et al., 2018 [36] |
| Serum-cancer | |||||
| 48 patients: 16 PTC, 32 PMC | 785 nm; 280 mW | 123–3975; n.a. | DT, RF, and Adaboost | Acc: DT 75%, RF 82%, Adaboost 85% | Song et al., 2022 [37] |
| SERS of 77 patients: 32 PTC, 20 nodular goiter, 25 healthy | 785 nm; n.a. | 400–1800; 2 | PCA-LDA | Se 92%, Sp 83% (normal) Se 75%, Sp 89% (nodular goiter) Se 88%, Sp 84% (PTC) | Li et al. 2014 [38] |
| SERS of 102 patients: 70 cancers and 32 benign thyroid tumours | 785 nm; 2 mW | 400–1800; n.a. | PCA-LDA, Lasso-PLS-DA | PCA-LDA: Se 61–84%, Sp 44–53%, Acc 84% Lasso-PLS-DA: Se 90%, Sp 59%, Acc: 80% | Liang et al. (2020) [39] |
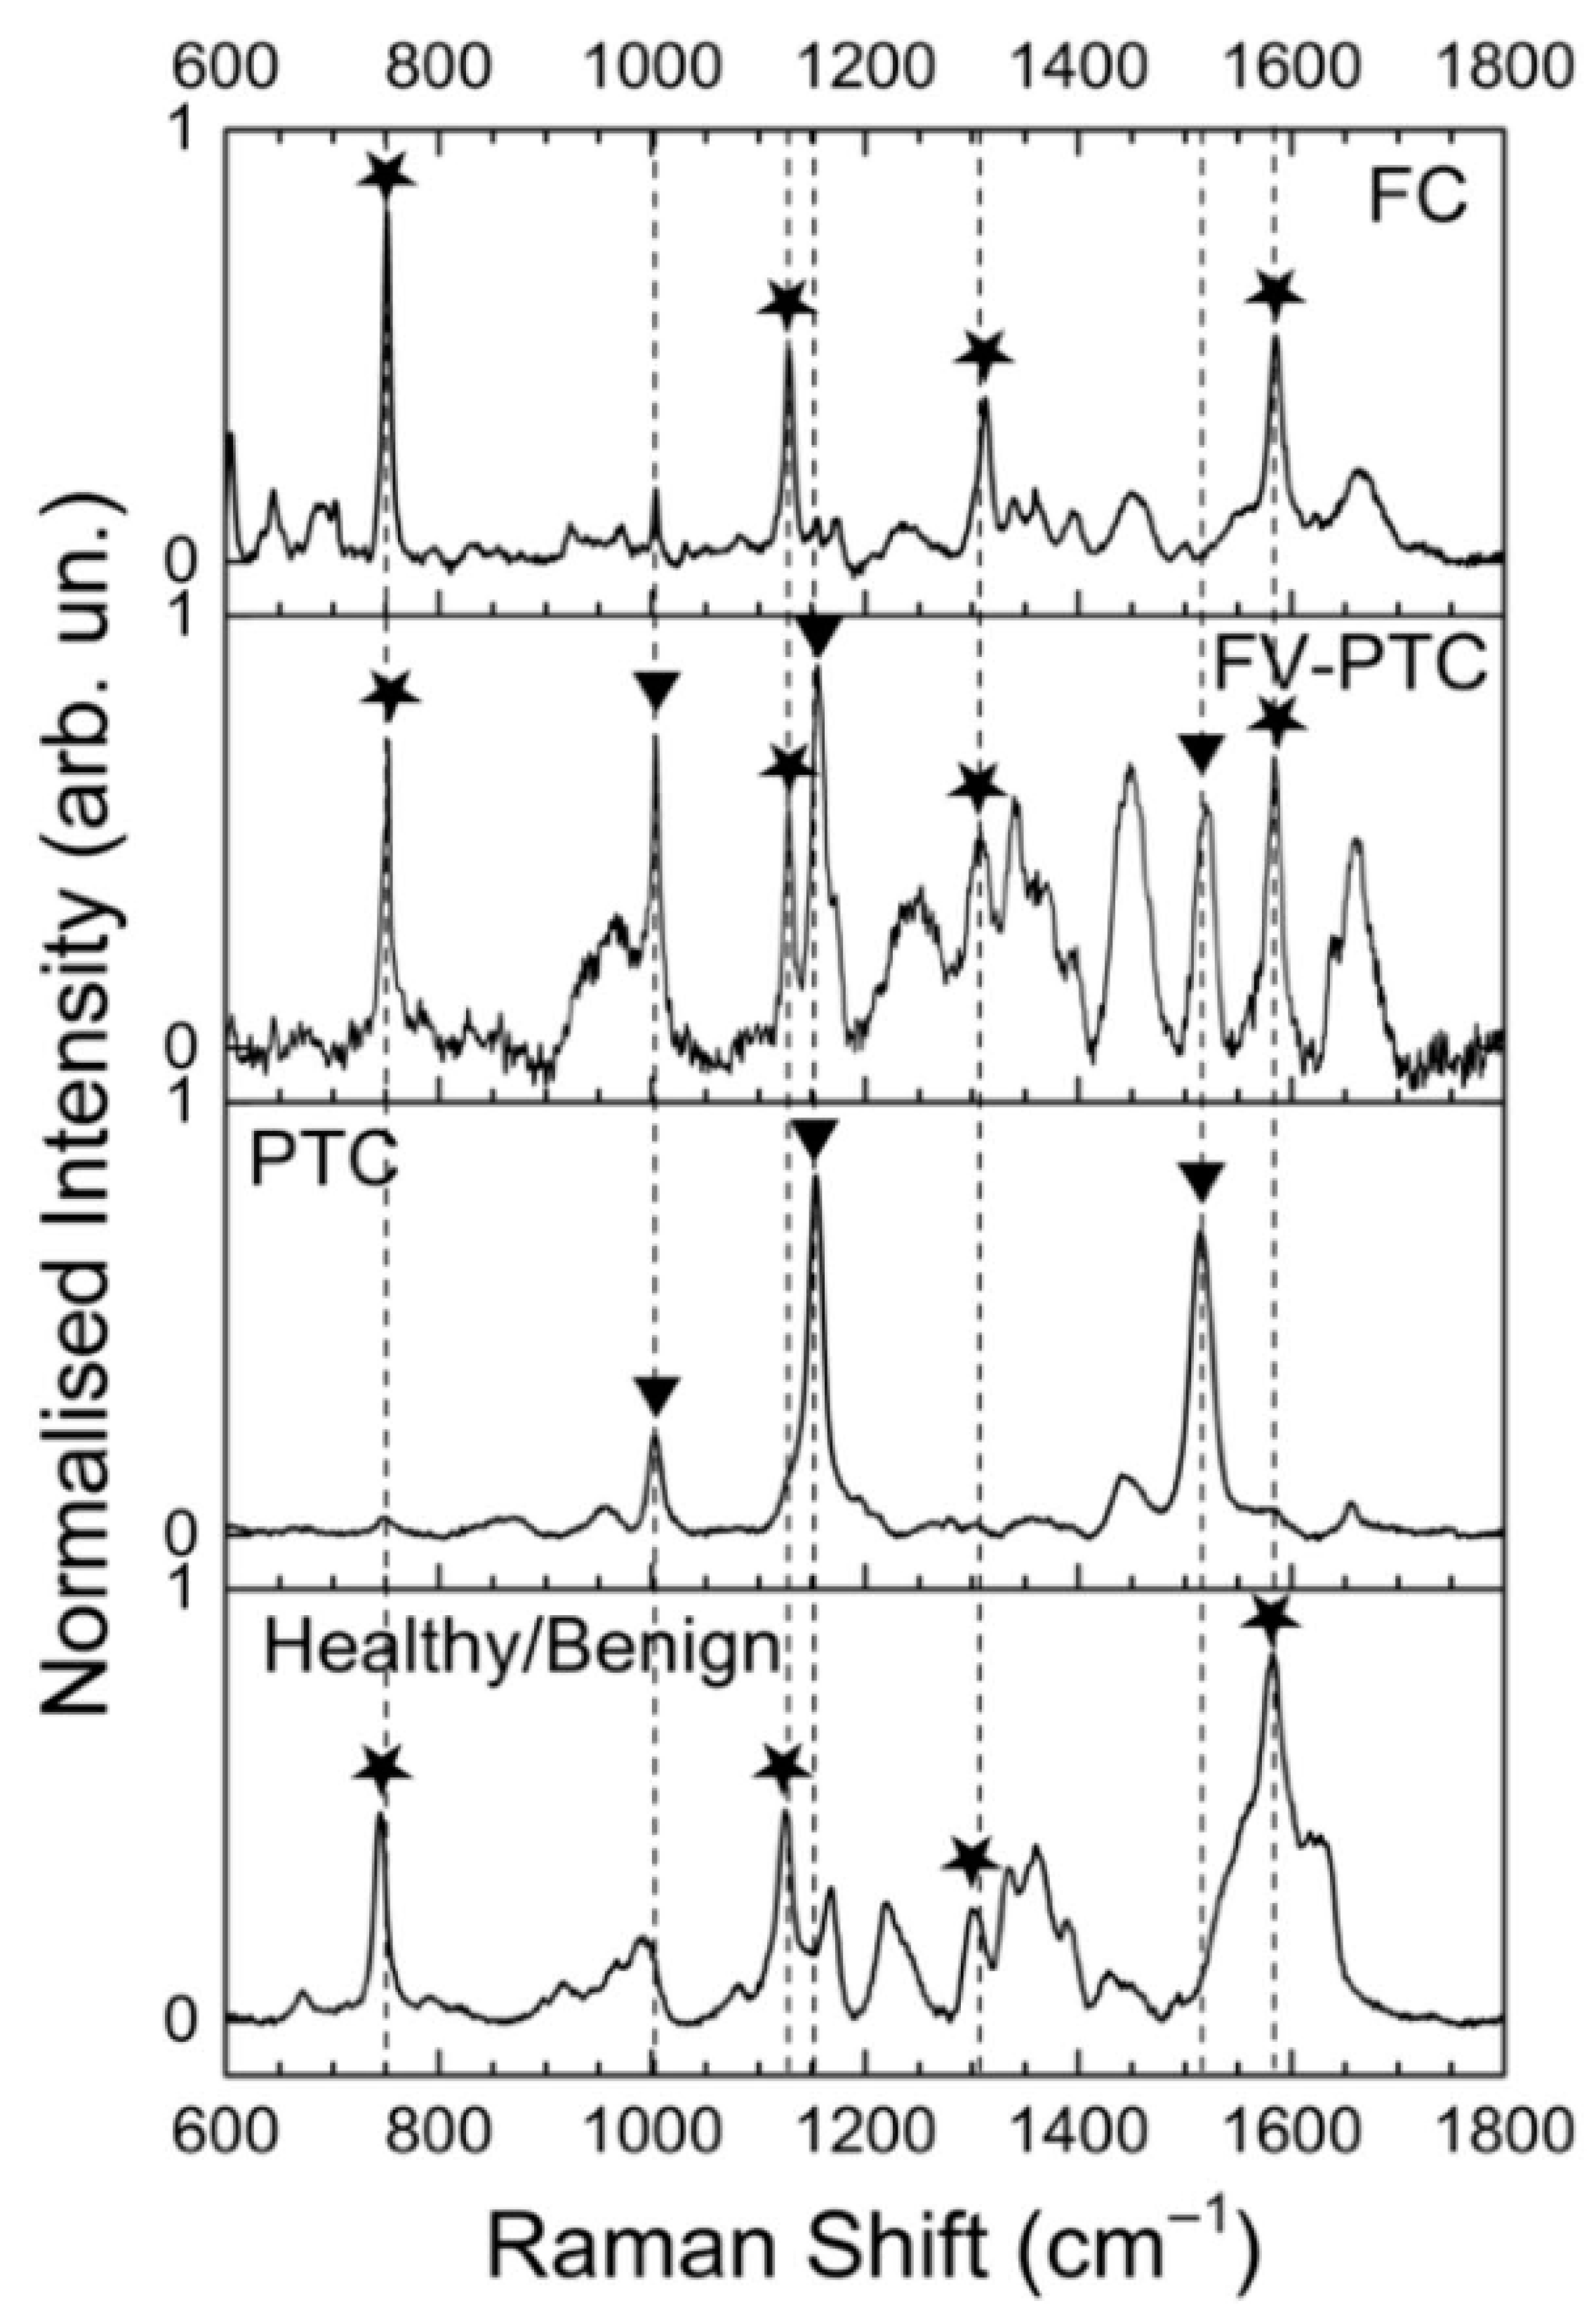
| Band [cm−1] | Assignment |
|---|---|
| 430 | Cholesterol ester |
| 454 | Ring torsion of phenyl |
| 477 | Polysaccharides |
| 509–524 | S-S disulfide stretching |
| 573 | Tryptophan, cytosine, guanine |
| 600 | Nucleotides |
| 673 | Tryptophan (ring breathing) |
| 700 | Methionine |
| 720 | DNA and RNA |
| 747 | Cytochrome c |
| 816 | Collagen, ν(C-C) |
| 856 | Collagen protein, proline hydroxyproline, tyrosine |
| 918 | Proline, hydroxyproline, lactic acid |
| 940 | Proline, hydroxyproline, collagen ν(C-C) |
| 957 | Carotenoids, phosphates, cholesterol |
| 1004–1006 | Phenylalanine, νs(C-C), carotenoids |
| 1032 | τ(HCH)(CH3), τ(HCH)(CH2) collagen, phospholipids, phenylalanine |
| 1084 | Phosphodiester groups in nucleic acids |
| 1138 | ν(C-N) of proteins and ν(C-O) of carbohydrates |
| 1156 | ν(C-C), ν(C-N) of proteins and ν(C-C) of lipids, carotenoids |
| 1172 | Tyrosine, δ(C-H) |
| 1204 | Amide III, tryptophan, phenylalanine, adenine |
| 1224 | Amide III (β-sheet structure) |
| 1242–1266 | Amide III of collagen, CH2 wagging, ν(C-N), proteins (α-helix), pyrimidine bases |
| 1282 | Collagen, nucleic acids, phosphates |
| 1304 | τ(HCH)(CH3), τ(HCH)(CH2) collagen |
| 1312 | CH2, CH3 twisting mode of collagen/lipid |
| 1360 | Tryptophan |
| 1370 | Carbohydrates |
| 1440 | δ(CH2, CH3), lipids, cholesterol |
| 1480 | Guanine, adenine (ring breathing of DNA bases) |
| 1526 | In plane vibrations of conjugated (C=C) carotenoids |
| 1545–1568 | Tryptophan |
| 1592–1602 | δ(C=C), phenylalanine |
| 1636 | Amide I, collagen |
| 1660 | Amide I (α-helix), ν(C-C)cis fatty acids |
| 1664 | Amide I, collagen, lipids, DNA |
| 1684 | Amide I ν(C=O) |
Disclaimer/Publisher’s Note: The statements, opinions and data contained in all publications are solely those of the individual author(s) and contributor(s) and not of MDPI and/or the editor(s). MDPI and/or the editor(s) disclaim responsibility for any injury to people or property resulting from any ideas, methods, instructions or products referred to in the content. |
© 2023 by the authors. Licensee MDPI, Basel, Switzerland. This article is an open access article distributed under the terms and conditions of the Creative Commons Attribution (CC BY) license (https://creativecommons.org/licenses/by/4.0/).
Share and Cite
Kujdowicz, M.; Januś, D.; Taczanowska-Niemczuk, A.; Lankosz, M.W.; Adamek, D. Raman Spectroscopy as a Potential Adjunct of Thyroid Nodule Evaluation: A Systematic Review. Int. J. Mol. Sci. 2023, 24, 15131. https://doi.org/10.3390/ijms242015131
Kujdowicz M, Januś D, Taczanowska-Niemczuk A, Lankosz MW, Adamek D. Raman Spectroscopy as a Potential Adjunct of Thyroid Nodule Evaluation: A Systematic Review. International Journal of Molecular Sciences. 2023; 24(20):15131. https://doi.org/10.3390/ijms242015131
Chicago/Turabian StyleKujdowicz, Monika, Dominika Januś, Anna Taczanowska-Niemczuk, Marek W. Lankosz, and Dariusz Adamek. 2023. "Raman Spectroscopy as a Potential Adjunct of Thyroid Nodule Evaluation: A Systematic Review" International Journal of Molecular Sciences 24, no. 20: 15131. https://doi.org/10.3390/ijms242015131