Abstract
Maternal hyperglycemia, induced by gestational diabetes mellitus (GDM), has detrimental effects on fetal vascular development, ultimately increasing the risk of cardiovascular diseases in offspring. The potential underlying mechanisms through which these complications occur are due to functional impairment and epigenetic changes in fetal endothelial progenitor cells (EPCs), which remain less defined. We confirm that intrauterine hyperglycemia leads to the impaired angiogenic function of fetal EPCs, as observed through functional assays of outgrowth endothelial cells (OECs) derived from fetal EPCs of GDM pregnancies (GDM-EPCs). Notably, PCDH10 expression is increased in OECs derived from GDM-EPCs, which is associated with the inhibition of angiogenic function in fetal EPCs. Additionally, increased PCDH10 expression is correlated with the hypomethylation of the PCDH10 promoter. Our findings demonstrate that in utero exposure to GDM can induce angiogenic dysfunction in fetal EPCs through altered gene expression and epigenetic changes, consequently increasing the susceptibility to cardiovascular diseases in the offspring of GDM mothers.
1. Introduction
Gestational diabetes mellitus (GDM) is defined as a glucose intolerance resulting in maternal hyperglycemia, with onset or first recognition occurring during pregnancy. GDM complicates 5–31.5% of all pregnancies, and its prevalence has been rapidly increasing around the world alongside the rises in obesity and maternal age among women of reproductive age and advanced maternal age [1,2]. GDM is of great concern for fetal development and offspring health, as it is associated with adverse long-term outcomes in offspring as well as maternal and perinatal morbidity. Offspring that are exposed to GDM have an increased susceptibility to chronic diseases such as metabolic syndrome, type 2 diabetes, and hypertension, which include a cluster of cardiovascular diseases (CVDs) [3,4,5,6,7].
Although the pathogenesis linking intrauterine exposure to GDM with CVD in offspring is unknown, evidence suggests that an intrauterine hyperglycemic environment induces persistent epigenetic changes resulting in functional alterations in offspring. Several studies have shown that the DNA methylation of placental genes changes in GDM pregnancies, which is related to the regulation of adipose tissues, lipid transport, and inflammation in offspring [8,9]. Another study reported that hyperglycemic conditions significantly disrupt the development of the definitive endoderm, which is involved in the early stages of the development of the pancreas via histone H3 methylation [10]. Floris et al. demonstrated that alterations in micro-RNA expression in fetal endothelial cells from the umbilical cord vein of GDM pregnancies involved a complex in the initiation and maintenance of histone H3 methylation [11]. These findings suggest that in utero exposure to GDM can program epigenetic changes during fetal development, which may have long-lasting effects on gene expression and functional alterations in various tissues, leading to an increased risk of metabolic complications and CVD in offspring in later life.
The increased cardiovascular risk in offspring exposed to GDM could be related to endothelial progenitor cells (EPCs). EPCs, differentiated into endothelial cells, play a key role in both endothelial repair and neovascularization [12,13]. Previous studies have demonstrated that hyperglycemia is associated with reducing the number and angiogenic activity of EPCs significantly, resulting in the further progression of vascular disease [14,15,16,17]. During pregnancy, fetal exposure to a diabetic intrauterine environment results in decreased numbers and aberrant functions in cord blood-derived EPCs, which can be considered as fetal EPCs [10,11,18]. Fetal EPCs are believed to play a crucial role in the formation of fetal vasculature and the maintenance of vascular integrity. Therefore, the dysfunction of fetal EPCs could reflect the damage of stem cells, and may lead to vascular dysfunction in offspring in later life. However, whether and how intrauterine hyperglycemia induced by GDM contributes to fetal EPC dysfunction has remained unclear.
Based on previous studies, we hypothesized that intrauterine hyperglycemia exposure in the offspring of GDM mothers prompts the onset of endothelial dysfunction by altering the function of fetal EPCs through epigenetic changes, ultimately affecting the health of offspring. We aimed to investigate the programming effects of GDM on fetal EPCs and elucidate the underlying mechanisms related to adverse outcomes in offspring. We evaluate the angiogenic function of fetal EPCs exposed to GDM and evaluate related genes with epigenetic modification.
2. Results
2.1. GDM Reduced the Endothelial Angiogenic Capacity of Fetal EPCs
To investigate the effects of GDM on fetal EPCs, we differentiated cord blood-derived EPCs into outgrowth endothelial cells (OECs) and performed cell migration, adhesion, tube formation, and proliferation assays to assess the angiogenic capacity.
Although the EPCs from GDM mothers (GDM-EPCs) exhibited a similar differentiation activity in terms of both the number and time for differentiation into OECs when compared to EPCs from the normal group (N-EPCs), the OECs differentiated from GDM-EPCs showed a significantly reduced migration capacity, decreased adherence to fibronectin, diminished tube formation, and reduced proliferative activity (Figure 1). These findings indicated that even fetal EPCs exposed to GDM can differentiate to OECs as under normal conditions, but the angiogenic capacity of OECs, including their migration, adhesion, tube formation, and proliferation, is impaired by in utero exposure to GDM.
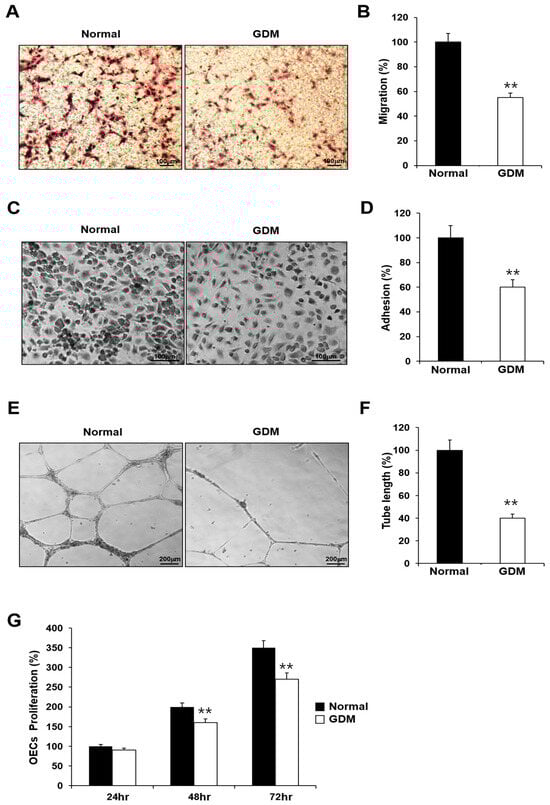
Figure 1.
GDM impaired the endothelial angiogenic capacity in fetal EPCs. (A,B) Cell migration assay using a Transwell chamber after culture for 4 h, showing representative images of the H&E staining (A) and quantification (B). (C,D) Cell–matrix adhesion assay after incubation for 30 min, showing representative images of H&E staining (C) and quantification (D). (E,F) Tube formation assay following cell incubation on Matrigel for 18–24 h, showing representative images (E) and quantification (F). (G) Proliferation assay using MTT; the absorbance value (OD) of each well was measured at 490 nm at 24 h, 48 h, and 72 h. All data are presented as the mean ± SE. ** p < 0.01. n = 3 independent experiments for each assay.
2.2. Exposure to High-Glucose Conditions Impaired the Functional Capacity of Fetal EPCs
GDM is associated with endothelial dysfunction, and maternal hyperglycemia is considered an independent predictor of childhood vascular complications. To confirm the effect of hyperglycemia, we examined whether the observed impairment in the fetal EPCs exposed to GDM was reproduced in N-EPCs in high-glucose conditions. For this purpose, N-EPCs were cultured in high-glucose conditions and were differentiated into OECs. Like the GDM-EPCs, the OECs that differentiated under high-glucose conditions had a decreased capacity for cell migration, adhesion, tube formation, and proliferation when compared with those that differentiated under normal conditions (Figure 2). These results indicate that fetal EPC dysfunction is associated with the high-glucose milieu induced by GDM.
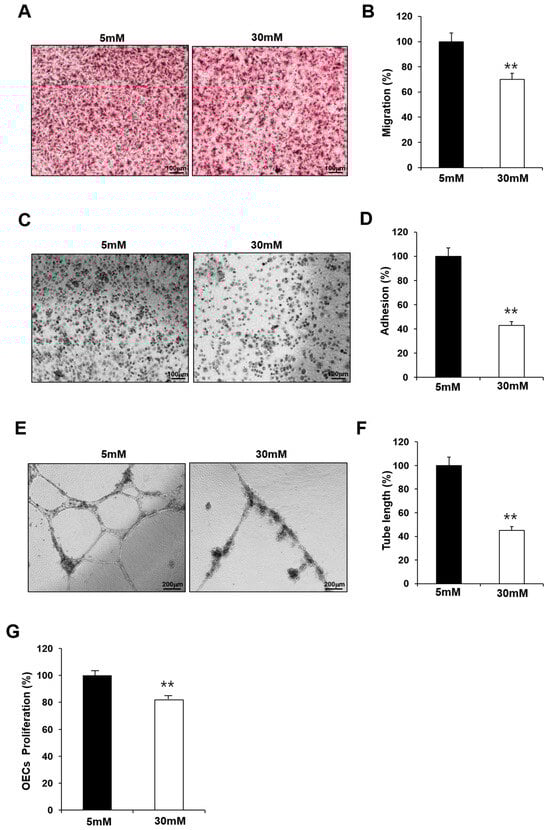
Figure 2.
Exposure to high-glucose conditions reduced the angiogenic capacity in fetal EPCs, similar to that in cells from GDM. N-EPCs were exposed to normal D-glucose (5 mM) or high D-glucose (30 mM) concentrations. (A,B) Cell migration assay using a Transwell chamber after culture for 4 h, showing representative images of H&E staining (A) and quantification (B). (C,D) Cell–matrix adhesion assay after incubation for 30 min, showing representative images of H&E staining (C) and quantification (D). (E,F) Tube formation assay following cell incubation on Matrigel for 18–24 h, showing representative images (E) and quantification (F). (G) Proliferation assay using MTT; the absorbance value (OD) of each well was measured at 490 nm at 72 h. All data are presented as the mean ± SE. ** p < 0.01. n = 3 independent experiments for each assay.
2.3. PCDH10 Gene Expression Was Significantly Upregulated in GDM-EPCs as Well as in N-EPCs under Hyperglycemic Conditions
To investigate the molecular mechanisms underlying endothelial dysfunction in GDM and high-glucose conditions, the gene expression analysis of OECs from GDM-EPCs was compared with those from normal pregnancies (Figure 3). The profiles identified 107 genes whose expression was up-regulated > 2.0-fold (with p < 0.05) and 57 genes whose expression was down-regulated < 0.5-fold (with p < 0.05) in the OECs derived from GDM-EPCs. The up-regulated genes belong to a diverse set of categories, including the cell cycle, apoptotic process, extracellular matrix, and secretion. In contrast, down-regulated genes were related to angiogenesis, neurogenesis, cell differentiation, and immune response. A functional gene with potential relevance to endothelial dysfunction in GDM was then selected. Among the significantly up- and down-regulated genes, PCDH10 was of particular interest because of the coincidence between the gene expression profiles and the qRT-PCR analysis of gene expression, the correlation of the effect on angiogenic function with our results, its possible association with epigenetic modification, and the consideration of a higher fold change of 6.35 and lower p-values (Table 1). PCDH10 expression appeared to be significantly up-regulated in the OECs derived from GDM-EPCs compared to those derived from N-EPCs, and also in OECs from N-EPCs cultured under hyperglycemic conditions compared to those from N-EPCs and N-EPCs under normal conditions (Figure 4).
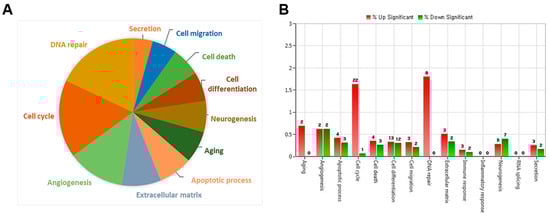
Figure 3.
Gene expression patterns of OECs from GDM-EPCs compared with those from N-EPCs. (A) Pie charts show the transcripts significantly up-regulated and down-regulated in OECs from GDM-EPCs relative to the normal pregnancy. (B) Gene ontology analyses included genes that showed a p-value < 0.05 and a fold change > 2.0 and were performed using DAVID Bioinformatics Resources.

Table 1.
The fold change and p-value of PCDH10.
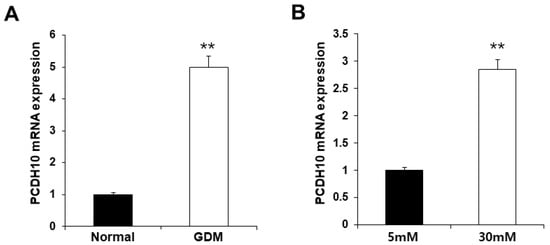
Figure 4.
Significantly increased PCDH10 expression in OECs from GDM-EPCs and in OECs from N-EPCs exposed to high-glucose conditions. (A) PCDH10 expression using qRT-PCR in OECs derived from N-EPCs and GDM-EPCs. (B) PCDH10 expression using qRT-PCR in OECs from N-EPCs exposed to normal glucose (5 mM) and high-glucose conditions (30 mM). Data are shown as the mean ± SE from three independent experiments. ** p < 0.01. NL, normal pregnancy; GDM, gestational diabetes mellitus; NG, normal glucose.
2.4. Knockdown of PCDH10 Recovered the Deteriorated Angiogenic Functions in GDM-EPCs
To determine whether PCDH10 is involved in angiogenesis and the inhibitory effect on angiogenic function in EPCs, we examined the effect of PCDH10 knockdown on the cell migration, adhesion, tube formation, and proliferation of OECs from GDM-EPCs (Figure 5). Lentivirus-mediated shRNA was used for the stable knockdown of PCDH10 expression. The OECs from GDM-EPCs were infected with PCDH10-shRNA (shPCDH10) and control shRNA (shCtrl) lentiviral particles. PCDH10 expression was significantly reduced in the shPCDH10 group compared to control group in OECs from GDM-EPCs (Figure 5A,B). Functional assays were then conducted on the OECs from each group to assess cell migration, adhesion, tube formation, and proliferation (Figure 5C–I). The results revealed that PCDH10 knockdown remarkably recovered the decreased capacity of cell migration and adhesion as well as tube formation in the GDM-OECs. Cell proliferation was also slightly increased in the PCDH10-knockdown group when compared with the decrease in the shCtrl group in the proliferation assay after 72 h. These results indicated that the increased expression of PCDH10 in GDM-OECs significantly inhibits the migration, adhesion, tube formation, and proliferation of OECs, and that these effects are recovered through PCDH10 knockdown.
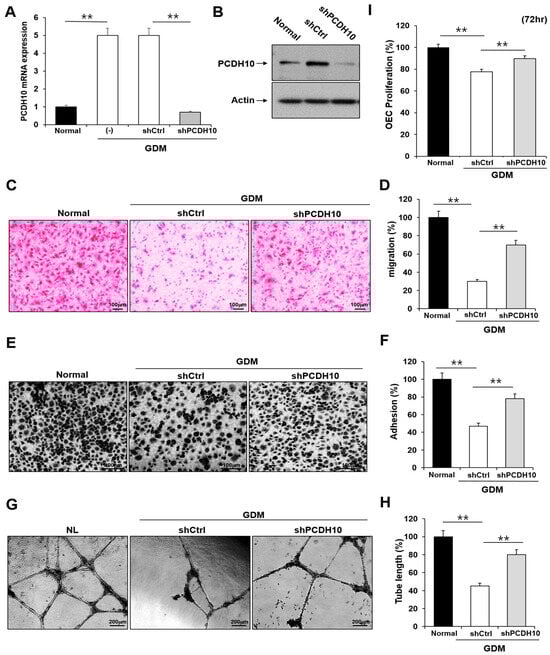
Figure 5.
Knockdown of PCDH10 expression in OECs from GDM-EPCs reversed the suppression of angiogenesis. (A) Knockdown efficiency using qRT-PCR in OECs derived from GDM-EPCs after transfection with shPCDH10. (B) Representative image of Western blots of shPCDH10-transfected OECs from GDM-EPCs. (C,D) Cell migration assay using a Transwell chamber after culture for 4 h, showing representative images of H&E staining (C) and quantification (D). (E,F) Cell–matrix adhesion assay after incubation for 30 min, showing representative images of H&E staining (E) and quantification (F). (G,H) Tube formation assay following cell incubation on Matrigel for 18–24 h, showing representative images (G) and quantification (H). (I) Proliferation assay using MTT; the absorbance value (OD) of each well was measured at 490 nm at 72 h. All data are presented as the mean ± SE. ** p < 0.01, comparison was performed between normal and GDM groups, and between the shCtrl- and shPCDH10-transfected groups.
2.5. High Glucose Induced Increased PCDH10 Expression in Fetal EPCs, Which Is an Irreversible Change That Did Not Revert to the Normal Levels Even under Normal Glycemic Conditions
To evaluate the association of PCDH10 expression with high glucose, PCDH10 mRNA expression was assessed using qPCR and compared between OECs from N-EPCs cultured under normoglycemic (5 mM glucose) and hyperglycemic (30 mM glucose) conditions (Figure 6A). The results showed that, under high-glucose conditions, PCDH10 mRNA expression levels were significantly increased. To determine the critical time for increased PCDH10 expression, N-EPCs exposed to high-glucose conditions were categorized into three groups based on the duration of high glucose exposure: (1) OECs collected immediately after differentiation from EPCs (OEC 10 d; Figure 6C); (2) OECs under 30 mm glucose incubation for 19 days (OEC 19 d; Figure 6D); (3) OECs under 30 mm glucose incubation for 59 days (OEC 59 d; Figure 6E). The results showed that PCDH10 was significantly up-regulated in all OECs cultured under high-glucose conditions (OEC 10 d, 19 d, 59 d). To investigate whether the increased expression caused by high glucose could return to baseline levels following exposure to a normal glucose environment, OECs under high-glucose conditions for 19 days were cultured at two different concentrations: normoglycemic (5 mM) and hyperglycemic (30 mM) conditions. As a result, increased PCDH10 expression induced by high glucose was not significantly decreased, even under normal glycemic conditions (Figure 6B). These results showed that a high-glucose environment could induced increased PCDH10 expression in fetal EPCs irreversibly, which was not rectified by the correction of the serum environment, indicating the possibility of an epigenetic modification. The results suggest that intrauterine hyperglycemia during critical periods of fetal vascular development results in deleterious effects on vascular health, which can persistently affect the health of the offspring later in life.
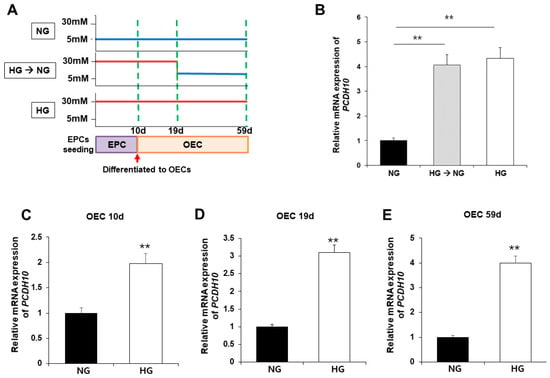
Figure 6.
Exposure to high-glucose conditions increased PCDH10 expression in OECs from N-EPCs, and the increased expression of PCDH10 was not reversed under normal glucose conditions. (A) Schematic diagram of the procedure to evaluate the association of PCDH 10 expression and glucose conditions. (B) The expression of PCDH10 in OECs under high-glucose conditions for 19 d followed by normal glucose conditions. High-glucose-induced increased PCDH10 expression occurred even in the early passages of OECs, and the changes were not reversed even after return to normal conditions. (C–E) The expression of PCDH10 in OECs derived from N-EPCs exposed to high-glucose conditions for 10 d, 19 d, and 59 d. ** p < 0.01. NG, normal glucose; HG, high glucose.
2.6. CpG Islands of the PCDH10 Promoter Was Significantly Hypomethylated in GDM-EPCs and N-EPCs under Hyperglycemic Conditions
We hypothesized that the alterations in PCDH10 mRNA expression in OECs derived from GDM-EPCs may be caused by epigenetic modification, specifically aberrant promoter methylation, which could contribute to vascular dysfunction in offspring. We assessed the methylation status of CpG islands (CGIs) in the PCDH10 promoter (Figure 7A) using methylation-specific PCR (MSP) in both OECs derived from GDM-EPCs and OECs from N-EPCs cultured under high-glucose conditions, where we observed significantly increased PCDH10 expression (Figure 7B–E). As expected, the CGIs was significantly hypomethylated in OECs derived from GDM-EPCs (Figure 7B) and OECs from N-EPCs cultured under high-glucose conditions (Figure 7D). These results suggest that GDM and exposure to hyperglycemic conditions might be involved in the methylation of the PCDH10 promoter in fetal EPCs.
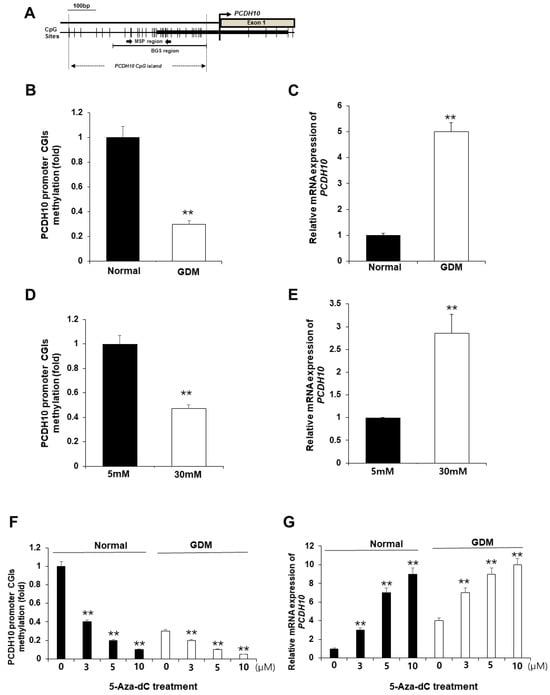
Figure 7.
The promoter CGIs of PCDH10 were hypomethylated in OECs from GDM-EPCs and N-EPCs exposed to high-glucose conditions, and correlated with increased PCDH10 expression. (A) Schematic diagram of the CpG island of the PCDH10 promoter. (B) Methylation status of PCDH10 in OECs derived from GDM. (C) Relative mRNA expression of PCDH10 in OECs derived from GDM. (D) Methylation status of PCDH10 in OECs derived from N-EPCs exposed to normal and high-glucose conditions. (E) Relative mRNA expression of PCDH10 in OECs derived from N-EPCs under normal glucose and high-glucose conditions. (F,G) Treatment with 5-Aza-dC induced hypomethylation of the PCDH10 promoter CGIs with concomitant increased PCDH10 mRNA expression in a dose-dependent manner. ** p < 0.01. NL, normal pregnancy; GDM, gestational diabetes mellitus; NG, normal glucose.
2.7. Pharmacologic Demethylation Activated PCDH10 Expression
To evaluate whether the hypomethylation of PCDH10 promoter CGIs directly mediates increased PCDH10 expression, OECs derived from N-EPCs were treated with the DNA methyltransferase inhibitor 5-Aza-dC, and PCDH10 expression levels were compared before and after treatment. An MSP analysis showed that the PCDH10 promoter CGIs were dramatically demethylated in the presence of the drug. PCDH10 mRNA expression was significantly increased after treatment with 5-Aza-dC in a dose-dependent manner in OECs derived from EPCs of both normal and GDM pregnancies (Figure 7F,G). Based on these results, we confirmed that the expression of PCDH10 is directly mediated by the methylation status of CGIs in fetal EPCs, indicating that epigenetic modifications are involved in PCDH10 expression.
3. Discussion
Intrauterine exposure to hyperglycemia in GDM pregnancies is known to have an impact on long-term cardiovascular health in offspring [7,19]. Accumulating evidence suggests that these changes are triggered by epigenetic modifications in fetal cells during fetal developments [19,20,21,22,23]. During fetal developments, fetal EPCs play a potentially important role in embryonic neovascularization and support the health of the vascular endothelium. Epigenetic modifications have been proposed as potential factors linking intrauterine hyperglycemia exposure to later health outcomes; however, there have been limited studies investigating the functions of fetal EPCs in human offspring born to mothers with GDM pregnancies [24].
Our studies showed that the exposure of fetal EPCs to GDM in vivo or in hyperglycemic conditions in vitro could impact both the angiogenic function and gene expression of fetal EPCs. We demonstrated that PCDH10 was significantly up-regulated in GDM, and that an increased expression of PCDH10 was involved in endothelial dysfunction. Furthermore, it is particularly noteworthy that a reduction in PCDH10 promoter methylation is linked to the expression of PCDH10 in GDM and hyperglycemic conditions. Our study has a significant implication that we have found the novel mechanism mediating EPC dysfunction in intrauterine hyperglycemia induced by GDM. This observation also suggests that hyperglycemia in GDM influences the epigenetic modification of EPCs.
EPCs can promote angiogenesis and differentiate into mature endothelial cells. In order for angiogenesis to be achieved, endothelial cells must be activated, proliferated, and well adhered to the extracellular matrix alongside tube formations. Therefore, the function of EPCs may be essential for maintaining a healthy cardiovascular system. Although little is known about the effects of maternal GDM on fetal EPCs, a few studies suggest that GDM exposure in utero contributes to impaired function and leads to altered gene expression in fetal EPCs. Gui et al. reported that umbilical cord blood-derived endothelial colony-forming cells (ECFCs), also known as late EPCs or OECs, have significantly impaired angiogenic functions in the diabetic intrauterine environment when compared to those from heathy pregnancies. They also demonstrated the decreased expression and activity of SIRTs in fetal ECFCs and human umbilical vein endothelial cells from GDM pregnancies, which may be associated with long-term cardiovascular complications in offspring of GDM pregnancies [24,25]. Varerg KM et al. reported that GDM-exposed ECFCs have decreased vasculogenic potential and altered gene expression with vasculogenic dysfunction [26,27]. An increased expression of TAGLN involved in actin cytoskeletal rearrangement was associated with impaired ECFC migration, cell alignment, and network formation [28].
In accordance, our study demonstrated that OECs differentiated from EPCs exposed to GDM pregnancies or high-glucose environments resulted in marked decreases in angiogenesis when compared to those from EPCs with normal pregnancies or normoglycemic environments. This indicates that exposure to a hyperglycemic environment in utero has a significant impact on fetal EPCs, leading to functional impairments in OECs. It is reasonable to suppose that the intrauterine hyperglycemic environment during critical periods of fetal vascular development alters the ability of EPCs.
To identify possible molecular mechanisms contributing to the functional differences between normal and GDM-exposed EPCs, we conducted a gene expression analysis using mRNA sequencing. OECs differentiated from GDM-exposed EPCs exhibited modest differences to a control, as well as significantly up-regulated genes such as ROBO1, IGFBP1, and PCDH10, and down-regulated genes such as HEY1 were known to be related to angiogenesis in endothelial cells. Several studies have reported that Slit/Robo signaling with ROBO1 is involved in angiogenesis. Slit2/Robo1 binding exerts a pro-migratory effect on HUVECs, in which Robo4 provides an inhibitory effect against migration [29,30,31]. In a diabetic environment, IGFBP1 improves endothelial regeneration and restores endothelial reparative function through preserved insulin sensitivity and increased nitric oxide production [32,33]. In addition, the Hey family are direct targets of Notch signaling and Hey1/Hey2 are essential transducers of Notch signals in cardiovascular development [34,35]. Although these genes are related to hyperglycemia and angiogenesis in endothelial cells, PCDH10 was of particular interest because of the correlation of the effect on angiogenic function with our results, as well as its possible association with epigenetic modification. We have demonstrated a novel underlying mechanism involving PCDH10 as one of the genes that is significantly differently expressed in fetal OECs from GDM-exposed EPCs.
PCDH10 belongs to the major subfamily of the cadherin superfamily and is involved in the establishment and function of cell-to-cell adhesion. Although the functions of protocadherins have not been well elucidated, recent studies suggest that PCDH10 expression was frequently down-regulated in various cancers [36]. It has been reported that PCDH10 acts as a functional tumor suppressor gene by inhibiting cell proliferation, migration, and clonogenicity, as well as through the induction of apoptosis [37,38]. In our study, we identified that increased PCDH10 expression is involved in angiogenesis impairment in OECs from GDM-EPCs. The knockdown of PCDH10 resulted in the remarkable restoration of cell adhesion, migration, tube formation, and proliferation, indicating its crucial role in angiogenesis. Furthermore, high-glucose environments contribute to the increased expression of PCDH10 in OECs derived from normal fetal EPCs. Significantly increased PCDH10 expression was observed not only in OECs exposed to high-glucose conditions for a long time after differentiation from EPCs, but also in OECs identified immediately after differentiation that were exposed to high-glucose conditions while only in the state of EPCs. These results indicated that transient high glucose exposure in utero can directly affect stem cells and alter the function of EPCs by altering PCDH10 expression, which is related with vascular dysfunction.
Maternal glucose intolerance from GDM is recovered after childbirth, but in offspring, GDM increases the risk of CVD and metabolic disease, which can be explained by the fetal programming phenomenon. This is because maternal hyperglycemia provokes permanent epigenetic changes in gene expression. Our study shows that high glucose leads to altered gene expression and disrupted epigenetic regulation. PCDH10 expression, which was increased in high-glucose conditions, was not restored even after incubation in normal glucose conditions. Increased PCDH10 expression was still observed in OECs cultured after exposure to high-glucose conditions and then normal conditions. These significant findings provide the possibility that hyperglycemia during pregnancy contributes to irreversible changes to fetal stem cells, with an epigenetic modification that has long-lasting adverse effects on the vascular systems in the offspring of GDM mothers. These results also provide evidence for the importance of maternal glucose control in GDM and PCDH10 expression to improve the health of offspring born to mothers with GDM.
Increasing evidence suggests that epigenetic modifications via DNA methylation in GDM affects the progression of diabetes-related vascular disease in offspring [39,40,41,42,43]. DNA methylation regulates gene expression and genomic stability. In previous studies, PCDH10 was reported to be silenced via promoter methylation in various types of cancer [44,45,46,47]. Particularly, several studies demonstrated that PCDH10 plays a positive role in angiogenesis, and that its expression is controlled via promoter methylation. In our study, hypomethylation was found to be negatively correlated with PCDH10 mRNA expression in OECs from GDM-EPCs and OECs derived from N-EPCs exposed to high-glucose conditions. These results indicate that promoter hypomethylation is the principal regulatory mechanism for the increased expression of PCDH10 in fetal EPCs following GDM or high glucose exposure, and finally leads to aberrant vascular health in the offspring. In addition, further cohort studies are needed to confirm whether these changes continue to imprint on offspring later in life, ultimately affecting their vascular health. Furthermore, based on the gene expression analysis of OECs from GDM-EPCs, further studies can be considered in genes related to angiogenesis, including ROBO1, IGFBP1, and PCDH7.
In conclusion, we demonstrated that fetal exposure to maternal GDM in utero can induce epigenetic modification and alter gene expression in fetal EPCs, resulting in the angiogenic dysfunction of fetal EPCs. It can be inferred that such an impact on epigenetic programming during fetal life predisposes offspring that are exposed to maternal GDM to developing cardiovascular diseases later in life. In addition, since epigenetic changes can occur in offspring exposed to GDM, this study also shows the importance of glucose control during pregnancy, and furthermore, it may suggest a target therapy and treatment to restore vascular health in patients diagnosed with DM or glucose intolerance.
4. Materials and Methods
4.1. Study Population and Sample Collection
Women with normal (n = 30) and GDM pregnancies (n = 30) were recruited from January 2018 to June 2021. All women assigned to the GDM group were diagnosed with two of the following: a fasting blood glucose > 5.3 mmol/L, a 1 h oral glucose tolerance test (OGTT) > 10.0 mmol/L, a 2 h OGTT > 8.6 mmol/L, or a 3 h OGTT > 7.8 mmol/L in 100 g OGTT followed by a 50 g glucose tolerance test > 7.5 mmol/L during 24–28 gestational weeks. Cases of preterm delivery < 36 gestational weeks, multiple pregnancies, pregnancies associated with fetal malformation, chromosome anomalies, diabetes diagnosed before pregnancy, chronic hypertension or preeclampsia, and extreme maternal obesity (pre-pregnancy body mass index ≥ 30 kg/m2) were excluded from this study. To determine the effects of intrauterine hyperglycemia on the fetus, our study investigated various cases of pregnant women with poor glycemic control for approximately 9–10 weeks from GDM diagnosis to delivery. Because the fetal circulatory system is connected through the umbilical cord to the mother’s blood, and umbilical cord blood can reflect the fetal condition, umbilical cord blood for fetal EPCs (CD133+/C-kit+/Lin− cells: CKL- cells) was obtained at the time of delivery.
4.2. Function Evaluation of Fetal EPCs from the Umbilical Cord Blood
4.2.1. Isolation and Culture of Fetal EPCs (CKL- Cells)
Fetal EPCs were prepared as previously described [48]. Briefly, cord blood samples containing fetal EPCs were collected prior to placental expulsion via gravity flow at the time of delivery. EPCs were isolated using density gradient centrifugation at 400× g for 30 min using Biocoll (Biochrom, Berlin, Germany) and washed three times in phosphate-buffered saline (PBS; Biochrom). CKL- cells were purified via positive and negative selection with anti-CD133/C-kit/Lin− microbeads (Miltenyi Biotec, Bergisch-Gladbach, Germany) using a magnetic cell sorter device (Miltenyi Biotec). The purity of the cell fraction was assessed using a fluorescence-activated cell sorting analysis and was confirmed as > 98%. The CKL- cells were seeded into 6-well plates coated with human fibronectin (Sigma, St. Louis, MO, USA) and maintained in endothelial basal medium 2 (EBM-2; Clonetics, Cell Systems, St. Katharinen, Germany). The medium was supplemented with endothelial growth medium 2 (EGM-2; Clonetics, Cell Systems) containing fetal bovine serum, human VEGF-A, human fibroblast growth factor-B, human epidermal growth factor-B, IGF1, and ascorbic acid. The identification of CKL- cells was determined via staining with human CD133 phycoerythrin (PE)-conjugated antibodies and C-kit PE-conjugated antibodies (BD Biosciences, Bedford, MA, USA). For further information, see Figure A1 in Appendix A.
4.2.2. CKL- Cells Differentiation Assay
EPCs from GDM (GDM-EPCs) and normal pregnancies (N-EPCs) were seeded on 6-well plates (1 × 10⁶ cells/well) and cultured in the EGM-2 medium, and the medium was replaced every 2 days. EPCs have the potential to differentiate to form outgrowth endothelial cells (OECs). The day of differentiation was defined as the first day on which a differentiated colony was observed from the time of seeding. The duration required for the differentiation of the colonies in each set to occur was determined using light microscopy. At least three assays were performed for each sample.
4.2.3. Cell Migration Assay
Cell migration was assessed using Transwell® Permeable Supports (Corning Costar, Acton, MA, USA) with a 6.5 mm diameter polycarbonate membrane (8.0-µm pore size). The lower surface of the membrane was coated with 10 μg/mL of fibronectin (Sigma-Aldrich Corp., St. Louis, MO, USA). OECs at passage 3 (105 cells) were seeded onto chemotaxis filters in the insert with EBM supplemented with 0.5% FBS. After 4 h of incubation at 37 °C, the insert was washed with PBS and non-migrating cells in the top surface of the membrane were removed. Migrating cells attached to the lower surface of the filters were stained with hematoxylin and eosin (H&E) and quantified using Kodak 1D software 3.6 (Eastman Kodak, Rochester, NY, USA). The assays were performed in triplicate with three different samples [49].
4.2.4. Cell–Matrix Adhesion Assay
Cell–matrix adhesion assays were performed as previously described [49]. Briefly, 96-well plates were coated overnight at 4 °C with 10 µg/mL of human fibronectin (Sigma-Aldrich, St. Louis, MO, USA). At the 3rd passage, OECs in a 100 µL adhesion buffer comprising serum-free media and EBM were seeded at 105 cells/well and incubated for 30 min at 37 °C. After two washes with PBS to remove non-adherent cells, the remaining adherent cells were measured via H&E staining and quantified in triplicate by counting adherent cells in five randomly selected fields per well (Axiovert 100; Carl Zeiss Micro-Imaging, Thornwood, NY, USA). The assays were performed in triplicate with three different samples.
4.2.5. Tube Formation Assay
A tube formation assay was conducted as previously described [49]. The Matrigel solution (250 µL; BD Biosciences, Bedford, MA, USA) was added to a 16 mm diameter tissue culture well and allowed to polymerize for 30 min at 37 °C. After trypsinization, the harvested OECs (1.2 × 10⁵ cells/well) were resuspended in EBM and plated onto the Matrigel. The Matrigel cultures were incubated at 37 °C, and the cells were photographed at 18 h and 24 h of incubation (200× magnification). The area covered by the mature tube network was determined by scanning photographs of the tubes into Adobe Photoshop 23.5.5 and using the ImageJ software (Version 1.53t 24 August 2022, National Institute of Health, Bethesda, MD, USA) to quantify the identified area and measure the total tube length on the captured images.
4.2.6. Proliferation Assay
The OECs (1 × 10³ cells) were seeded onto a 96-well plate, cultured for 72 h, and then incubated with 20 µL of 3-(4,5-dimethylthiazol-2-yl)-2,5-diphenyl tetrazolium bromide (MTT; 5 mg/mL) reagent. After 4 h, the supernatants were removed, and the cells were treated with 150 μL of dimethyl sulfoxide (DMSO). The absorbance value (optical density, OD) at a wavelength of 490 nm was measured at 24 h, 48 h, and 72 h. The experiments were performed in triplicate with three different cell lines [49].
4.3. Analysis of the Gene Expression Profiles Using mRNA Sequencing
Total RNA was isolated using the TRIzolTM Reagent (Life Technologies, Van Allen Way, CA, USA), and the RNA quality was assessed on an Agilent 2100 Bioanalyzer using the RNA 6000 Nano Chip (Agilent Technologies, Amstelveen, The Netherlands). RNA quantification was performed using an ND-2000 Spectrophotometer (Thermo Fisher Scientific Inc., Wyman Street Waltham, MA, USA).
For the normal (n = 3) and GDM (n = 3) pregnancy-derived OEC RNAs, library construction was performed using a QuantSeq 30-mRNA-Seq Library Prep Kit (Lexogen, Inc., Vienna, Austria) according to the manufacturer’s instructions [49]. In brief, 500 ng of total RNA was prepared, hybridized with an oligo-dT primer containing an Illumina-compatible sequence at its 5′-end, and subjected to reverse transcription. After the degradation of the RNA template, second-strand synthesis was initiated using a random primer containing an Illumina-compatible linker sequence at its 5′-end. The double-stranded library was purified using magnetic beads to remove all the reaction components. The library was amplified to add the complete adapter sequences required for cluster generation. The finished library was purified from PCR components, and high-throughput sequencing was performed via single-read sequencing (75 cycles) using NextSeq 500 (Illumina, Inc., San Diego, CA, USA). The QuantSeq 30-mRNA-Seq reads were aligned using Bowtie 2. The Bowtie 2 indices were generated from either the genome assembly sequence or the representative transcript sequence to align the genome and transcriptome. The alignment file was used to assemble the transcripts, estimate their abundances, and detect differential gene expression. Differentially expressed genes were determined based on the counts from unique and multiple alignments using coverage in BEDtools version 2.28.0. The read count (RC) data were processed based on the quantile normalization method using EdgeR (version 3.18) within the R program (version 4.3) in Bioconductor. Gene classification was based on searches performed using DAVID (https://david.ncifcrf.gov/, accessed on 17 May 2021) and the Medline database (http://www.ncbi.nlm.nih.gov/, accessed on 17 May 2021).
4.4. Total RNA Extraction, Reverse Transcription, and Quantitative Real-Time PCR (qRT-PCR)
Total RNA was extracted from the EPCs and OECs using the TRIzolTM Reagent (Life Technologies, Van Allen Way, CA, USA). The mRNA expression of PCDH10 was measured using a Power SYBRTM Green RNA-to-CTTM 1-Step kit (Applied Biosystems, Foster City, CA, USA) and StepOnePlusTM (Applied Biosystems) according to the manufacturer’s instructions. GAPDH served as an internal standard for sample normalization. The conditions for amplification were as follows: 48 °C for 30 min and 95 °C for 10 min, followed by 40 cycles of 95 °C for 15 s and 55 °C for 1 min. The results were based on the cycle threshold (Ct) values. The relative gene expression levels were calculated using the comparative CT method (2−△△Ct) with GAPDH as an internal control. The assay for the expression of PCDH10 via qRT-PCR used the following primers: PCDH10 forward 5′- AGC TCC AAT GTA CCC AGT AA-3′, reverse 5′- CAG GGC TTA AGA AAC ATC AG-3′; GAPDH forward 5′-GGG GTC ATT GAT GGC AAC AA -3′, reverse 5′-ATG GGG AAG GTG AAG GTC G -3′.
4.5. PCDH10 shRNA Infection
To knockdown the expression of PCDH10, OECs from GDM-derived EPCs were cultured in 6-well plates at a density of 5 × 10⁴ cells per well in 2 mL of EGM-2 and incubated for 24 h. They were maintained in 2 mL of a complete optimal medium (with serum and antibiotics) and incubated overnight until 60–70% confluence on the day of infection. The cells were then infected with shRNA lentiviral particles, which were constructed to target for PCDH10 (shPCDH10; Santa Cruz Biotechnology, Santa Cruz, CA, USA), with nontargeting sequence infection as a control (shCtrl), following the manufacturer’s instructions. Infected cells were selected using puromycin. The expression of PCDH10 mRNA was analyzed using qRT-PCR after selection. For further information, see Figure A2 in Appendix A.
4.6. Exposure to High-Glucose Conditions
To evaluate the effects of maternal hyperglycemia on fetal EPCs, N-EPCs were cultured in high D-glucose (30 mM) and normal D-glucose (5 mM). Cells for functional assays were treated for 19 days. For the quantification of PCDH10 expression, the cells were treated for 10 days, 19 days, and 59 days from the day of differentiation into OECs. To evaluate the expression changes in PCDH10, the N-EPCs were exposed to high-glucose conditions for 19 days after differentiation into OECs and then cultured in the presence of two different concentrations (5 mM and 30 mM) for 27 days. At least three assays were performed for each sample.
4.7. DNA Bisulfite and Methylation Analysis
DNA was extracted from OECs from normal and GDM pregnancies, as well as OECs exposed to high-glucose conditions. Bisulfite modifications of DNA and the methylation status in the CGIs of the PCDH10 promoter was carried out as previously described. The bisulfite-treated DNA was amplified using the methylation-specific primer set, PCDH10-M1 5′-TCG TTA AAT AGA TAC GTT ACG C-3′, PCDH10-M2, 5′-TAA AAA CTA AAA ACT TTC CGC G-3′, or the unmethylation-specific primer set, PCDH10-U1, 5′-GTT GTT AAA TAG ATA TGT TAT GT-3′, PCDH10-U2, 5′-CTA AAA ACT AAA AAC TTT CCA CA-3′. Methylation-specific PCR (MSP) was performed for 40 cycles using the EpiScope MSP kit (Takara Bio Inc., Kusatsu, Japan).
4.8. DNA Demethylation Using the 5-Aza-2′-deoxycytidine (5-Aza-dC)
The OECs were treated with 3, 5, and 10 μM of the DNA demethylating agent 5-Aza-dC for 24 h. The cells were then harvested for DNA and RNA extraction.
4.9. Statistical Analysis
Data are presented as the mean ± standard error (SE). Statistical significance between groups were assessed using a one-way analysis of variance (ANOVA), followed by Student’s t-test. A p < 0.01 was considered statistically significant.
Author Contributions
Conceptualization, H.K. and J.-Y.K.; methodology, H.K., J.-Y.K. and Y.-S.M.; formal analysis, H.K., Y.L., J.-Y.K. and Y.-S.M.; investigation, H.K., Y.L., Y.-S.M. and J.-Y.K.; resources, H.K. and Y.J.J.; data curation, Y.L., Y.J.J. and H.K.; writing—original draft preparation, H.K.; writing—review and editing, H.K., Y.-S.M., H.O.K., G.-H.S., J.-Y.K. and Y.-S.M.; supervision, J.-Y.K. and Y.-S.M.; project administration, J.-Y.K.; funding acquisition, H.K., J.-Y.K. and Y.-S.M. All authors have read and agreed to the published version of the manuscript.
Funding
This work was supported by grants from the National Research Foundation of Korea (NRF) funded by the Korean government (MSIT) (NRF 2017R1C1B5076378, NRF-2019R1I1A1A01059738, NRF-2021R1A2C2014591, and NRF-2022R1I1A1A01064011) and a faculty research grant of Yonsei University College of Medicine (6-2017-0062).
Institutional Review Board Statement
This study was approved by the Institutional Review Board of Donguk University Ilsan Hospital and Yonsei University Health System (DUIH 2017-08-005-001, 4-2017-0948).
Informed Consent Statement
Informed consent was obtained from all participants involved in this study.
Data Availability Statement
The data that support the finding of this study are available from the corresponding author upon reasonable request.
Acknowledgments
We thank Sahng Wook Park for his valuable discussions and critical review of this article.
Conflicts of Interest
The authors declare no conflict of interest.
Appendix A

Figure A1.
Schematic image of the differentiation of EPCs to OECs.
Figure A1.
Schematic image of the differentiation of EPCs to OECs.


Figure A2.
Lentiviral transfection workflow for PCDH10 knockdown as described in the Section 4.
Figure A2.
Lentiviral transfection workflow for PCDH10 knockdown as described in the Section 4.

References
- Metzger, B.E.; Buchanan, T.A.; Coustan, D.R.; de Leiva, A.; Dunger, D.B.; Hadden, D.R.; Hod, M.; Kitzmiller, J.L.; Kjos, S.L.; Oats, J.N.; et al. Summary and recommendations of the fifth international workshop-conference on gestational diabetes mellitus. Diabetes Care 2007, 30 (Suppl. S2), S251–S260. [Google Scholar] [CrossRef] [PubMed]
- Zhu, Y.; Zhang, C. Prevalence of gestational diabetes and risk of progression to type 2 diabetes: A global perspective. Curr. Diab. Rep. 2016, 16, 7. [Google Scholar] [CrossRef] [PubMed]
- Wright, C.S.; Rifas-Shiman, S.L.; Rich-Edwards, J.W.; Taveras, E.M.; Gillman, M.W.; Oken, E. Intrauterine exposure to gestational diabetes, child adiposity, and blood pressure. Am. J. Hypertens. 2009, 22, 215–220. [Google Scholar] [CrossRef] [PubMed]
- Boney, C.M.; Verma, A.; Tucker, R.; Vohr, B.R. Metabolic syndrome in childhood: Association with birth weight, maternal obesity, and gestational diabetes mellitus. Pediatrics 2005, 115, e290–e296. [Google Scholar] [CrossRef]
- Bunt, J.C.; Tataranni, P.A.; Salbe, A.D. Intrauterine exposure to diabetes is a determinant of hemoglobin a(1)c and systolic blood pressure in pima indian children. J. Clin. Endocrinol. Metab. 2005, 90, 3225–3229. [Google Scholar] [CrossRef]
- Cho, N.H.; Silverman, B.L.; Rizzo, T.A.; Metzger, B.E. Correlations between the intrauterine metabolic environment and blood pressure in adolescent offspring of diabetic mothers. J. Pediatr. 2000, 136, 587–592. [Google Scholar] [CrossRef]
- Bianco, M.E.; Josefson, J.L. Hyperglycemia during pregnancy and long-term offspring outcomes. Curr. Diab. Rep. 2019, 19, 143. [Google Scholar] [CrossRef]
- Cardenas, A.; Gagne-Ouellet, V.; Allard, C.; Brisson, D.; Perron, P.; Bouchard, L.; Hivert, M.F. Placental DNA methylation adaptation to maternal glycemic response in pregnancy. Diabetes 2018, 67, 1673–1683. [Google Scholar] [CrossRef]
- Houde, A.A.; St-Pierre, J.; Hivert, M.F.; Baillargeon, J.P.; Perron, P.; Gaudet, D.; Brisson, D.; Bouchard, L. Placental lipoprotein lipase DNA methylation levels are associated with gestational diabetes mellitus and maternal and cord blood lipid profiles. J. Dev. Orig. Health Dis. 2014, 5, 132–141. [Google Scholar] [CrossRef]
- Chen, A.C.H.; Lee, Y.L.; Fong, S.W.; Wong, C.C.Y.; Ng, E.H.Y.; Yeung, W.S.B. Hyperglycemia impedes definitive endoderm differentiation of human embryonic stem cells by modulating histone methylation patterns. Cell Tissue Res. 2017, 368, 563–578. [Google Scholar] [CrossRef]
- Floris, I.; Descamps, B.; Vardeu, A.; Mitic, T.; Posadino, A.M.; Shantikumar, S.; Sala-Newby, G.; Capobianco, G.; Mangialardi, G.; Howard, L.; et al. Gestational diabetes mellitus impairs fetal endothelial cell functions through a mechanism involving microrna-101 and histone methyltransferase enhancer of zester homolog-2. Arter. Thromb. Vasc. Biol. 2015, 35, 664–674. [Google Scholar] [CrossRef] [PubMed]
- Eguchi, M.; Masuda, H.; Asahara, T. Endothelial progenitor cells for postnatal vasculogenesis. Clin. Exp. Nephrol. 2007, 11, 18–25. [Google Scholar] [CrossRef] [PubMed]
- Salybekov, A.A.; Kobayashi, S.; Asahara, T. Characterization of endothelial progenitor cell: Past, present, and future. Int. J. Mol. Sci. 2022, 23, 7697. [Google Scholar] [CrossRef] [PubMed]
- Altabas, V. Diabetes, endothelial dysfunction, and vascular repair: What should a diabetologist keep his eye on? Int. J. Endocrinol. 2015, 2015, 848272. [Google Scholar] [CrossRef]
- Rigato, M.; Avogaro, A.; Fadini, G.P. Levels of circulating progenitor cells, cardiovascular outcomes and death: A meta-analysis of prospective observational studies. Circ. Res. 2016, 118, 1930–1939. [Google Scholar] [CrossRef]
- Rigato, M.; Bittante, C.; Albiero, M.; Avogaro, A.; Fadini, G.P. Circulating progenitor cell count predicts microvascular outcomes in type 2 diabetic patients. J. Clin. Endocrinol. Metab. 2015, 100, 2666–2672. [Google Scholar] [CrossRef]
- Wei, H.-J.; Liu, L.; Chen, F.-L.; Wang, D.; Wang, L.; Wang, Z.-G.; Jiang, R.-C.; Dong, J.-F.; Chen, J.-L.; Zhang, J.-N. Decreased numbers of circulating endothelial progenitor cells are associated with hyperglycemia in patients with traumatic brain injury. Neural Regen. Res. 2019, 14, 984–990. [Google Scholar]
- Dincer, U.D. Fetal exposure to a diabetic intrauterine environment resulted in a failure of cord blood endothelial progenitor cell adaptation against chronic hypoxia. Stem Cells Cloning 2015, 8, 1–14. [Google Scholar] [CrossRef][Green Version]
- Sallam, N.A.; Palmgren, V.A.C.; Singh, R.D.; John, C.M.; Thompson, J.A. Programming of vascular dysfunction in the intrauterine milieu of diabetic pregnancies. Int. J. Mol. Sci. 2018, 19, 3665. [Google Scholar] [CrossRef]
- Aboalgasm, H.; Ballo, R.; Gwanyanya, A. Organisational alteration of cardiac myofilament proteins by hyperglycaemia in mouse embryonic stem cell-derived cardiomyocytes. J. Muscle Res. Cell Motil. 2021, 42, 419–428. [Google Scholar] [CrossRef]
- Dluski, D.F.; Wolinska, E.; Skrzypczak, M. Epigenetic changes in gestational diabetes mellitus. Int. J. Mol. Sci. 2021, 22, 7649. [Google Scholar] [CrossRef]
- Vrachnis, N.; Antonakopoulos, N.; Iliodromiti, Z.; Dafopoulos, K.; Siristatidis, C.; Pappa, K.I.; Deligeoroglou, E.; Vitoratos, N. Impact of maternal diabetes on epigenetic modifications leading to diseases in the offspring. Exp. Diabetes Res. 2012, 2012, 538474. [Google Scholar] [CrossRef] [PubMed]
- Slupecka-Ziemilska, M.; Wychowanski, P.; Puzianowska-Kuznicka, M. Gestational diabetes mellitus affects offspring’s epigenome. Is there a way to reduce the negative consequences? Nutrients 2020, 12, 2792. [Google Scholar] [CrossRef] [PubMed]
- Gui, J.; Potthast, A.; Rohrbach, A.; Borns, K.; Das, A.M.; von Versen-Hoynck, F. Gestational diabetes induces alterations of sirtuins in fetal endothelial cells. Pediatr. Res. 2016, 79, 788–798. [Google Scholar] [CrossRef] [PubMed]
- Gui, J.; Rohrbach, A.; Borns, K.; Hillemanns, P.; Feng, L.; Hubel, C.A.; von Versen-Hoynck, F. Vitamin d rescues dysfunction of fetal endothelial colony forming cells from individuals with gestational diabetes. Placenta 2015, 36, 410–418. [Google Scholar] [CrossRef]
- Blue, E.K.; Sheehan, B.M.; Nuss, Z.V.; Boyle, F.A.; Hocutt, C.M.; Gohn, C.R.; Varberg, K.M.; McClintick, J.N.; Haneline, L.S. Epigenetic regulation of placenta-specific 8 contributes to altered function of endothelial colony-forming cells exposed to intrauterine gestational diabetes mellitus. Diabetes 2015, 64, 2664–2675. [Google Scholar] [CrossRef]
- Gohn, C.R.; Blue, E.K.; Sheehan, B.M.; Varberg, K.M.; Haneline, L.S. Mesenchyme homeobox 2 enhances migration of endothelial colony forming cells exposed to intrauterine diabetes mellitus. J. Cell Physiol. 2017, 232, 1885–1892. [Google Scholar] [CrossRef]
- Varberg, K.M.; Garretson, R.O.; Blue, E.K.; Chu, C.; Gohn, C.R.; Tu, W.; Haneline, L.S. Transgelin induces dysfunction of fetal endothelial colony-forming cells from gestational diabetic pregnancies. Am. J. Physiol. Cell Physiol. 2018, 315, C502–C515. [Google Scholar] [CrossRef]
- Yadav, S.S.; Narayan, G. Role of robo4 signalling in developmental and pathological angiogenesis. BioMed Res. Int. 2014, 2014, 683025. [Google Scholar] [CrossRef]
- Li, S.; Huang, L.; Sun, Y.; Bai, Y.; Yang, F.; Yu, W.; Li, F.; Zhang, Q.; Wang, B.; Geng, J.G.; et al. Slit2 promotes angiogenic activity via the robo1-vegfr2-erk1/2 pathway in both in vivo and in vitro studies. Investig. Ophthalmol. Vis. Sci. 2015, 56, 5210–5217. [Google Scholar] [CrossRef]
- Liu, J.; Hou, W.; Guan, T.; Tang, L.; Zhu, X.; Li, Y.; Hou, S.; Zhang, J.; Chen, H.; Huang, Y. Slit2/robo1 signaling is involved in angiogenesis of glomerular endothelial cells exposed to a diabetic-like environment. Angiogenesis 2018, 21, 237–249. [Google Scholar] [CrossRef] [PubMed]
- Aziz, A.; Haywood, N.J.; Cordell, P.A.; Smith, J.; Yuldasheva, N.Y.; Sengupta, A.; Ali, N.; Mercer, B.N.; Mughal, R.S.; Riches, K.; et al. Insulinlike growth factor-binding protein-1 improves vascular endothelial repair in male mice in the setting of insulin resistance. Endocrinology 2018, 159, 696–709. [Google Scholar] [CrossRef] [PubMed]
- Slater, T.; Haywood, N.J.; Matthews, C.; Cheema, H.; Wheatcroft, S.B. Insulin-like growth factor binding proteins and angiogenesis: From cancer to cardiovascular disease. Cytokine Growth Factor Rev. 2019, 46, 28–35. [Google Scholar] [CrossRef] [PubMed]
- Fischer, A.; Schumacher, N.; Maier, M.; Sendtner, M.; Gessler, M. The notch target genes hey1 and hey2 are required for embryonic vascular development. Genes Dev. 2004, 18, 901–911. [Google Scholar] [CrossRef]
- Park, J.K.; Lee, T.W.; Do, E.K.; Moon, H.J.; Kim, J.H. Role of notch1 in the arterial specification and angiogenic potential of mouse embryonic stem cell-derived endothelial cells. Stem Cell Res. Ther. 2018, 9, 197. [Google Scholar] [CrossRef] [PubMed]
- Ying, J.; Li, H.; Seng, T.J.; Langford, C.; Srivastava, G.; Tsao, S.W.; Putti, T.; Murray, P.; Chan, A.T.; Tao, Q. Functional epigenetics identifies a protocadherin PCDH10 as a candidate tumor suppressor for nasopharyngeal, esophageal and multiple other carcinomas with frequent methylation. Oncogene 2006, 25, 1070–1080. [Google Scholar] [CrossRef]
- Xu, Y.; Yang, Z.; Yuan, H.; Li, Z.; Li, Y.; Liu, Q.; Chen, J. PCDH10 inhibits cell proliferation of multiple myeloma via the negative regulation of the wnt/beta-catenin/bcl-9 signaling pathway. Oncol. Rep. 2015, 34, 747–754. [Google Scholar] [CrossRef]
- Shi, D.; Murty, V.V.; Gu, W. PCDH10, a novel p53 transcriptional target in regulating cell migration. Cell Cycle 2015, 14, 857–866. [Google Scholar] [CrossRef]
- Houde, A.A.; Guay, S.P.; Desgagne, V.; Hivert, M.F.; Baillargeon, J.P.; St-Pierre, J.; Perron, P.; Gaudet, D.; Brisson, D.; Bouchard, L. Adaptations of placental and cord blood abca1 DNA methylation profile to maternal metabolic status. Epigenetics 2013, 8, 1289–1302. [Google Scholar] [CrossRef]
- Dilli, D.; Dogan, N.N.; Ipek, M.S.; Cavus, Y.; Ceylaner, S.; Dogan, H.; Dursun, A.; Kucukozkan, T.; Zenciroglu, A. Mafos-gdm trial: Maternal fish oil supplementation in women with gestational diabetes and cord blood DNA methylation at insulin like growth factor-1 (igf-1) gene. Clin. Nutr. ESPEN 2018, 23, 73–78. [Google Scholar] [CrossRef]
- Pauwels, S.; Ghosh, M.; Duca, R.C.; Bekaert, B.; Freson, K.; Huybrechts, I.; Langie, S.A.S.; Koppen, G.; Devlieger, R.; Godderis, L. Maternal intake of methyl-group donors affects DNA methylation of metabolic genes in infants. Clin. Epigenetics 2017, 9, 16. [Google Scholar] [CrossRef] [PubMed]
- Ott, R.; Melchior, K.; Stupin, J.H.; Ziska, T.; Schellong, K.; Henrich, W.; Rancourt, R.C.; Plagemann, A. Reduced insulin receptor expression and altered DNA methylation in fat tissues and blood of women with gdm and offspring. J. Clin. Endocrinol. Metab. 2019, 104, 137–149. [Google Scholar] [CrossRef] [PubMed]
- Awamleh, Z.; Butcher, D.T.; Hanley, A.; Retnakaran, R.; Haertle, L.; Haaf, T.; Hamilton, J.; Weksberg, R. Exposure to gestational diabetes mellitus (gdm) alters DNA methylation in placenta and fetal cord blood. Diabetes Res. Clin. Pract. 2021, 174, 108690. [Google Scholar] [CrossRef] [PubMed]
- Danese, E.; Minicozzi, A.M.; Benati, M.; Montagnana, M.; Paviati, E.; Salvagno, G.L.; Gusella, M.; Pasini, F.; Guidi, G.C.; Lippi, G. Epigenetic alteration: New insights moving from tissue to plasma—The example of PCDH10 promoter methylation in colorectal cancer. Br. J. Cancer 2013, 109, 807–813. [Google Scholar] [CrossRef] [PubMed]
- Liu, W.; Wu, J.; Shi, G.; Yue, X.; Liu, D.; Zhang, Q. Aberrant promoter methylation of PCDH10 as a potential diagnostic and prognostic biomarker for patients with breast cancer. Oncol. Lett. 2018, 16, 4462–4470. [Google Scholar] [CrossRef] [PubMed]
- Seo, S.I.; Yoon, J.H.; Byun, H.J.; Lee, S.K. Hotair induces methylation of PCDH10, a tumor suppressor gene, by regulating dnmt1 and sponging with mir-148b in gastric adenocarcinoma. Yonsei Med. J. 2021, 62, 118–128. [Google Scholar] [CrossRef]
- Ying, J.; Gao, Z.; Li, H.; Srivastava, G.; Murray, P.G.; Goh, H.K.; Lim, C.Y.; Wang, Y.; Marafioti, T.; Mason, D.Y.; et al. Frequent epigenetic silencing of protocadherin 10 by methylation in multiple haematologic malignancies. Br. J. Haematol. 2007, 136, 829–832. [Google Scholar] [CrossRef]
- Park, Y.; Lee, H.J.; Jung, Y.J.; Kwon, H.Y.; Kim, H.; Lee, J.; Kim, Y.H.; Kim, H.O.; Maeng, Y.S.; Kwon, J.Y. Cd133+/c-kit+lin(−) endothelial progenitor cells in fetal circulation demonstrate impaired differentiation potency in severe preeclampsia. Pregnancy Hypertens. 2019, 15, 146–153. [Google Scholar] [CrossRef]
- Kwon, H.; Kwon, J.-Y.; Song, J.; Maeng, Y.-S. Decreased lymphangiogenic activities and genes expression of cord blood lymphatic endothelial progenitor cells (vegfr3+/pod+/cd11b+ cells) in patient with preeclampsia. Int. J. Mol. Sci. 2021, 22, 4237. [Google Scholar] [CrossRef]


Disclaimer/Publisher’s Note: The statements, opinions and data contained in all publications are solely those of the individual author(s) and contributor(s) and not of MDPI and/or the editor(s). MDPI and/or the editor(s) disclaim responsibility for any injury to people or property resulting from any ideas, methods, instructions or products referred to in the content. |
© 2023 by the authors. Licensee MDPI, Basel, Switzerland. This article is an open access article distributed under the terms and conditions of the Creative Commons Attribution (CC BY) license (https://creativecommons.org/licenses/by/4.0/).