Abstract
There is growing evidence that various ATP-binding cassette (ABC) transporters contribute to the growth and development of tumors, but relatively little is known about how the ABC transporter family behaves in hepatocellular carcinoma (HCC), one of the most common cancers worldwide. Cellular model studies have shown that ABCC6, which belongs to the ABC subfamily C (ABCC), plays a role in the cytoskeleton rearrangement and migration of HepG2 hepatocarcinoma cells, thus highlighting its role in cancer biology. Deep knowledge on the molecular mechanisms underlying the observed results could provide therapeutic insights into the tumors in which ABCC6 is modulated. In this study, differential expression levels of mRNA transcripts between ABCC6-silenced HepG2 and control groups were measured, and subsequently, Gene Ontology (GO) and Kyoto Encyclopedia of Genes and Genomes (KEGG) analyses were performed. Real-Time PCR and Western blot analyses confirmed bioinformatics; functional studies support the molecular mechanisms underlying the observed effects. The results provide valuable information on the dysregulation of fundamental cellular processes, such as the focal adhesion pathway, which allowed us to obtain detailed information on the active role that the down-regulation of ABCC6 could play in the biology of liver tumors, as it is involved not only in cell migration but also in cell adhesion and invasion.
1. Introduction
The ATP-binding cassette 6 transporter (ABCC6), one of the ABCC subfamily members, is mainly known because gene mutations are responsible for pseudoxanthoma elasticum (PXE), a rare autosomal recessive disease characterized by a progressive ectopic calcification of elastic fibers in dermal, ocular, and vascular tissues [1,2,3]. ABCC6 is mostly expressed in the liver [4], where it promotes the release of ATP from hepatocytes into the bloodstream [5,6] and contributes to purinergic signaling [7]. Outside the hepatocytes, the released ATP is hydrolyzed by the ENPP1 (ectonucleotide pyrophosphatase/phosphodiesterase 1) to adenosine monophosphate (AMP) and pyrophosphate (PPi), an inhibitor of ectopic mineralization [8]. AMP is then dephosphorylated into adenosine by CD73 (ecto-5′-nucleotidase, Ecto5′NTase), a key player in the regulation of several tumor processes, including invasion, migration, and metastasis [9].
Several studies have investigated the potential associations between ABCC6, cancer development, and multidrug resistance. ABCC6 is involved in the resistance to several anticancer agents, including etoposide, doxorubicin, and daunorubicin [10], and its up-regulation appears to contribute to gemcitabine resistance in human non-small-cell lung cancer and to Nilotinib and Dasatinib resistance in both chronic myeloid leukemia cell lines and primary patient mononuclear cells [11,12]. Moreover, in head and neck squamous cell carcinoma cancer stem cells, its down-regulation following valproic acid treatment seems to contribute to reduced chemoresistance [13].
Trujillo-Paolillo et al. investigated the expression of genes related to pharmacogenetics in osteosarcoma and discovered that tumors from metastatic patients had a higher expression of ABCC6 than tumors from non-metastatic patients [14]. The overexpression of ABCC6 is frequently associated with a bad outcome in patients with stomach cancer [15] and highly aggressive tumors such as high-grade serous ovarian cancer [16]. In contrast, ABCC6 expression was associated with survival of lung adenocarcinoma in [17].
Contrary to previous findings, it was also revealed that ABCC6 down-regulation is associated with enhanced treatment resistance in some cancers. For example, cisplatin-resistant ovarian cancer cell lines and colorectal cancer non-responders to treatment have lower ABCC6 expression than responders [18,19]. ABCC6 down-regulation has also been associated with the development and progression of pancreatic ductal adenocarcinoma [20].
Regarding the role of ABCC6 in hepatocellular carcinoma, a recent study demonstrated that low expressions of ABCC6 and other ABCC transporters are correlated with poor prognoses in liver hepatocellular carcinoma, identifying these proteins as potential diagnostic markers [21]. Zhao et al. reported that ABCC6 is down-regulated in HCC tumor tissues and correlates with favorable outcomes in patients with HCC [22].
In hepatocarcinoma HepG2 cells, ABCC6 knockdown and its pharmacological inhibition by Probenecid result in cytoskeleton reorganization and the down-regulation of CD73 expression. The restoration of the normal morphology of filopodia and migration rate in HepG2 upon addition of ATP or adenosine suggests that this effect is most likely caused by a decrease in the extracellular ATP and adenosine pool through a modification of ABCC6-mediated ATP efflux [7,23,24] under the control of the PI3K/AKT signaling pathway, which is down-regulated in ABCC6 knockdown cells [25,26]. Furthermore, through providing ATP to the extracellular purine pool, ABCC6 appears to play a significant role in regulating migration into Caco2 colon cancer cells [27].
Cell migration, invasion, and adhesion are crucial steps in cancer progression. These processes involve a number of cellular mechanisms led by cytoskeleton dynamics, as well as molecular changes such as the production of adhesion and proteolytic enzymes [28,29]. An altered expression of cell adhesion molecules, including cadherins and integrins, can enhance tumor cell adhesion to the extracellular matrix (ECM), thus promoting invasion and metastasis [30,31].
The purpose of this study was to understand the role of the ABCC6 transporter in the biology of hepatocarcinoma. By using high-throughput RNA-Seq technology, the impact of ABCC6 silencing in HepG2 cells was explored. The dysregulation of the focal adhesion pathway, shown by KEGG functional enrichment analysis, demonstrated that ABCC6 transporter activity is implicated in cell–ECM adhesion. The silencing of ABCC6 may lessen the aggressive phenotype of HepG2 cells by preventing EMT and decreasing cell motility and invasion.
2. Results
2.1. Whole Transcriptome of the ABCC6-Silenced HepG2 Cell Line
Whole transcriptome RNA sequencing was performed by next-generation sequencing in ABCC6–shRNA (SH–ABCC6) and Scramble–shRNA (SCR–RNA) cells to highlight possible gene differences between the two conditions. After filtering out low-quality reads and trimming the adaptors, the obtained reads were aligned against the human genome reference (HG38—Release 37 (GRCh38.p13)) [32].
More than 16,638 expressed normalized genes were identified and quantified between samples. Principal components analysis (PCA) suggested good mRNA expression patterns in the two group of cells.
To investigate the overall mRNA expression differences between the two groups, hierarchical clustering analyses were performed. Samples showed expression heterogeneity among two groups, suggesting a molecular diversity that is reflected by mRNA expression (Figure 1A). A Volcano plot was constructed to show the differentially expressed genes between the two groups (Figure 1B).

Figure 1.
The analysis of differentially expressed genes. (A) A heatmap of differentially expressed genes. Red indicates that the expression level of the gene is relatively up–regulated, and green indicates that the expression level of the gene is relatively down-regulated. (B) Volcano plot of differentially expressed genes, where in black is shown the pvalue cutoff, instead in blue, log2(Fold-change) cutoff.
In detail, our differential expression analysis revealed 476 statistically significant (padj ≤ 0.05) genes between the two groups (SHvsSCR). Among them, 256 genes were significantly (padj ≤ 0.05 and |FC| ≥ 1.5) up-regulated, and 208 genes (padj ≤ 0.05 and |FC| ≤ −1.5) were significantly down-regulated. The raw data and the normalized count of genes identifies are available at the ArrayExpress repository under accession number: E-MTAB-13154.
The top 10 differentially expressed genes that were found to be up-regulated and down-regulated in ABCC6-silenced HepG2 cells are shown in Table 1.

Table 1.
The top 10 differentially expressed genes (up-regulated and down-regulated) in ABCC6-silenced HepG2 cells.
2.2. Functional Enrichment Analysis of Differentially Expressed Genes
To identify the active subnetworks that were enriched by the obtained differentially expressed genes, we used the pathfinder tool. We chose to use two functional enrichment analysis by selecting the Gene Ontology (GO) and Kyoto Encyclopedia of Genes and Genomes (KEGG) databases, respectively.
GO enrichment analysis was performed to analyze the functions of the differentially expressed genes; the top 30 GO terms are displayed in Figure 2. The enriched GO term of up- and down-regulated differentially expressed genes were mainly mitochondrial matrix (GO:0005759), cell surface (GO:0009986), and DNA–binding transcription factor binding (GO:0140297), as shown in Figure 2A. Moreover, as shown in Figure 2B, in the top enriched GO terms, we found the most up- and down-regulated differentially expressed genes.

Figure 2.
GO enrichment analysis of differentially expressed genes. (A) Enriched plot of GO analysis of up- and down-regulated genes. The top 30 terms are shown. (B) GO UpSet plot combines intersections of enriched terms below x-axis and bar plot of the number of genes in the corresponding intersections showing relative log2FoldChange. In the various intensities of green and red we see genes down-regulated and up-regulated.
KEGG pathway enrichment analysis showed that the differentially expressed genes participated in 91 statistically significant pathways. The enriched KEGG pathways were mainly dilated cardiomyopathy (hsa05414), focal adhesion (hsa04510), and proteoglycans in cancer (hsa05205), with 10 genes (up- and down-regulated) mainly involved, as shown in Figure 3 and Table 2 (data extracted from Supplementary Table S1).
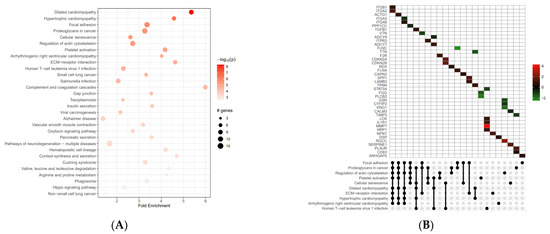
Figure 3.
Our KEGG pathway enrichment analysis of differentially expressed genes. The results of our analysis of up-regulated and down-regulated genes are shown, along with the top 30 pathways. (A) The up- and down-regulated differential genes are mainly concentrated in the protein processing of dilated cardiomyopathy and focal adhesion. (B) KEGG UpSet plot combines intersections of enriched terms below x-axis and bar plot of the number of genes in the corresponding intersections showing relative log2FoldChange. In the various in-tensities of green and red we see genes down-regulated and up-regulated.
Table 2.
The top 10 enriched signaling pathways of up-regulated and down-regulated differentially expressed genes.
2.3. The Silencing of ABCC6 Changes the Expression of Some Proteins Involved in Cell–Cell and Cell–Matrix Interactions
The dysregulation of proteins responsible for cell–cell and cell–ECM interactions led us to investigate the possible involvement of ABCC6 in these dynamics.
Integrin-mediated adhesion and signaling dysregulation are precursors in cancer etiology. Integrins contribute to ECM remodeling and facilitate cancer cell colonization in new metastatic sites. Among the top pathways affected by ABCC6 gene silencing, the focal adhesion pathway shows increased expression levels of the driver genes ITGA2 and ITGA6. The adhesion of ABCC6-silenced cells to Matrigel increased by 50% (Figure 4).
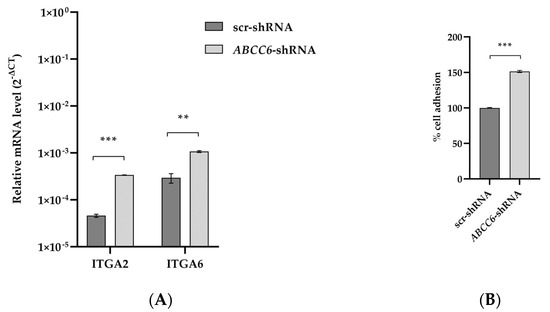
Figure 4.
Expression levels of ITGA2 and ITGA6 transcripts and adhesion of ABCC6-silenced HepG2 cells to Matrigel. (A) RT–PCR results are expressed as the 2−ΔCt and are presented as the mean ± SEM of at least three independent experiments. β-actin was used as a reference gene. Statistical analysis was performed using Student’s t test; ** p < 0.01, *** p < 0.001. (B) Adhesion of scr–shRNA and ABCC6–shRNA cells to Matrigel. The percentage of adherent cells was plotted as a percentage of total cells. Data are mean of three independent replicates with three biological replicates (independent clones) per experiment. Results were analyzed using Student’s t test; *** p < 0.001.
RT-qPCR and Western blotting were performed to evaluate the effect of ABCC6 silencing on some liver cancer-related genes. According to our transcriptomic analysis, the expression levels of FLNC and MATN2 are significantly lower; on the contrary, the expression level of CDH17 is weakly increased in silenced cells (Figure 5).


Figure 5.
The expression levels of CDH17, FLNC, and MATN2 in ABCC6-silenced HepG2 cells. (A) Results are expressed as the 2−ΔCt and are presented as the mean ± SEM of at least three independent experiments. β–actin was used as a reference gene. Scrambled cells (scr–shRNA) were used as controls for ABCC6 knockdown (ABCC6–shRNA cells). (B) Representative Western blot and densitometric analysis of the immunoreactive bands. The protein levels were normalized with β-actin content and refer to that of scr–shRNA cells set to 100%. Data are presented as mean ± SEM of at least three independent experiments. Statistical analysis was performed using Student’s t test; * p < 0.05, ** p < 0.01, *** p < 0.001.
2.4. ABCC6-Silenced Cells Modify Their Clonogenic Potential and Ability to Invade the Extracellular Matrix
A colony formation assay demonstrated that the colony numbers of the ABCC6–shRNA HepG2 cells were significantly decreased compared with the control group, thus showing that they are less aggressive than scrambled ones (Figure 6).

Figure 6.
Clone formation assay. Images show the colonies formed by control HepG2 (scr–shRNA) and ABCC6-silenced HepG2 cells. Data are presented as the mean ± SEM of three independent experiments. Statistical analysis was performed using Student’s t test; *** p < 0.001.
In order to verify whether the silencing of the ABCC6 gene can also compromise the ability to invade the ECM, the transwell assay with Matrigel was performed. The silenced cells were considerably less invasive than the control cells (Figure 7). Without Matrigel, according to the results of a previous wound healing assay [7], ABCC6–shRNA cells migrated more slowly.

Figure 7.
Migration and Matrigel invasion assay of scr–shRNA and ABCC6–shRNA HepG2 cells using a transwell system. Purple represents migrating and invaded cells dyed with crystal violet (magnification ×20, FLoidTM Cell Imaging Station). Data are presented as the mean ± SEM of three independent experiments. Statistical analysis was performed using Student’s t test; * p < 0.05; *** p < 0.001.
It is known that matrix metalloproteinases are responsible for the destruction of the ECM and the growth of cancer [33]. Both cell lysates and media were analyzed for the presence of gelatinolytic active metalloproteinases. The expression levels of MMP9 and MMP2 were significantly reduced in ABCC6-silenced HepG2 cells. The gelatinases are secreted enzymes. Media from scr–shRNA cells and ABCC6–shRNA cells were subjected to gelatin zymography. The SDS–gelatin gel zymogram demonstrated three gelatinolytic bands, including gelatinase B (92 kDa, gelatinase/MMP9) and gelatinase A (72 kDa, gelatinase/MMP2). The gelatinolytic intensity was stronger in the control cells than in the silenced cells.
As demonstrated by gelatin zymography, the activated enzymes were released from the cells into the medium. Control scrambled–transfected cells showed a reduced activity of both metalloproteinases (Figure 8).


Figure 8.
Expression levels of MMP2 and MMP9 in ABCC6-silenced HepG2 cells. (A) Representative Western blot of scr–shRNA cells and ABCC6–shRNA cell lysates. Scr–shRNA cells were used as controls for ABCC6 knockdown. Densitometric analysis of the immunoreactive bands performed in three independent experiments. The protein levels were normalized with β-actin content. (B) Expression level of extracellular MMP2 and MMP9 in cell media. The protein levels in the culture media of scrambled and silenced cells were normalized with total protein content. Data shown refer to those obtained on the culture medium of the scrambled cells set to 100%. Data are presented as the mean ± SEM of three independent experiments. (C) Gelatin zymography gel comparing MMP2 and MMP9 production in culture media of scr–shRNA cells and ABCC6–shRNA cells. Densitometric analysis of the bands were performed in three independent experiments. The protein levels were normalized with total protein content. Data were normalized to scr–shRNA cells set to 100%, and are presented as the mean ± SEM of three independent experiments. Statistical analysis was performed using Student’s t test; * p < 0.05; ** p < 0.01.
2.5. ABCC6 Silencing Dysregulates Genes Involved in the Epithelial–Mesenchymal Transition
Epithelial–Mesenchymal Transition (EMT) is a process in which tumor cells lose their epithelial characteristics and transform into more aggressive mesenchymal cells, and this process is a vital mechanism for tumor metastasis [34]. EMT frequently results in the loss of (or a reduction in) E-cadherin and an increase in Vimentin and N-cadherin expression levels, a crucial mechanism in causing cancer to migrate and invade. In contrast to the control cells, the ABCC6 knockdown cells consistently showed up-regulation of the epithelial marker E-cadherin and down-regulation of the mesenchymal marker Vimentin. No changes were observed in the N-cadherin expression. Moreover, ABCC6-silenced cells showed a decreased level of extracellular Vimentin (Figure 9).


Figure 9.
Expression analysis of EMT proteins. (A) Relative mRNA expression levels of Vimentin, N–cadherin, and E–cadherin genes in scr–shRNA and ABCC6–shRNA cells. Results are expressed as the 2−ΔCt and are presented as the mean ± SEM of at least three independent experiments. β-actin was used as a reference gene. (B) Representative Western blot of scr–shRNA and ABCC6–shRNA cells. Densitometric analysis of the immunoreactive bands was performed in three independent experiments. The protein levels were normalized with β–actin content. Data were normalized to scr–shRNA cells set to 100%. Data are presented as the mean ± SEM of three independent experiments. (C) Representative images of immunofluorescence staining of N–cadherin, E-cadherin, and Vimentin (green signal) in fixed scr–shRNA HepG2 cells in comparison to ABCC6–shRNA. HepG2 cells using a 20× FLoidTM Cell Imaging Station fluorescence microscope. Cells were counterstained with 4′,6-diamidino-2-phenylindole (DAPI) to visualize nuclei (blue signal). Scale bar: 100 μm. (D) Expression level of extracellular Vimentin. The protein levels in the culture media of scrambled and silenced cells were normalized with total protein content. Data shown refer to those obtained on the culture medium of the scrambled cells set to 100%. Data are presented as the mean ± SEM of three independent experiments. Statistical analysis was performed using Student’s t test; * p < 0.05, ** p < 0.01.
3. Discussion
ABCC6 is highly expressed in HepG2 cells; therefore, it may have a role in controlling cell migration and invasion by feeding the extracellular purine pool with ATP and adenosine (the end product of ATP degradation) via ectonucleotidases such as CD39 and CD73 [5,25].
The role of ABCC6 in cancer has often been controversial; therefore, to further understand its role in hepatoma biology, we investigated the effect of ABCC6 gene silencing on the HepG2 cells transcriptome. Differential expression analysis of mRNA transcripts between ABCC6-silenced HepG2 and scrambled cells revealed 476 statistically significant genes. Among them, 256 genes were significantly up-regulated and 208 genes were significantly down-regulated. GO enrichment analysis showed that the up- and down-regulated differentially expressed genes were mainly related to the mitochondrial matrix, cell surface, and DNA–binding transcription factor binding. The KEGG enrichment analysis showed that the differentially expressed genes participated in 91 statistically significant pathways, mainly dilated cardiomyopathy, focal adhesion, and proteoglycans.
Focal adhesions connect ECM to the cell cytoskeleton and participate in the early stages of the metastasis process, a sequential, multi-stages process which comprises the reorganization of cell–ECM interaction, matrix destruction and invasion, and new tumor formation in a secondary site [35,36,37].
RNA-seq analysis highlighted the up-regulation of the ITGA2 and ITGA6 integrins, which are responsible for cell–cell and cell–matrix adhesion as long as they can activate both “inside-out” signaling, thus promoting cell migration and ECM assembly and remodeling, as well as “outside-in” signaling, changing cytoskeletal structure [38,39,40]. In silenced ABCC6 cells, we observed the overexpression of integrins ITGA2 and ITGA6 and, as a consequence, the adhesion of the silenced cells to Matrigel, an excellent substitute for the ECM for in vitro studies, significantly increased. Therefore, ABCC6 could be involved in the adhesion dynamics between cells and matrix cells, modulating the ability of HepG2 cells to adhere to the ECM.
The transwell migration and invasion assay shows that silencing ABCC6 modifies the capacity of HepG2 cells to move and invade. The low ability of ABCC6-silenced cells to invade the Matrigel was most likely due to the reduced expression and secretion of active forms of the two metalloproteinases MMP2 and MMP9, whose activities have been correlated with the invasive stage of carcinomas [33,41].
Very aggressive tumor cells with a mesenchymal character have the unique capacity to migrate from the primary site and create a new tumor in other organs. The acquisition of this aggressive phenotype during epithelial–mesenchymal transition (EMT) involves the up-regulation of N-cadherin and Vimentin, followed by the down-regulation of E-cadherin [42,43,44,45,46]. ABCC6 knockdown results in the over-expression of the epithelial marker E-cadherin and the down-regulation of the mesenchymal markers Vimentin and N-cadherin, thus confirming the lower propensity for aggressiveness of the ABCC6-silenced cells. Even the decreased ability to survive over time and expand into a clonal population when seeded at a low density supports ABCC6-silenced cell limited aggressive behavior, according to a senescent phenotype that has already been demonstrated and discussed [47].
The down-regulation of FLNC and MATN2 are also in agreement with this phenotype. FLNC and MATN2 are two proteins that help to remodel the cytoskeleton, influencing cell migration and invasion. FLNC is a cytoskeletal protein that has been identified as a potential hepatocellular carcinoma progression marker; altered FLNC expression may lead to enhanced tumor cell motility and invasiveness [48,49]. MATN2 is an extracellular matrix protein involved in the formation of filamentous networks; its expression is increased in hepatocellular carcinoma and liver cirrhosis [50,51].
Overall, the effects observed following ABCC6 silencing in the HepG2 cells could be both the direct result of the modulation of intracellular metabolic pathways and the involvement of the purinergic system. In ABCC6-silenced HepG2 cells, we previously observed a decrease in the p-AKT/AKT and p-ERK/ERK ratios [25,26]. The activation of purinergic receptors in control cells by available extracellular ATP would trigger the intracellular signaling pathways of phosphatidylinositol 3-kinase/AKT (PI3K/AKT) and mitogen-activated protein kinase/extracellular signal-regulated kinase (MAPK/ERK), which, in turn, would recruit downstream effectors, which can ultimately affect adhesion, migration, and invasion by controlling the expression of related genes. The involvement of these signaling pathways and their implications for liver cancer are widely documented [52,53,54]. As a result, it is likely that the effects observed in the knockdown cells are precisely due to the reduction in extracellular ATP resulting from the deregulation of ABCC6.
There is no doubt that the enormous amount of data available from transcriptomic analysis opens up the possibility of investigating any other not yet explored role of ABCC6, which might assume the role of a regulator in the biology of hepatocellular carcinoma. In addition, the findings of this study could make an important contribution to the search for effective drugs for the management of hepatocellular carcinoma, for which there are still limited therapeutic options, as most are based on tyrosine kinase inhibitors, which mostly show poor efficacy and numerous collateral effects [55]. Few studies have proposed the use of prodrugs as a more tolerated and safer therapeutic alternative [56,57].
The concomitant administration of ABCC6 inhibitors and tyrosine kinase inhibitors has been suggested as a therapeutic option for the treatment of chronic myeloid leukemia [12], and it could certainly be interesting to evaluate its potential on hepatoma cell cultures. Furthermore, the intricate interplay between all the pathways regulated by ABCC6 and the dysregulated genes could allow us to hypothesize about using other molecules with anti-tumor activity in combination with ABCC6 inhibitors.
Although the data obtained from this study cannot be directly translated to what happens in vivo to tumor cells, as the tumor microenvironment is a much more complex system of the immune and stromal cells which interact with cancer cells, it would be interesting to investigate the role of ABCC6 in relation to the antitumor responses and immune evasion mechanisms in HCC. Our future studies will center around investigating this aspect.
4. Materials and Methods
4.1. Cell Lines and Maintenance of Cell Culture
The human hepatocellular carcinoma cell lines (HepG2) were purchased from ATCC (American Type Culture Collection) and maintained in Dulbecco’s modified Eagle’s medium (DMEM) containing 4.5 g/L glucose and supplemented with 10% fetal bovine serum (FBS), 2 mM L-glutamine, 60 µg/mL penicillin G, and 100 µg/mL streptomycin sulfate (EuroClone S.p.A, Pero, Italy). Cells were incubated in a humidified incubator at 37 °C under an atmosphere containing 5% CO2. The cells were subcultured at preconfluent densities using 0.25% trypsin-EDTA (EuroClone S.p.A, Pero, Italy).
4.2. Gene Knockdown of Stable Cell Lines
The ABCC6 knockdown HepG2 cell line was constituted using a lentivirus shRNA knockdown vector system. Cell transfection was carried out according to the instructions of the manufacturer, VectorBuilder Inc. (Chicago, IL, USA), from whom the lentiviruses were purchased. Cells were transfected with viral particles containing a mixture of three different shRNAs, with each one targeting a different area of the ABCC6 transcript: shRNA#1 AGATCGAGTTCGGGACTTTG targeted sequences (nucleotides 3773-3919) within exon 26; shRNA#2 CAACAAGGCAATAGCATTTAA targeted sequences within exon 6 (nucleotides 700–831) by exon 7 (nucleotides 832–1035); shRNA#3 TCCCTGCCTCCACAGAATAAA targeted sequences within exon14 (nucleotides 1905–1980) by exon 15 (nucleotides 1981–2107). Scramble–shRNA (scr–shRNA) CCTAAGGTTAAGTCGCCCTCG (used as control) does not map with ABCC6. HepG2 cells were seeded at a density of 1.5 × 10⁴ in a 12-well culture plate. After 24 h, the cells were transfected with a mixture of the three ABCC6–shRNAs or scr–shRNA as a control. The HepG2 cells were selected with 2 μg/mL puromycin for 12 days in order to select stable silenced cells. After selection, individual resistant clones were expanded in medium without puromycin, and the clones silenced between 70% and 80% were used for the experiments (Supplementary Figure S1). Three different clones of scrambled and ABCC6-silenced cells were used for biological replicates.
4.3. RNA Sequencing
The total RNA was extracted from the cells by using the Quick-RNA MiniPrep kit (ZymoResearch, Irvine, CA, USA) according to the manufacturer’s instructions. RNA was stored at −80 °C until further processing. RNA concentration and purity were evaluated using NanoDrop™ 2000/2000c (Thermo Fisher Scientific, Waltham, MA, USA), whereas sample integrity was analyzed using Tape Station 4200 (Agilent Technologies, Santa Clara, CA, USA) using an RNA Screen Tape Assay. Indexed libraries were prepared from 1 µg/ea purified RNA using the TruSeq Stranded mRNA (Illumina, San Diego, CA, USA) Library Prep Kit according to the manufacturer’s instructions.
After the enrichment of mRNA using oligo dT magnetic beads and fragmentation, cDNA synthesis was performed, followed by adapter ligation and PCR amplification. For library quantifications, TapeStation 4200 (Agilent Technologies) was used. Indexed libraries were pooled in equimolar amounts, with a final concentration of 2 nM.
The Illumina NextSeq 550 DX System was used to sequence the pooled samples in a 2 × 75 paired-end format. The raw sequence files generated (fastq files) underwent quality control analysis using FastQC [58]. Low-quality reads, short reads (≤25 bp), and adaptor sequences were trimmed using cutadapt (v.2.8) [59]. Then, the fastq files were mapped on the reference genome using the bioinformatics tool STAR (version 2.7.3a) [60] with the standard parameters for paired reads. The reference track was the Human assembly obtained from GenCode (HG38-Release 37 (GRCh38.p13) [32].
The quantification of genes expressed for each sequenced sample was computed using the featureCounts algorithm [61]. An ad hoc script in R was used to normalize the data using negative binomial generalized linear models, considering all genes expressed in the samples using the Bioconductor DESeq2 package [62]. Genes showing fold change ≥ 1.50 or ≤−1.50 (|FC| ≥ 1.50), along with adjusted p values ≤ 0.05 (padj), were considered as differentially expressed. The ComplexHeatmap [63,64] and ggplot2 [65] package in R were used to create heat maps and volcano plots of the differentially expressed genes, respectively.
4.4. Functional and Pathway Analysis of Differentially Regulated Genes
The R package pathfinder [66] intended for the identification of enriched pathways was used to perform the functional analysis. In particular, pathfindR analysis was based on the KEGG pathway database and GO database, and selected genes were set with padj ≤ 0.05 and |fold-change| ≥ 1.5. Only the enriched terms with adjusted p value ≤ 0.05 were used for the downstream analysis, including the hierarchical clustering of the terms. Furthermore, the pathfindR function score terms were used to calculate the aggregated term scores per sample based on gene expression patterns.
4.5. Real-Time Reverse Transcription Polymerase Chain Reaction (RT-qPCR)
The silenced and control cells were harvested, and total RNA was extracted using the Quick-RNA MiniPrep kit (Zymo Research, Irvine, CA, USA) according to the manufacturer’s protocol. cDNA was synthesized using a High-Capacity cDNA Reverse Transcription Kit (Applied Biosystem, Foster City, CA, USA) in accordance with the manufacturer’s instructions. Real-time quantitative RT-PCR was performed via a 7500 Fast Real-Time PCR System (Applied Biosystems) using iTaqTM Universal-SYBR®®®® Green Supermix (Bio-Rad). To confirm PCR specificity, the PCR products were subjected to a melting curve analysis. RT-PCR results are expressed as the 2−ΔCt, with β-actin as the endogenous reference control. Primers were designed to span exon–exon junctions, eliminating undesirable genomic DNA amplification (Table 3).
Table 3.
List of primers used in this study.
4.6. Western Blot Analysis
The cells were suspended in radioimmunoprecipitation assay (RIPA) buffer (0.1% sodium dodecyl sulfate, 1% NP-40, and 0.5% sodium deoxycholate in PBS at pH 7.4) supplemented with a protease and phosphatase inhibitor cocktail (Roche, Penzberg, Germany) and lysed via sonication. Then, the lysates were centrifuged at 13,000 rpm for 10 min at 4 °C. The proteins (40 μg) were resuspended in Laemmli sample buffer (60 mM Tris–HCl pH 6.8, 10% glycerol, 2% SDS, 1% β-mercaptoethanol and 0.002% bromophenol blue), loaded into sodium dodecyl sulfate–polyacrylamide gels electrophoresis, and electrophoretically transferred to nitrocellulose membranes (Amersham Bioscience, Buckinghamshire, UK). The membranes were blocked in a saturation buffer (with 5% non-fat milk in PBS with 0.05% Tween 20, PBST) for 2 h at room temperature and then probed overnight at 4 °C with specific primary antibodies: 1:10,000 anti-β-actin monoclonal antibody (cat no. MA1-140; Thermo Fisher Scientific, Inc., Waltham, MA, USA); 1:5000 E-cadherin Monoclonal antibody (cat no. 60335-1-Ig; ProteinTech Group, Inc., Chicago, IL, USA); 1:1000 MMP9 (N-terminal) Polyclonal antibody (cat no. 10375-2-AP, ProteinTech Group, Inc.); 1:1000 MMP2 Mouse Monoclonal antibody (cat no. 66366-1-Ig; ProteinTech Group, Inc., Chicago, IL, USA); 1:5000 N-cadherin Monoclonal antibody (cat no. 66219-1-Ig, ProteinTech Group, Inc.); 1:1000 Cadherin-17 Polyclonal antibody (cat no. 24339-1-AP, ProteinTech Group, Inc.); 1:1000 Matrilin 2 Polyclonal antibody (cat no. 24064-1-AP, ProteinTech Group, Inc.); 1:1000 FLNC Polyclonal antibody (cat no. 28492-1-AP, ProteinTech Group, Inc.); 1:5000 Vimentin Mouse Monoclonal antibody (cat no. 10366-1-AP, ProteinTech Group, Inc.). The membrane was washed three times with PBST and then incubated at room temperature for 1 h with an appropriated horseradish peroxidase-conjugated secondary antibody and signal visualized via ECL™ Western Blotting Detection Reagents (GE Healthcare, Chicago, IL, USA) or the SuperSignal™ West Pico PLUS Chemiluminescent Substrate (Thermo Scientific, Waltham, MA, USA) using a Chemidoc™ XRS detection system equipped with Image Lab 5.1 software for image acquisition (BioRad). Densitometric analysis was performed by using GelAnalizer 19.1 (Istvan Lazar, www.gelanalyzer.com (accessed on 1 January 2023). The protein expression level in the control sample was taken as 100%. Each result was expressed as a percentage of the value of the control sample. Each test was repeated three time.
4.7. Cell Adhesion Assay
The ABCC6–shRNA cells and control cells (5 × 10⁶ cells/mL) were resuspended in serum-free medium containing 5 μM Calcein AM (acethoxymethyl ester). After incubation at 37 °C for 30 min, the cells were washed with PBS and resuspended in their respective medium, and 100 μL of cell suspension was added to plates coated for 120 min with 100 μg/mL of Matrigel, an extract derived from a tumor, containing all of the major components of many tissue basement membranes (Corning Life Sciences, Shanghai, China). Non-adherent cells were removed by gentle washing with PBS, and the fluorescence emission of adherent cells was monitored at 520 nm. The fluorescence signal of the cells before the two hours of incubation was designated as 100% control. The percentage of adhesion was calculated by dividing the corrected fluorescence (subtracted from the background) of the adhering cells by the corrected total fluorescence of the cells added to each corrected microplate (background subtracted) and multiplying by 100%
4.8. Migration and Invasion Assays
The ABCC6–shRNA and controls cells were maintained in serum-free medium for 24 h and then added to the upper chamber of a non-coated 24-well transwell plate (pore size: 8 µm, Sterlitech Corporation, Auburn, WA, USA) for the migration assay. In the cell invasion experiment, the transwells were coated with Matrigel 100 μg/mL (Corning Life Sciences, Shanghai, China). DMEM supplemented with 10% FBS was added to the lower chamber as a chemoattractant. Following incubation for 48 h at 37 °C, the cells were fixed with 4% paraformaldehyde for 10 min at room temperature and stained for 10 min with 0.1% crystal violet. Cotton swabs were used to remove non-invading cells from the upper surface. The cells were photographed under a light microscope. Experiments were conducted in triplicate, and the percentages of migrated and invasive cells are expressed herein as mean ± SEM.
4.9. SDS–Gelatin Gel Zymogram
Samples of freeze-dried serum-free medium (50 µg of proteins) of silenced and control cells were added to non-reducing sample buffer (50 mM Tris–HCl pH 6.8, 10% glycerol, 4% SDS, 0.002% bromophenol blue) and fractionated via electrophoresis using 8% SDS-polyacrylamide gels containing copolymerized gelatin 1 mg/mL. The gels were then washed twice with Triton X-100 2.5% and incubated overnight at 37 °C in buffer 50 mM Tris–HCl pH 6.8, 10 mM CaCl2, and 1% Triton X-100. The gels were stained with 0.25% Coomassie®®®® Brillant Blue R-250 (Sigma) and 0.05% Coomassie®®®® Brillant Blue G-250 (Sigma), and MMP activities were detected as transparent bands on the blue background.
4.10. Colony Formation Assay
The ABCC6–shRNA cells and control cells were seeded in triplicate on a six-well plate with 500 cells/well and cultured at 37 °C and 5% CO2. After two weeks, colonies were then fixed with 4% paraformaldehyde and stained for 30 min with 0.1% crystal violet before being washed with phosphate-buffered saline (PBS). The colonies were counted under a microscope (Nikon Eclipse TS100).
4.11. Statistical Analyses
All of the assays were performed at least three times independently. Statistical analyses were performed using Student’s t-test. Where indicated, data are presented as the means ± SEM, as determined using GraphPad Prism 8 software (GraphPad Software, San Diego, CA, USA). * p < 0.05, ** p < 0.01, and *** p < 0.001 were considered to be statistically significant.
Supplementary Materials
The following supporting information can be downloaded at: https://www.mdpi.com/article/10.3390/ijms242216391/s1.
Author Contributions
Conceptualization, A.O. and F.B.; methodology, A.O. and I.M.; formal analysis, I.M., R.M., G.M., and G.M.V.; investigation, I.M. and V.A.; writing—original draft preparation, A.O. and F.B.; writing—review and editing, A.O., F.B., and M.A.C.M.; visualization, I.M., G.M., and G.M.V.; supervision, A.O.; funding acquisition, F.B. All authors have read and agreed to the published version of the manuscript.
Funding
This research was funded by INBIOMED PROJECT (MIUR, ARS01_01081).
Institutional Review Board Statement
Not applicable.
Informed Consent Statement
Not applicable.
Data Availability Statement
The data presented in this study are available from the corresponding author upon request.
Conflicts of Interest
The authors declare that this research was conducted in the absence of any commercial or financial relationships that could be construed as a potential conflict of interest. The funders had no role in the design of the study; in the collection, analyses, or interpretation of data; in the writing of the manuscript; or in the decision to publish the results.
References
- Borst, P.; Váradi, A.; van de Wetering, K. PXE, a Mysterious Inborn Error Clarified. Trends Biochem. Sci. 2019, 44, 125–140. [Google Scholar] [CrossRef] [PubMed]
- Favre, G.; Laurain, A.; Aranyi, T.; Szeri, F.; Fulop, K.; Le Saux, O.; Duranton, C.; Kauffenstein, G.; Martin, L.; Lefthériotis, G. The ABCC6 Transporter: A New Player in Biomineralization. Int. J. Mol. Sci. 2017, 18, 1941. [Google Scholar] [CrossRef] [PubMed]
- Terry, S.F. The Human Face of ABCC6. FEBS Lett. 2020, 594, 4151–4157. [Google Scholar] [CrossRef] [PubMed]
- Pomozi, V.; Le Saux, O.; Brampton, C.; Apana, A.; Iliás, A.; Szeri, F.; Martin, L.; Monostory, K.; Paku, S.; Sarkadi, B.; et al. ABCC6 Is a Basolateral Plasma Membrane Protein. Circ. Res. 2013, 112, e148–e151. [Google Scholar] [CrossRef]
- Jansen, R.S.; Duijst, S.; Mahakena, S.; Sommer, D.; Szeri, F.; Váradi, A.; Plomp, A.; Bergen, A.A.; Oude Elferink, R.P.J.; Borst, P.; et al. ABCC6-Mediated ATP Secretion by the Liver Is the Main Source of the Mineralization Inhibitor Inorganic Pyrophosphate in the Systemic Circulation—Brief Report. Arterioscler. Thromb. Vasc. Biol. 2014, 34, 1985–1989. [Google Scholar] [CrossRef]
- Jansen, R.S.; Küçükosmanoǧlu, A.; De Haas, M.; Sapthu, S.; Otero, J.A.; Hegman, I.E.M.; Bergen, A.A.B.; Gorgels, T.G.M.F.; Borst, P.; Van De Wetering, K. ABCC6 Prevents Ectopic Mineralization Seen in Pseudoxanthoma Elasticum by Inducing Cellular Nucleotide Release. Proc. Natl. Acad. Sci. USA 2013, 110, 20206–20211. [Google Scholar] [CrossRef]
- Uitto, J.; Li, Q.; van de Wetering, K.; Váradi, A.; Terry, S.F. Insights into Pathomechanisms and Treatment Development in Heritable Ectopic Mineralization Disorders: Summary of the PXE Inte\rnational Biennial Research Symposium—2016. J. Investig. Dermatol. 2017, 137, 790–795. [Google Scholar] [CrossRef]
- Ferrari, D.; Malavasi, F.; Antonioli, L. A Purinergic Trail for Metastases. Trends Pharmacol. Sci. 2017, 38, 277–290. [Google Scholar] [CrossRef]
- Belinsky, M.G.; Chen, Z.-S.; Shchaveleva, I.; Zeng, H.; Kruh, G.D. Characterization of the Drug Resistance and Transport Properties of Multidrug Resistance Protein 6 (MRP6, ABCC6). Cancer Res. 2002, 62, 6172–6177. [Google Scholar]
- Chen, Z.-S.; Tiwari, A.K. Multidrug Resistance Proteins (MRPs/ABCCs) in Cancer Chemotherapy and Genetic Diseases. FEBS J. 2011, 278, 3226–3245. [Google Scholar] [CrossRef]
- Ikeda, R.; Vermeulen, L.C.; Lau, E.; Jiang, Z.; Sachidanandam, K.; Yamada, K.; Kolesar, J.M. Isolation and Characterization of Gemcitabine-Resistant Human Non-Small Cell Lung Cancer A549 Cells. Int. J. Oncol. 2011, 38, 513–519. [Google Scholar] [CrossRef] [PubMed][Green Version]
- Eadie, L.N.; Dang, P.; Goyne, J.M.; Hughes, T.P.; White, D.L. ABCC6 Plays a Significant Role in the Transport of Nilotinib and Dasatinib, and Contributes to TKI Resistance in Vitro, in Both Cell Lines and Primary Patient Mononuclear Cells. PLoS ONE 2018, 13, e0192180. [Google Scholar] [CrossRef] [PubMed]
- Lee, S.H.; Nam, H.J.; Kang, H.J.; Samuels, T.L.; Johnston, N.; Lim, Y.C. Valproic Acid Suppresses the Self-Renewal and Proliferation of Head and Neck Cancer Stem Cells. Oncol. Rep. 2015, 34, 2065–2071. [Google Scholar] [CrossRef] [PubMed][Green Version]
- Trujillo-Paolillo, A.; Tesser-Gamba, F.; Seixas Alves, M.T.; Filho, R.J.G.; Oliveira, R.; Petrilli, A.S.; Toledo, S.R.C. Pharmacogenetics of the Primary and Metastatic Osteosarcoma: Gene Expression Profile Associated with Outcome. Int. J. Mol. Sci. 2023, 24, 5607. [Google Scholar] [CrossRef] [PubMed]
- Mao, X.; He, Z.; Zhou, F.; Huang, Y.; Zhu, G. Prognostic Significance and Molecular Mechanisms of Adenosine Triphosphate-Binding Cassette Subfamily C Members in Gastric Cancer. Medicine 2019, 98, e18347. [Google Scholar] [CrossRef]
- Elsnerova, K.; Mohelnikova-Duchonova, B.; Cerovska, E.; Ehrlichova, M.; Gut, I.; Rob, L.; Skapa, P.; Hruda, M.; Bartakova, A.; Bouda, J.; et al. Gene Expression of Membrane Transporters: Importance for Prognosis and Progression of Ovarian Carcinoma. Oncol. Rep. 2016, 35, 2159–2170. [Google Scholar] [CrossRef]
- Zhang, L.; Huang, P.; Huang, C.; Jiang, L.; Lu, Z.; Wang, P. Varied Clinical Significance of ATP-Binding Cassette C Sub-Family Members for Lung Adenocarcinoma. Medicine 2021, 100, e25246. [Google Scholar] [CrossRef]
- Januchowski, R.; Sterzyńska, K.; Zawierucha, P.; Ruciński, M.; Świerczewska, M.; Partyka, M.; Bednarek-Rajewska, K.; Brazert, M.; Nowicki, M.; Zabel, M.; et al. Microarray-Based Detection and Expression Analysis of New Genes Associated with Drug Resistance in Ovarian Cancer Cell Lines. Oncotarget 2017, 8, 49944–49958. [Google Scholar] [CrossRef]
- Hlavata, I.; Mohelnikova-Duchonova, B.; Vaclavikova, R.; Liska, V.; Pitule, P.; Novak, P.; Bruha, J.; Vycital, O.; Holubec, L.; Treska, V.; et al. The Role of ABC Transporters in Progression and Clinical Outcome of Colorectal Cancer. Mutagenesis 2012, 27, 187–196. [Google Scholar] [CrossRef]
- Mohelnikova-Duchonova, B.; Brynychova, V.; Oliverius, M.; Honsova, E.; Kala, Z.; Muckova, K.; Soucek, P. Differences in Transcript Levels of ABC Transporters between Pancreatic Adenocarcinoma and Nonneoplastic Tissues. Pancreas 2013, 42, 707–716. [Google Scholar] [CrossRef]
- Meng, X.; Dong, S.; Yangyang, L.; Wang, S.; Xu, X.; Liu, T.; Zhuang, X. Adenosine Triphosphate-Binding Cassette Subfamily C Members in Liver Hepatocellular Carcinoma. Medicine 2022, 101, e28869. [Google Scholar] [CrossRef] [PubMed]
- Zhao, Z.; Zhao, Z.; Wang, J.; Zhang, H.; Xi, Z.; Xia, Q. ABCC6 Knockdown Fuels Cell Proliferation by Regulating PPARα in Hepatocellular Carcinoma. Front. Oncol. 2022, 12, 840287. [Google Scholar] [CrossRef] [PubMed]
- Bisaccia, F.; Koshal, P.; Abruzzese, V.; Morelli, M.A.C.; Ostuni, A. Structural and Functional Characterization of the ABCC6 Transporter in Hepatic Cells: Role on PXE, Cancer Therapy and Drug Resistance. Int. J. Mol. Sci. 2021, 22, 2858. [Google Scholar] [CrossRef] [PubMed]
- Martinelli, F.; Cuviello, F.; Pace, M.C.; Armentano, M.F.; Miglionico, R.; Ostuni, A.; Bisaccia, F. Extracellular ATP Regulates CD73 and ABCC6 Expression in HepG2 Cells. Front. Mol. Biosci. 2018, 5, 75. [Google Scholar] [CrossRef] [PubMed]
- Ostuni, A.; Carmosino, M.; Miglionico, R.; Abruzzese, V.; Martinelli, F.; Russo, D.; Laurenzana, I.; Petillo, A.; Bisaccia, F. Inhibition of ABCC6 Transporter Modifies Cytoskeleton and Reduces Motility of HepG2 Cells via Purinergic Pathway. Cells 2020, 9, 1410. [Google Scholar] [CrossRef]
- Abruzzese, V.; Matera, I.; Martinelli, F.; Carmosino, M.; Koshal, P.; Milella, L.; Bisaccia, F.; Ostuni, A. Effect of Quercetin on ABCC6 Transporter: Implication in HepG2 Migration. Int. J. Mol. Sci. 2021, 22, 3871. [Google Scholar] [CrossRef]
- Paskeh, M.D.A.; Ghadyani, F.; Hashemi, M.; Abbaspour, A.; Zabolian, A.; Javanshir, S.; Razzazan, M.; Mirzaei, S.; Entezari, M.; Goharrizi, M.A.S.B.; et al. Biological Impact and Therapeutic Perspective of Targeting PI3K/Akt Signaling in Hepatocellular Carcinoma: Promises and Challenges. Pharmacol. Res. 2023, 187, 106553. [Google Scholar] [CrossRef]
- Abruzzese, V.; Sukowati, C.H.C.; Tiribelli, C.; Matera, I.; Ostuni, A.; Bisaccia, F. The Expression Level of ABCC6 Transporter in Colon Cancer Cells Correlates with the Activation of Different Intracellular Signaling Pathways. Pathophysiology 2022, 29, 173–186. [Google Scholar] [CrossRef]
- Fares, J.; Fares, M.Y.; Khachfe, H.H.; Salhab, H.A.; Fares, Y. Molecular Principles of Metastasis: A Hallmark of Cancer Revisited. Signal Transduct. Target. Ther. 2020, 5, 28. [Google Scholar] [CrossRef]
- Welch, D.R. Dormancy in Cancer Metastasis: Keys to Moving Forward. Cancer Metastasis Rev. 2023, 42, 5–7. [Google Scholar] [CrossRef]
- Janiszewska, M.; Primi, M.C.; Izard, T. Cell Adhesion in Cancer: Beyond the Migration of Single Cells. J. Biol. Chem. 2020, 295, 2495–2505. [Google Scholar] [CrossRef]
- Frankish, A.; Diekhans, M.; Ferreira, A.-M.; Johnson, R.; Jungreis, I.; Loveland, J.; Mudge, J.M.; Sisu, C.; Wright, J.; Armstrong, J.; et al. GENCODE Reference Annotation for the Human and Mouse Genomes. Nucleic Acids Res. 2019, 47, D766–D773. [Google Scholar] [CrossRef] [PubMed]
- Niland, S.; Riscanevo, A.X.; Eble, J.A. Matrix Metalloproteinases Shape the Tumor Microenvironment in Cancer Progression. Int. J. Mol. Sci. 2022, 23, 146. [Google Scholar] [CrossRef] [PubMed]
- Tsai, J.H.; Yang, J. Epithelial–Mesenchymal Plasticity in Carcinoma Metastasis. Genes Dev. 2013, 27, 2192. [Google Scholar] [CrossRef] [PubMed]
- Zhang, Z.; Li, J.; Jiao, S.; Han, G.; Zhu, J.; Liu, T. Functional and Clinical Characteristics of Focal Adhesion Kinases in Cancer Progression. Front. Cell Dev. Biol. 2022, 10, 1040311. [Google Scholar] [CrossRef] [PubMed]
- Geiger, B.; Boujemaa-Paterski, R.; Winograd-Katz, S.E.; Balan Venghateri, J.; Chung, W.L.; Medalia, O. The Actin Network Interfacing Diverse Integrin-Mediated Adhesions. Biomolecules 2023, 13, 294. [Google Scholar] [CrossRef]
- Zhang, P.F.; Li, K.S.; Shen, Y.H.; Gao, P.T.; Dong, Z.R.; Cai, J.B.; Zhang, C.; Huang, X.Y.; Tian, M.X.; Hu, Z.Q.; et al. Galectin-1 Induces Hepatocellular Carcinoma EMT and Sorafenib Resistance by Activating FAK/PI3K/AKT Signaling. Cell Death Dis. 2016, 7, e2201. [Google Scholar] [CrossRef]
- Ren, D.; Zhao, J.; Sun, Y.; Li, D.; Meng, Z.; Wang, B.; Fan, P.; Liu, Z.; Jin, X.; Wu, H. Overexpressed ITGA2 Promotes Malignant Tumor Aggression by Up-Regulating PD-L1 Expression through the Activation of the STAT3 Signaling Pathway. J. Exp. Clin. Cancer Res. 2019, 38, 485. [Google Scholar] [CrossRef]
- Chuang, Y.C.; Wu, H.Y.; Lin, Y.L.; Tzou, S.C.; Chuang, C.H.; Jian, T.Y.; Chen, P.R.; Chang, Y.C.; Lin, C.H.; Huang, T.H.; et al. Blockade of ITGA2 Induces Apoptosis and Inhibits Cell Migration in Gastric Cancer. Biol. Proced. Online 2018, 20, 10. [Google Scholar] [CrossRef]
- Deichmann, S.; Schindel, L.; Braun, R.; Bolm, L.; Taylor, M.; Deshpande, V.; Schilling, O.; Bronsert, P.; Keck, T.; Ferrone, C.; et al. Overexpression of Integrin Alpha 2 (ITGA2) Correlates with Poor Survival in Patients with Pancreatic Ductal Adenocarcinoma. J. Clin. Pathol. 2022, 76, 541–547. [Google Scholar] [CrossRef]
- Jiang, H.; Li, H. Prognostic Values of Tumoral MMP2 and MMP9 Overexpression in Breast Cancer: A Systematic Review and Meta-Analysis. BMC Cancer 2021, 21, 149. [Google Scholar] [CrossRef]
- Kaszak, I.; Witkowska-Piłaszewicz, O.; Niewiadomska, Z.; Dworecka-Kaszak, B.; Toka, F.N.; Jurka, P. Role of Cadherins in Cancer—A Review. Int. J. Mol. Sci. 2020, 21, 7624. [Google Scholar] [CrossRef]
- Yu, W.; Yang, L.; Li, T.; Zhang, Y. Cadherin Signaling in Cancer: Its Functions and Role as a Therapeutic Target. Front. Oncol. 2019, 9, 989. [Google Scholar] [CrossRef]
- Aiello, N.M.; Kang, Y. Context-Dependent EMT Programs in Cancer Metastasis. J. Exp. Med. 2019, 216, 1016. [Google Scholar] [CrossRef]
- Usman, S.; Waseem, N.H.; Nguyen, T.K.N.; Mohsin, S.; Jamal, A.; Teh, M.T.; Waseem, A. Vimentin Is at the Heart of Epithelial Mesenchymal Transition (EMT) Mediated Metastasis. Cancers 2021, 13, 4985. [Google Scholar] [CrossRef] [PubMed]
- Bonnans, C.; Chou, J.; Werb, Z. Remodelling the Extracellular Matrix in Development and Disease. Nat. Rev. Mol. Cell Biol. 2014, 15, 786–801. [Google Scholar] [CrossRef] [PubMed]
- Miglionico, R.; Ostuni, A.; Armentano, M.F.; Milella, L.; Crescenzi, E.; Carmosino, M.; Bisaccia, F. ABCC6 Knockdown in HepG2 Cells Induces a Senescent-like Cell Phenotype. Cell. Mol. Biol. Lett. 2017, 22, 7. [Google Scholar] [CrossRef] [PubMed]
- Qi, Y.; Xu, F.; Chen, L.; Li, Y.; Xu, Z.; Zhang, Y.; Wei, W.; Su, N.; Zhang, T.; Fan, F.; et al. Quantitative Proteomics Reveals FLNC as a Potential Progression Marker for the Development of Hepatocellular Carcinoma. Oncotarget 2016, 7, 68242. [Google Scholar] [CrossRef] [PubMed]
- Kamil, M.; Shinsato, Y.; Higa, N.; Hirano, T.; Idogawa, M.; Takajo, T.; Minami, K.; Shimokawa, M.; Yamamoto, M.; Kawahara, K.; et al. High Filamin-C Expression Predicts Enhanced Invasiveness and Poor Outcome in Glioblastoma Multiforme. Br. J. Cancer 2019, 120, 819–826. [Google Scholar] [CrossRef]
- Klatt, A.R.; Becker, A.K.A.; Neacsu, C.D.; Paulsson, M.; Wagener, R. The Matrilins: Modulators of Extracellular Matrix Assembly. Int. J. Biochem. Cell Biol. 2011, 43, 320–330. [Google Scholar] [CrossRef]
- Szabó, E.; Korpos, É.; Batmunkh, E.; Lotz, G.; Holczbauer, Á.; Kovalszky, I.; Deák, F.; Kiss, I.; Schaff, Z.; Kiss, A. Expression of Matrilin-2 in Liver Cirrhosis and Hepatocellular Carcinoma. Pathol. Oncol. Res. POR 2008, 14, 15–22. [Google Scholar] [CrossRef] [PubMed]
- Wang, P.; Jia, J.; Zhang, D. Purinergic Signalling in Liver Diseases: Pathological Functions and Therapeutic Opportunities. JHEP Rep. 2020, 2, 100165. [Google Scholar] [CrossRef] [PubMed]
- Dimri, M.; Satyanarayana, A. Molecular Signaling Pathways and Therapeutic Targets in Hepatocellular Carcinoma. Cancers 2020, 12, 491. [Google Scholar] [CrossRef] [PubMed]
- Li, L.; Zhao, G.-D.; Shi, Z.; Qi, L.-L.; Zhou, L.-Y.; Fu, Z.-X. The Ras/Raf/MEK/ERK Signaling Pathway and Its Role in the Occurrence and Development of HCC. Oncol. Lett. 2016, 12, 3045–3050. [Google Scholar] [CrossRef]
- Krchniakova, M.; Skoda, J.; Neradil, J.; Chlapek, P.; Veselska, R. Repurposing Tyrosine Kinase Inhibitors to Overcome Multidrug Resistance in Cancer: A Focus on Transporters and Lysosomal Sequestration. Int. J. Mol. Sci. 2020, 21, 3157. [Google Scholar] [CrossRef]
- Granito, A.; Marinelli, S.; Terzi, E.; Piscaglia, F.; Renzulli, M.; Venerandi, L.; Benevento, F.; Bolondi, L. Metronomic capecitabine as second-line treatment in hepatocellular carcinoma after sorafenib failure. Dig. Liver Dis. 2015, 47, 518–522. [Google Scholar] [CrossRef]
- Pelizzaro, F.; Sammarco, A.; Dadduzio, V.; Pastorelli, D.; Giovanis, P.; Soldà, C.; Rizzato, M.D.; Lombardi, G.; Lonardi, S.; Peserico, G.; et al. Capecitabine in advanced hepatocellular carcinoma: A multicenter experience. Dig. Liver Dis. 2019, 51, 1713–1719. [Google Scholar] [CrossRef]
- Simon, A. FastQC: A Quality Control Tool for High Throughput Sequence Data; Babraham Bioinformatics: Babraham, UK, 2010. [Google Scholar]
- Martin, M. Cutadapt Removes Adapter Sequences from High-Throughput Sequencing Reads. EMBnet. J. 2011, 17, 10–12. [Google Scholar] [CrossRef]
- Dobin, A.; Davis, C.A.; Schlesinger, F.; Drenkow, J.; Zaleski, C.; Jha, S.; Batut, P.; Chaisson, M.; Gingeras, T.R. STAR: Ultrafast Universal RNA-Seq Aligner. Bioinformatics 2013, 29, 15–21. [Google Scholar] [CrossRef]
- Liao, Y.; Smyth, G.K.; Shi, W. FeatureCounts: An efficient general purpose program for assigning sequence reads to genomic features. Bioinformatics 2014, 30, 923–930. [Google Scholar] [CrossRef]
- Love, M.I.; Huber, W.; Anders, S. Moderated Estimation of Fold Change and Dispersion for RNA-Seq Data with DESeq2. Genome Biol. 2014, 15, 550. [Google Scholar] [CrossRef]
- Gu, Z.; Eils, R.; Schlesner, M. Complex Heatmaps Reveal Patterns and Correlations in Multidimensional Genomic Data. Bioinformatics 2016, 32, 2847–2849. [Google Scholar] [CrossRef] [PubMed]
- Gu, Z. Complex Heatmap Visualization. iMeta 2022, 1, e43. [Google Scholar] [CrossRef]
- Wickham, H. Ggplot2: Ggplot2. WIREs Comp. Stat. 2011, 3, 180–185. [Google Scholar] [CrossRef]
- Ulgen, E.; Ozisik, O.; Sezerman, O.U. pathfindR: An R Package for Comprehensive Identification of Enriched Pathways in Omics Data Through Active Subnetworks. Front. Genet. 2019, 10, 858. [Google Scholar] [CrossRef] [PubMed]


Disclaimer/Publisher’s Note: The statements, opinions and data contained in all publications are solely those of the individual author(s) and contributor(s) and not of MDPI and/or the editor(s). MDPI and/or the editor(s) disclaim responsibility for any injury to people or property resulting from any ideas, methods, instructions or products referred to in the content. |
© 2023 by the authors. Licensee MDPI, Basel, Switzerland. This article is an open access article distributed under the terms and conditions of the Creative Commons Attribution (CC BY) license (https://creativecommons.org/licenses/by/4.0/).