
Drosophila melanogaster Transcriptome Response to Different Wolbachia Strains

 , ,
, ,
Abstract
:1. Introduction
2. Results
2.1. Mapping and Quantification
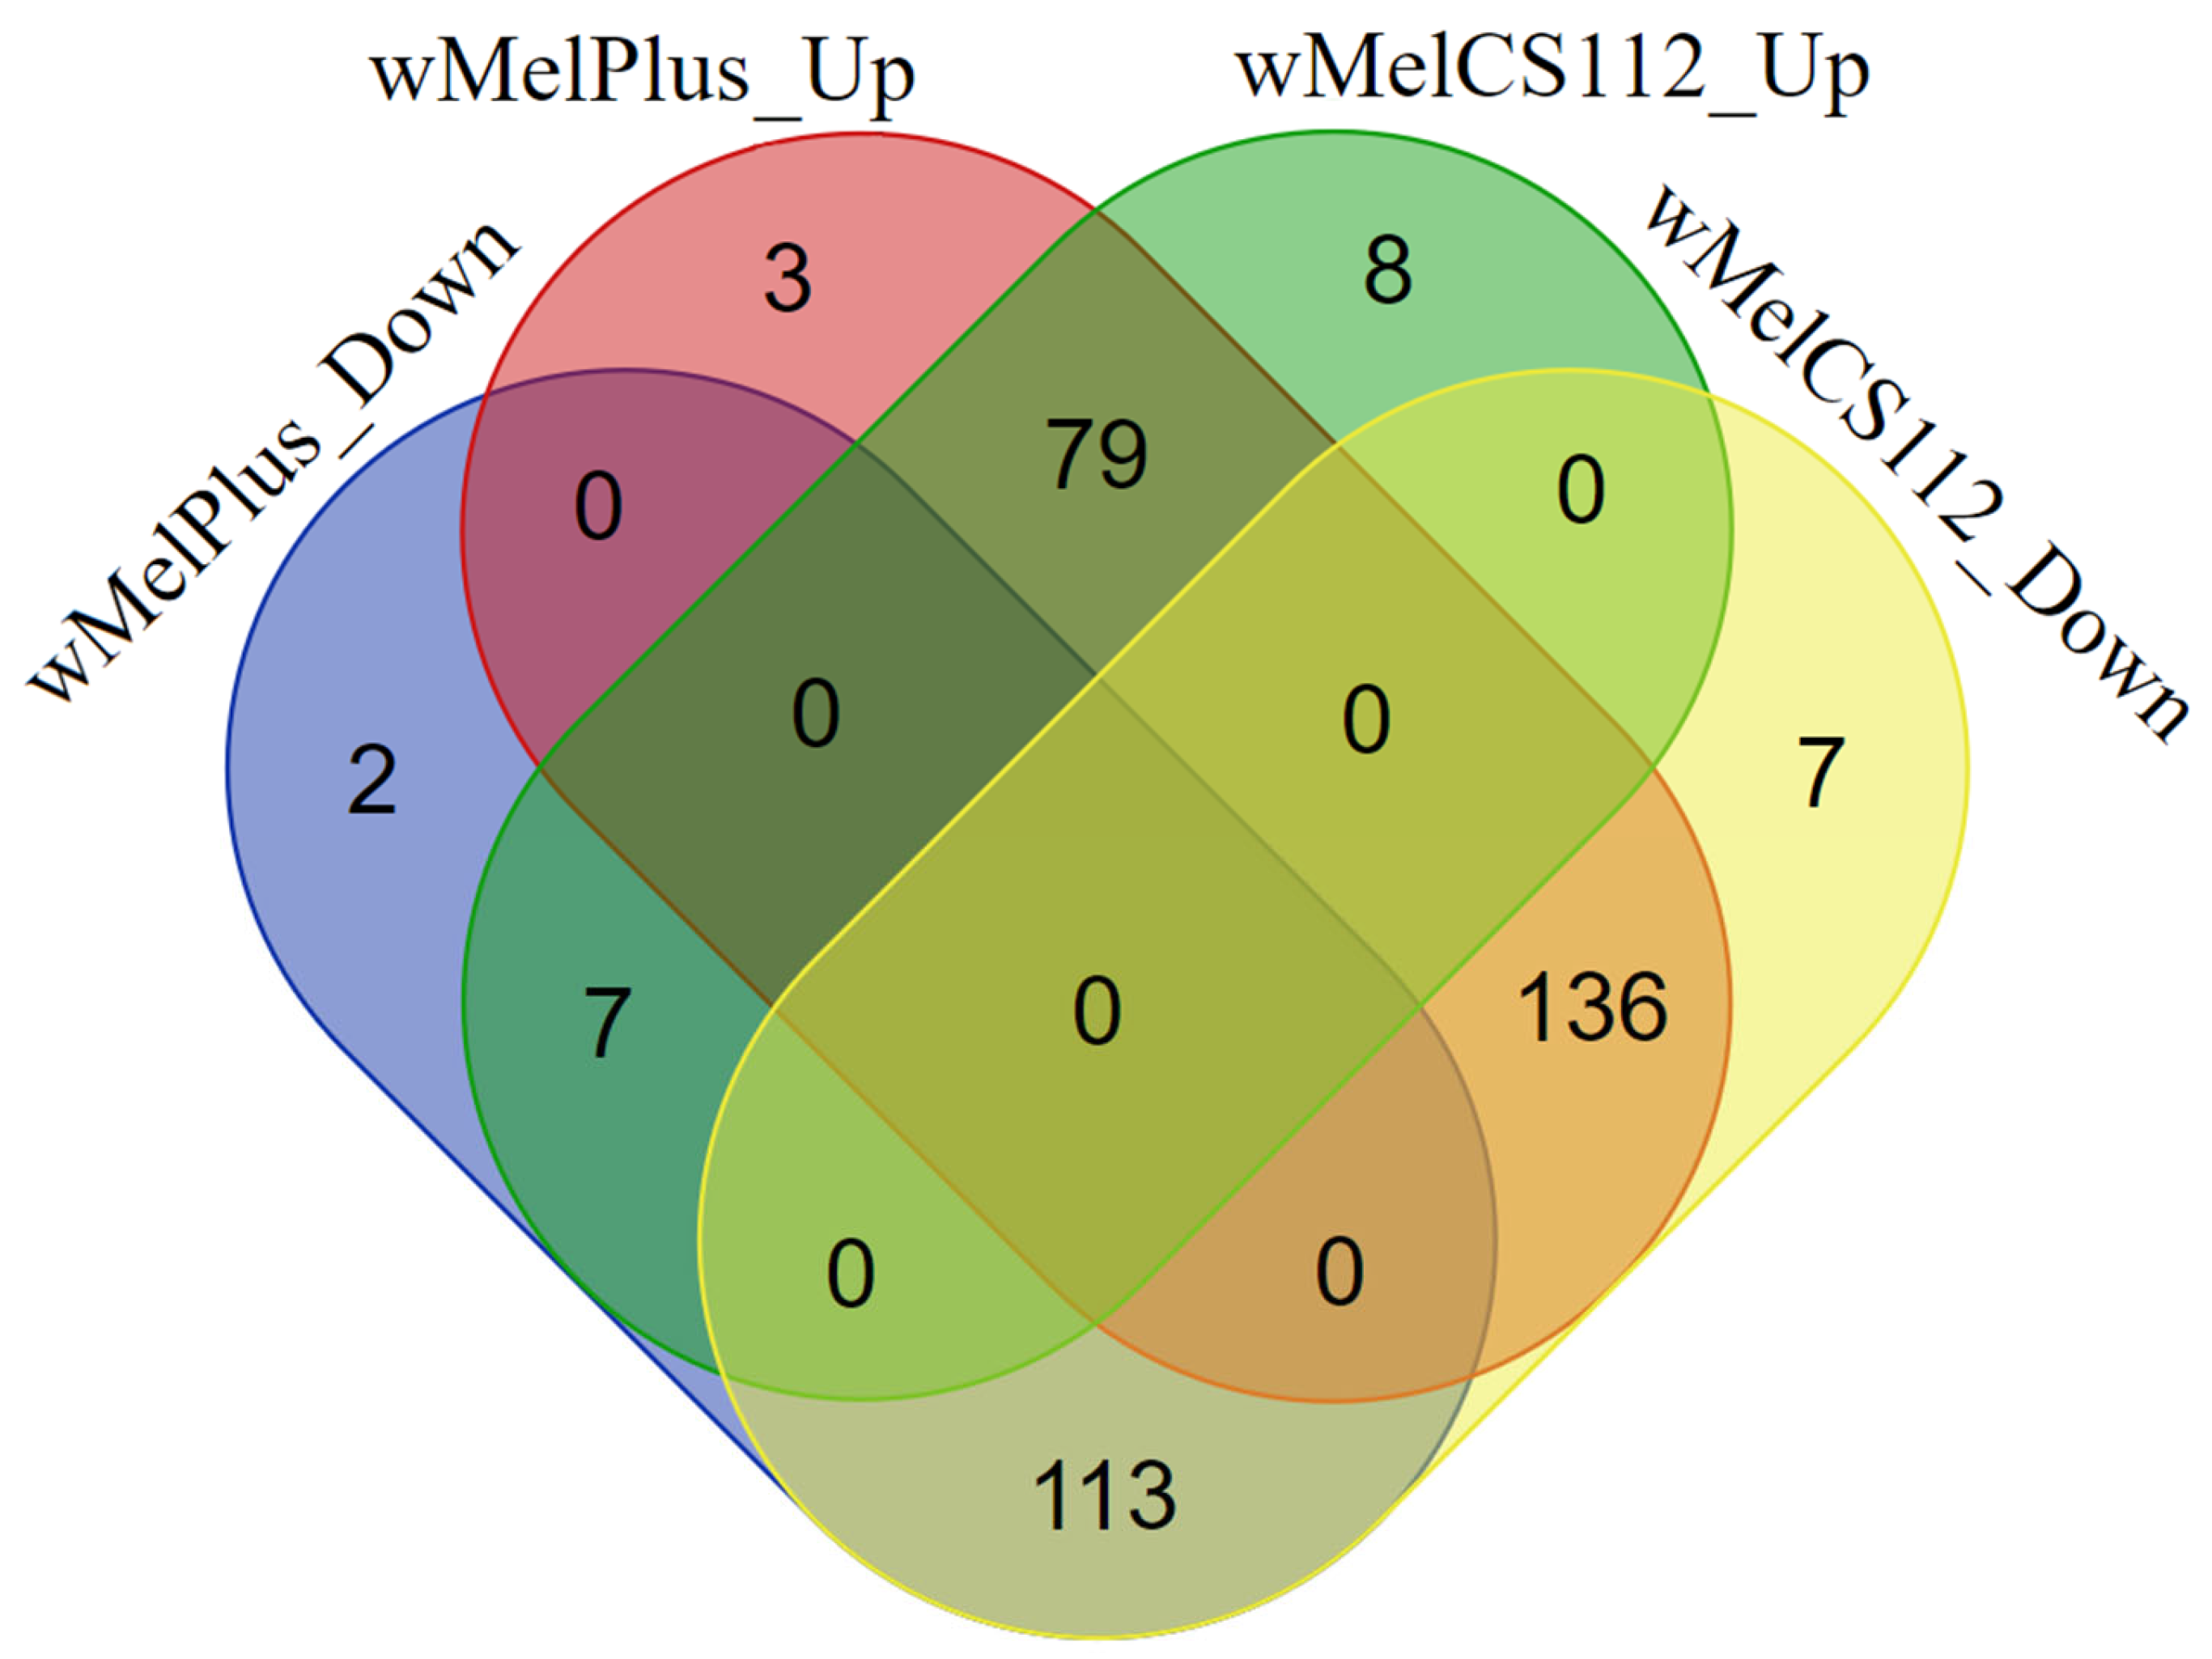
2.2. Analysis of Differentially Expressed Genes
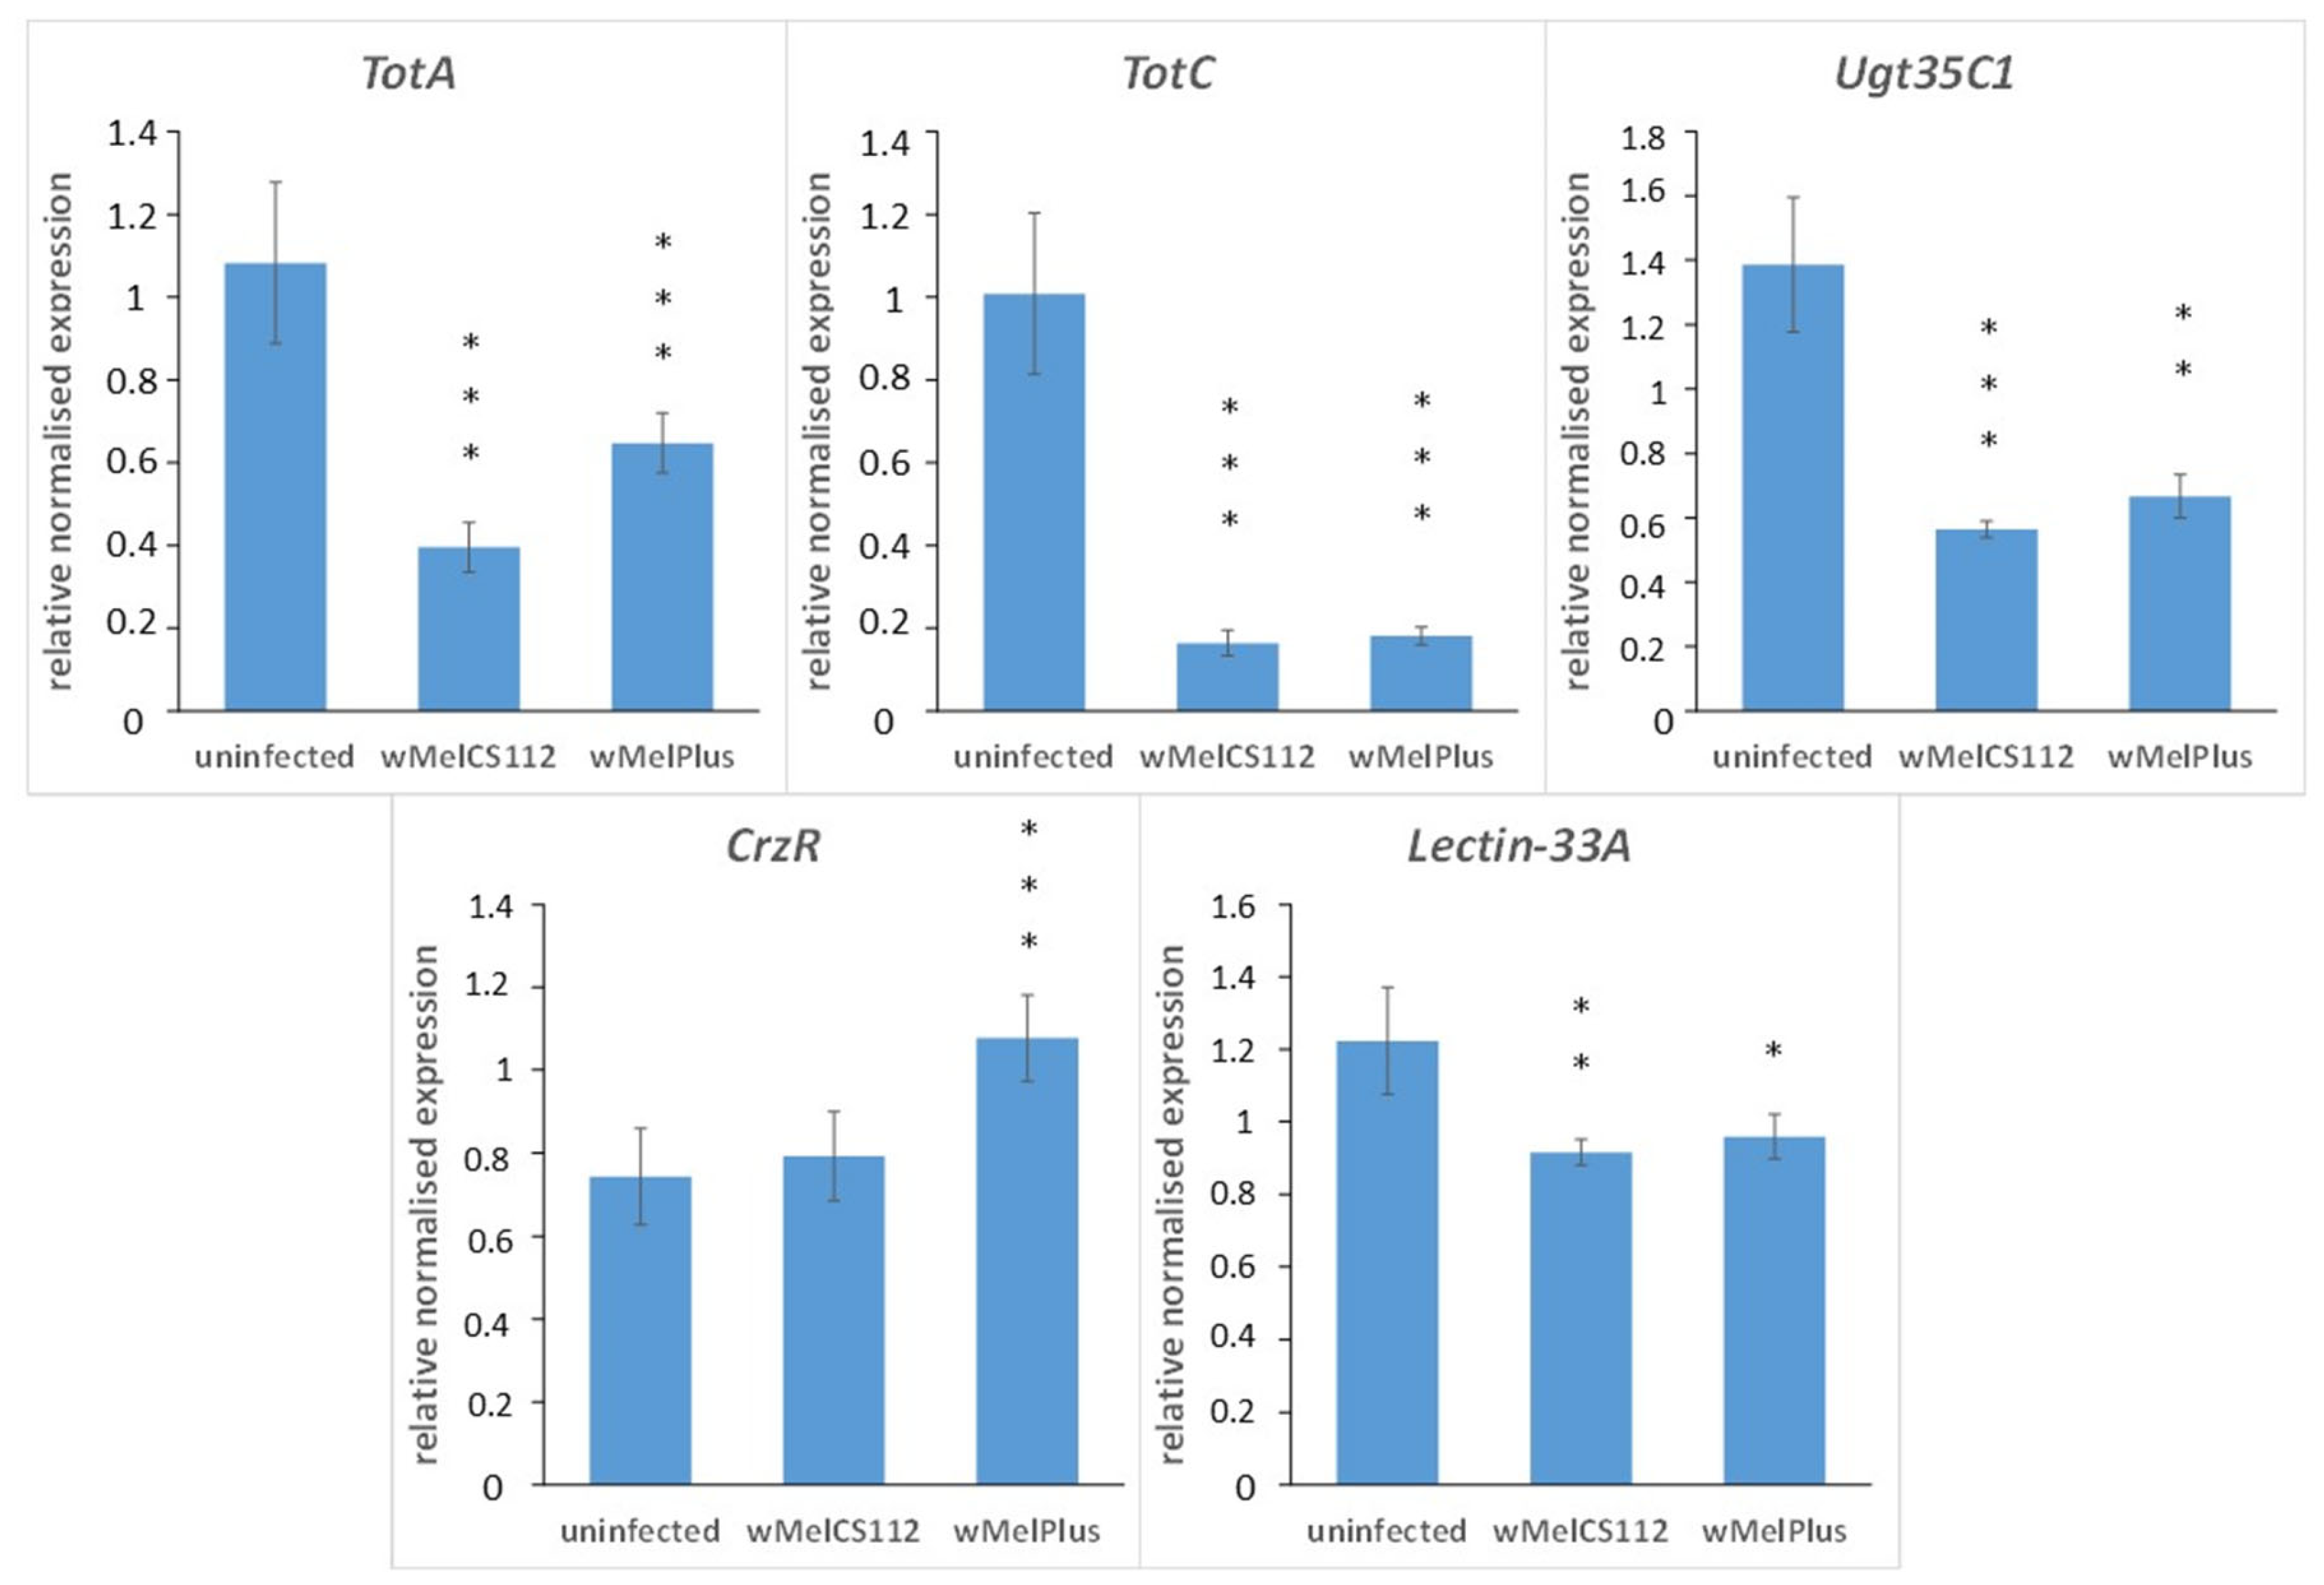
2.3. qRT-PCR Analysis of Five Differentially Expressed Genes
3. Discussion

4. Materials and Methods
4.1. Drosophila Lines and Rearing
4.2. RNA Isolation, cDNA Library Construction and RNA Sequencing
4.3. Transcriptome Assembly and Quantification
4.4. Gene Annotation and Analysis of Differential Expression
4.5. Quantitative Real-Time Polymerase Chain Reaction
4.6. Statistical Analysis
5. Conclusions
Supplementary Materials
Author Contributions
Funding
Institutional Review Board Statement
Informed Consent Statement
Data Availability Statement
Acknowledgments
Conflicts of Interest
References
- Hilgenboecker, K.; Hammerstein, P.; Schlattmann, P.; Telschow, A.; Werren, J.H. How many species are infected with Wolbachia?—A statistical analysis of current data. FEMS Microbiol. Lett. 2008, 281, 215–220. [Google Scholar] [CrossRef] [PubMed]
- Zug, R.; Hammerstein, P. Still a host of hosts for Wolbachia: Analysis of recent data suggests that 40% of terrestrial arthropod species are infected. PLoS ONE 2012, 7, e38544. [Google Scholar] [CrossRef] [PubMed]
- Min, K.T.; Benzer, S. Wolbachia, normally a symbiont of Drosophila, can be virulent, causing degeneration and early death. Proc. Natl. Acad. Sci. USA 1997, 94, 10792–10796. [Google Scholar] [CrossRef]
- Graham, R.I.; Grzywacz, D.; Mushobozi, W.L.; Wilson, K. Wolbachia in a major African crop pest increases susceptibility toviral disease rather than protects. Ecol. Lett. 2012, 15, 993–1000. [Google Scholar] [CrossRef] [PubMed]
- Strunov, A.A.; Ilinskii, Y.Y.; Zakharov, I.K.; Kiseleva, E.V. Effect of high temperature on survival of Drosophila melanogaster infected with pathogenic strain of Wolbachia bacteria. Russ. J. Genet. Appl. Res. 2013, 3, 435–443. [Google Scholar] [CrossRef]
- Martinez, J.; Ok, S.; Smith, S.; Snoeck, K.; Day, J.P.; Jiggins, F.M. Should symbionts be nice or selfish? Antiviral effects of Wolbachia are costly but reproductive parasitism is not. PLoS Pathog. 2015, 11, e1005021. [Google Scholar] [CrossRef]
- Werren, J.H.; Baldo, L.; Clark, M.E. Wolbachia: Master manipulators of invertebrate biology. Nat. Rev. Microbiol. 2008, 6, 741–751. [Google Scholar] [CrossRef]
- Burdina, E.V.; Gruntenko, N.E. Physiological Aspects of Wolbachia pipientis–Drosophila melanogaster Relationship. J. Evol. Biochem. Phys. 2022, 58, 303–317. [Google Scholar] [CrossRef]
- Riegler, M.; Sidhu, M.; Miller, W.J.; O’Neill, S.L. Evidence for a global Wolbachia replacement in Drosophila melanogaster. Curr. Biol. 2005, 15, 1428–1433. [Google Scholar] [CrossRef]
- Martinez, J.; Tolosana, I.; Ok, S.; Smith, S.; Snoeck, K.; Day, J.P.; Jiggins, F.M. Symbiont strain is the main determinant of variation in Wolbachia-mediated protection against viruses across Drosophila species. Mol. Ecol. 2017, 26, 4072–4084. [Google Scholar] [CrossRef]
- Gruntenko, N.E.; Ilinsky, Y.Y.; Adonyeva, N.V.; Burdina, E.V.; Bykov, R.A.; Menshanov, P.N.; Rauschenbach, I.Y. Various Wolbachia genotypes differently influence host Drosophila dopamine metabolism and survival under heat stress conditions. BMC Evol. Biol. 2017, 17 (Suppl. S2), 252. [Google Scholar] [CrossRef] [PubMed]
- Gruntenko, N.E.; Karpova, E.K.; Adonyeva, N.V.; Andreenkova, O.V.; Burdina, E.V.; Ilinsky, Y.Y.; Bykov, R.A.; Menshanov, P.N.; Rauschenbach, I.Y. Drosophila female fertility and juvenile hormone metabolism depends on the type of Wolbachia infection. J. Exp. Biol. 2019, 222, jeb195347. [Google Scholar] [CrossRef]
- Fry, A.J.; Rand, D.M. Wolbachia interactions that determine Drosophila melanogaster survival. Evolution 2002, 56, 1976–1981. [Google Scholar]
- Dean, M.D. A Wolbachia-associated fitness benefit depends on genetic background in Drosophila simulans. Proc. R. Soc. B Biol. Sci. 2006, 273, 1415–1420. [Google Scholar] [CrossRef] [PubMed]
- Burdina, E.V.; Bykov, R.A.; Menshanov, P.N.; Ilinsky, Y.Y.; Gruntenko, N.E. Unique Wolbachia strain wMelPlus increases heat stress resistance in Drosophila melanogaster. Arch. Insect Biochem. Physiol. 2021, 106, e21776. [Google Scholar] [CrossRef] [PubMed]
- Karpova, E.K.; Bobrovskikh, M.A.; Deryuzhenko, M.A.; Shishkina, O.D.; Gruntenko, N.E. Wolbachia Effect on Drosophila melanogaster Lipid and Carbohydrate Metabolism. Insects 2023, 14, 357. [Google Scholar] [CrossRef]
- Korenskaia, A.E.; Shishkina, O.D.; Klimenko, A.I.; Andreenkova, O.V.; Bobrovskikh, M.A.; Shatskaya, N.V.; Vasiliev, G.V.; Gruntenko, N.E. New Wolbachia pipientis Genotype Increasing Heat Stress Resistance of Drosophila melanogaster Host Is Characterized by a Large Chromosomal Inversion. Int. J. Mol. Sci. 2022, 23, 16212. [Google Scholar] [CrossRef]
- Cui, L.; Neoh, H.M.; Iwamoto, A.; Hiramatsu, K. Coordinated phenotype switching with large-scale chromosome flip-flop inversion observed in bacteria. Proc. Natl. Acad. Sci. USA 2012, 109, e1647-56. [Google Scholar] [CrossRef]
- Chrostek, E.; Teixeira, L. Mutualism Breakdown by Amplification of Wolbachia Genes. PLoS Biol. 2015, 13, e1002065. [Google Scholar] [CrossRef]
- Duarte, E.H.; Carvalho, A.; López-Madrigal, S.; Costa, J.; Teixeira, L. Forward genetics in Wolbachia: Regulation of Wolbachia proliferation by the amplification and deletion of an addictive genomic island. PLoS Genet. 2021, 17, e1009612. [Google Scholar] [CrossRef]
- Lindsey, A.R.I. Sensing, signaling, and secretion: A review and analysis of systems for regulating host interaction in Wolbachia. Genes 2020, 11, 813. [Google Scholar] [CrossRef] [PubMed]
- Mayoral, J.G.; Hussain, M.; Joubert, D.A.; Iturbe-Ormaetxe, I.; O’Neill, S.L.; Asgari, S. Wolbachia small noncoding RNAs and their role in cross-kingdom communications. Proc. Natl. Acad. Sci. USA 2014, 111, 18721–18726. [Google Scholar] [CrossRef] [PubMed]
- Ferree, P.M.; Frydman, H.M.; Li, J.M.; Cao, J.; Wieschaus, E.; Sullivan, W. Wolbachia Utilizes Host Microtubules and Dynein for Anterior Localization in the Drosophila Oocyte. PLoS Pathog. 2005, 1, e14. [Google Scholar] [CrossRef]
- Mateos, M.; Silva, N.O.; Ramirez, P.; Higareda-Alvear, V.M.; Aramayo, R.; Erickson, J.W. Effect of heritable symbionts on maternally-derived embryo transcripts. Sci. Rep. 2019, 9, 8847. [Google Scholar] [CrossRef] [PubMed]
- Frantz, S.I.; Small, C.M.; Cresko, W.A.; Singh, N.D. Ovarian transcriptional response to Wolbachia infection in D. melanogaster in the context of between-genotype variation in gene expression. G3 Genes Genomes Genet. 2023, 3, jkad047. [Google Scholar] [CrossRef] [PubMed]
- Goh, W.W.B.; Wang, W.; Wong, L. Why batch effects matter in omics data, and how to avoid them. Trends Biotechnol. 2017, 35, 498–507. [Google Scholar] [CrossRef]
- Liao, Y.; Smyth, G.K.; Shi, W. featureCounts: An efficient general purpose program for assigning sequence reads to genomic features. Bioinformatics 2014, 30, 923–930. [Google Scholar] [CrossRef]
- Lindsey, A.R.I.; Bhattacharya, T.; Hardy, R.W.; Newton, I.L.G. Wolbachia and Virus Alter the Host Transcriptome at the Interface of Nucleotide Metabolism Pathways. mBio 2021, 12, e03472-20. [Google Scholar] [CrossRef]
- Detcharoen, M.; Schilling, M.P.; Arthofer, W.; Schlick-Steiner, B.C.; Steiner, F.M. Differential gene expression in Drosophila melanogaster and D. nigrosparsa infected with the same Wolbachia strain. Sci. Rep. 2021, 11, 11336. [Google Scholar] [CrossRef] [PubMed]
- He, Z.; Zheng, Y.; Yu, W.J.; Fang, Y.; Mao, B.; Wang, Y.F. How do Wolbachia modify the Drosophila ovary? New evidences support the "titration-restitution" model for the mechanisms of Wolbachia-induced CI. BMC Genom. 2019, 20, 608. [Google Scholar] [CrossRef]
- Nunes, M.D.; Nolte, V.; Schlotterer, C. Nonrandom Wolbachia infection status of Drosophila melanogaster strains with different mtDNA haplotypes. Mol. Biol. Evol. 2008, 25, 2493–2498. [Google Scholar] [CrossRef] [PubMed]
- Ilinsky, Y.Y. Coevolution of Drosophila melanogaster mtDNA and Wolbachia genotypes. PLoS ONE 2013, 8, e54373. [Google Scholar] [CrossRef]
- Bykov, R.A.; Yudina, M.A.; Gruntenko, N.E.; Zakharov, I.K.; Voloshina, M.A.; Melashchenko, E.S.; Danilova, M.V.; Mazunin, I.O.; Ilinsky, Y.Y. Prevalence and genetic diversity of Wolbachia endosymbiont and mtDNA in Palearctic populations of Drosophila melanogaster. BMC Evol. Biol. 2019, 19 (Suppl. S1), 48. [Google Scholar] [CrossRef] [PubMed]
- Reynolds, K.T.; Thomson, L.J.; Hoffmann, A.A. The effects of host age, hostnuclear background and temperature on phenotypic effects of the virulentWolbachia strain popcorn in Drosophila melanogaster. Genetics 2003, 164, 1027–1034. [Google Scholar] [CrossRef] [PubMed]
- Woolfit, M.; Iturbe-Ormaetxe, I.; Brownlie, J.C.; Walker, T.; Riegler, M.; Seleznev, A.; Popovici, J.; Rancès, E.; Wee, B.A.; Pavlides, J.; et al. Genomic evolution of the pathogenic Wolbachia strain, wMelPop. Genome Biol. Evol. 2013, 5, 2189–2204. [Google Scholar] [CrossRef]
- Dou, W.; Miao, Y.; Xiao, J.; Huang, D. Association of Wolbachia with Gene Expression in Drosophila Testes. Microb. Ecol. 2021, 82, 805–817. [Google Scholar] [CrossRef]
- Zhang, H.B.; Cao, Z.; Qiao, J.X.; Zhong, Z.Q.; Pan, C.C.; Liu, C.; Zhang, L.M.; Wang, Y.F. Metabolomics provide new insights into mechanisms of Wolbachia-induced paternal defects in Drosophila melanogaster. PLoS Pathog. 2021, 17, e1009859. [Google Scholar] [CrossRef]
- Roy, S.; Saha, T.T.; Zou, Z.; Raikhel, A.S. Regulatory Pathways Controlling Female Insect Reproduction. Annu. Rev. Entomol. 2018, 63, 489–511. [Google Scholar] [CrossRef]
- Melnikow, E.; Xu, S.; Liu, J.; Bell, A.J.; Ghedin, E.; Unnasch, T.R.; Lustigman, S. A potential role for the interaction of Wolbachia surface proteins with the Brugia malayi glycolytic enzymes and cytoskeleton in maintenance of endosymbiosis. PLoS Negl. Trop. Dis. 2013, 7, e2151. [Google Scholar] [CrossRef]
- Ponton, F.; Wilson, K.; Holmes, A.; Raubenheimer, D.; Robinson, K.L.; Simpson, S.J. Macronutrients mediate the functional relationship between Drosophila and Wolbachia. Proc. Biol. Sci. 2015, 282, 20142029. [Google Scholar] [CrossRef]
- Kryukova, N.A.; Kryukov, V.Y.; Polenogova, O.V.; Chertkova, E.A.; Tyurin, M.V.; Rotskaya, U.N.; Alikina, T.; Kabilov, M.R.; Glupov, V.V. The endosymbiotic bacterium Wolbachia (Rickettsiales) alters larval metabolism of the parasitoid Habrobracon hebetor (Hymenoptera: Braconidae). Arch. Insect Biochem. Physiol. 2023, 114, e22053. [Google Scholar] [CrossRef] [PubMed]
- Gruntenko, N.E.; Karpova, E.K.; Babenko, V.N.; Vasiliev, G.V.; Andreenkova, O.V.; Bobrovskikh, M.A.; Menshanov, P.N.; Babenko, R.O.; Rauschenbach, I.Y. Fitness Analysis and Transcriptome Profiling Following Repeated Mild Heat Stress of Varying Frequency in Drosophila melanogaster Females. Biology 2021, 10, 1323. [Google Scholar] [CrossRef] [PubMed]
- Amstrup, A.B.; Bæk, I.; Loeschcke, V.; Givskov Sørensen, J. A functional study of the role of Turandot genes in Drosophila melanogaster: An emerging candidate mechanism for inducible heat tolerance. J. Insect Physiol. 2022, 143, 104456. [Google Scholar] [CrossRef] [PubMed]
- Clemmons, A.W.; Lindsay, S.A.; Wasserman, S.A. An effector Peptide family required for Drosophila toll-mediated immunity. PLoS Pathog. 2015, 11, e1004876. [Google Scholar] [CrossRef]
- Lindsay, S.A.; Lin, S.J.H.; Wasserman, S.A. Short-Form Bomanins Mediate Humoral Immunity in Drosophila. J. Innate Immun. 2018, 10, 306–314. [Google Scholar] [CrossRef] [PubMed]
- Veenstra, J.A. Does corazonin signal nutritional stress in insects? Insect Biochem. Mol. Biol. 2009, 39, 755–762. [Google Scholar] [CrossRef] [PubMed]
- Zandawala, M.; Nguyen, T.; Balanyà Segura, M.; Johard, H.A.D.; Amcoff, M.; Wegener, C.; Paluzzi, J.P.; Nässel, D.R. A neuroendocrine pathway modulating osmotic stress in Drosophila. PLoS Genet. 2021, 17, e1009425. [Google Scholar] [CrossRef]
- Kubrak, O.I.; Lushchak, O.V.; Zandawala, M.; Nässel, D.R. Systemic corazonin signalling modulates stress responses and metabolism in Drosophila. Open Biol. 2016, 6, 160152. [Google Scholar] [CrossRef]
- Lin, H.H.; Kuang, M.C.; Hossain, I.; Xuan, Y.; Beebe, L.; Shepherd, A.K.; Rolandi, M.; Wang, J.W. A nutrient-specific gut hormone arbitrates between courtship and feeding. Nature 2022, 602, 632–638. [Google Scholar] [CrossRef]
- Yang, M.Y.; Wang, Z.; MacPherson, M.; Dow, J.A.; Kaiser, K. A novel Drosophila alkaline phosphatase specific to the ellipsoid body of the adult brain and the lower Malpighian (renal) tubule. Genetics 2000, 154, 285–297. [Google Scholar] [CrossRef]
- Aradska, J.; Bulat, T.; Sialana, F.J.; Birner-Gruenberger, R.; Erich, B.; Lubec, G. Gel-free mass spectrometry analysis of Drosophila melanogaster heads. Proteomics 2015, 15, 3356–3360. [Google Scholar] [CrossRef] [PubMed]
- Gruntenko, N.E.; Rauschenbach, I.Y. Interplay of JH, 20E and biogenic amines under normal and stress conditions and its effects on reproduction. J. Insect Physiol. 2008, 54, 902–908. [Google Scholar] [CrossRef] [PubMed]
- Hanna, M.E.; Bednářová, A.; Rakshit, K.; Chaudhuri, A.; O’Donnell, J.M.; Krishnan, N. Perturbations in dopamine synthesis lead to discrete physiological effects and impact oxidative stress response in drosophila. J. Insect Physiol. 2015, 73, 11–19. [Google Scholar] [CrossRef] [PubMed]
- Gruntenko, N.E.; Karpova, E.K.; Alekseev, A.A.; Chentsova, N.A.; Saprykina, Z.V.; Bownes, M.; Rauschenbach, I.Y. Effects of dopamine on juvenile hormone metabolism and fitness in Drosophila virilis. J. Insect Physiol. 2005, 51, 959–968. [Google Scholar] [CrossRef] [PubMed]
- Khan, S.J.; Abidi, S.N.F.; Skinner, A.; Tian, Y.; Smith-Bolton, R.K. The Drosophila Duox maturation factor is a key component of a positive feedback loop that sustains regeneration signaling. PLoS Genet. 2017, 13, e1006937. [Google Scholar] [CrossRef] [PubMed]
- Babraham Bioinformatics FastQC. Available online: https://www.bioinformatics.babraham.ac.uk/projects/fastqc/ (accessed on 30 October 2023).
- Anthony, M.B.; Lohse, M.; Usadel, B. Trimmomatic: A flexible trimmer for Illumina sequence data. Bioinformatics 2014, 30, 2114–2120. [Google Scholar]
- Kim, D.; Langmead, B.; Salzberg, S. HISAT: A fast spliced aligner with low memory requirements. Nat. Methods 2015, 12, 357–360. [Google Scholar] [CrossRef]
- Li, H.; Handsaker, B.; Wysoker, A.; Fennell, T.; Ruan, J.; Homer, N.; Marth, G.; Abecasis, G.; Durbin, R. The Sequence Alignment/Map format and SAMtools. Bioinformatics 2009, 25, 2078–2079. [Google Scholar] [CrossRef]
- Bray, N.L.; Pimentel, H.; Melsted, P.; Pachter, L. Near-optimal probabilistic RNA-seq quantification. Nat. Biotechnol. 2016, 34, 525–527. [Google Scholar] [CrossRef]
- Ge, S.H.; Jung, D.; Yao, R. ShinyGO: A graphical gene-set enrichment tool for animals and plants. Bioinformatics 2020, 36, 2628–2629. [Google Scholar] [CrossRef]
- Thurmond, J.; Goodman, J.L.; Strelets, V.B.; Attrill, H.; Gramates, L.S.; Marygold, S.J.; Matthews, B.B.; Millburn, G.; Antonazzo, G.; Trovisco, V.; et al. FlyBase 2.0: The next generation. Nucleic Acids Res. 2019, 47, D759–D765. [Google Scholar] [CrossRef]
- Robinson, M.D.; McCarthy, D.J.; Smyth, G.K. edgeR: A Bioconductor package for differential expression analysis of digital gene expression data. Bioinformatics 2010, 26, 139–140. [Google Scholar] [CrossRef] [PubMed]
- Schmittgen, T.D.; Livak, K.J. Analyzing real-time PCR data by the comparative C(T) method. Nat. Protoc. 2008, 3, 1101–1108. [Google Scholar] [CrossRef] [PubMed]
- Ponton, F.; Chapuis, M.P.; Pernice, M.; Sword, G.A.; Simpson, S.J. Evaluation of potential reference genes for reverse transcription-qPCR studies of physiological responses in Drosophila melanogaster. J. Insect Physiol. 2011, 57, 840–850. [Google Scholar] [CrossRef] [PubMed]
- Hammer, Ø.; Harper, D.A.T. Past: Paleontological statistics software package for educaton and data anlysis. Palaeontol. Electron. 2001, 4, 1–9. [Google Scholar]
- Kendall, M.G.; Stuart, A. The Advanced Theory of Statistics: Inference and Relationship, 2nd ed.; Hafner Publishing Company: New York, NY, USA, 1961; Volume 2, 312p. [Google Scholar]
- Narkevich, A.N.; Vinogradov, K.A.; Grjibovski, A.M. Multiple Comparisons in Biomedical Research: The Problem and its Solutions. Ekol. Cheloveka 2020, 10, 55–64. [Google Scholar] [CrossRef]


| Sample | All Reads (Forward + Reverse) | Assigned | Unassigned |
|---|---|---|---|
| Uninfected_1 | 29,820,844 | 19,513,634 | 10,307,210 |
| Uninfected_2 | 19,028,518 | 15,259,347 | 3,769,171 |
| Uninfected_3 | 15,927,166 | 13,118,210 | 2,808,956 |
| Uninfected_4 | 23,642,114 | 18,570,393 | 5,071,721 |
| wMelPlus_1 | 17,379,117 | 14,243,016 | 3,136,101 |
| wMelPlus_2 | 15,325,069 | 12,796,552 | 2,528,517 |
| wMelPlus_3 | 24,559,750 | 18,973,636 | 5,586,114 |
| wMelCS112_1 | 22,813,214 | 16,048,571 | 6,764,643 |
| wMelCS112_2 | 18,300,298 | 15,087,798 | 3,212,500 |
| wMelCS112_3 | 22,668,148 | 19,149,909 | 3,518,239 |
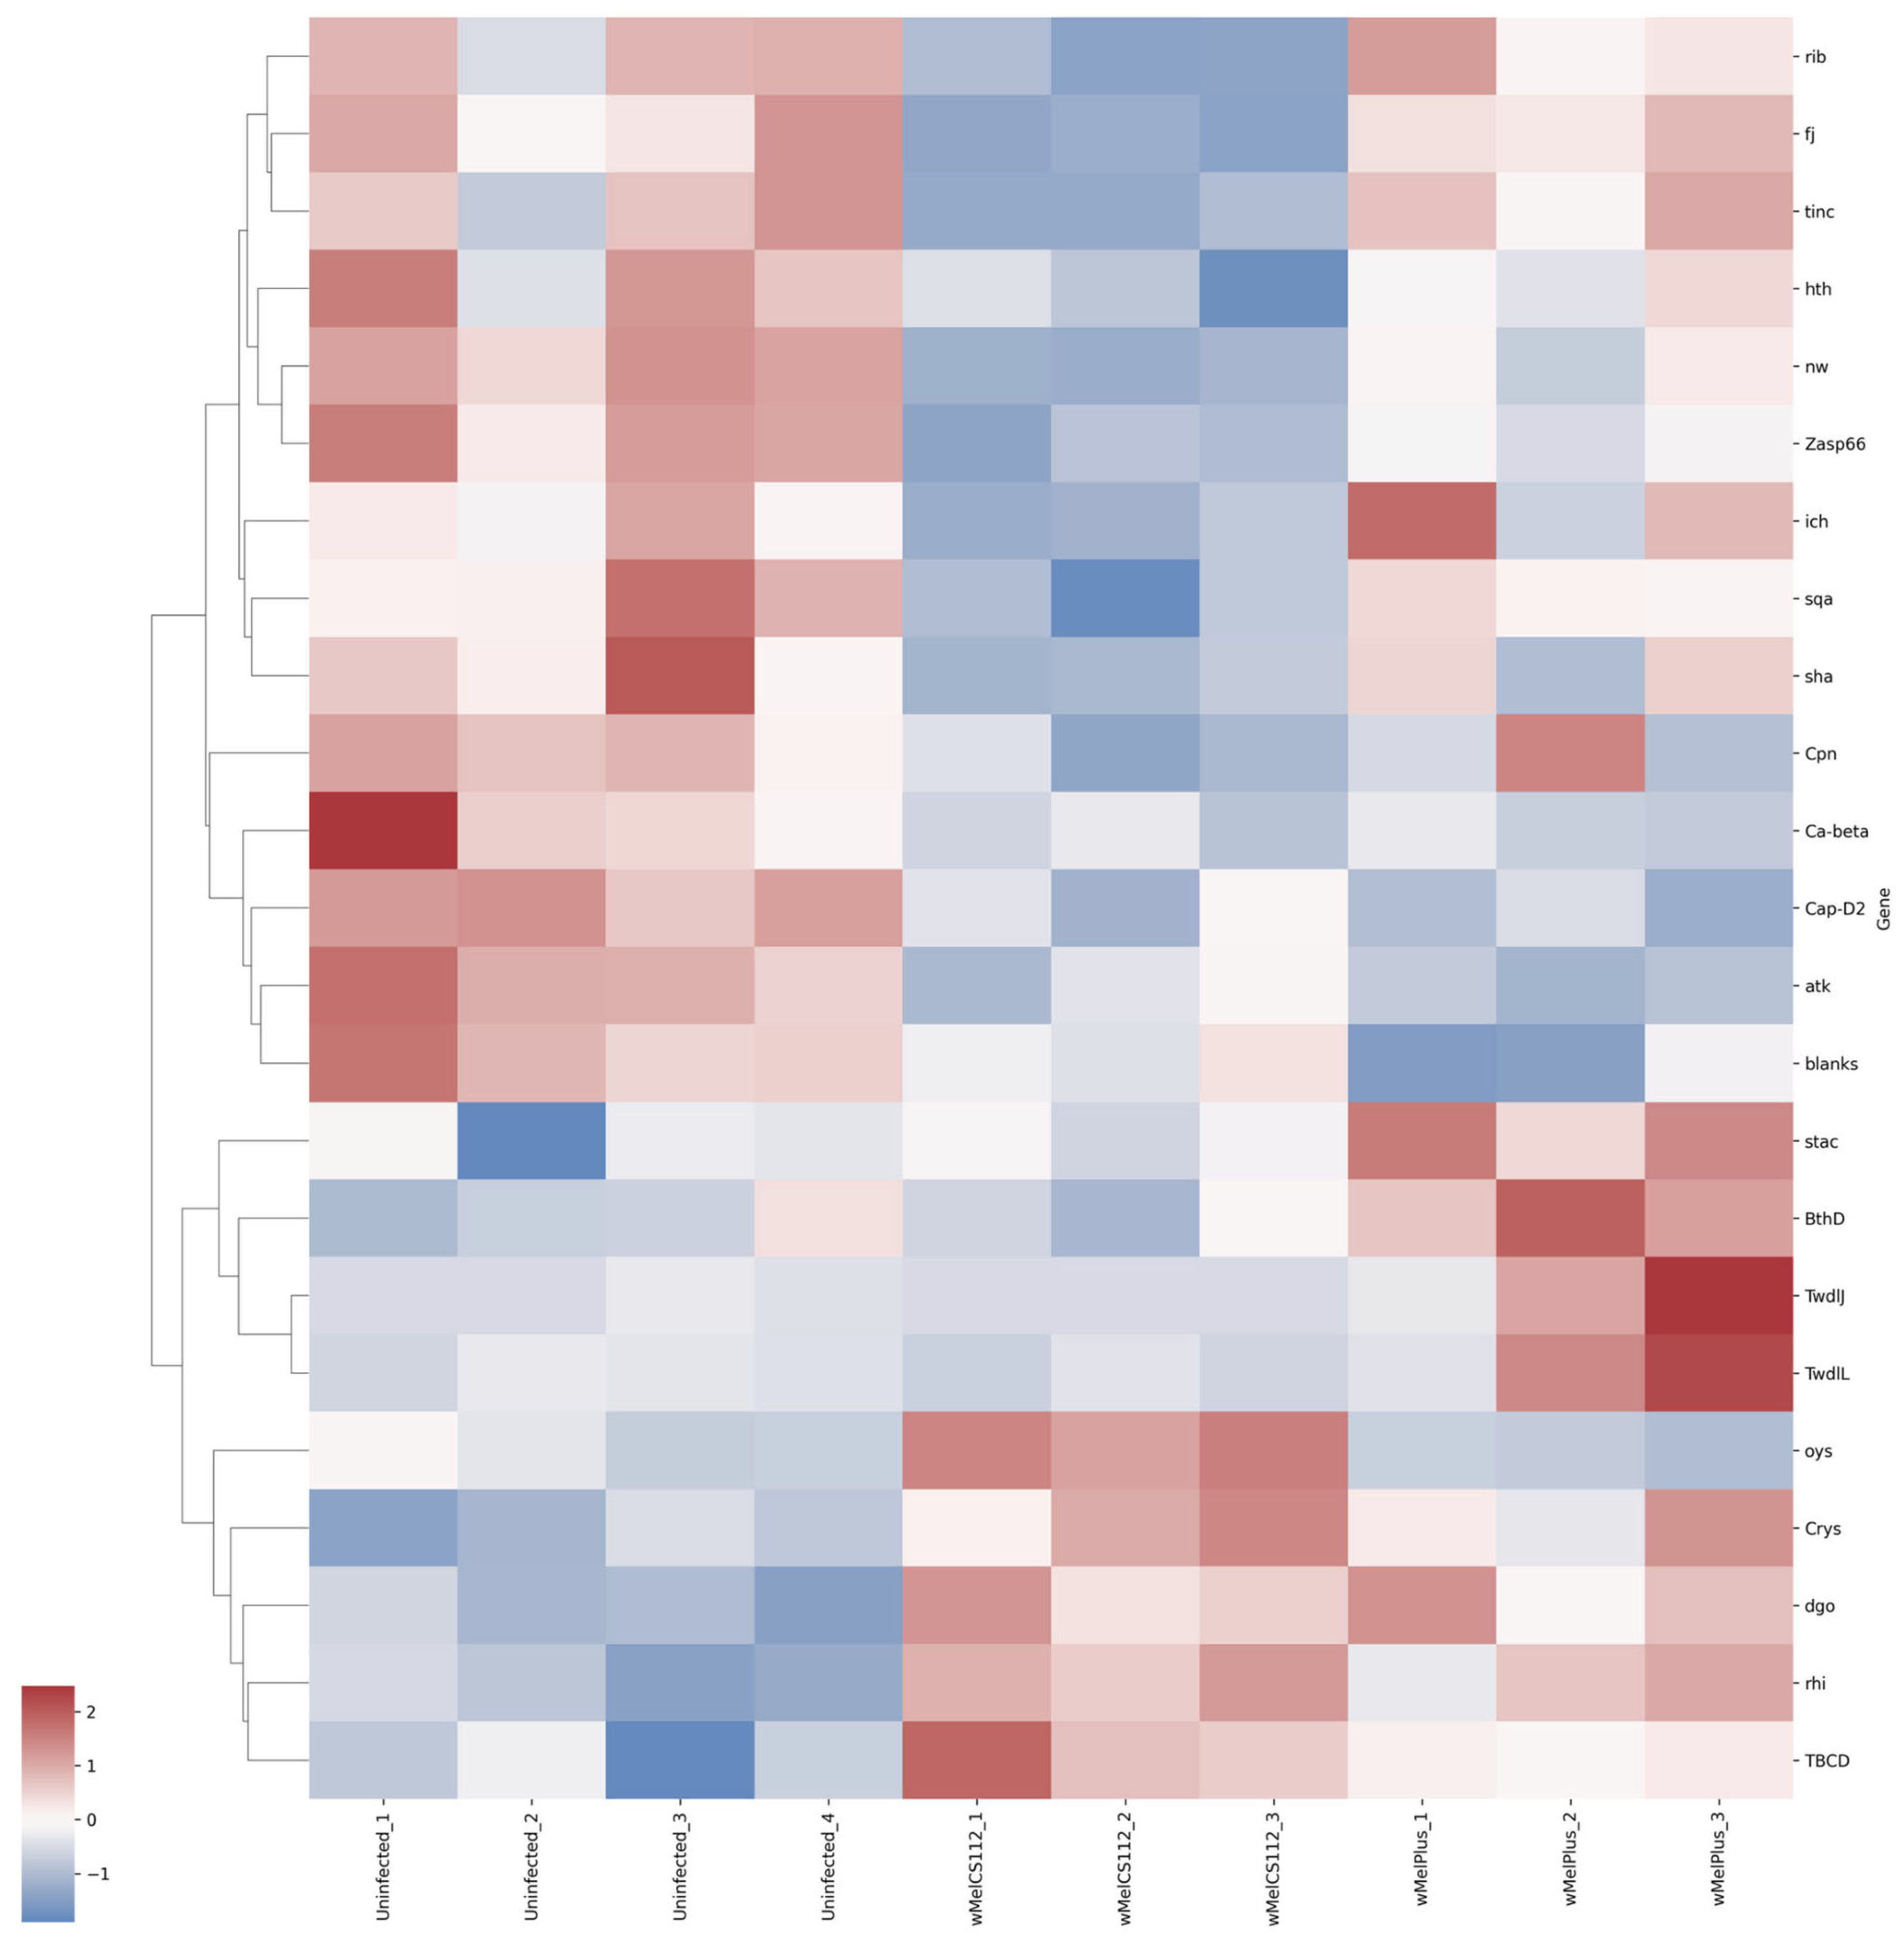
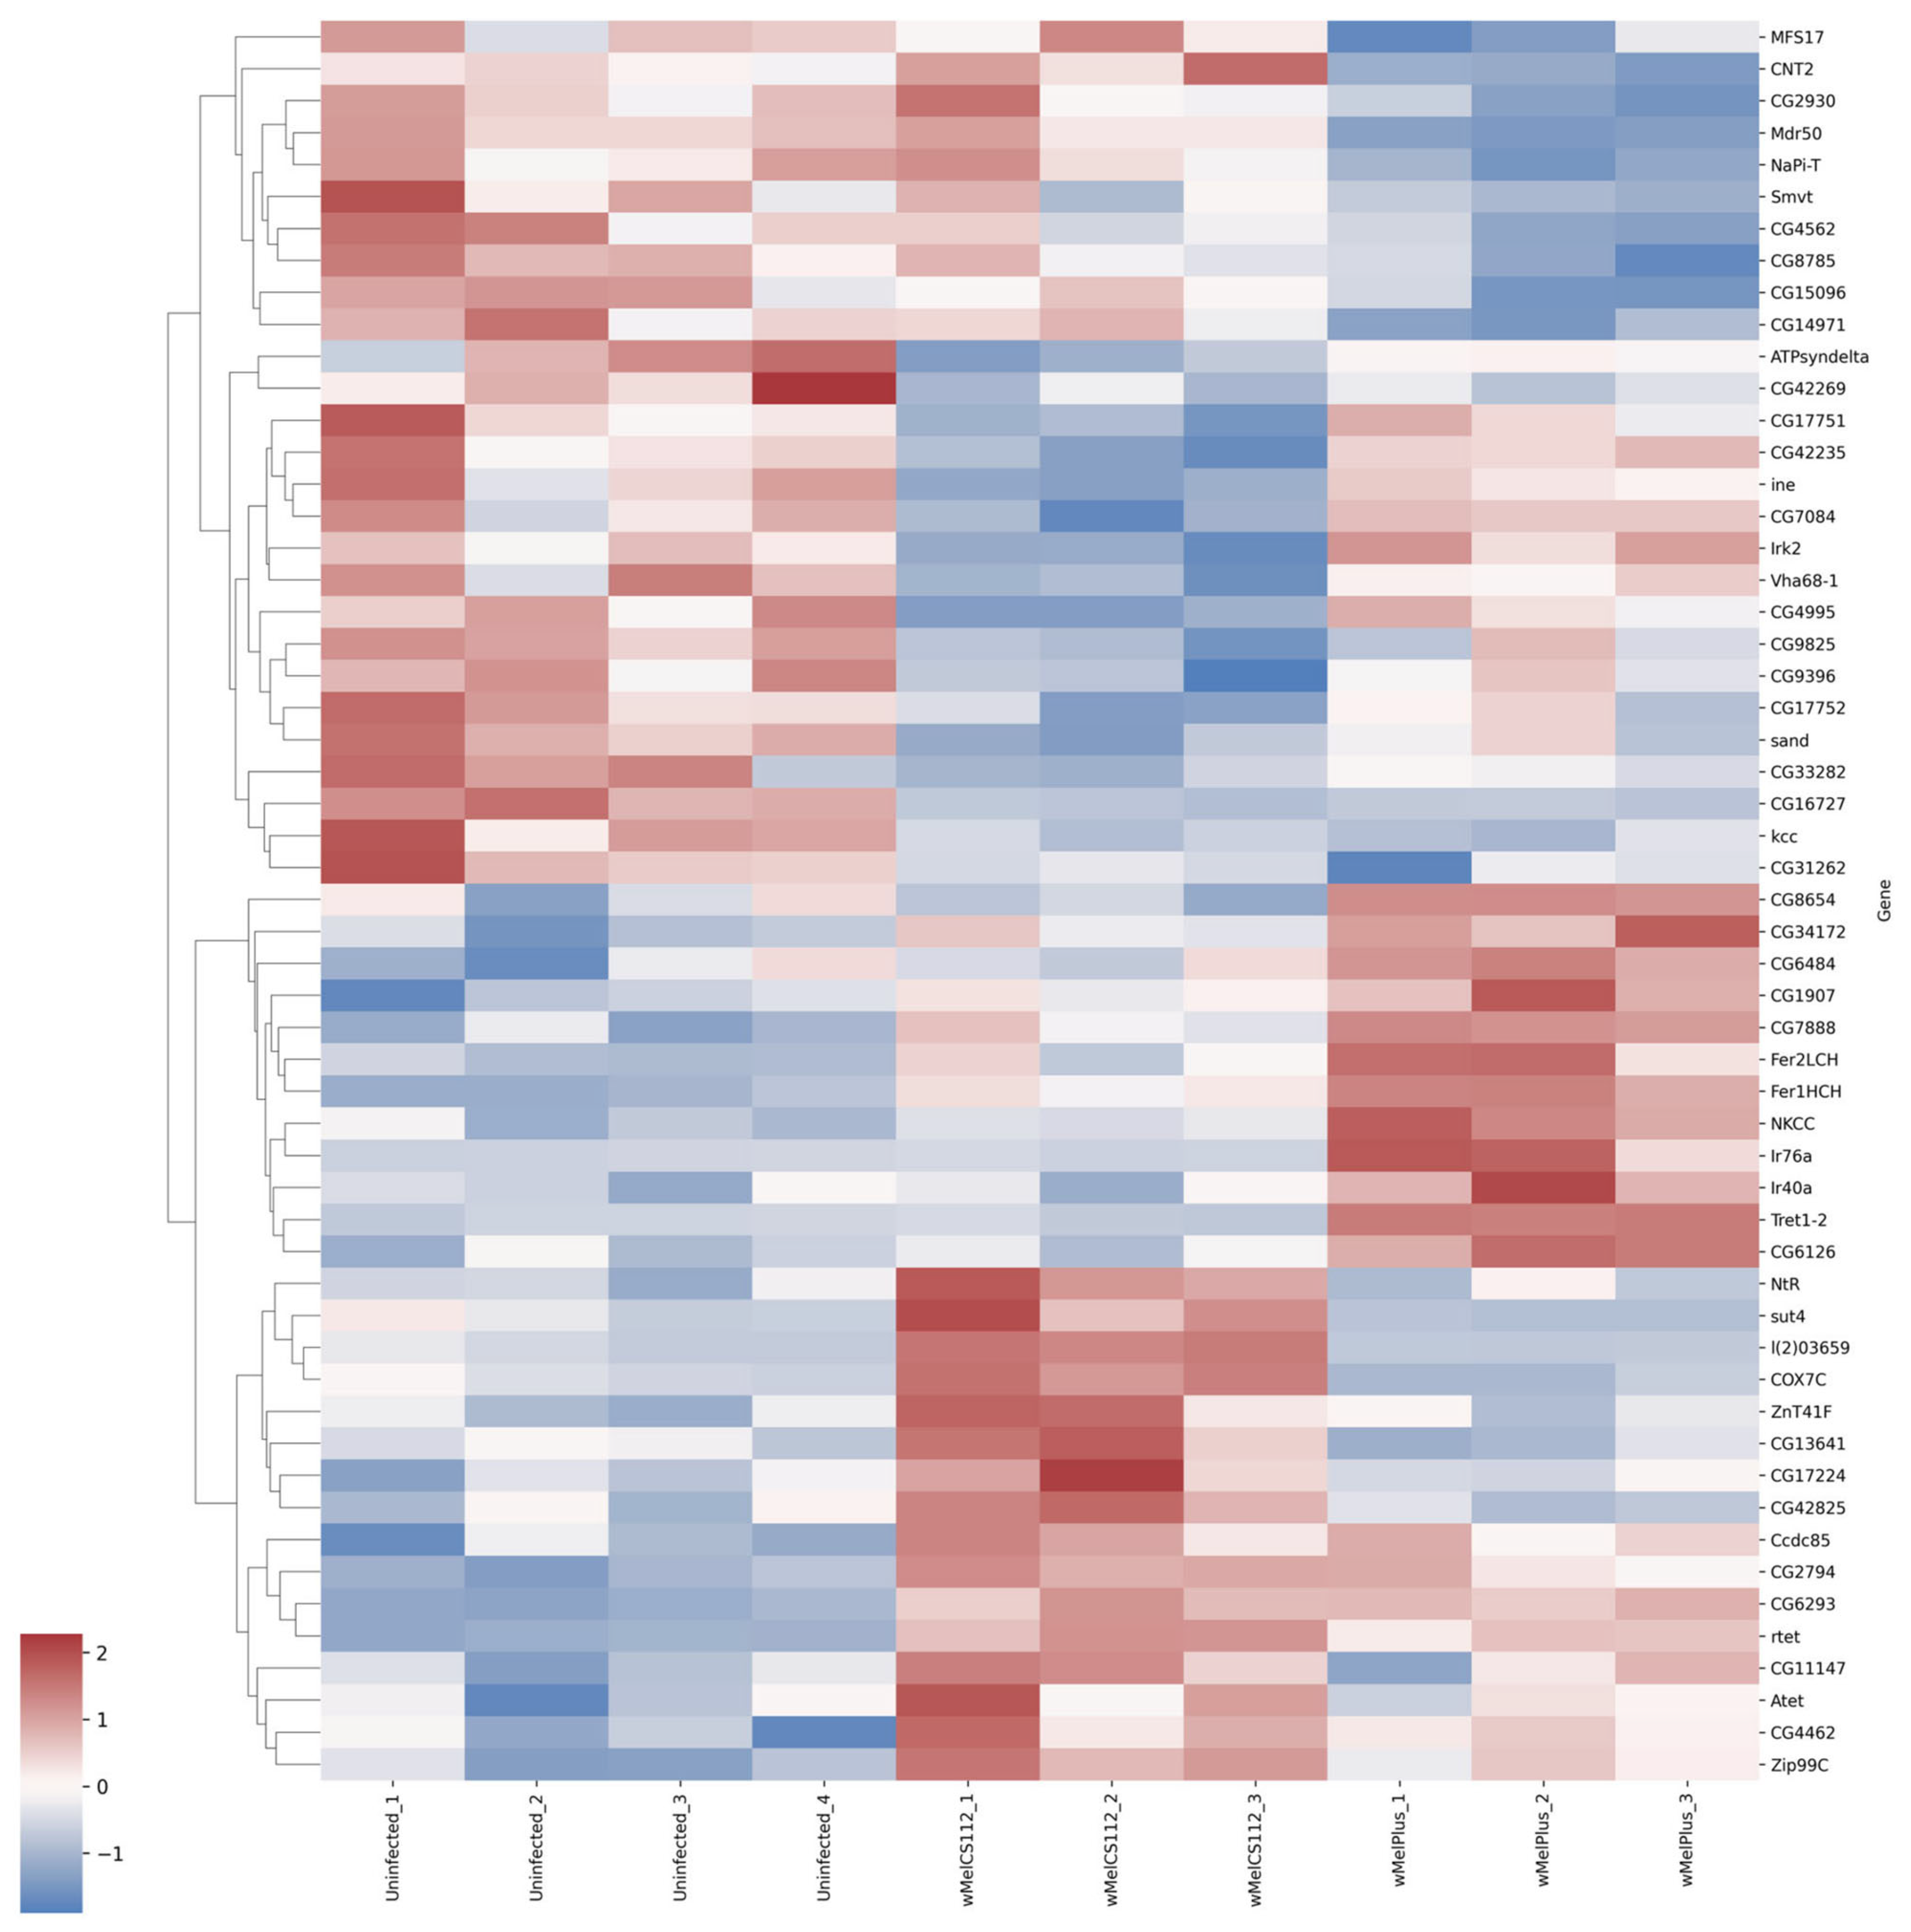
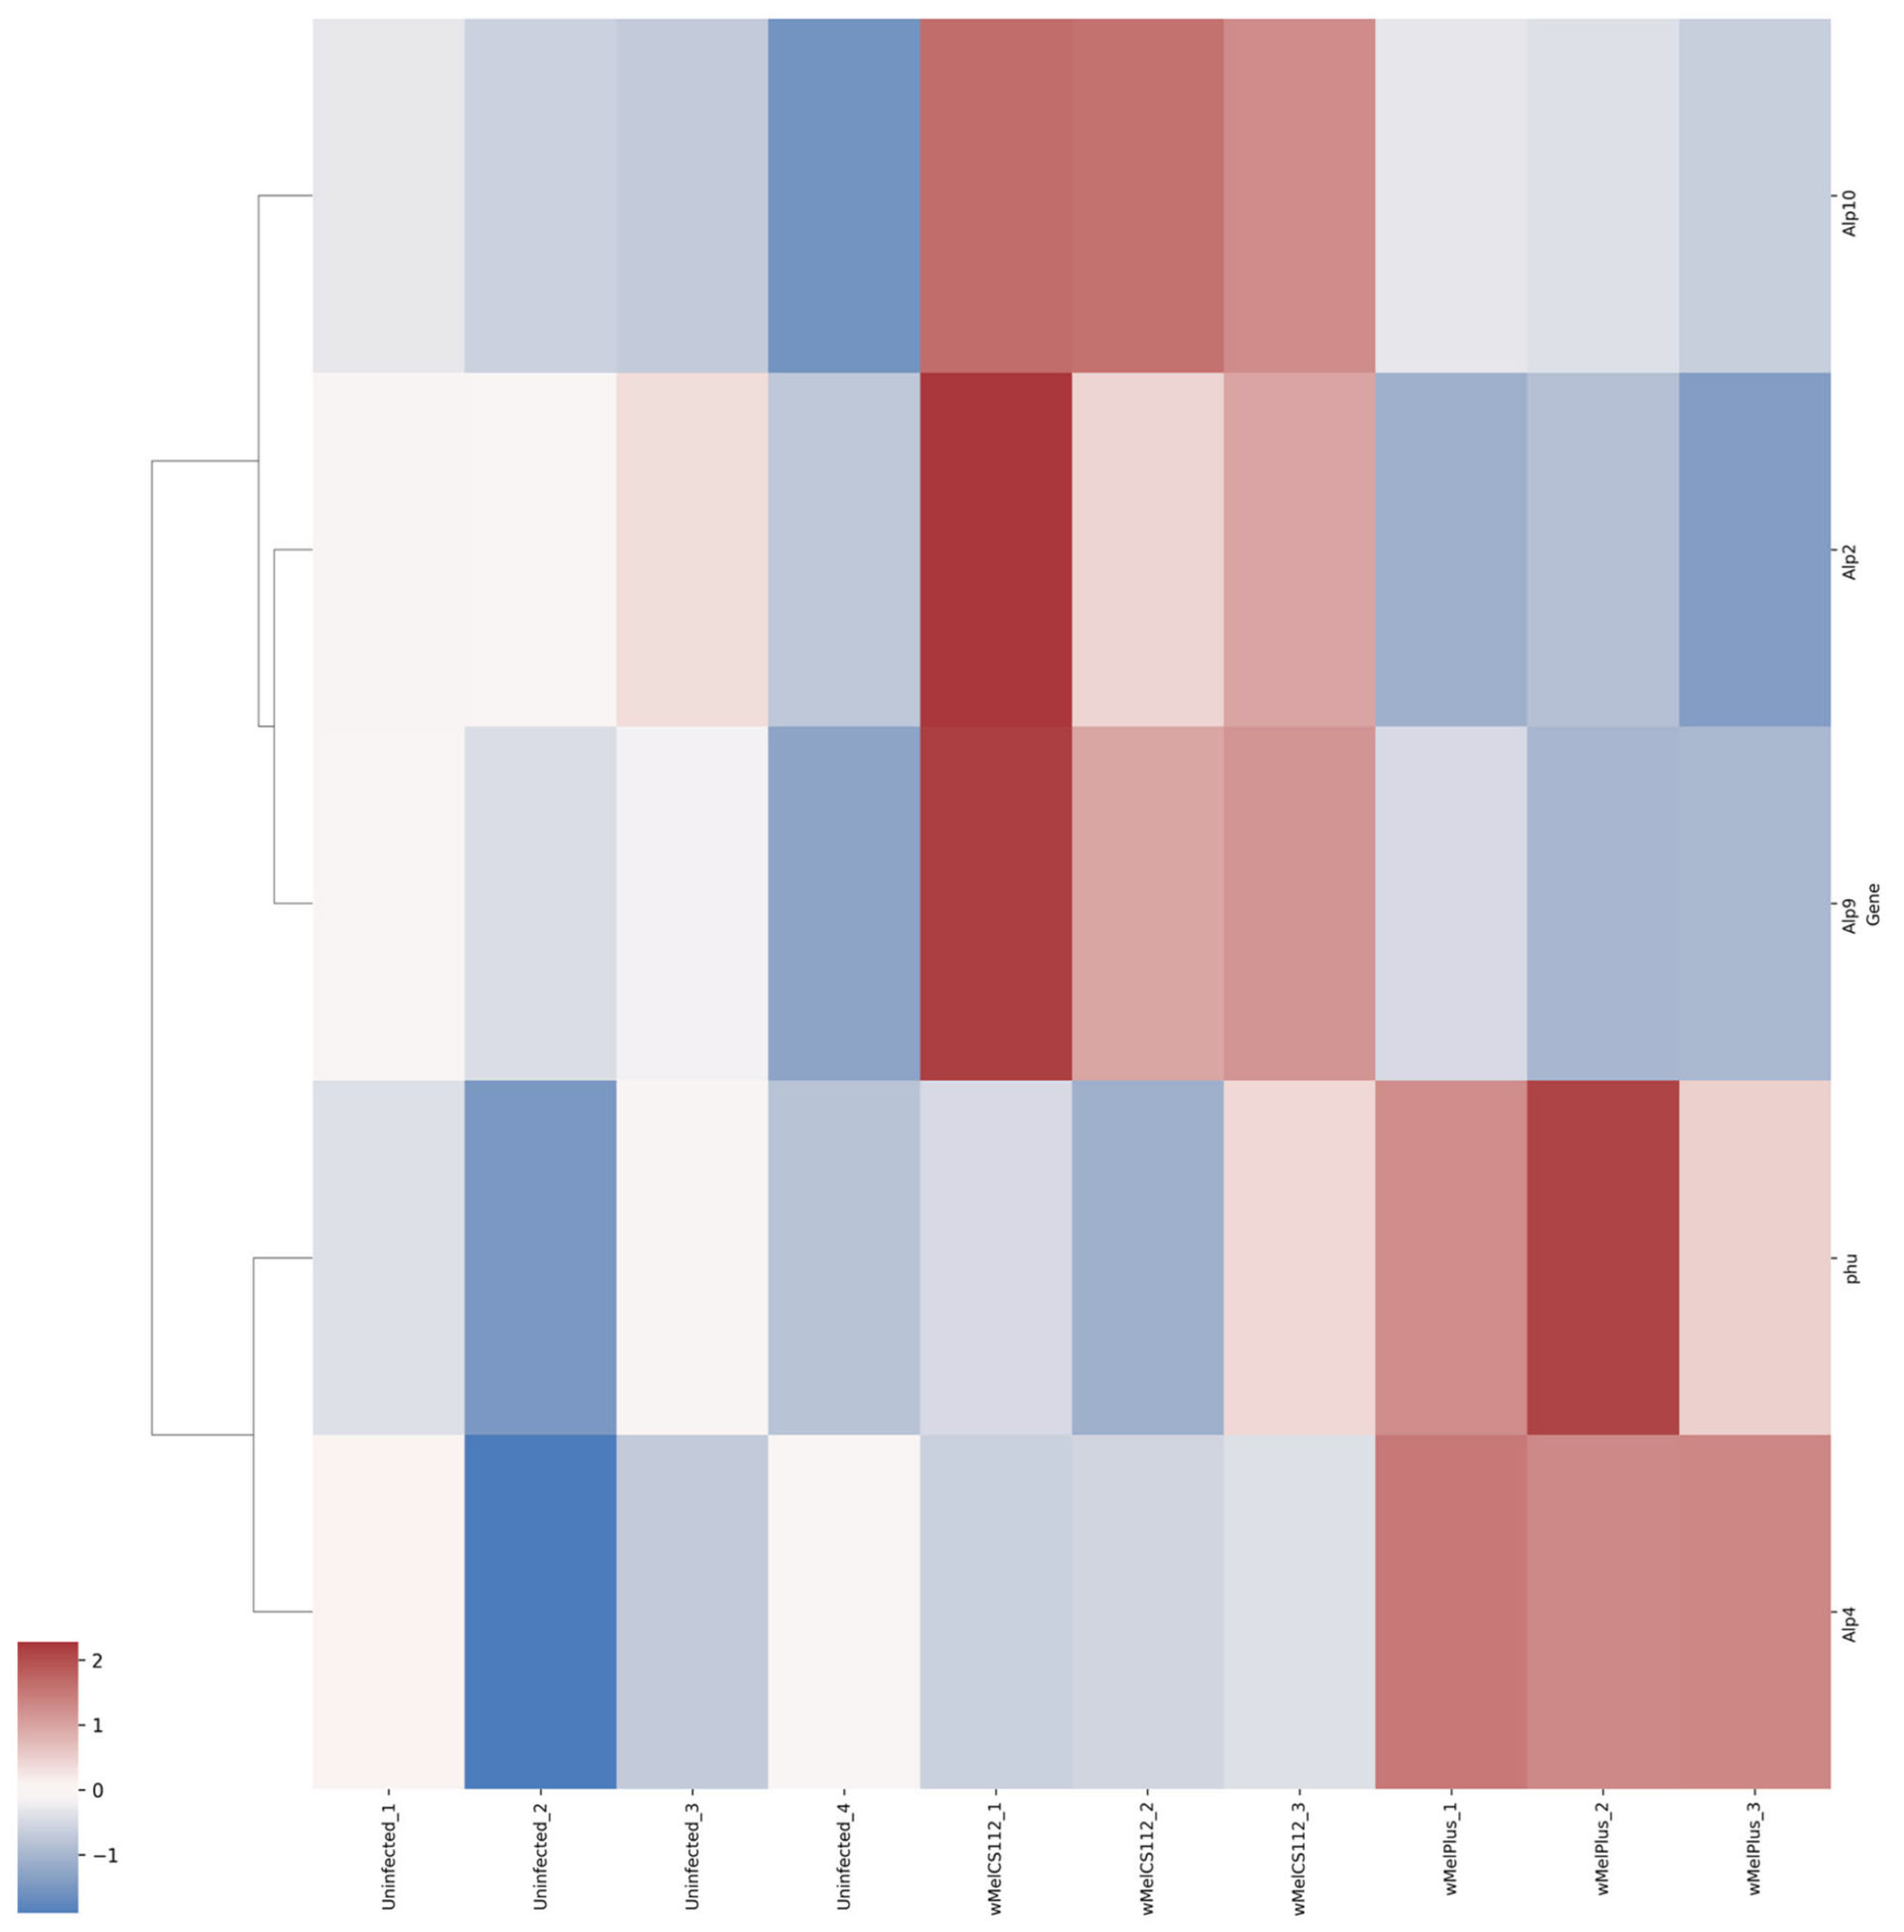
| Functional Group | Relative Expression Level | Strain | Gene |
|---|---|---|---|
| Oxidation–reduction process | Upregulated | Both | rhi, Cyp6a13, Cyp6a14, TBCD, Crys, dgo |
| wMelCS112 | PPO1, Irc, Fatp3, oys, Fad2 | ||
| wMelPlus | Prx2540-1 | ||
| Downregulated | Both | Cyp6d2, atk, Cap-D2, Cyp6a8, Cpn | |
| wMelCS112 | ich, sha, sqa, nw, Zasp66, ninaG, Cyp309a2, rib, fj, tinc, hth | ||
| wMelPlus | Uro, PH4alphaEFB | ||
| Carbohydrate metabolism and transportation | Upregulated | Both | Mal-A2, Mal-A6, Mal-A1, Ugt35A1, Ugt36E1 |
| wMelCS112 | Mal-A7, Amy-p, Hml, LManI, LManII, LManV, LManVI, Cht4, Ugt301D1 | ||
| wMelPlus | Cht10, Gba1a | ||
| Downregulated | Both | Cht2, lectin-33A, Ugt35C1, Ugt302K1, fbp, Est-6 | |
| Transmembrane transport | Upregulated | Both | rtet, Atet, Zip99C |
| wMelCS112 | Fer1HCH, Ir40a, Tret1-2, NKCC, Ir76a | ||
| wMelPlus | NtR, sut4, l(2)03659, COX7C | ||
| Downregulated | Both | kcc | |
| wMelCS112 | Irk2, ine, sand | ||
| wMelPlus | Mdr50, NaPi-T, Smvt | ||
| Alkaline phosphatases | Upregulated | wMelCS112 | Alp2, Alp9, Alp10 |
| wMelPlus | Phu, Alp4 | ||
| Response to stress | Upregulated | Both | BomBC2, BomT2 |
| wMelPlus | CrzR | ||
| Downregulated | Both | TotA, TotC, TotX |
| Relative Expression Level | Strain | Gene | Subgroup |
|---|---|---|---|
| Upregulated | Both | rin, TBCD, dgo, gkt | Establishment or maintenance of cell polarity |
| vls, rhi, rin, rasp, r2d2, sima | Oogenesis | ||
| Crys | Structural constituent of eye lens | ||
| rhi, rin, rasp, r2d2, RhoGEF64C, dgo, Hph | Epithelium development | ||
| wMelCS112 | Egr | Cytokine receptor binding | |
| lectin-37Da, lectin-37Db | Galactose binding | ||
| oys | Lysophospholipid acyltransferase activity | ||
| Invadolysin | Metalloendopeptidase activity | ||
| Crim, egr | Other molecular function | ||
| wMelPlus | TwdlL, TwdlJ | Structural constituent of chitin-based cuticle | |
| Loxl1 | Cargo receptor activity | ||
| Lsp2 | Nutrient reservoir activity | ||
| stac | Cation binding | ||
| Downregulated | Both | ft, sns, stan, plum, otk2 | Cell adhesion molecule binding |
| Idgf3, Idgf2 | Chitinase activity | ||
| D, hth, nerfin-1, Oli, ab | DNA-binding transcription factor activity | ||
| blanks | Double-stranded RNA adenosine deaminase activity | ||
| sqa | Myosin light chain kinase activity | ||
| spz6 | Signaling receptor binding | ||
| slo | Calcium activated cation channel activity | ||
| Hdc | Carboxylyase activity | ||
| Zasp66 | Actinin binding | ||
| Ca-β, Cap-D2, beat-VII, atk, wkd, MFS14, cv-d, neo, sha, mas, nw | Other molecular function | ||
| wMelCS112 | Irk2 | Inward rectifier potassium channel activity | |
| bves | CAMP binding | ||
| ine | Small molecule sensor activity | ||
| pnt, ich | DNA-binding transcription activator activity | ||
| Tig | Integrin binding | ||
| Lectin-galC1 | Galactose binding | ||
| fj | Wnt-protein binding |
| Relative Expression Level | Strain | Gene | Subgroup |
|---|---|---|---|
| Upregulated | Both | phr6-4 | Deoxyribodipyrimidine photolyase activity |
| Vm32E | Structural constituent of vitelline membrane | ||
| sbr | Protein N-terminus binding | ||
| lok | Tau-protein kinase activity | ||
| Bace | Aspartic-type endopeptidase activity | ||
| rasp | Palmitoyltransferase activity | ||
| Jon44E | Endopeptidase activity | ||
| tobi | Hydrolase activity, hydrolyzing O-glycosyl compounds | ||
| Obp99b | Odorant binding | ||
| Vm32E | Other molecular function | ||
| wMelCS112 | Nepl21, Nep6 | Metalloendopeptidase activity | |
| Amy-p | Alpha-amylase activity | ||
| egr | Tumor necrosis factor receptor binding | ||
| Agpat2 | 1-acylglycerol-3-phosphate O-acyltransferase activity | ||
| Myd88 | Toll binding | ||
| lectin-37Da | Galactose binding | ||
| Phae1 | Catalytic activity, acting on a protein | ||
| DnaJ-H | Unfolded protein binding | ||
| NimC1, Cul6, Agpat2, BomBc1, Hml | Other molecular function | ||
| wMelPlus | Gasp, obst-A, Cda4, verm | Chitin binding | |
| epsilonTry, Jon66Ci, Jon66Cii, Jon99Fi, Nepl11, Psa | Peptidase activity | ||
| Pdk, Gasp, obst-A, bves, Cda4, verm, hll | Carbohydrate derivative binding | ||
| Lsp2 | Nutrient reservoir activity | ||
| yellow-g2, yellow-g | Isomerase activity | ||
| Down regulated | Both | neo, Muc12Ea, Muc30E, Muc68D, | Extracellular matrix structural constituent |
| LysP, mas, Nepl3, Jhedup, Jon65Aii, mag, Sirt6, yip7, PGRP-SC2, PGRP-SC1a, Cda5, Send2 | Hydrolase activity | ||
| Npc2d, Npc2f | Steroid binding | ||
| Lectin-galC1 | Galactose binding | ||
| tn | Translation repressor activity | ||
| Cp16, Clk, Ag5r2, Obp56h | Other molecular function | ||
| wMelCS112 | Pdk, Gasp, Vajk1, obst-A, bves, Cda4, verm, hll | Carbohydrate derivative binding | |
| spz6 | Toll binding | ||
| Jon66Cii, Nepl11 | Endopeptidase activity | ||
| Obp83a, TpnC73F, ImpE2 | Other molecular function | ||
| wMelPlus | Ser8, Jon65Ai, Jon99Fii, Sp7, lambdaTry, ome | Serine-type peptidase activity | |
| CAH2 | Carbonate dehydratase activity | ||
| fon | Other molecular function |
| Gene Name | Forward | Reverse |
|---|---|---|
| TotA | AATTCTTCAACTGCTCTTATGTGCT | CAGCAATTCTAAGGTTGTCAGC |
| TotC | CAGTTTGTCTTAAACCAGTGCTC | CAGATTCCCTTTCCTCGTCAG |
| Ugt35C | CAGACGAGATGATGAGTTTGCT | ACCAGATCGAAAGTTTCTCCC |
| CrzR | AATCCGGACAAAAGGCTGGG | AGGTGGAAGGCACCGTAGAT |
| lectin-33A | GAGTCGGAAACAAGTGCTACC | CGTGGTTGTGAGGAGTTTGTC |
| β-Tubulin | TGTCGCGTGTGAAACACTTC | AGCAGGCGTTTCCAATCTG |
| Actin 5C | GCGCCCTTACTCTTTCACCA | ATGTCACGGACGATTTCACG |
Disclaimer/Publisher’s Note: The statements, opinions and data contained in all publications are solely those of the individual author(s) and contributor(s) and not of MDPI and/or the editor(s). MDPI and/or the editor(s) disclaim responsibility for any injury to people or property resulting from any ideas, methods, instructions or products referred to in the content. |
© 2023 by the authors. Licensee MDPI, Basel, Switzerland. This article is an open access article distributed under the terms and conditions of the Creative Commons Attribution (CC BY) license (https://creativecommons.org/licenses/by/4.0/).
Share and Cite
Gruntenko, N.E.; Deryuzhenko, M.A.; Andreenkova, O.V.; Shishkina, O.D.; Bobrovskikh, M.A.; Shatskaya, N.V.; Vasiliev, G.V. Drosophila melanogaster Transcriptome Response to Different Wolbachia Strains. Int. J. Mol. Sci. 2023, 24, 17411. https://doi.org/10.3390/ijms242417411
Gruntenko NE, Deryuzhenko MA, Andreenkova OV, Shishkina OD, Bobrovskikh MA, Shatskaya NV, Vasiliev GV. Drosophila melanogaster Transcriptome Response to Different Wolbachia Strains. International Journal of Molecular Sciences. 2023; 24(24):17411. https://doi.org/10.3390/ijms242417411
Chicago/Turabian StyleGruntenko, Nataly E., Maksim A. Deryuzhenko, Olga V. Andreenkova, Olga D. Shishkina, Margarita A. Bobrovskikh, Natalja V. Shatskaya, and Gennady V. Vasiliev. 2023. "Drosophila melanogaster Transcriptome Response to Different Wolbachia Strains" International Journal of Molecular Sciences 24, no. 24: 17411. https://doi.org/10.3390/ijms242417411